
95% of researchers rate our articles as excellent or good
Learn more about the work of our research integrity team to safeguard the quality of each article we publish.
Find out more
ORIGINAL RESEARCH article
Front. Sustain. Food Syst. , 04 April 2023
Sec. Land, Livelihoods and Food Security
Volume 7 - 2023 | https://doi.org/10.3389/fsufs.2023.1137526
This article is part of the Research Topic Land, Livelihood and Food Security in A Just Energy Transition View all 13 articles
 Zdeňka Gebeltová1
 Pavlína Hálová1
 Karel Malec1
 Klára Bartoňová2
 Vojtěch Blažek3
 Mansoor Maitah1*Robert Koželský4
 Joseph Phiri1
 Seth Nana Kwame Appiah-Kubi1Karel Tomšík1
 Lucie Severová5Jiŕí Marušiak1
Introduction: Since 2005, Russia has established a stable position in Egypt's wheat imports, and after 2016, it became the largest global wheat exporter. The shift in Russian grain production has visibly affected wheat export destinations in favor of developing countries. This paper identifies the main determinants of wheat trade in Egypt concerning the primary risks associated with the war in Ukraine.
Methods: The paper utilizes time series analysis, index analysis, and an econometric model to define the statistical relationship between the quantity of wheat imported into Egypt and population development, wheat price, and wheat production.
Results: Despite increasing wheat production growth rates (1.9% p.a. over 2000–2020) and a growing population (2.01% p.a.), Egypt is unable to reduce its import dependence below 50% of total consumption. Undernourishment in Egypt remains at 5.2%–5.4% of the population. The econometric model shows that variables describing the evolution of production, population, and prices are statistically significant in relation to wheat imports. Egypt's wheat imports continue to increase even with rising prices, which is typical for developing countries. The war in Ukraine and associated commodity price increases have far-reaching implications for Africa's food security and supply systems.
Discussion: Egypt's vulnerability to external influences, such as climate change, migration, rising commodity prices, and population growth, exacerbates the situation. Most African countries, including Egypt, struggle with the economic and social impacts of the COVID-19 pandemic. They also face rising food and energy prices, conflicts between the world's largest food producers, and increasing poverty rates. The research findings confirm that Egypt is among the highly vulnerable countries due to the war in Ukraine and the disruption of agricultural supply chains.
Developing countries are still bearing the consequences of the external shock associated with COVID-19. Another major threat is the rapidly rising food and energy prices. Does the current war in Ukraine affect food security in Egypt?
There is possible to find analogy with the gap between food supply and demand that arose in the region during the oil boom of the 1970s. Higher incomes combined with steadily increasing populations generated substantial increases in food demand that could be satisfied only by increasing food imports. Ensuring food security by providing access to food of the right quantity and quality to every child and adult for a productive and healthy life for the over 1.4 billion Africans is one of the biggest challenges of the 21st century for Africa, a continent characterized by high population growth rate of up to 3% per annum (in some African countries), inefficient food production systems, weak supply chains and pervasive poverty and food insecurity (Canagarajah and Thomas, 2001; Aworh, 2020).
In many parts of sub-Saharan Africa (SSA), nutritional diseases such as protein-energy malnutrition in children and micronutrient deficiencies (the hidden hunger), especially vitamin A, iodine, iron and zinc deficiencies, are still prevalent exerting devastating effects on productivity, intellectual development and maternal and infant health (Aworh, 2015).
According to a study by Abdelmageed et al. (2019), wheat yields in Egypt increased 5.8 times (~6.7 million tons) between 1961 and 2017 due to new technology and better planting methods, such as the raised-bed method or farm irrigation systems. However, Egypt's wheat production is insufficient, and the country has to import to meet its wheat demand. According to Alwang et al. (2018), mechanized raised-bed wheat production can increase productivity by 25% through higher yields, 50% lower seed costs, and 25% reduction in water use. According to the authors, this technology can reduce wheat imports by 50% in 2025 and reduce dependence on international commodity markets. However, according to Yigezu et al. (2021b), the use of the raised-bed method is not well-documented in Egypt, although the effects are clearly beneficial, especially in terms of the economic efficiency of cultivation. In addition to changing the cultivation technology, it is also possible to expand the range of irrigated plots. El-sayed et al. (2021) offer a solution in the area of saltwater irrigation. In a yield test, saline water reduced grain yield by only 8.5%−11.0% compared to non-saline water. Water scarcity is also often associated with water losses due to wastage of food—wheat (ElFetyany et al., 2021). Yigezu et al. (2021a) estimate that ~20.62% of the total wheat supply in Egypt is lost or wasted from domestic production and imports (2017/2018 data). This is enough food for 21 million people. According to Anriquez et al. (2021), there are economically significant wheat losses in Egypt and Tunisia, not only at the farm level (harvesting equipment) but also at the wholesale level. Wahba et al. (2018) focused on the study of the national water footprint (NWF) in Egypt. Egypt saves 8% of its MWF due to wheat imports. But on the other hand, it exports 12% of its total available freshwater resources (in terms of feed exports, alfalfa, paddy rice…).
Climate change will directly affect the total crop area in the world, not excluding Egypt. According to IFAD (2022) climate change will have a major impact on reducing yields. By 2030 (medium risk estimate, full irrigation) the largest yield reductions are projected for maize, peas, and wheat (−4.33 to −2.08%). Yields may increase in the short term for maize, but not for wheat. In the case of wheat cultivation without irrigation, the situation would be critical. Changes in crop rotation may also respond to climate change. According to Omar et al. (2021), farmers should focus on fixing the rice and orchard cropping areas and providing half of the population with lentils, maize, onions, vegetables, milk, and meat. Gohar et al. (2021) make a good point, however, that improvements in food security would be associated with net benefits to food consumers, while they could be associated with some negative impacts on food producers. These vary by region and crop type. Abdelkader et al. (2018) also see solutions to Egypt's water and food problem in the areas of education and health and awareness programs aimed at reducing population growth.
Violent conflict is a major cause of acute food crises. In 2021, at least 155 million people in 10 countries suffered from severe food shortages. Eight of these countries were in armed conflict. The study shows that, on average, a 1% decline in global wheat trade could increase the price of wheat to producers by 1.1%. Increased producer prices could reduce annual per capita wheat consumption, daily calorie intake and protein intake in selected countries (Mottaleb et al., 2022). Countries in Africa often import most of their wheat from Russia and Ukraine. E.g., Benin, Somalia (100%), Egypt (82%), Sudan (75%), DR Congo (69%), Senegal (66%), Tanzania (64%) (UNCAD; Statista, 2022). The crisis in Ukraine will also hit the next planting season hard, especially as farmers cannot afford to buy fertilizers. Fertilizer prices have increased by almost 30% since the beginning of 2022, after an 80% increase last year. The rising prices are due to a combination of factors, including soaring input costs, supply disruptions caused by sanctions (Belarus and Russia) and export restrictions (China) (World Bank, 2022a,b). The effects of the conflict in Ukraine on wheat markets are addressed, for example, by Bentley et al. (2022) or Lo et al. (2022).
Unfavorable natural conditions alone result in malnutrition and serious health problems for people in developing countries (this does not even require war conflicts in the world, pandemic COVID-19). The results of Khatab (2010) show that rural areas in the Nile Delta and some other provenances in Lower Egypt are associated with malnutrition in children under 5 years of age. Abdelaziz and Hegazy (2012) on the other hand, see the problem as inappropriate infant and young child feeding practices, large family size and underutilization of health-related services. In contrast, Boysen et al. (2019) warn of the prevalence of obesity in sub-Saharan Africa (SSA). This is due to the consumption of highly processed foods. The development prospects of this region (SSA) make markets for these foods attractive.
Developing countries are highly vulnerable. In particular, the size of the population, the share of agriculture in GDP, fluctuations in agricultural production, displacement due to natural disasters, and the instability of exports or imports of goods and services put Egypt at risk. Thus, Egypt's economy may be seriously affected by a crisis caused precisely by external factors (United Nations: Department of Economics and Social Affairs, 2022).
Socio-economic and climatic migration of the population from North Africa is mainly toward North America and Europe (UNDESA, 2020), while in West Africa it is mainly intra-regional migration (Leal Filho et al., 2022).
Among the serious crises Egypt has faced in the last few decades are water scarcity or the lack of effective solid waste management strategies. However, a major crisis may arise from a shortage of Egyptian oil. The country's oil reserves could be exhausted within the next 15 years. To effectively face these challenges, Egypt should focus on renewable energy technologies and build them into Egypt's current/future energy frameworks (Salah et al., 2022).
Energy poverty is a new growing dimension of inequality in both developed and developing economies. Belaïd and Flambard (2023) trace the link between fuel poverty, income and high housing costs in developing countries. The authors focus primarily on Egypt. Given Egypt's steadily increasing domestic energy demand, the authors recommend increasing the capacity of the energy sector as well as improving the energy efficiency of existing infrastructure. Egypt's domestic fossil fuel resources are finite; new challenges arise in the fossil fuel market after February 2022. Egypt needs to address the energy threat in a consistent but sensitive manner in the area of alternative energy sources precisely in light of the need for increased food self-sufficiency.
The main aim of the paper is to identify the main determinants of foreign wheat trade in Egypt in relation to potential risks arising from the current geopolitical situation.
The econometric model was epmployed to answer following research questions:
RQ1: Are the variables wheat production (PROD) in million tons and wheat consumption in Egypt (CONS), population size in Egypt (POPUL) in million inhabitants, and world wheat price (PRICE) statistically significant variables that affect wheat imports (y) into Egypt?
RQ2: In what direction and with what intensity are wheat imports affected by the selected economic variables?
RQ3: Is there a long-run relationship between the import variable and wheat production?
RQ4: Which variable affects wheat imports the most?
The paper will use time series analysis based on data obtained from FAOSTAT database for the period 1961–2021 (annual wheat production in tons), CME Group (daily wheat prices 1961–2022) and OEC store database (OEC store database, The Observatory of Economic Complexity) for the period 2000–2021 (wheat trade and imports to Egypt). All the data are publicly available according to links in references and are licensed under the Creative Commons Attribution-NonCommercial-Share Alike 3.0 IGO (CC BY-NC-SA 3.0 IGO).
First, a time series analysis of wheat imports and exports in the 2000–2020 time series and in 2020 itself (in terms of both volume and wheat trade actors) was conducted. The focus was on Ukraine and Russia as major wheat exporters, especially to the developing world. The rationale for this choice is that the war crisis in Ukraine risks constraining world wheat supply and poses significant pressure on price developments and may threaten the nutritional situation in some parts of the world (e.g., per capita protein intake). Other factors that will influence the wheat market situation in Egypt are: the nutrition of the population, the share of food expenditure, production technology, irrigation, the vulnerability of the area to climate change, migration, etc.
A mathematical model was used to take a multidimensional view of wheat imports into Egypt. Econometric models are very useful precisely for finding short- or long-term relationships between economic variables. They give valuable information once the verification conditions are met. In particular, a large data base of 60 years is a prerequisite for relevant results.
Data for econometric model were obtained from the FAOSTAT database for Egypt, period 1961–2021. Variable x1—Egypt population (No. of inhabitants) were drawn from the category “population and employment (total population—both sexes).” From the “production” category (subcategory Crops and livestock products), data were taken for variable x2—wheat production (in tons). The “food balance” category (subcategory wheat and products), data for variable x3—wheat consumption (kg/capita/year), and the variable x4—protein supply quantity (g/capita/day) were used. Depended variable Y—import quantity (in tons) data from category “Trade” were used. The TRADE category (subcategory Crops and livestock products) data for variable y—were extracted. The statistical model tested variables x1–x3 with the option to remain in the model, x4 had to be dropped from the model as it was not statistically significant.
In the first part of the modeling, a dynamic model will be estimated to quantify the short-run effects between the selected variables and in the second part, the long-run relationship will be verified by means of cointegration analysis together with the quantification of the VEC model. The procedure is as follows:
1. Testing the stationarity or non-stationarity of all-time series using the ADF (Augmented Dickey–Fuller) test.
2. Determining the degree of integration of the time series used.
3. Estimation and verification of the static model in the form of:
4. In the case of an unverified static model, it will be tested whether it is appropriate to dynamize the model and of what order using the best (minimum) values of the information criteria AIC, BIC, HQC. There will be an evaluation of a dynamic ADL (n, p1, …, pk) model in the form:
where n, the number of lags of the endogenous variable y; p, the number of lags of the exogenous variable x; k, number of explanatory variables; y, endogenous variable; x, exogenous variable; t, number of observations t = 1 … T; γ0, constant; β, parameter of the lagged endogenous variable; γi, parameters of the exogenous variables; ut, random variable.
In the case of non-stationary time series, cointegration is a statistical procedure suitable for answering the question of whether the selected time series are related by a significant statistical relationship. In this paper, the Johansen cointegration test (Johansen, 1988), which is essentially a generalization of the ADF test for multiple variables, will be applied. It is based on an unrestricted vector autoregressive model that is specified in error-correction form.
where: yt is a vector including the model variables that are integrated of order 1 with notation I(1); Π, Γi and Φ are the estimated parameter matrices; Vector Dt is a vector of deterministic elements (e.g., for deriving a constant or trend or artificial variable); Vector vt are the random normally distributed errors and k is the lag chosen based on the minimized information criteria for the vice variables.
The Johansen cointegration test determines the rank (r) of the matrix Π. This matrix can be described as a matrix of long-run parameters. The case where rank r = 0 means that the variables under test are not cointegrated. If, on the other hand, the matrix had full rank r = N, this would mean that all tested series were I(0) and thus stationary. In the case that 0 < r < N, there are r cointegrating vectors between the r series. We find the rank of the matrix Π by using its characteristic roots (eigenvalues). More precisely, the rank of a matrix Π is equal to the number of non-zero eigenvalues. If the variables are not cointegrated, the rank of the matrix will be zero and all eigenvalues will be zero. The Johansen test is based on testing the number of eigenvalues significantly different from zero.
Map outputs (Figures 3–5) are created in ArcGIS PRO 3.0. Data from the EOC database and the “XY to line” tool were used to represent the flows of transported wheat. This tool connects the start and end coordinates. The coordinates are defined as the centroids of individual states. The demarcation of state borders is based on the layer “World Countries (Generalized)” from Living Atlas of the World provided by Esri, which represents generalized boundaries for the countries of the world as of August 2022. This layer's geography was developed by Esri and sourced from the National Geographic Society the U.S. Central Intelligence Agency (The World Factbook) and Garmin International, Inc. It is updated annually as country names or significant borders change. The accompanying string diagram is created in the ArcGIS Insights application and works with the same OEC database. This visualization was chosen for overall better clarity of the map outputs, because the line strength of individual flows in a maps with a large number of elements creates unreadable maps. Column and compound graphs (Figures 1, 2, 6–8) are created in MS Excel. Graph in Figure 9 is processed in R-Studio.
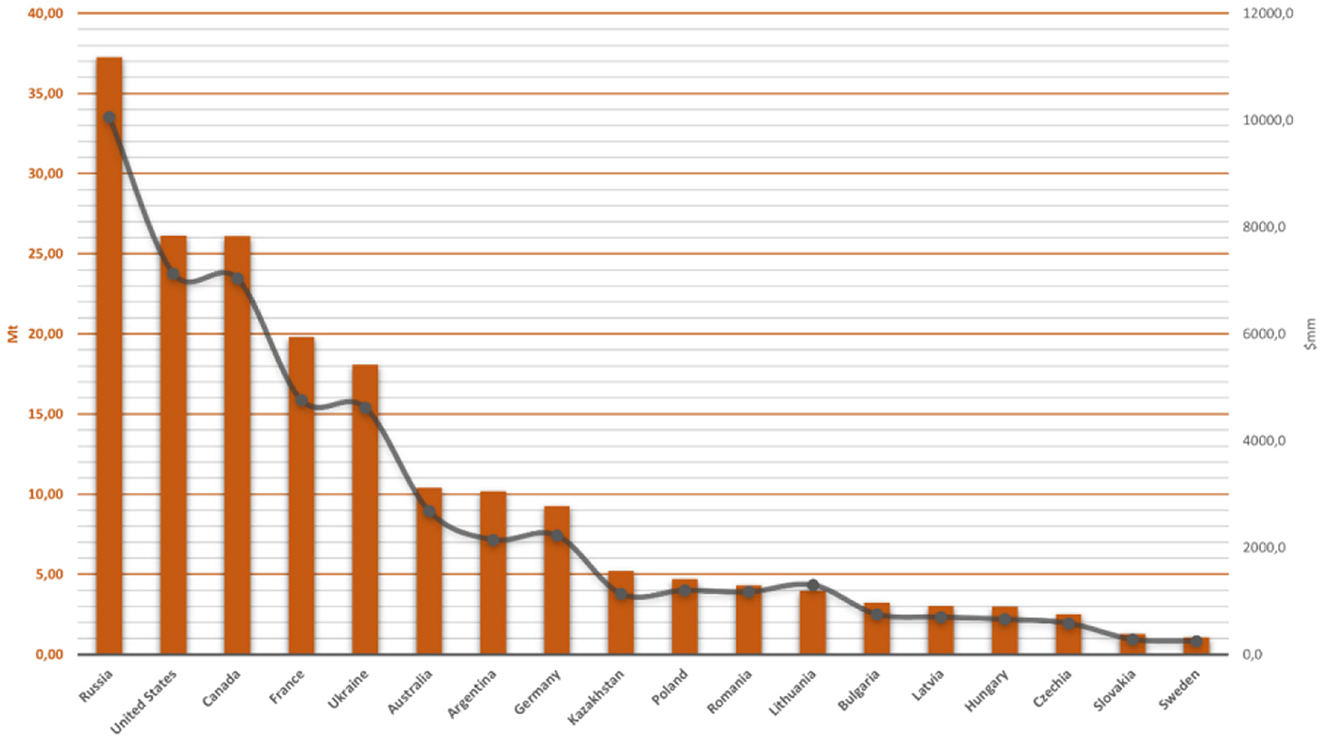
Figure 1. World exporters of wheat 2020 (USD, tons). Source: Food and Agriculture Organization (2000–2020b).
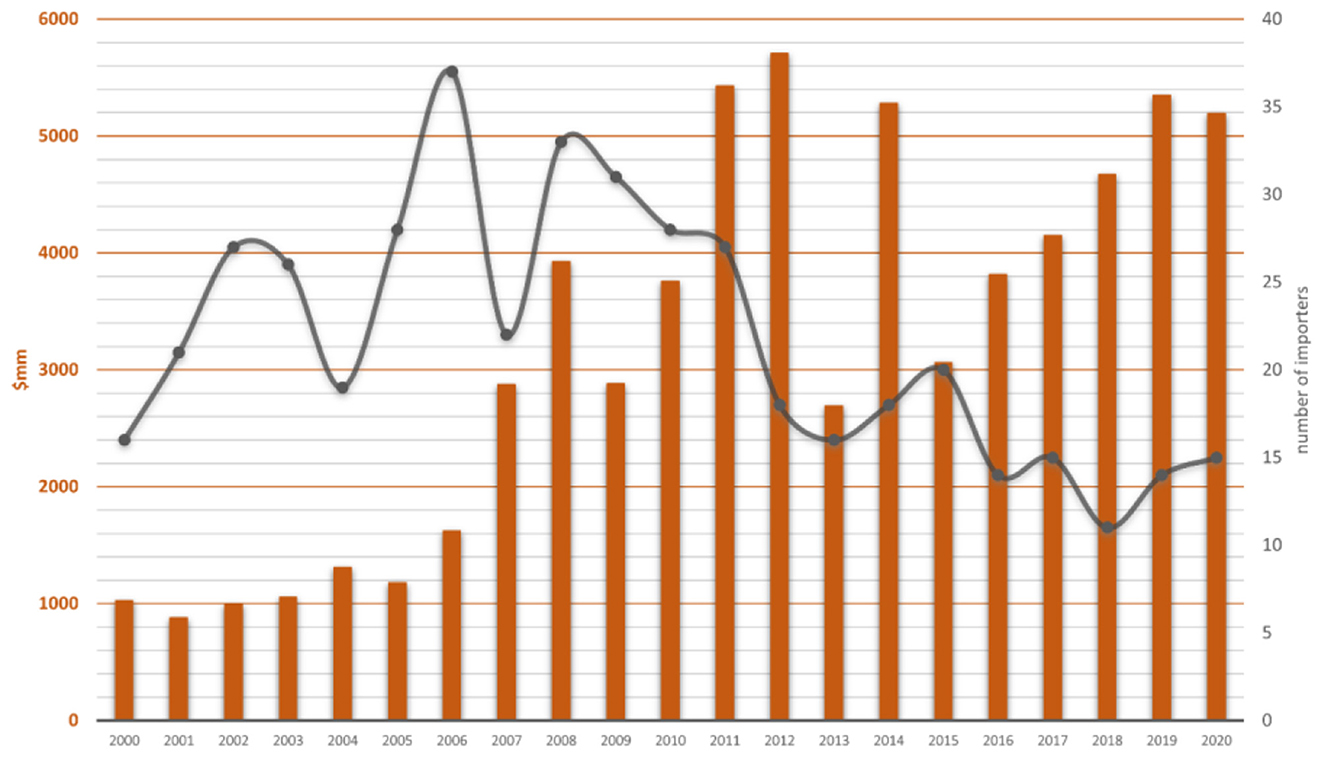
Figure 2. Imports to Egypt (wheat, USD) 2000–2020. Source: Food and Agriculture Organization (2000–2020b).
By In 2020, 198,526,629 tons of wheat exports were traded worldwide (Food and Agriculture Organization, 2022). Russia (18.8% of world wheat exports in tons), the USA (13.16%), Canada (13.15%), France (9.97%), and Ukraine (9.09%) play a significant role in wheat exports (Food and Agriculture Organization, 2022). Russia and Ukraine thus account for about 28% of wheat exports (Figure 1), which are consumed globally in the form of a variety of foodstuffs ranging from bakery products, pasta, starch, animal feed, etc.
As a result of the war in Ukraine, there are complications in the export of the commodity from the areas of its production. There are problems in the domestic logistics of transporting wheat to Ukrainian ports, as well as possible disruption of trade in Russian wheat due to Western sanctions. These sanctions increase, for example, the cost of insurance for transporting Russian wheat. And this concerns not only wheat, but also corn and soybean oil (Mbah and Wasum, 2022; Zhou et al., 2023). But rising prices for these commodities also increase prices for other agricultural commodities, including food products. Even more than developed countries, this phenomenon will affect the situation in developing countries (e.g., Egypt).
Egypt's economy became the second largest in Africa after Nigeria in 2000 and the 30th in the global ranking (World Bank, 2022a,b). Economic growth in recent years was interrupted by the negative effects of the COVID-19 pandemic. Thanks to the government's fiscal measures, the economy soon recovered, and GDP recorded a steady 3.6% growth in 2020 (3.3% in 2021, World Bank, 2022a,b). Agriculture accounts for 23% of GDP (World Bank, 2022a,b). The economics of crop production is based on irrigation. Egypt prefers to improve irrigation efficiency in the Nile Basin, including recycling wastewater (Darwish et al., 2020; El-sayed et al., 2021) desalination plants (Elsaie et al., 2022) and installing additional water pumps and treatment plants (ElFetyany et al., 2021). The Russia-Ukraine conflict threatens the country's food security, as Egypt is one of the largest wheat importers in the region.
The number of wheat suppliers to Egypt has been quite high in the past (25 countries on average, Figure 2). It can be noted that the number of importers and the scale of wheat imports (in USD) to Egypt have stabilized numerically after 2007 and even more so after 2013, where the number of importers reached a value of about 15 countries. Although the higher number of suppliers is complicated in terms of the number of contracts, the low number of exporters with the increasing amount of imported raw material may cause supply problems in case of a shortfall in the country's imports of the commodity. Such as the current conflict in Ukraine.
Russia and Ukraine imported 86.01% of Egypt's total wheat imports (Food and Agriculture Organization, 2022). In 2020, Egypt imported about 2.317534 million tons of wheat from Ukraine (Figure 5) and from Russia about 5.460508 million tons. Other wheat exporting countries to Egypt are France (6.56% of wheat imports), Romania (3.26%) and Australia (2.25%). Other suppliers (e.g., USA, Lithuania, Bulgaria, etc.) accounted for about 2% of wheat imports in kind in 2020. The situation is quite different from the pre-2015 period, when the US was a major supplier (e.g., 2004 = 40.3% of Egypt's wheat imports, 2007 = 19.4%, 2011 = 28.3%, Figure 3). Thus, for a number of years, the US was the largest wheat exporter in the world (Observatory of Economic Complexity, 2020). Prior to 2000, wheat was also commonly imported from the US to Russia (Soviet Union) (Food and Agriculture Organization, 2022).

Figure 3. Top wheat exporters to Egypt, 2020. Source: Authors based on OEC data, 2022.
After the collapse of the USSR in 1991, the government removed barriers to doing business, allowing farmers to penetrate the world market and also invest in agricultural technology (Schierhorn et al., 2014). While the relative market position of traditional wheat exporters has changed (USA, Canada, Argentina), the absolute volumes of wheat exported have not changed much. Grain from post-Soviet republics has strengthened the grain market and stabilized prices. Production growth (especially in terms of increased yields) has been strong in Russia. In 2002, production was 50 million tons, in 2008 it was 64 million tons, and in 2017 production in Russia reached 86 million tons of wheat (FAO, 2020). Thus, since 2016, Russia has taken the lead in global wheat exports. The quantitative change in grain production on the part of Russia has visibly translated into a change in the destination of wheat exports, in favor of developing countries (Figure 4). In Egypt, the value of total wheat imports increased by a factor of 5.05 over the period 2000–2020. Wheat from Russia and Ukraine is further imported to Indonesia, China, Turkey, Bangladesh, Nigeria, and Pakistan (Observatory of Economic Complexity, 2020).
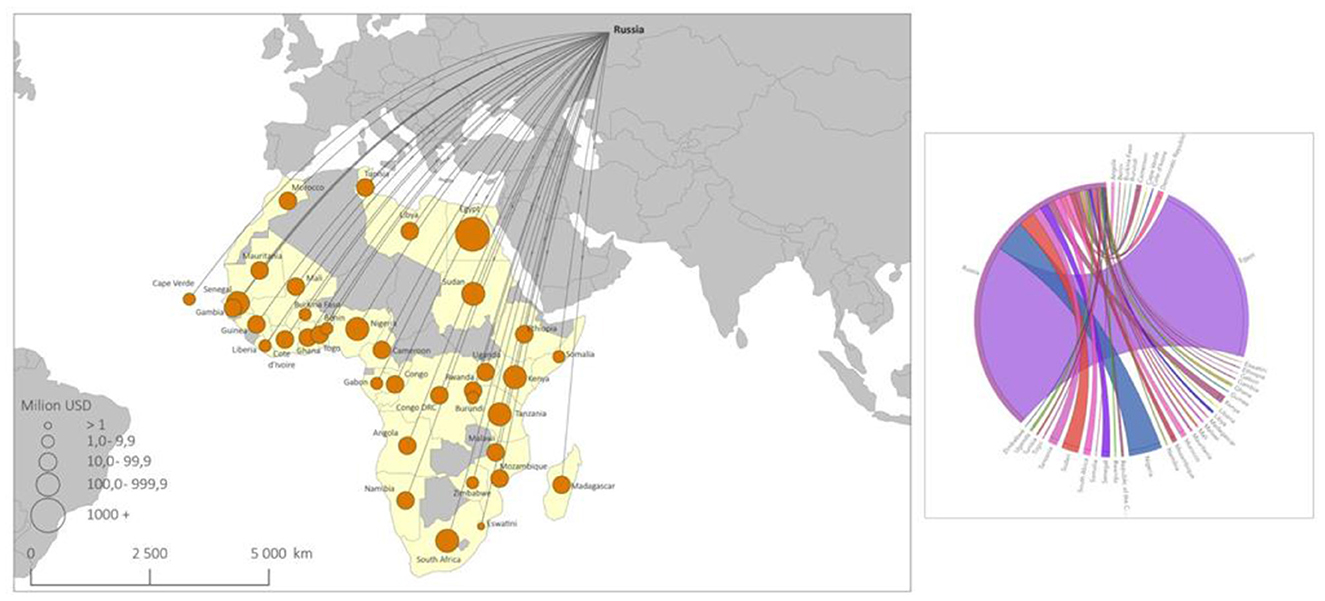
Figure 4. Top 25 Russian wheat importing countries 2020. Source: Authors based on OEC data, 2022.
Compared to Russia, exports from Ukraine are more diversified and do not target developing countries in Africa as much, as illustrated in Figure 5.
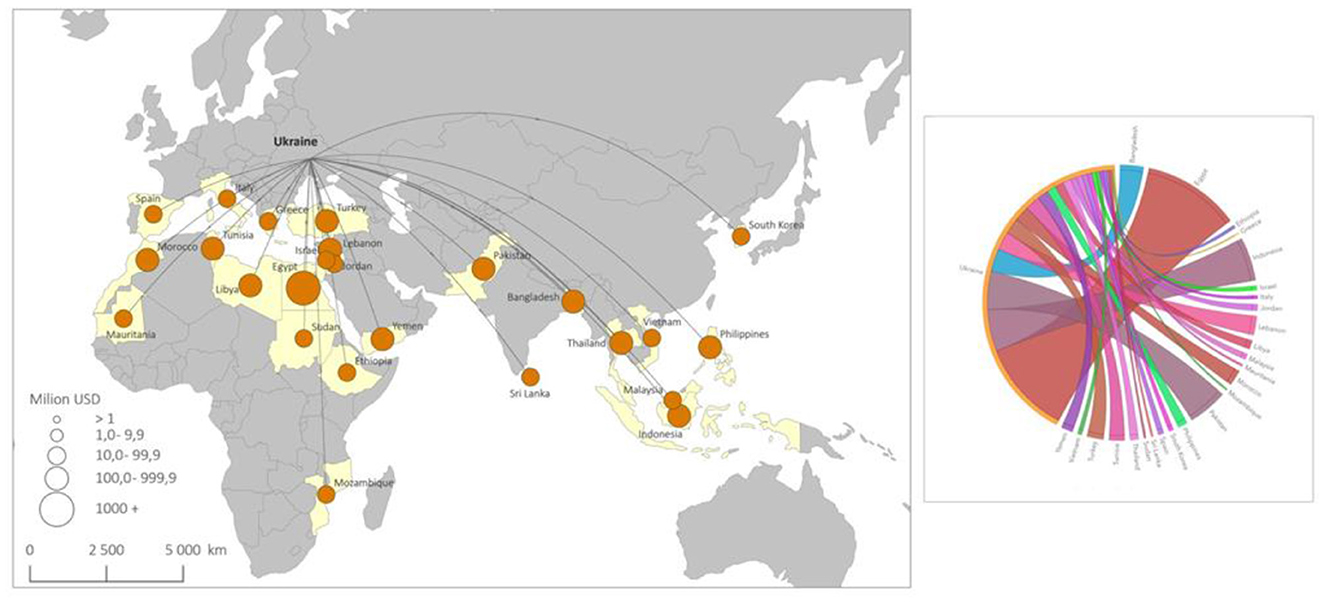
Figure 5. Top 25 Ukrainian wheat importing countries 2020. Source: Authors based on OEC data, 2022.
In terms of the value of wheat exports (USD, tons) over the last twenty years, Russia, Ukraine and the USA are dominant. From 2000 to 2020, Russia and Ukraine exported wheat worth about US$30.2 billion, US$9.2 billion and US$8 billion respectively (Figure 6).
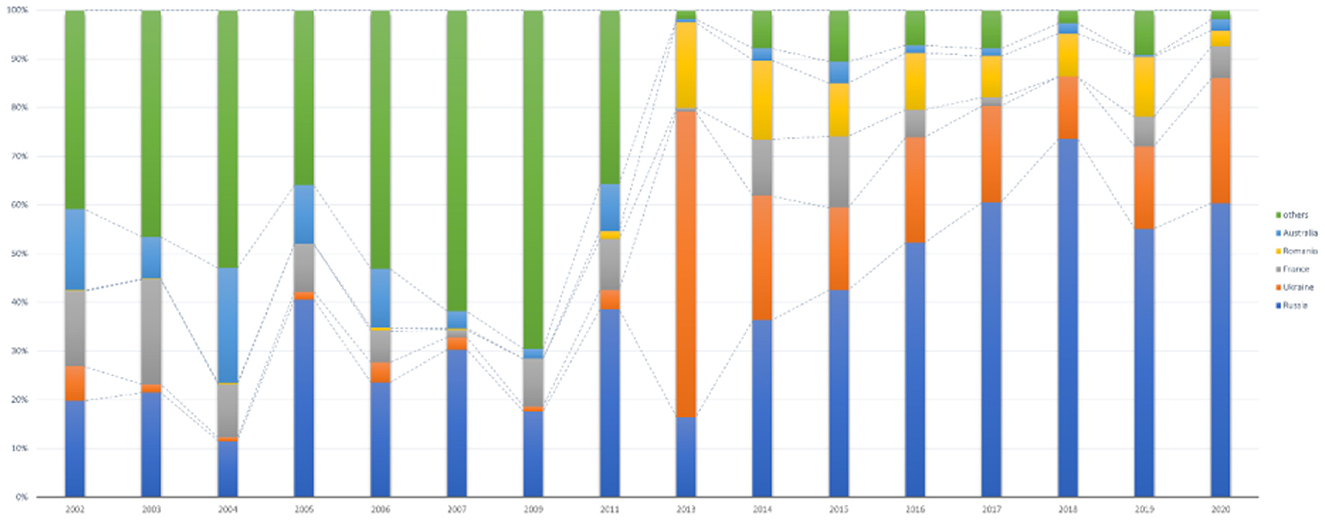
Figure 6. Country share of wheat exports (tons) into Egypt. Source: Food and Agriculture Organization (2000–2020b).
Egypt then adjusts its wheat imports in line with world market prices (Figure 7). Since 2005, Russia has established a stable position in Egypt (with the exception of 2009, when US dominance peaked, and 2013, when Ukraine began exporting wheat into Egypt).
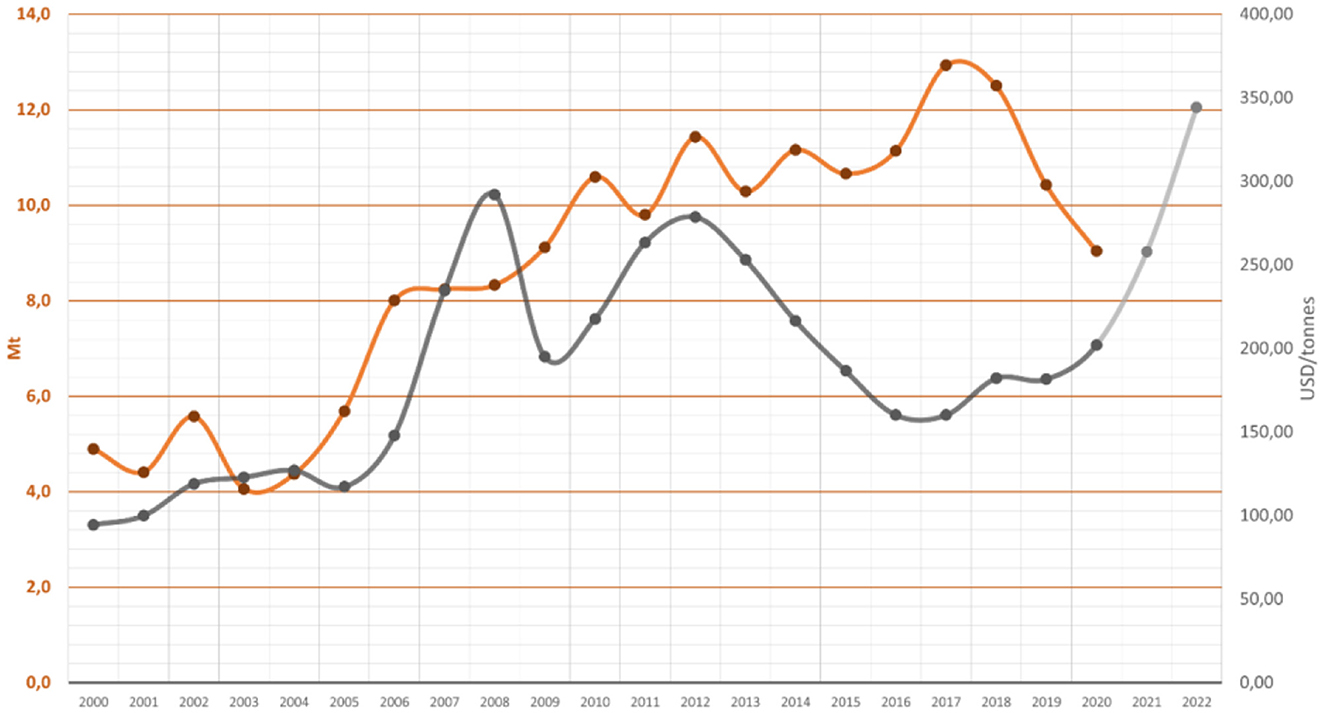
Figure 7. Average annual wheat price (USD/ton) and imports of wheat into Egypt (tons). Source: Food and Agriculture Organization (2000–2020b).
Egypt currently (2020) imports the same amount of wheat as it produces (9 million tons of wheat). From 2000 to 2007, the share of production was 40% and imports 60% of Egypt's total wheat supply. In 2007, the shares of production and imports equalized, and in the following years, import values again dominated (most notably in 2017, 2018, imports of 12 billion tons of wheat). Although the growth rate of wheat production in Egypt is increasing (1.9% p.a. over the period 2000–2020), yet with a growing population (2.01% p.a.), Egypt is unable to reduce its import dependency percentage below 50%. The wheat planted area is under 100% irrigation and acquiring new production areas for cultivation is not easy (given the natural conditions). Despite the fact that wheat consumption increased by 7% to 146 kg/capita over the period under review (2000–2020) (Food and Agriculture Organization, 2000–2020a), the percentage of undernourished in Egypt is still at 5.2%−5.4% of the population (Figure 8). Moreover, the per capita vegetable protein intake (g/capita/day) is unfortunately declining (from 76.5 g in 2000 to 71.3 g in 2019; Food and Agriculture Organization, 2000–2020a).
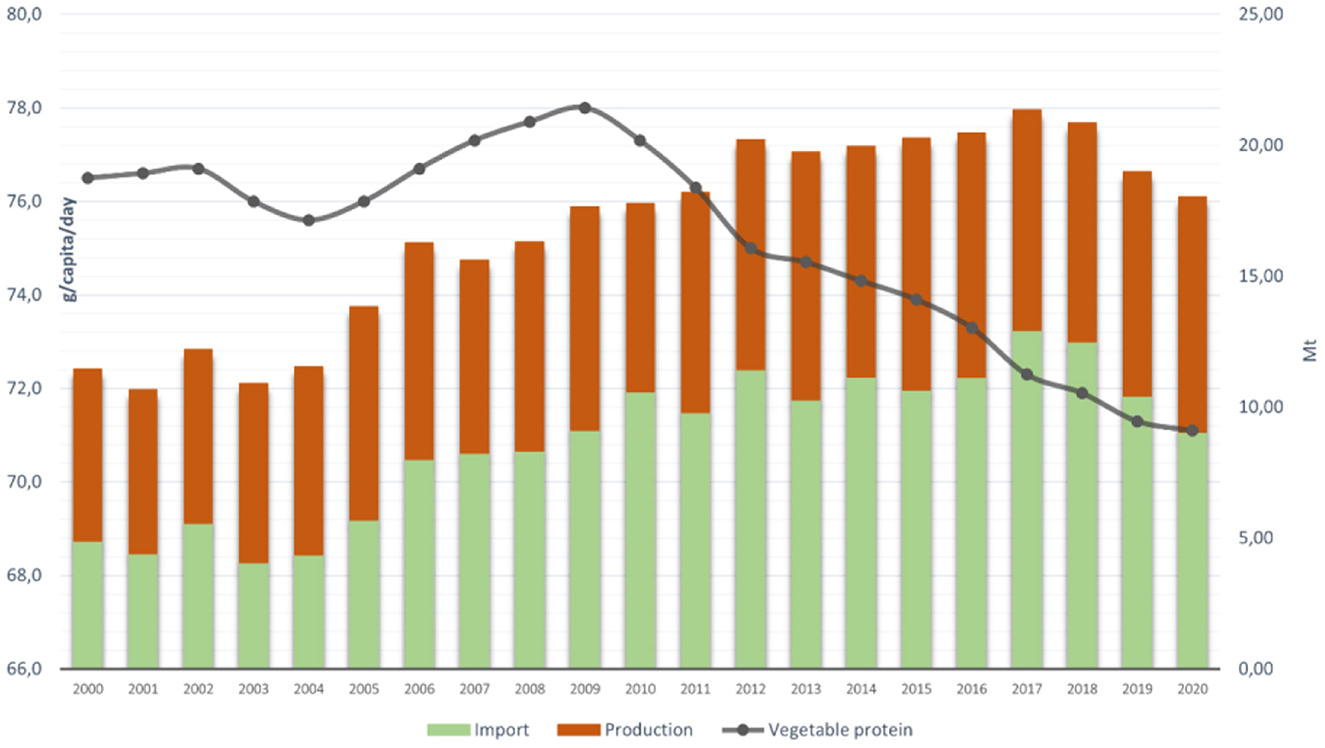
Figure 8. Wheat balance and its effect on plant protein consumption in Egypt. Source: Food and Agriculture Organization (2000–2020b).
Even the increasing production and import of wheat (until 2018) has not been able to increase the consumption of vegetable protein in the population (the situation was exacerbated in the period 2020 and 2021 by the COVID pandemic). Geometric population growth (2% growth p.a.) is one of the significant negative features affecting the overall food situation.
The food situation in Egypt is also affected by environmental and political instability, which also affects migration in the region. Algeria, Egypt, Libya, Morocco, Sudan, and Tunisia have been and remain important destination, transit, and departure countries for migrants. In Egypt, net migration reached its highest levels in 2011 (+158 thousand inhabitants) and in 2013, when net inflows amounted to 163.4 thousand migrants. Conversely, negative net migration was recorded in 2015 (−79.2 thousand) and 2019 (−59.7 thousand). In 2020, the value of net migration was (–) 32.000 inhabitants. It is necessary to distinguish between migrants who have settled in North African countries (some live there for a long time, others only for a short time) and those who have left the country regardless of when. In the whole of North Africa, 3,167,926 foreign migrants are expected to be living in 2020, of which 1,554,523 are expected to be refugees and asylum seekers. Almost 61% of the migrants were either from the same sub-region or from other African sub-regions. In Egypt alone, there are 868,673 foreign migrants, of which more than half are refugees and asylum seekers (543,937). Egypt records 3.6 million migrants. The figure of 3,610,461 refers to the population originating from Egypt and living abroad (2020), regardless of when they left the country. Thus, this figure may increase over time (United Nations: Department of Economics and Social Affairs, 2022). Generally speaking, people from francophone countries in North Africa (Morocco, Algeria, Tunisia) have in the past made many trips to Europe, mostly to France, often for work (temporary but also permanent migration). Today, however, people from the sub-Saharan part of North Africa flow through the country and there may be illegal migration. The links of Egypt, Sudan and partly Libya are more to the West Asian region (Leal Filho et al., 2022).
The nutrition of the population is also directly linked to access to drinking water sources and sanitation. During the 2000–2020 period of study, according to FAOSTAT data, 97.3% of the Egyptian population was found to have basic access to sanitation. Similarly, basic access to drinking water ranges from 97.9 (year 2000) to 99% (year 2020). If data on safe access to water and sanitation were tracked, the results would drop to 61.7% (2020, sanitation). Data on safe access to drinking water are not available, but it can be assumed that they will replicate the data on sanitation.
African countries are threatened by climate problems, food insecurity, rising prices, wars between the world's largest food producers, etc. One of the next biggest shocks in history for it was the global pandemic of COVID-19, which brought with it closure of economies and national borders, quarantine, partial lockdown, restriction of movement, social distance, and reduction of staff in non-essential services (Selim and Eltarabily, 2022). A pandemic that contributed to people in extreme poverty increasing significantly in 2020 for the first time in many years. COVID-19 dealt a major blow to the world's poorest countries, causing a recession that plunged more than 100 million people into extreme poverty in 2020, according to WB estimates (World Bank, 2022a,b). A new report by the charity, OXFAM International (2022) shows that an additional 263 million people could fall into extreme poverty during 2022. This is impacted by the coronavirus pandemic as well as inequality and rising food and energy prices due to the war in Ukraine. Regarding the possible economic impacts of the pandemic in Egypt (2020), according to research (Elbany and Elhenawy, 2021), it can be stated that: ‘In the period studied (April to July 2020), GDP showed a sharp decline of 3.4%, which appeared as a result of a 6% reduction in the price of oil, a 46% reduction in the number of tourists, and further caused currency fluctuations in Africa. The 2019 coronavirus pandemic (COVID-19) has of course had a major impact on the agricultural sector. According to Selim and Eltarabily (2022), the pandemic caused problems especially for smallholder farmers in the northern Nile Delta. According to Siche (2020), food chains were also affected. As a result, food shortages or scarcity due to spoilage of agricultural commodities was a consequence.
In econometric analysis, it makes sense to examine the interrelationships between such processes that are integrated in the same order of magnitude. For this assessment, it will be necessary to apply first a unit root test called the ADF test. Both constant and trend tests have been used for this purpose. Table 1 shows the results of the test. It is clear from Table 1 that all the observed time series are non-stationary and integrated of order 1. It is therefore possible to proceed to the estimation of a static model, but this should be preceded by testing for the presence of multicollinearity using the pairwise correlation coefficients reported in the correlation matrix. This is shown in Table 2.
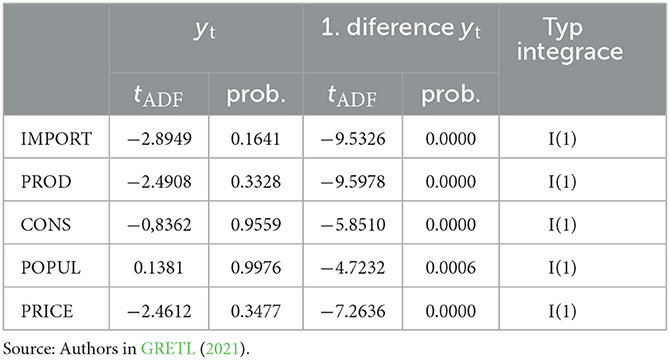
Table 1. ADF tests results.
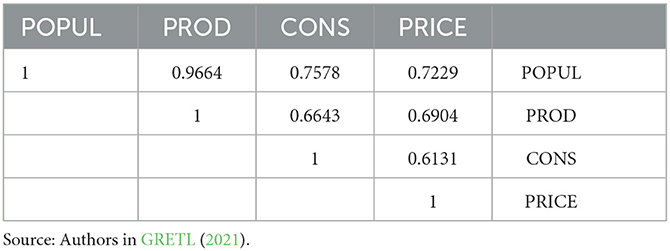
Table 2. Correlation matrix.
Table 2 clearly shows that there is high multicollinearity between the wheat production and population variables in Egypt. If the correlated variables are statistically significant both can be retained in the model and considered as significant variables whose effect on the endogenous variable is common and cannot be separated.
The estimated parameters of the static model including tests are given in Table 3. However, the results showed that the model is not a suitable option due to the fact that it does not meet the basic assumptions on the random component or the specification assumptions. Moreover, the variable “wheat consumption” proved to be an irrelevant variable and even after its exclusion from the model, the characteristics did not improve. Therefore, a dynamic ADL model (n, p1, p2, p3) with three explanatory variables (autoregressive distributed lag model) of the form ADL (1, 0, 0, 0) was estimated. The general form with specific variables was following:
Its estimated parameters, including basic statistics, are presented in Table 3. The answer to the first research question is obvious; except for the wheat consumption variable, all others are significant variables and their inclusion in the equation is meaningful.

Table 3. Model 5: OLS, using observations 1961–2019 (T = 59).
Table 4 shows that all parameters are statistically significant at the tα = 0.01 significance level except for the population variable parameter, which is statistically significant only at the tα = 0.05 significance level. When we examine the direction of the effect, we conclude that a positive relationship can be seen in the case of the lagged endogenous variables import, population level, wheat price and wheat production in the previous year. In the first two cases, the direction is considered to be verified in economic terms because wheat import contracts are concluded in previous periods. Also, population growth requires an increase in the quantity of wheat imported. The variable price of wheat has a directly proportional effect on imports, which is again not inconsistent with the real food situation in the country. Egypt is unable to cover its consumption with its own production, even if it is growing, and is therefore dependent on imports, with the need to accept rising prices. Although the positive effect of wheat production in the previous period increases exports in the current period, the sum of the two coefficients of the wheat production variable is still negative. Thus, the long-run effect speaks in favor of the economic theory where imports are constrained as domestic production increases. An assessment of the direction of the effect and the magnitude of the parameters in Table 4 answers the second research question.
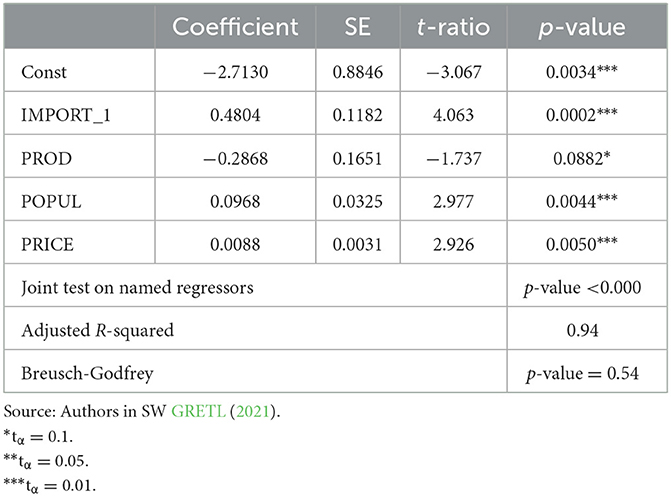
Table 4. Results of estimates of ADL model in linear form—HAC standard errors using observations 2000:02–2021:02 (T = 253).
The estimated model has been verified to confirm that the basic Gauss–Markov rules for working with time series are satisfied.
Figure 9 then shows the actual and theoretical values of wheat imports into Egypt for the period 1961–2019, which graphically expresses that the included explanatory variables were appropriately selected, and the model is verified.
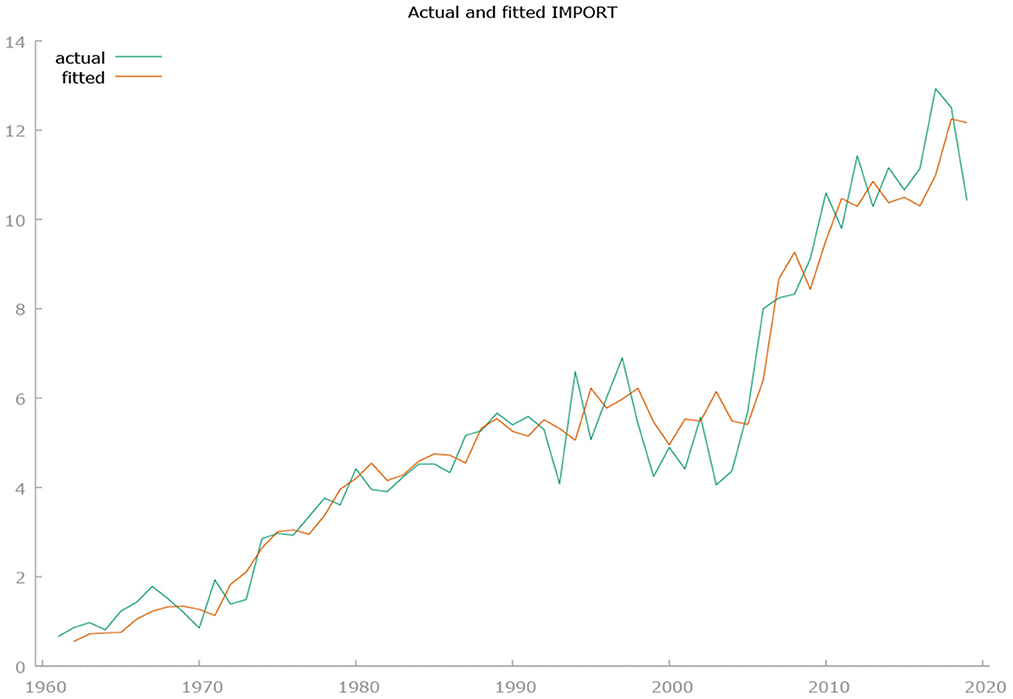
Figure 9. Actual and theoretical values of the endogenous variable IMPORT. Source: Food and Agriculture Organization, 2022.
To answer the third research question, it is necessary to conduct a cointegration test using the approach proposed by Johansen. Before testing for the existence of long-run relationships between series, it is necessary to determine the optimal lag length in the system, this is shown in Table 5.
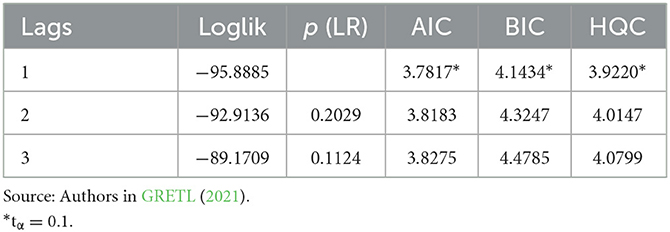
Table 5. VAR system, maximum lag order 3.
Table 5 shows that by applying the LR test and from the results of the information criteria Akaike criterion (AIC), Schwarz Bayesian criterion (BIC) and Hannan-Quinn criterion (HQC) it is possible to identify the series in question as a VAR (1). The Johansen cointegration test provides information that a long-run relationship exists between the IMPORT and PROD series. In the test, a lag of order 1 was used and a function with a bounded constant was chosen. The results are presented in Table 6.
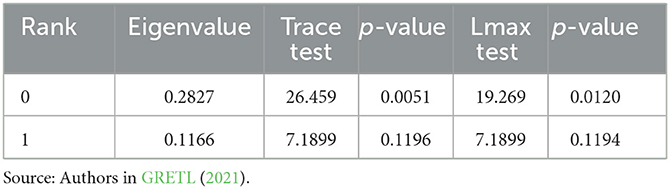
Table 6. Johansen cointegration test.
The Johansen test indicates that the rank of the P matrix is not zero. The finding that there is just one cointegrating relationship between the stochastic variables is confirmed by the Trace test as well as the Lmax test. The estimated p-value is greater than the chosen significance level of tα = 0.05. From the result of the cointegration test, it is possible to express the cointegration vectors, which are presented in Table 7 in the form of a normalized β matrix.
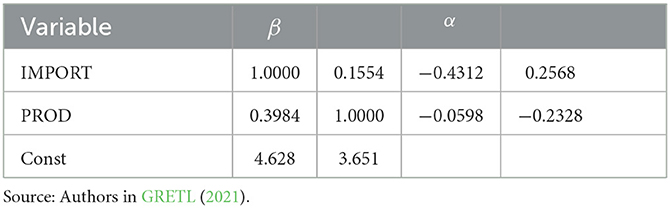
Table 7. Estimated cointegration vectors.
From the cointegration vectors, it is possible to infer an inverse proportional long-run relationship between wheat imports into Egypt and wheat production in Egypt. If production increases by 1 million tons, then imports decrease by 0.1554 tons. The parameters that determine the rate of adjustment to the equilibrium state are recorded in the α matrix. The VECM estimates of the bivariate VAR(1) that show the short-run relationships between the variables are reported in Tables 8A, B. The estimated functions of the VAR(1) system show that only a unidirectional relationship was found, confirming that changes in output affect exports but not vice versa. The simultaneous relationship was not confirmed between these variables.
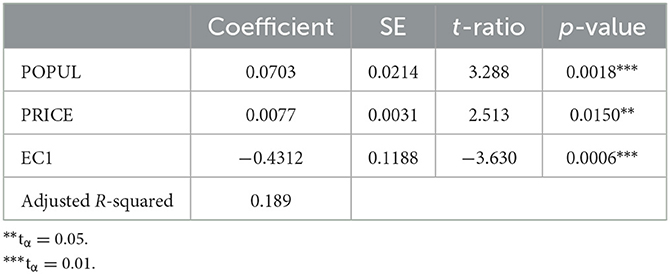
Table 8A. VECM, VAR(1)—Equation 1:d_IMPORT.
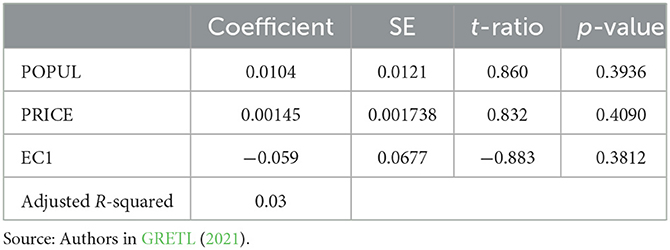
Table 8B. VECM, VAR(1)—Equation 2: d_PROD.
The fourth research question can be analyzed using the elasticity coefficient to compare the strength of the effect of each variable in relative units. Table 9 shows the estimates of the average elasticity coefficients over the period under study.

Table 9. Elasticity coefficients in % estimated from the ADL model.
These results show that the population level is the most influential factor on wheat imports. A 1% increase in population causes a 0.731% increase in imports. In second place is the quantity of wheat produced in Egypt. If there is a 1% increase in production, then there would be a 0.653% decrease in imports. The smallest effect of almost zero is confirmed in the case of the price of this agricultural commodity. The table further shows that all the responses of the endogenous import variable can be considered as inelastic.
The world wheat price rises to $202.01/ton in 2020 and $258.68/ton 1 year later. However, given the conflict in Ukraine, the price rose to USD 351.98/ton (January–September 2022) (CME, 2022). According to 2022 prices (from January 1, 2022 to October 4, 2022), the price of imports would rise to 74%. The total 2020 wheat imports realized at USD 5 billion (i.e., 6.5% of total import expenditure, Observatory of Economic Complexity, 2020) would also reach almost USD 8.7 billion. Egypt has to accept world prices precisely because of food insecurity. The model shows that even an increased price is unable to induce lower wheat imports.
The empirical Price is an important variable in world trade, which reflects the relationship between supply and demand. The impact of the Russia-Ukraine war on food, fuel, energy and fertilizer prices is a major issue of global poverty and food insecurity in developing countries. Arndt et al. (2023) addressed the short-term impacts of crises on agri-food systems, poverty and food insecurity in 19 developing countries. Despite large cross-country differences, the results confirm the adverse impacts of crises. Agri-food systems and poverty are more vulnerable to rising energy and fertilizer prices, while hunger and diet quality are more affected by higher food prices.
However, fertilizer prices rose substantially before the war in Ukraine, largely because China imposed a ban on fertilizer exports (Hebebrand and Laborde, 2022). The impact of the Russia-Ukraine war has had an impact not only on the conventional energy and renewable energy markets, but also on the precious metals market. The increase in anomalous returns, however, was mainly associated with the renewable energy industry (Umar et al., 2022).
Research by Mottaleb et al. (2022) suggests: an average 1% decrease in global wheat trade could increase the producer price of wheat by 1.1 and a 1% increase in producer price could reduce annual per capita wheat consumption by 0.59%, daily calorie intake by 0.54% and protein intake by 0.64% in selected countries. On this basis, the study shows that a 50% reduction in wheat exports by Russia and Ukraine could increase the producer price of wheat by 15%, which would trigger a reduction in wheat consumption and dietary energy intake of at least 8%. The aforementioned war conflict will have an impact on energy prices, which will affect the prices of all manufactured production in the world. Developing countries will pay for this situation, for example in the purchase of mineral fertilizers. Urea prices have surpassed their 2008 highs, while phosphate and potash prices are approaching 2008 levels. Concerns about fertilizer availability and accessibility have been heightened by the war in Ukraine. Rising natural gas prices, particularly in Europe, have led or may lead to widespread curtailment of ammonia production—an important input for nitrogen fertilizers—in the future. Similarly, rising coal prices in China, the main raw material for ammonia production there, have forced fertilizer factories to cut back production, contributing to higher urea prices. Higher ammonia and sulfur prices have also pushed up phosphate fertilizer prices (World Bank, 2022a,b).
Food subsidies in developing countries can solve a food crisis. Food subsidies are one of the policies that are considered to protect consumers from rising food prices, especially when there is insufficient local production and food must be supplemented by imports with fluctuating prices (Ramadan and Thomas, 2011). Bread subsidies kept 730,000 people above the poverty line in fiscal year 1999–2000 (Ahmed and Bouis, 2002). Yet Egypt, the most populous Arab country, may face bread subsidy difficulties today and in the future. Again, due to the growing crisis in Ukraine (Mottaleb et al., 2022). After the unrest caused by poverty, unemployment and poor living conditions more than a decade ago (Soffiantini, 2020), the agrarian sector (and fiscal financing) is also disrupted by the COVID-19 pandemic. According to Ali and Gad (2022), the pandemic has reduced yields, particularly in traditional levels, by 0.75 tons/acre.
Egypt is a specific country in terms of its geographical location. This may affect its potential for further development of international trade. Disdier and Head (2008) confirmed the negative effect of increasing distance on bilateral trade. Another factor influencing Egypt's international commodity trade may be its partial history as a British protectorate between 1882 and 1914, during which its circular relations with the metropole gradually weakened, when there was a gradual weakening of its circular relations with the metropole (Head and Mayer, 2010).
It has been proven that Egypt is dependent on wheat imports and that price does not play a significant role in the extent of imports. Price problems then affect developing countries the most. Other authors agree with this. Olayungbo (2021) addressed world food prices in the context of oil prices. The prices of food crops such as rice, wheat, as well as cassava have been increasingly high. Many scholars attribute the increase in food prices to an increase in oil prices as an input to food production (Obadi and Korček, 2014). The increase in the prices of food has placed huge pressure on oil-producing countries that are net importers of food, especially the developing oil-exporting countries (e.g, Egypt).
The dilemma of self-sufficiency in cereals is also being addressed, for example, in Iran (Amid, 2007). The author examines wheat production and consumption and concludes that the policy of cheap bread is primarily responsible for the continued dependence on wheat imports.
To address this situation, the authors make suggestions on: (a) increasing mechanization of domestic production (Alwang et al., 2018), (b) reducing agricultural production losses (Yigezu et al., 2021b), (c) changes in crop rotation practices (Omar et al., 2021), etc. However, this will not translate into growth in production or self-sufficiency of Egypt in the short term. In spite of the negative impacts on the quality of agricultural soils, El-sayed et al. (2021) further recommend irrigating agricultural soils with saline water (using biochar addition to reduce salinity stress). It is questionable how the long-term use of saline water would affect the technical condition of the irrigation equipment and the mentioned soil quality. It can be concluded that population growth, especially on the outskirts of cities, is not able to be directed by Egypt. According to Bayat and Denis (2000), urban centers have lost population in the last decade, while peripheral villages and towns are growing rapidly. This is due to urban saturation with respect to accommodating low-income people. There are also tendencies among affluent groups to move to suburban areas (where pollution, traffic congestion, and overcrowding are not yet as great). It is clear that high land prices, increasing population density, lack of affordable housing, and decaying existing housing stock all contribute to low-income migrants seeking out peripheral neighborhoods and joining already marginalized groups in informal settlements around metropolitan areas. All this contributes to the ruralization of cities. Moreover, as agriculture becomes increasingly deregulated, urban villages are also growing. One other option is to focus on fish and other aquatic foods to provide food, income, and generate employment. Especially in many low- and middle-income countries (FAO, 2020; Tran et al., 2022). In many African countries with less economic development compared to the rest of the world, fish is an increasingly important source of protein and micronutrients because it is more affordable than other animal-based foods (Obiero et al., 2019). On the other hand, it is very important to take into account the high pollution and fish depredation in the Mediterranean Sea, which has not received enough attention (Di Franco et al., 2020). Wheat production in Egypt has fluctuations from year to year but has an increasing trend. In 2019–2020, Egypt's wheat imports declined (Figure 5). Given the wheat prices of 2022, this can be expected to continue in 2023. Unfortunately, Egypt, an African country with a population of over 106 million, is at the center of two of the biggest and most pressing challenges facing the world today—the food and climate crises. Climate change will directly affect the total crop area in the world, not excluding Egypt. According to IFAD (2022), climate change in Egypt will have a major impact on reducing yields. By 2030 (medium risk estimate, full irrigation) the largest yield declines are projected for maize, peas and wheat (−4.33 to −2.08%). Yields may decline in the short term for maize, but the decline will continue significantly for wheat (−5.47% in 2041). In the case of limited or no access to irrigation, yields may decline by as much as 10.4% for wheat by 2030. In addition, according to studies by Stanley and Clemente (2017) and Shinawi et al. (2022), Egypt is at risk of continued soil subsidence and groundwater salinization. Sea level rise could destroy 40% of the fertile but low-lying Nile Delta, a key area for crop production, between 2040 and 2050.
The results of this study highlight in particular the geometric growth of the population (index analysis, model). The results are in agreement with the assessment of Asseng et al. (2018): “Egypt will continue to rely on imports as the planned expansion of agricultural land, wheat cultivation and water use will be insufficient to meet the increased demand for wheat. Egypt's population is currently growing at 2.2% per year, with wheat demand continuing to increase and forecasts suggesting that wheat demand will triple by the end of the century. If population growth in Egypt is high to moderate, wheat demand will continue to exceed wheat production. In that case, Egypt will continue to import wheat from the world.”
The econometric model in the article confirmed the effect that speaks in favor of the economic theory, when with the growth of domestic production, imports are limited. Alwang et al. (2018), ElFetyany et al. (2021), and Yigezu et al. (2021a) clearly support Egypt's ability to limit wheat imports in the future.
What the model fails to demonstrate is the relationship between wheat product consumption and wheat import values. In neither direction of action. Egypt managed to significantly increase its consumption of wheat products to a value of 141 kg/capita in 1981. Since then, consumption has been more or less constant. In 2019, consumption stood at 146 kg/capita. While wheat product consumption is more than double the global average, it has not been able to translate significantly into a stabilization of per capita vegetable protein intake (Figure 5) or a decline in the percentage of undernourished in the population as a whole. In 2010, the percentage of undernourished decreased to 3.9%. Since then, the indicator has increased slightly, to about 5% today (Food and Agriculture Organization, 2022).
This corresponds to a moderate state of hunger (score 10–19.9; GHI index). In the Global Hunger Index for 2022, Egypt is ranked 57th out of 121 countries with sufficient data to calculate a GHI score. Egypt's HDI for 2022 is 12.3 (GHI, 2022).
On a positive note, Egypt's food expenditure has been declining at a moderate pace between 2009 and 2018, decreasing from 44.6% in 2009 to 33.26% in 2018 (World Data Atlas, 2018). However, it is questionable how the aforementioned share of expenditure will be affected by rising inflation, which is exacerbated by the Ukraine-Russia crisis and the effects of the COVID-19 pandemic.
All of the ideas on how to reduce import dependence are addressable in the long run. The way forward for Egypt is to have synergies in all the solutions offered, as the nutritional situation in Egypt is not improving. The situation in Egypt is unlikely to improve without implemented assistance from the WB, the IMF and the various advanced economies of the world.
The Russia plays a significant role in world wheat exports (18.8% of world exports in tons) followed by the United States (13.16%), Canada (13.15%), France (9.97%), and Ukraine (9.09%). The change in grain production on the Russian side has visibly translated into a change in wheat export destinations in favor of developing countries. It can be noted that since 2005, Russia has established a very strong, stable position in Egypt (the exceptions being 2009, when the US was the top world exporter, and 2013, when Ukraine started importing wheat into Egypt). In 2020, Russia and Ukraine imported 86.01% of Egypt's total wheat imports. Egypt currently (2020) imports the same amount of wheat it produces itself (9 million tons of wheat). Although the growth rate of wheat production in Egypt is increasing (1.9% p.a. over the period 2000–2020), with a growing population (2.01% p.a.), Egypt is unable to reduce its percentage of import dependence below 50% of the amount of wheat consumed. Wheat consumption during the period under review (2000–2020) increased by only 7% to 146 kg/capita, and the percentage of undernourished in Egypt is still at 5.2%−5.4% of the population. Moreover, the per capita vegetable protein intake (g/capita/day) is unfortunately declining (from 76.5 g in 2000 to 71.3 g in 2019). The econometric model shows: Apart from the variable “annual wheat consumption per capita,” all other variables (production, population, and price) are significant variables in relation to wheat imports. All three parameters are statistically significant at the significance level tα = 0.01 except for the parameter variable wheat production. The latter is statistically significant only at the significance level tα = 0.1. Egypt is forced to accept rising prices. A rise in price does not induce a fall in wheat imports. Price elasticity is the lowest among the variables studied for price. This poses a great risk for Egypt in the long run economic perspective, also in view of the current geopolitical developments in the field of international security. According to Johansen's cointegration test, there is a long-run relationship between the IMPORT and PRODUCTION series. The cointegration vectors suggest an inversely proportional long-run dependence. Only a unidirectional relationship was found, which confirms that changes in production affect exports, but not vice versa.
In order to improve food security, the search for alternatives to wheat has been proposed, including flours made from legumes, pseudocereals, minor cereals, and milling by-products such as bran. However, it should be noted that the production of semi-pure or wheat-free bread may have different texture and taste characteristics.
The limits of this study are related to the nature of econometric modeling, which cannot account for all the factors affecting the dependent variable, especially policies and international relations that may be difficult to quantify. Also dataset used for modeling is just until February 2021, thus the model does not include the impact of Russian invasion to Ukraine from February 2022. Nevertheless, all the proposed ideas to reduce import dependence—such as improving agricultural infrastructure, changing cropping practices or agricultural technologies, mitigating post-harvest and distribution losses of wheat, irrigation with treated salt water, increasing fisheries, incentives to reduce stocking rates, and more—can be implemented in the long run.
Egypt is the largest wheat-importing country in Africa, with a high per capita consumption of wheat products and rising commodity prices, making it more vulnerable to these fluctuations than other countries. Moreover, it is a country that will face significant climate change in the future, and is susceptible to external economic and social changes, such as inflation, disease pandemics, and financing from neighboring countries.
Therefore, the way forward for Egypt is to pursue a synergistic approach that incorporates all potential solutions, along with international financial assistance.
The raw data supporting the conclusions of this article will be made available by the authors, without undue reservation.
Conceptualization, methodology, software, validation, formal analysis, data curation, writing—original draft preparation, and visualization: ZG and PH. Investigation, resources, and writing—review and editing: ZG, PH, MM, KM, KB, VB, RK, LS, KT, and JM. All authors wrote, revised, and approved the final manuscript and read and agreed to the published version of the manuscript.
This paper was supported by the Internal Grant Agency (IGA) of the Faculty of Economics and Management, Czech University of Life Sciences Prague, grant no. 2022B0008 Economic Governance as a Key Determinant of Macroeconomic Development in Africa.
The authors declare that the research was conducted in the absence of any commercial or financial relationships that could be construed as a potential conflict of interest.
All claims expressed in this article are solely those of the authors and do not necessarily represent those of their affiliated organizations, or those of the publisher, the editors and the reviewers. Any product that may be evaluated in this article, or claim that may be made by its manufacturer, is not guaranteed or endorsed by the publisher.
Abdelaziz, S. B., and Hegazy, R. (2012). Socioeconomic risk factors of malnutrition among Egyptian children between 6 months and 2 years of age, Cairo, Egypt. J. Egypt. Public Health Assoc. 87, 124–130. doi: 10.1097/01.EPX.0000421567.39976.90
Abdelkader, A., Elshorbagy, A., Tuninetti, M., Laio, F., Ridolfi, L., Fahmy, H., et al. (2018). National water, food, and trade modeling framework: the case of Egypt. Sci. Total Environ. 639, 485–496. doi: 10.1016/j.scitotenv.2018.05.197
Abdelmageed, K., Chang, X.-H., Wang, D.-M., Wang, Y.-J., Yang, Y.-S., Zhao, G.-C., et al. (2019). Evolution of varieties and development of production technology in egypt wheat: a review. J. Integr. Agric. 18, 483–495. doi: 10.1016/S2095-3119(18)62053-2
Ahmed, A. U., and Bouis, H. E. (2002). Weighing what's practical: proxy means tests for targeting food subsidies in Egypt. Food Policy 27, 519–540. doi: 10.1016/S0306-9192(02)00064-7
Ali, R. R., and Gad, A. (2022). The impact of COVID-19 pandemic on wheat yield in El Sharkia Governorate, Egypt. Egypt. J. Remote. Sens. Space Sci. 25, 249–256. doi: 10.1016/j.ejrs.2022.01.003
Alwang, J., Sabry, S., Shideed, K., Swelam, A., and Halila, H. (2018). Economic and food security benefits associated with raised-bed wheat production in Egypt. Food Secur. 10, 589–601. doi: 10.1007/s12571-018-0794-3
Amid, J. (2007). The dilemma of cheap food and self-sufficiency: the case of wheat in Iran. Food Policy 32, 537–552. doi: 10.1016/j.foodpol.2006.11.001
Anriquez, G., Foster, W., Ortega, J., and Santos Rocha, J. (2021). In search of economically significant food losses: evidence from Tunisia and Egypt. Food Policy 98, 101912. doi: 10.1016/j.foodpol.2020.101912
Arndt, C. H., Diao, X., Dorosh, P., Pauw, K., and Thurlow, J. (2023). The Ukraine war and rising commodity prices: implications for developing countries. Glob. Food Secur. 36, 100680. doi: 10.1016/j.gfs.2023.100680
Asseng, S., Kheir, A. M. S., Kassie, B., Hoogenboom, G., Abdelaal, A. I. N., Haman, D. Z., et al. (2018). Can Egypt become self-sufficient in wheat? Environ. Res. Lett. 13, 094012. doi: 10.1088/1748-9326/aada50
Aworh, O. C. (2015). Promoting food security and enhancing Nigeria's small farmers' income through value-added processing of lesser-known and under-utilized indigenous fruits and vegetables. Food Res. Int. 76, 986–991. doi: 10.1016/j.foodres.2015.06.003
Aworh, O. C. (2020). Food safety issues in fresh produce supply chain with particular reference to sub-Saharan Africa. Food Control 123, 107737. doi: 10.1016/j.foodcont.2020.107737
Bayat, A., and Denis, E. (2000). Who is afraid of Ashwaiyyat? Urban change and politics in Egypt. Environ. Urban. 12, 185–199. doi: 10.1177/095624780001200215
Belaïd, F., and Flambard, V. (2023). Impacts of income poverty and high housing costs on fuel poverty in Egypt: an empirical modeling approach. Energy Policy 175, 113450. doi: 10.1016/j.enpol.2023.113450
Bentley, A. R., Donovan, J., Sonder, K., Baudron, F., et al. (2022). Near- to long-term measures to stabilize global wheat supplies and food security. Nat. Food 3, 483–486. doi: 10.1038/s43016-022-00559-y
Boysen, O., Boysen-Urban, K., Bradford, H., and Balié, J. (2019). Taxing highly processed foods: what could be the impacts on obesity and underweight in sub-Saharan Africa? World Dev. 119, 55–67. doi: 10.1016/j.worlddev.2019.03.006
Canagarajah, C., and Thomas, S. (2001). Poverty in a wealthy economy: the case of Nigeria. J. Afr. Econ. 10, 143-173. doi: 10.1093/jae/10.2.143
CME (2022). Chicago SRW Wheat. Available online at: https://www.cmegroup.com/markets/agriculture/grains/wheat.html (accessed December 13, 2022).
Darwish, A. S., Sayed, M. A., and Shebl, A. (2020). Cuttlefish bone stabilized Ag3VO4 nanocomposite and its Y2O3-decorated form: waste-to-value development of efficiently ecofriendly visible-light-photoactive and biocidal agents for dyeing, bacterial and larvae depollution of Egypt's wastewater. J. Photochem. Photobiol. A Chem. 401, 112749. doi: 10.1016/j.jphotochem.2020.112749
Di Franco, E, Pierson, P., Di Iorio, L., Calò, A., Cottalorda, J. M., Derijard, B., et al. (2020). Effects of marine noise pollution on Mediterranean fishes and invertebrates: a review. Mar. Pollut. Bull. 159, 111450. doi: 10.1016/j.marpolbul.2020.111450
Disdier, A.-C., and Head, K. (2008). The puzzling persistence of the distance effect on bilateral trade. Rev. Econ. Stat. 90, 37–48. doi: 10.1162/rest.90.1.37
Elbany, M., and Elhenawy, Y. (2021). Analyzing the ultimate impact of COVID-19 in Africa. Case Stud. Transp. Policy 9, 796–804. doi: 10.1016/j.cstp.2021.03.016
ElFetyany, M., Kamal, R., Helmy, M., and Nasr, M. L. (2021). Study the effect of food waste on egypt water resources - wheat case study. Ain Shams Eng. J. 12, 2401–2412. doi: 10.1016/j.asej.2020.10.024
Elsaie, Y., Soussa, H., Gado, M., and Balah, A. (2022). Water desalination in Egypt; literature review and assessment. Ain Shams Eng. J. 14, 101998. doi: 10.1016/j.asej.2022.101998
El-sayed, M. E. A., Hazman, M., Abd El-Rady, A. G., Almas, L., McFarland, M., Shams El Din, A., et al. (2021). Biochar reduces the adverse effect of saline water on soil properties and wheat production profitability. Agriculture 11, 1112. doi: 10.3390/agriculture11111112
Food and Agriculture Organization (2000–2020a). Data, Food Balances. Available online at: https://www.fao.org/faostat/en/#data/FBS (accessed July 20, 2022).
Food and Agriculture Organization (2000–2020b). Trade, Crops and Livestock Products. Available online at: https://www.fao.org/faostat/en/#data/TCL (accessed July 20, 2022).
Food and Agriculture Organization (2022). Production, Crops and livestock products. Available online at: https://www.fao.org/faostat/en/#data/QCL (accessed July 20, 2022).
GHI, Global Hunger Index. (2022). Egypt. Available online at: https://www.globalhungerindex.org/egypt.html (accessed October, 2022).
Gohar, A. A., Cashman, A., and El-bardisy, H. A. E. H. (2021). Modeling the impacts of water-land allocation alternatives on food security and agricultural livelihoods in Egypt: welfare analysis approach. Environ. Dev. 39, 100650. doi: 10.1016/j.envdev.2021.100650
GRETL. (2021). The Cross-Platform Software Package for Econometric Analysis. Open-source software verse 2021a. Available online at: https://sourceforge.net/projects/gretl/files/gretl/2021a/gretl-2021a-64.exe/download
Head, K., and Mayer, T. (2010). The erosion of colonial trade linkages after independence. J. Int. Econ. 81, 1–14. doi: 10.1016/j.jinteco.2010.01.002
Hebebrand, C., and Laborde, D. (2022). High Fertilizer Prices Contribute to Rising Global Food Security Concerns. Washington, DC: International Food Policy Research Institute. Available online at: https://www.ifpri.org/blog/high-fertilizer-prices-contribute-rising-global-food-security-concerns (accessed September 30, 2022).
IFAD. (2022). Climate Adaptation in Rural Development (CARD) Assessment Tool. IFAD.Available online at: https://www.ifad.org/en/web/knowledge/-/publication/climate-adaptation-in-rural-development-card-assessment-tool
Johansen, S. (1988). Statistical analysis of cointegration vectors. J. Econom. Dynam. Cont. 12, 231–254. doi: 10.1016/0165-1889(88)90041-3
Khatab, K. (2010). Childhood malnutrition in Egypt using geoadditive gaussia and latent variable models. Am. J. Trop. Med. Hyg. 82, 653–663. doi: 10.4269/ajtmh.2010.09-0501
Leal Filho, W., Olaniyan, O. F., and Nagle Alverio, G. (2022). Where to go? Migration and climate change response in West Africa. Geoforum 137, 83–87. doi: 10.1016/j.geoforum.2022.10.011
Lo, G.-D., Marcelin, I., Bassène, T., and Sène, B. (2022). The Russo-Ukrainian war and financial markets: the role of dependence on Russian commodities. Finance Res. Lett. 50, 103194. doi: 10.1016/j.frl.2022.103194
Mbah, R. E., and Wasum, D. F. (2022). Russian-Ukraine 2022 war: a review of the economic impact of Russian-Ukraine crisis on the USA, UK, Canada, and Europe. Adv. Soc. Sci. Res. J. 9, 144–153. doi: 10.14738/assrj.93.12005
Mottaleb, K. A., Kruseman, G., and Snapp, S. (2022). Potential impacts of Ukraine-Russia armed conflict on global wheat food security: a quantitative exploration. Glob. Food Secur. 35, 100659. doi: 10.1016/j.gfs.2022.100659
Obadi, S. M., and Korček, M. (2014). Are food prices affected by crude oil price: causality investigation. Rev. Integr. Bus. Econ. Res. 3, 411–427.
Obiero, K., Meulenbroek, P., Drexler, S., Dagne, A., Akoll, P., Odong, R., et al. (2019). The contribution of fish to food and nutrition security in Eastern Africa: emerging trends and future outlooks. Sustainability 11, 1636. doi: 10.3390/su11061636
Observatory of Economic Complexity (2020). Export and Import of Wheat. Available online at: https://oec.world/en (accessed September 10, 2022).
Olayungbo, D. O. (2021). Global oil price and food prices in food importing and oil exporting developing countries: a panel ARDL analysis. Heliyon 7, e06357. doi: 10.1016/j.heliyon.2021.e06357
Omar, M. E. D. M., Moussa, A. M. A., and Hinkelmann, R. (2021). Impacts of climate change on water quantity, water salinity, food security, and socioeconomy in Egypt. Water Sci. Eng. 14, 17–27. doi: 10.1016/j.wse.2020.08.001
OXFAM International (2022). “Terrifying Prospect” of Over a Quarter of a Billion More People Crashing into Extreme Levels of Poverty ands Suffering this Year. Available online at: https://www.oxfam.org/en/press-releases/terrifying-prospect-over-quarter-billion-more-people-crashing-extreme-levels-poverty (accessed 12 April, 2021).
Ramadan, R., and Thomas, A. (2011). Evaluating the impact of reforming the food subsidy program in Egypt: A Mixed Demand approach. Food Policy 36, 638–646. doi: 10.1016/j.foodpol.2011.06.006
Salah, S., Eltaweel, I., Abeykoon, M., and Towards, C. (2022). A sustainable energy future for Egypt: a systematic review of renewable energy sources, technologies, challenges, and recommendations. Clean. Eng. Technol. 8, 100497. doi: 10.1016/j.clet.2022.100497
Schierhorn, F., Müller, D., Prishchepov, A. V., Faramarzi, M., and Balmann, A. (2014). The potential of Russia to increase its wheat production through cropland expansion and intensification. Glob. Food Secur. 3, 133–141. doi: 10.1016/j.gfs.2014.10.007
Selim, T., and Eltarabily, M. G. (2022). Impact of COVID-19 lockdown on small-scale farming in Northeastern Nile Delta of Egypt and learned lessons for water conservation potentials. Ain Shams Eng. J. 13, 101649. doi: 10.1016/j.asej.2021.11.018
Shinawi, A. E., Zelenáková, M., Nosair, A. M., and Abd-Elaty, I. (2022). Geo-spatial mapping and simulation of the sea level rise influence on groundwater head and upward land subsidence at the Rosetta coastal zone, Nile Delta, Egypt. J. King Saud Univ. Sci. 34, 102145. doi: 10.1016/j.jksus.2022.102145
Siche, R. (2020). What is the impact of COVID-19 disease on agriculture? Sci. Agropecu. 11, 3–6. doi: 10.17268/sci.agropecu.2020.01.00
Soffiantini, G. (2020). Food insecurity and political instability during the Arab Spring. Global Food Security 6, 100400. doi: 10.1016/j.gfs.2020.100400
Stanley, J.-D., and Clemente, P. L. (2017). Increased land subsidence and sea-level rise are sub-merging Egypt's Nile Delta coastal margin. GSA Today 27, 4–11. doi: 10.1130/GSATG312A.1
Statista (2022). The Most Vulnerable Countries amid Wheat Shortages. Available online at: https://www.statista.com/chart/27181/least-developed-countries-dependent-on-wheat-from-russia-ukraine/ (accessed April 5, 2022).
Tran, N., Chu, L., Chan, C. Y., Peart, J., Nasr-Allah, A. M., Charo-Karisa, H., et al. (2022). Prospects of fish supply-demand and its implications for food and nutrition security in Egypt. Mar. Policy 146, 105333. doi: 10.1016/j.marpol.2022.105333
Umar, M., Riaz, Y., and Yousaf, I. (2022). Impact of Russian-Ukraine war on clean energy, conventional energy, and metal markets: evidence from event study approach. Resour. Policy 79, 102966. doi: 10.1016/j.resourpol.2022.102966
UNDESA (2020). International Migrant Stock. United Nations Department of Economic and Social Affairs, Population Division. Available online at: https://www.migrationdataportal.org/regional-data-overview/western-africa (accessed 16 February, 2021).
United Nations: Department of Economics Social Affairs (2022). EVI Indicators. Available online at: https://www.un.org/development/desa/dpad/least-developed-country-category/evi-indicators-ldc.html (accessed May, 2022).
Wahba, S. M., Scott, K., and Steinberger, J. (2018). Analyzing Egypt's water footprint based on trade balance and expenditure inequality. J. Clean. Prod. 198, 1526–1535. doi: 10.1016/j.jclepro.2018.06.266
World Bank (2022a). Debt Service Suspension Initiative. Available online at: https://www.worldbank.org/en/topic/debt/brief/covid-19-debt-service-suspension-initiative (accessed March 10, 2022).
World Bank (2022b). Fertilizer Prices Expected to Remain Higher for Longer. Available online at: https://blogs.worldbank.org/opendata/fertilizer-prices-expected-remain-higher-longer (accessed May 1, 2022).
World Data Atlas (2018). Egypt - Expenditures Spent on food. Available online at: https://knoema.com/atlas/Egypt/topics/Food-Security/Expenditures-Spent-on-Food/Expenditures-spent-on-food (accessed December, 2022).
Yigezu, A. Y., Abbas, E., Swelam, A., Sabry, S. R. S., Moustafa, M. A., Halila, H., et al. (2021a). Socioeconomic, biophysical, and environmental impacts of raised beds in irrigated wheat: a case study from Egypt. Agric. Water Manag. 249, 106802. doi: 10.1016/j.agwat.2021.106802
Yigezu, Y. A., Moustafa, M. A., Mohiy, M. M., Ibrahim, S. E., Ghanem, W. M., Niane, A.-A., et al. (2021b). Food losses and wastage along the wheat value chain in egypt and their implications on food and energy security, natural resources, and the environment. Sustainability 13, 10011. doi: 10.3390/su131810011
Keywords: climate, food security, wheat, COVID-19, production, consumption, vulnerability, malnutritions
Citation: Gebeltová Z, Hálová P, Malec K, Bartoňová K, Blažek V, Maitah M, Koželský R, Phiri J, Appiah-Kubi SNK, Tomšík K, Severová L and Marušiak J (2023) Geopolitical risks for Egypt wheat supply and trade. Front. Sustain. Food Syst. 7:1137526. doi: 10.3389/fsufs.2023.1137526
Received: 04 January 2023; Accepted: 13 March 2023;
Published: 04 April 2023.
Edited by:
Ruilian Zhang, The University of Queensland, AustraliaReviewed by:
Mohammad Shokati Amghani, Tarbiat Modares University, IranCopyright © 2023 Gebeltová, Hálová, Malec, Bartoňová, Blažek, Maitah, Koželský, Phiri, Appiah-Kubi, Tomšík, Severová and Marušiak. This is an open-access article distributed under the terms of the Creative Commons Attribution License (CC BY). The use, distribution or reproduction in other forums is permitted, provided the original author(s) and the copyright owner(s) are credited and that the original publication in this journal is cited, in accordance with accepted academic practice. No use, distribution or reproduction is permitted which does not comply with these terms.
*Correspondence: Mansoor Maitah, bWFpdGFoQHBlZi5jenUuY3o=
Disclaimer: All claims expressed in this article are solely those of the authors and do not necessarily represent those of their affiliated organizations, or those of the publisher, the editors and the reviewers. Any product that may be evaluated in this article or claim that may be made by its manufacturer is not guaranteed or endorsed by the publisher.
Research integrity at Frontiers
Learn more about the work of our research integrity team to safeguard the quality of each article we publish.