 Shiqin Peng
 Meifei Zhu
 Shanshan Li
 Xiaobin Ma
 Fuliang Hu
- 1College of Animal Sciences, Zhejiang University, Hangzhou, China
- 2Department of Food Chemistry and Technology, Teagasc Food Research Centre, Moorepark, County Cork, Ireland
Introduction: Propolis is a beneficial bioactive food with rich polyphenols content. Nowadays, an increasing interest is attracted to the extraction of polyphenols from raw propolis. This study utilized the novel ultrasound-assisted approach for polyphenol extraction from Chinese propolis, aiming to improve its extraction yield and reveal the relevant mechanisms via extraction kinetic study as well as the compositional and structural analysis.
Methods: The optimum ultrasound-assisted extraction conditions were optimized according to the total phenolic content and total flavonoids content. Compositional and structural analysis were conducted using high performance liquid chromatography-quadrupole-time of flight tandem mass spectrometry, high-performance liquid chromatography, Fourier-transform infrared spectroscopy (FT-IR) and scanning electron microscope (SEM).
Results and discussion: The optimum ultrasound-assisted extraction conditions were as follows: ratio of liquid to solid, 60:1; ultrasound power, 135 W; ultrasound duration, 20 min. Under the optimum conditions, the antioxidant activities of the extract were increased by 95.55% and 64.46% by 2,2-diphenyl-1-picrylhydrazyl radical scavenging ability assay and 2,2'-azino-bis (3-ethylbenzothiazoline-6-sulfonic acid) radical scavenging ability assay, respectively, compared to those obtained by traditional maceration. The second-order kinetics model was employed to study the extraction process; it was found that ultrasound significantly accelerated the extraction of propolis and increased the maximum extraction volume of phenolic compounds. The qualitative and quantitative analysis of polyphenol compositions showed that ultrasound did not change the polyphenol types in the extract but it significantly improved the contents of various flavonoids and phenolic acids such as galangin, chrysin, pinocembrin, pinobanksin and isoferulic acid. Likewise, the FT-IR analysis indicated that the types of functional groups were similar in the two extracts. The SEM analysis revealed that the ultrasound-assisted extraction enhanced the contact areas between propolis and ethanol by breaking down the propolis particles and eroding the propolis surface.
1. Introduction
Propolis, a functional food with various health benefits, is widely used in the manufacturing of candy, beverages, and nutrient supplements (Oses et al., 2016). In nature, it is collected by bees from plant spores or trunks and processed by secretions from maxillary glands and wax glands (Kurek-Gorecka et al., 2022). As a mixture of resin, wax, essential oil, bee pollen and other organic compounds (Kurek-Gorecka et al., 2022). Propolis from different plant origins, geographical origins and species of bees usually shows varied compositions (Cui et al., 2022). It can be divided into 5 types based on different plant origins: Populus, Baccharis, Clusia, Macaranga and Mediterranean (Cui et al., 2022). Populus-type propolis is the most widely distributed all over the world (especially in the temperate zone) with main origins including China, Canada and Australia (Bankova, 2005). The main bioactive compound in Populus-type propolis is polyphenols (Cui et al., 2022). As a family of bioactive organic compounds with one or more hydroxyl groups attached to aromatic rings, polyphenols can be divided into flavonoids, phenolic acids, stilbenoids, and lignans according to their chemical structures (Samec et al., 2021). According to our previous research (Zhang et al., 2014), flavanols without B-ring substituents [e.g. caffeic acid phenethyl ester (CAPE), chrysin, galangin, pinobanksin and pinocembrin] are the predominant bioactive compounds in Populus-type propolis, which have revealed valuable pharmacological activities such as the antioxidant (Shao et al., 2021), anti-inflammatory (Olgierd et al., 2021), antibacterial (Jin et al., 2022) and anticancer activities (Jiang et al., 2020b).
To maximize the health benefits of Populus-type propolis, an increasing interest is attracted to the extraction of polyphenols from raw propolis in recent years. The most commonly-used extraction method is maceration extraction, where the extraction yield and productivity mainly depend on the type of solvents and the conditions of extraction (e.g. extraction duration, temperature and extraction times) (Stanciauskaite et al., 2021). However, because of the prolonged extraction time and the high consumption of chemical solvents, maceration extraction is gradually replaced by the novel extraction methods such as ultrasound-assisted extraction (Xu et al., 2021), microwave-assisted extraction (Hamzah and Leo, 2015) and supercritical CO2 extraction (Saito et al., 2020). Amongst these methods, ultrasound-assisted extraction has shown unique advantages such as the short processing time, high extraction yield and low maintenance cost (Xu et al., 2021) and thereby has become a research interest in recent years.
Ultrasound is the sound waves with a frequency higher than 20 kHz (Wen et al., 2018). During the ultrasound-assisted extraction, the energy transferred to the solvent induces the formation, growth, and collapse of cavitation bubbles, resulting in high-velocity inter-particle collisions and perturbation in microporous particles as well as the accelerated eddy and internal diffusions (Chemat et al., 2017). These mechanical effects of ultrasound in turn cause the breakdown of particles, peeling and erosion phenomena and hence, the improved extraction rate and yield (Shirsath et al., 2012; Oroian et al., 2020b). However, high-intensity ultrasound could also induce the formation of various free radicals, which could react with polyphenols (e.g. quercetin) leading to numerous undesirable reactions such as oxidation, addition, polymerization and decomposition (Liao et al., 2015). Therefore, it is important to optimize the ultrasound conditions during polyphenol extraction.
Despite the effectiveness of ultrasound in bioactive compounds extraction, very few studies have applied ultrasound to the extraction of polyphenols from propolis. Oroian et al. (2020a) applied an ultrasonic bath to the extraction of the Romania propolis (a Populus-type propolis) and optimized the extraction conditions by Box-Behnken design experiments. It was found that the highest extraction yield was obtained at an ultrasound power of 100 W, 70% solvent concentration and 58°C for 30 min. However, the extraction process using the probe sonicator is not reported yet. Besides, recent studies in this field mainly focus on the extraction yield of propolis, while little information can be found on the antioxidant activity and structural properties of propolis extracts. In order to establish an ultrasound-assisted method using a probe sonicator and fill up the knowledge gap of the antioxidant/structural properties of propolis extracts, the solid-to-liquid ratio, ultrasound power and ultrasound duration were optimized according to the total phenolic content (TPC) and total flavonoids content (TFC) of the extracts using a probe sonicator. Kinetic studies were carried out to illuminate the relevant mechanisms of ultrasound extraction. Furthermore, to reveal the techno-functional advantages of ultrasound extraction, the qualitative and quantitative analysis of the polyphenol compositions, primary structures and microstructures of the propolis extracts obtained by the traditional maceration and ultrasound extraction were investigated and compared, with the aid of high performance liquid chromatography (HPLC), high performance liquid chromatography-quadrupole time of flight mass spectrometry (HPLC-Q-TOF-MS/MS), Fourier-transform infrared spectroscopy (FTIR) and scanning electron microscope (SEM).
2. Materials and methods
2.1. Materials
Chinese raw propolis was provided by Jiangsu Beevip Biotechnology Co., Ltd (Jiangsu, China). Folin ciocalteu's phenol reagent was purchased from Shanghai Yuanye Bio-Technology Co., Ltd (Shanghai, China). Methanol and acetic acid were of HPLC grade and supplied by Sigma Aldrich (St. Louis, MO, USA). Standards including gallic acid, rutin, caffeic acid, p-coumaric acid, ferulic acid, 3,4-dimethoxycinnamic acid, pinobanksin, naringenin, quercetin, kaempferol, apigenin, pinocembrin, caffeic acid benzyl ester, chrysin, CAPE and galangin were of HPLC grade and obtained from Sigma Aldrich (St. Louis, MO, USA).
2.2. Maceration extraction of propolis
The raw propolis was crushed by a grinder and screened by a 20-mesh sifter to obtain the propolis powder, which was then dissolved in 40 mL of 80% ethanol at ratios of 1:20, 1:40, 1:60, 1:80 and 1:100 (w/v), respectively. The propolis samples were leached at 40°C for 20 min and centrifuged at 8800 rpm for 10 min. After that, the ethanol extracts were kept at 4°C for 12 h and centrifuged at 8800 rpm for 10 min to ensure the removal of beeswax. The final solution was collected for further analysis.
2.3. Ultrasound-assisted extraction of propolis
Ultrasound treatment was carried out on a probe sonicator with a maximum output power of 900 W and an operating frequency of 22 kHz (JY92-IIDN, Ningbo Scientz Biotechnology Co., Ningbo, China). Propolis and 80% ethanol (1:60, w/v) were mixed in a cylinder reactor with external circulation. Then, ultrasound probe with a diameter of 6 mm was immersed in the solutions at a depth of 2 cm. Temperature of the system was kept at 40°C by a low-temperature thermostat bath (DC1006, Team win, China). After subjected to different ultrasound powers (0, 45, 90, 135, 180, 225, and 270 W) and durations (0, 5, 10, 15, 20, and 25 min), the resulting mixture was centrifuged at 8800 rpm for 10 min and the supernatant was collected. The ethanol extracts were kept at 4°C for 12 h and then centrifuged at 8800 rpm for 10 min to ensure the removal of beeswax. The final solution was collected for further analysis.
2.4. Measurement of TPC
TPC was determined by a modified Folin-Ciocalteau method (Ainsworth and Gillespie, 2007). Briefly, 120 μL of samples were mixed with 800 μL of 1 M Folin-Ciocalteau reagent. After incubating for 1 h in dark, 72 μL of 1 M sodium bicarbonate were added and the mixture was kept for another 15 min in dark. The absorbance of the mixture was measured at 765 nm using a BioTek Synergy HTX multimode microplate reader (BioTek Instruments, Inc., German). Gallic acid was used as a standard at the concentration ranging from 0 to 200 μg/mL. The results were expressed as “mg gallic acid/g”.
2.5. Measurement of TFC
TFC was determined by an aluminum ion chromogenic method with slight modifications (Zhang et al., 2017). Briefly, 100 μL of samples were mixed with 30 μL of 10% aluminum nitrate. After standing for 6 min, 30 μL of 5% sodium nitrite was added and kept for another 6 min. Then, 400 μL of 4% sodium hydroxide and 440 μL of 80% ethanol were added. The absorbance of the mixture was measured at 510 nm using a BioTek Synergy HTX multimode microplate reader (BioTek Instruments, Inc., German). Rutin was used as a standard at the concentration ranging from 0 to 1000 μg/mL. The results were expressed as “mg rutin/g”.
2.6. Assay of the antioxidant activities
2.6.1. The 2,2-diphenyl-1-picrylhydrazyl (DPPH) radical scavenging ability assay
The DPPH assay was conducted as described by Taheri et al. (2014). DPPH stock solution was dissolved in ethanol at a concentration of 3 mg/mL and stored at 4°C. The stock solution was then diluted with ethanol to achieve an absorbance of 0.70 ± 0.02 at 517 nm to obtain the DPPH working solution. Subsequently, 100 μL of samples were mixed with 100 μL of DPPH working solution and the mixture was incubated for 15 min at room temperature in dark. The absorbance was measured at 517 nm using a BioTek Synergy HTX multimode microplate reader (BioTek Instruments, Inc., German). Trolox was used as a standard and the results were expressed as “mg trolox/g”.
2.6.2. The 2,2'-azino-bis (3-ethylbenzothiazoline-6-sulfonic acid) (ABTS) radical scavenging ability assay
The ABTS assay was determined as reported by Chen et al. (2016) with some modifications. Briefly, 176 μL of 140 mM potassium persulfate were mixed with 10 mL of 7 mM ABTS and the mixture was kept in dark for 16–24 h to obtain ABTS stock solution. It was then diluted with ethanol to achieve an absorbance of 0.70 ± 0.02 at 734 nm to obtain the ABTS working solution. Subsequently, 20 μL of samples were mixed with 180 μL of ABTS working solution and the mixture was incubated for 2 min at room temperature in dark. The absorbance was measured at 734 nm using a BioTek synergy HTX multimode microplate reader (BioTek Instruments, Inc., German). Trolox was used as a standard and the results were expressed as “mg trolox/g”.
2.7. Extraction kinetic study
The solid-liquid extraction procedure of bioactive compounds was supposed to abide by the second-order kinetics mode (Yang et al., 2019; Natolino and Porto, 2020; Fu et al., 2021), where the dissolution rate of the extract can be described as follows (Bhadange et al., 2022):
where Ct is the TPC or TFC of the extract at a specific time t (mg mL−1), Cs is the saturated total phenolic or flavonoid concentration (mg mL−1), and k is the rate constant of extraction processes (mL mg−1 s−1).
Under the boundary conditions (t = 0 to t and Ct = 0 to Ct), the equation (1) could be integrated and rearranged as follows:
where h is the initial extraction rate where t and Ct approach 0 (mg mL−1 s−1). The k, Cs and h could be determined from the linear fitting curve of t/Ct vs. t.
2.8. HPLC- Q-TOF-MS/MS and HPLC analysis
The compositions of propolis extracts were qualitatively analyzed by AB Sciex Triple TOF 5600+ series (AB Sciex, USA). The HPLC analysis was conducted according to our previous study (Jiang et al., 2020a). Briefly, the propolis sample was dissolved in methanol at 5 mg/mL and filtered through a 0.22 μm membrane for further analysis. Separation was carried out on the Sepax HP-C18 column (150 mm*4.6 mm, 5μm) at 30°C with a detection wavelength of 310 nm. The injection volume was 2 μL and the flow rate was 1 mL/min. A solvent system consisting of solvent A (methanol) and solvent B (ddH2O with 0.1% acetic acid) was used with the following gradient: 0 min, 25%A; 30 min, 55%A; 60 min, 80% A; 70 min, 95% A; 80 min, 25% A. The samples were detected at 280 nm. For MS/MS detection, the negative mass spectroscopy conditions were as follows: nitrogen gas was used as drying gas with a flow of 9 L/min at 350°C. The nebulizer was set at 35 psi. The ion spray voltage floating and collision energy was set at 4000 V and 135 V, respectively. The mass range was from 100 Da to 1000 Da.
The compositions of propolis extracts were quantitatively analyzed by Agilent 1200 Series system (Agilent Technologies, USA) according to the HPLC analysis procedures as described above. Caffeic acid, p-coumaric acid, ferulic acid, isoferulic acid, 3,4-dimethoxycinnamic acid, pinobanksin, naringenin, quercetin, kaempferol, apigenin, pinocembrin, caffeic acid benzyl ester, chrysin, CAPE and galangin were dissolved in methanol as standards.
2.9. FT-IR analysis
The propolis samples were measured using a Nicolet 5700 FT-IR spectrometer (Thermo Fisher Scientific, MA, USA) with a frequency range of 4000–400 cm−1 at a resolution of 4 cm−1 for 32 scans. The result was recorded by Omnic 9.0 (Nicolet, MA, USA).
2.10. SEM analysis
The surface morphology of propolis samples was measured by a high-resolution field emission SEM (SU8010, Hitachi, Japan) at an acceleration voltage of 3 kV. Briefly, after samples were fixed on a conductive adhesive tape, gold was sprayed on the surface in a vacuum environment. The morphology of samples was observed at magnifications of 1000×.
2.11. Statistic analysis
All experimental data were presented as mean ± standard deviation (SD) of data in triplicate. The significant differences between different treatments (P < 0.05) were determined by Duncan's multiple range test in one-way ANOVA using SPSS statistical software (IBM corporation, NY, USA). Graphs were plotted using Prism software (GraphPad Software, CA, USA).
3. Results and discussion
3.1. Effects of the liquid-to-solid ratio on the extraction yield and antioxidant activities of propolis extracts
In a cost-efficiency industrial process, it is important to maximize the extraction yield while minimizing the consumption of solvent (Xie et al., 2019). Meanwhile, a proper liquid-to-solid ratio is also essential for accelerating the extraction process as well as achieving a high extraction yield. As Chinese propolis consists of 13.99–55.63% of polyphenols and 6.34–45.49% of flavonoids (Jiang et al., 2020a), in this study, the TPC and TFC were used as indicators for the extraction yield of propolis. Figures 1A, B show the TPC and TFC of the propolis extracts with the liquid-to-solid ratio ranging from 20:1 to 100:1 (v/w), respectively. As shown in Figure 1, when the liquid-to-solid ratio was increased from 20:1 to 60:1, both TPC and TFC of propolis extract were elevated, achieving the maximum values of 54.91 ± 0.24 mg gallic acid/g and 191.26 ± 2.96 mg rutin/g, respectively, possibly attributed to the increased contact areas between ethanol and propolis (Mousavi et al., 2022). However, when the liquid-to-solid ratio was increased from 60:1 to 100:1, the TPC was slightly decreased while the TFC almost remained unchanged, which indicated that the enhancement of the solvent did not increase the dissolution of the target product when the propolis-to-liquid ratio reached to a specific value (Mousavi et al., 2022). Similar variation trends toward different liquid-to-solid ratios were also observed for the extraction processes of green tea (Luo et al., 2020) and passion fruit (Wang et al., 2021). In this study, a liquid-to-solid ratio of 60:1 proved an optimum extraction ratio.
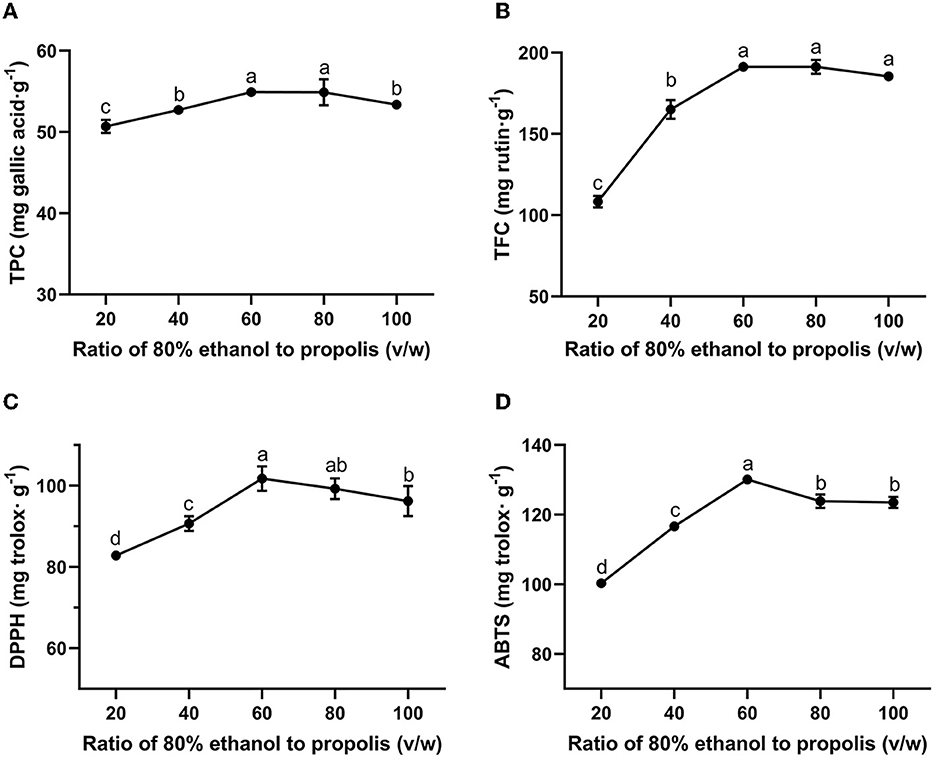
Figure 1. Effect of liquid-to-solid ratio on TPC (A), TFC (B) of propolis extracts and their antioxidant activities meassured by DPPH (C) and ABTS (D) assays. Different superscripts indicate significant differences as estimated by Duncan's multiple range test (P < 0.05).
Figures 1C, D show the antioxidant activity of the propolis extracts at different liquid-to-solid ratios as assessed by DPPH and ABTS assay, respectively. The radical scavenging ability of the extracts at different liquid-to-solid ratios can be seen to show a similar variation trend compared to those of the TPC and TFC. The correlation among TPC, TFC and antioxidant activities was also evaluated by Pearson's correlation analysis. Strong positive correlation was found in TPC, TFC, DPPH and ABTS with the correlation coefficient ranging from 0.875 to 0.969 (Supplementary Table S1). These results showed that the higher the content of bioactive ingredients, the stronger the antioxidant activity (Yang et al., 2023). A previous study suggested that polyphenols were the major bioactive components in propolis to exert antioxidant activity (Jiang et al., 2020a). In addition to polyphenols, some other constituents in propolis also show antioxidant activity, such as the hydrocarbon (Chi et al., 2020) and amyrin (Kocot et al., 2018). Therefore, these substances in propolis extract together contributed to the antioxidant activity of propolis in this study. The maximum antioxidant activities as assessed by DPPH and ABTS assays were obtained at a liquid-to-solid ratio of 60:1 and determined to be 101.77 ± 3.03 mg trolox/g and 130.12 ± 0.83 mg trolox/g, respectively. Similarly, antioxidant activity was also observed in Beijing propolis: 75% ethanol extract from propolis was considered as the strongest antioxidant, with 142.18 μg trolox/g as measured by the DPPH assay and 150.00 μg trolox/g as measured by the ABTS assay (Sun et al., 2015).
3.2. Effects of the ultrasound power on the extraction yield and antioxidant activities of propolis extracts
Ultrasound-assisted extraction is regarded as a green and efficient extraction method which can enhance the yield of bioactive compounds by destroying the structure of target food matrices (Liao et al., 2021). Theoretically, ultrasound could improve local energy dissipation and enhance mass transfer, improving the diffusion of target products in the processing system (Oroian et al., 2020b). The mechanical shear forces and free radicals generated from cavitation could destroy the structures of the raw materials, which could enhance the exposure of more bioactive compounds and in turn, lead to a steadier extraction process (Liao et al., 2021). As a crucial factor that determines the cavitation effects of ultrasound, ultrasound intensity plays a vital role in determining the extraction yield. As illustrated in Figure 2, the extraction yield of propolis differed at different ultrasound powers ranging from 0 to 225 W. As the ultrasound power increased from 0 to 135 W, the TPC and TFC increased by 26.38 and 94.42%, respectively. In a certain range of energy input, the increased ultrasound power and the subsequent more intense cavitation phenomenon would amplify the destructive effect on propolis matrices and improve the diffusion of phenolic compounds, resulting in an elevated extraction yield (Liu et al., 2022). In this study, the highest TPC and TFC values were observed at an ultrasound power of 135 W, beyond which the TPC and TFC turned to a slight decrease. This could be attributed to the degradation of polyphenols with excessive energy input (Liao et al., 2015). In addition, large numbers of free radicals generated from intense ultrasound conditions could induce the degradation of polyphenols, resulting in decreased TPC and TFC (Wang et al., 2020). Furthermore, an energy attenuation effect would also take place under an intense ultrasonic field, which entrained too much air into the reactor leading to lowered cavitational activity (Ugarte-Romero et al., 2007). These trends were in agreement with the previous studies on ultrasound extraction of flavonoids from Sophora japonica (Liao et al., 2015) and punicalagin from pomegranate peel (Liu et al., 2022). Liu et al. (2022) reported that the extraction yield of punicalagin was increased as the ultrasound power was increased from 500 to 650 W, and then decreased with further power input.
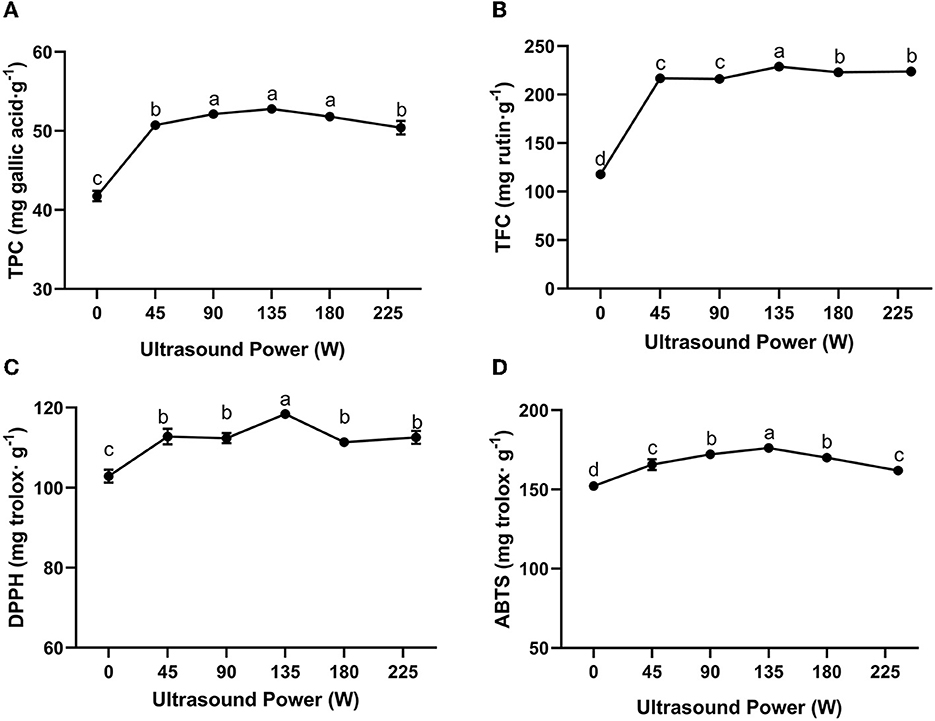
Figure 2. Effect of ultrasound power on TPC (A), TFC (B) of propolis extracts and their antioxidant activities meassured by DPPH (C) and ABTS (D) assays (extraction time: 20 min). Different superscripts indicate significant differences as estimated by Duncan's multiple range test (P < 0.05).
Figures 2C, D show the antioxidant activity of the propolis extracts at different ultrasound powers as assessed by DPPH and ABTS assay, respectively. Following a similar trend, the DPPH and ABTS radical scavenging abilities were increased when the ultrasound power was increased from 0 to 135 W, and achieved the maximum values of 118.45 ± 0.35 mg trolox/g and 175.18 ± 0.71 mg trolox/g, respectively. Our result was related to previous study. Yuan et al. (2019) reported that in the extraction of raw propolis of same weight, ultrasound extraction yielded more bioactive compounds with much higher antioxidant activities. As mentioned above, these phenomena were attributed to a series of mechanical and free radical effects generated from ultrasound cavitation. In conclusion, the optimum ultrasound power for the extraction of propolis was 135 W.
3.3. Effects of ultrasound duration on the extraction yield and antioxidant activities of propolis extracts
The extraction yield of propolis at an ultrasound power of 135 W for different times ranging from 0 to 40 min is shown in Figure 3. The TPC and TFC of ultrasound-assisted extracts were significantly higher than those of traditional maceration extracts at each treatment time, indicating that ultrasound significantly accelerated the extraction of polyphenols from propolis. As ultrasound duration was increased from 0 to 20 min, the TPC and TFC were increased by 84.16 and 67.13%, respectively. An increased ultrasound duration could further soften and disrupt structures of propolis, which in turn enhanced solvent diffusion into propolis and contributed to higher TPC and TFC (Zainal et al., 2021; Mousavi et al., 2022). However, when the duration increased from 20 min to 30 min, TPC only increased by 2.74%, while TFC kept unchanged; when the duration further increased to 40 min, TPC kept unchanged, while TFC significantly reduced. This trend was consistent with the ultrasound extraction of Romania propolis, where the TFC and TPC were increased in the first 30 min and then slightly decreased in the following 15 min (Oroian et al., 2020a). These results indicated that a proper treatment time is important for bioactive compound extraction. As supported by previous studies (Liao et al., 2015; Liu et al., 2022), the prolonged ultrasound duration can lead to the degradation of flavonoids and phenolic acids resulting in a decreased yield. Similar observations were reported for the ultrasound extraction of punicalagin from pomegranate peel (Liu et al., 2022), where the punicalagin yield was significantly increased as the ultrasound duration increased from 0 min to 30 min, and then decreased from 30 to 50 min.
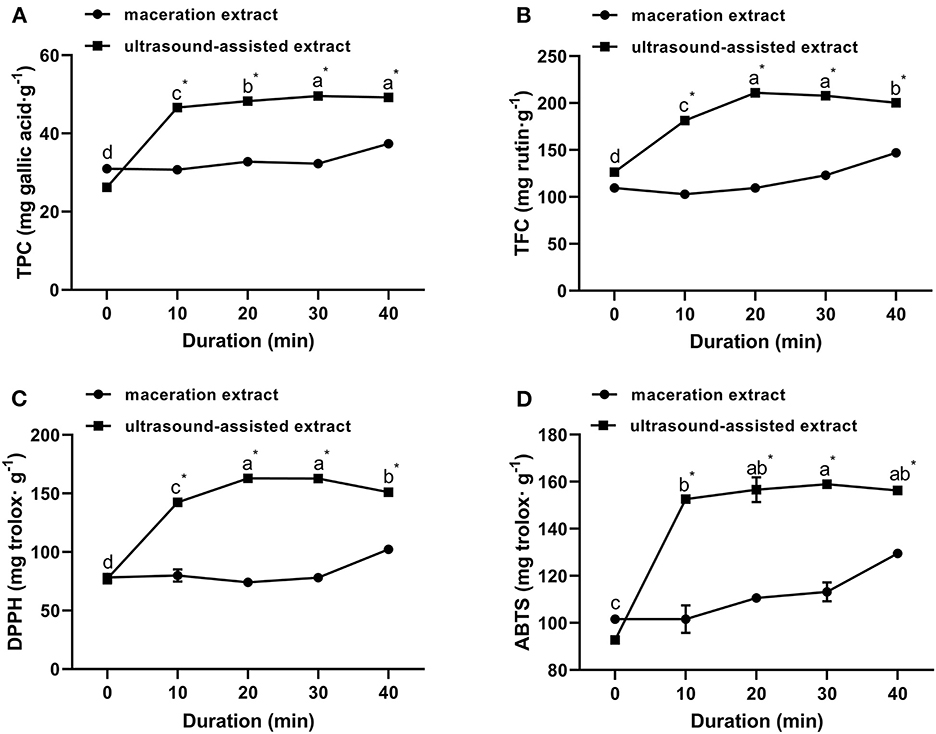
Figure 3. Effect of ultrasound duration on TPC (A), TFC (B) of propolis extracts and their antioxidant activities meassured by DPPH (C) and ABTS (D) assays (ultrasound power: 135 W). Different superscripts on the same curve indicate significant differences as estimated by Duncan's multiple range test (P < 0.05); “*” indicates significant difference as estimated by Duncan's multiple range test (P < 0.05) between maceration extract and ultrasound extract.
Effects of ultrasound duration on DPPH and ABTS radical scavenging activities are shown in Figures 3C, D. When the ultrasound duration was increased from 0 to 20 min, the DPPH and ABTS radical scavenging abilities were increased and achieved the maximum values of 162.99 ± 0.35 mg trolox/g and 156.59 ± 5.28 mg trolox/g, respectively. Afterwards, the decline in antioxidant activity of propolis extracts at longer ultrasound duration (20–40 min) was possibly due to the degradation of flavonoids and phenolic acids in propolis (Liao et al., 2015; Liu et al., 2022). Similar results were reported for the ultrasound-assisted extraction of Ferulago angulate and their antioxidant activity (Mousavi et al., 2022). Considering the productivity, the ultrasound duration for extraction of propolis was selected at 20 min.
3.4. Extraction kinetic study
In order to investigate the relevant mechanisms of ultrasound-assisted extraction, kinetic studies of extraction processes were carried out. Figure 4 shows the second-order extraction kinetics of propolis with maceration and ultrasound-assisted extraction and Table 1 lists the corresponding saturated concentration (Cs), initial extraction rate (h), rate constants (k) and the correlation coefficients (R2). As can be seen, the extraction yield of phenolic compounds during both maceration and ultrasound-assised extraction fitted well with the second-order rate model with all correlation coefficients higher than 0.96. The Cs of TPC and TFC in ultrasound-assisted extraction were 41.49 and 36.07% higher than those in maceration extraction, indicating that the ultrasound treatment could promote the dissolution of more bioactive compounds (Fu et al., 2021). Furthermore, as shown in Table 1, h and k of TPC and TFC were also significantly increased with ultrasound treatment, which demonstrated a remarkably higher extraction rate under an ultrasonic field. The similar results were also observed for catechin extraction from Syzygium cumini, where the values of h and k of the extraction conducted in an ultrasound bath was 461.20 and 37.70% higher than in a stirred reactor (Bhadange et al., 2022). In conclusion, ultrasound could accelerate the extraction process as well as promote the dissolution of target components, leading to a higher yield of target products (Zainal et al., 2021; Mousavi et al., 2022).
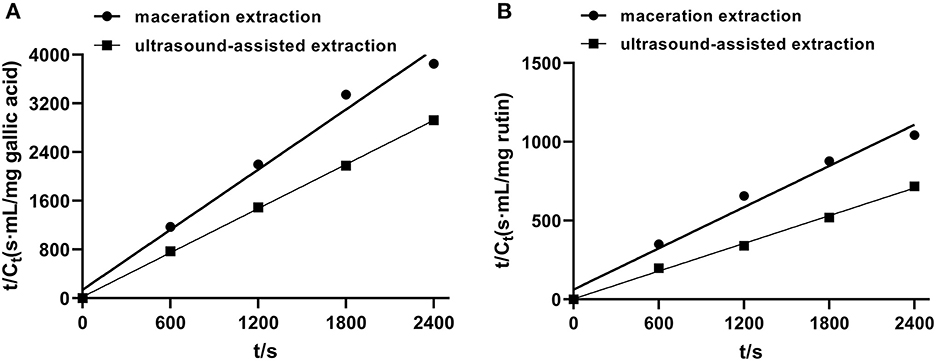
Figure 4. The second-order extraction kinetics of propolis extraction with maceration and ultrasound-assisted approach. (A) TPC; (B) TFC.
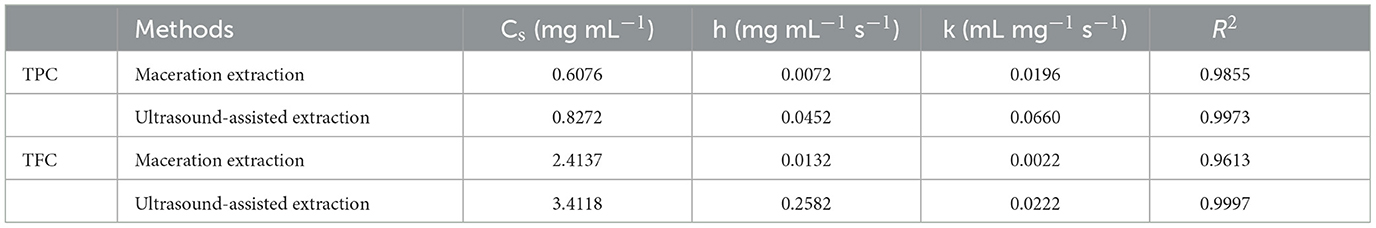
Table 1. Parameters of the second-order rate model of propolis extraction with maceration and ultrasound-assisted extraction.
3.5. Qualitative and quantitative analysis of phenolic compounds in propolis extracts
As mentioned above, the strong antioxidant activity of propolis mainly depends on its abundant polyphenol contents (Jiang et al., 2020a). Flavonoids and phenolic acids are the most prevalent polyphenol compounds in the Chinese propolis. The basic structure of flavonoids is a C6-C3-C6 unit, including a benzoic ring and a phenylpropane (Kurek-Górecka et al., 2013). In this study, HPLC-Q-TOF MS/MS was carried out to qualitatively analyze the unknown flavonoids and phenolic acids in propolis. Figure 5 shows the total ion chromatogram of the maceration extract and the ultrasound extract, and Table 2 summarizes the main polyphenols in the propolis extract. The fragment ion peaks and retention times of compounds 1–5, 7–11 and 13–14 were consistent with standards, which were identified as caffeic acid, p-coumaric acid, ferulic acid, isoferulic acid, 3.4-dimethoxycinnamic acid, naringenin, kaempferol, apigenin, pinocembrin, caffeic acid benzyl ester, CAPE and galangin. A fragment ion peak at [m/z]− 253 that corresponds to [M-H2O]− was considered the typical fragment ion peak of pinobanksin (Gardana et al., 2007). For compound 6, the ion fragments at [m/z]− 267 of [M-H2O]− and [m/z]− 253 of [M-H2O-CH3]− were captured, which were identified as pinobanksin-5-methyl-ether. In previous research, pinobanksin-5-methyl-ether was also identified in Italy propolis (Gardana et al., 2007) and Chinese red propolis (Zhang et al., 2022). Compound 12 could be assigned as pinobanksin-3-O-acetate due to the ion fragments with [m/z]− 271 of [M-COOH]− and [m/z]− 253 of [M-H2O-COOH]−, which was also reported to have been detected in Chinese propolis (Sun et al., 2015).
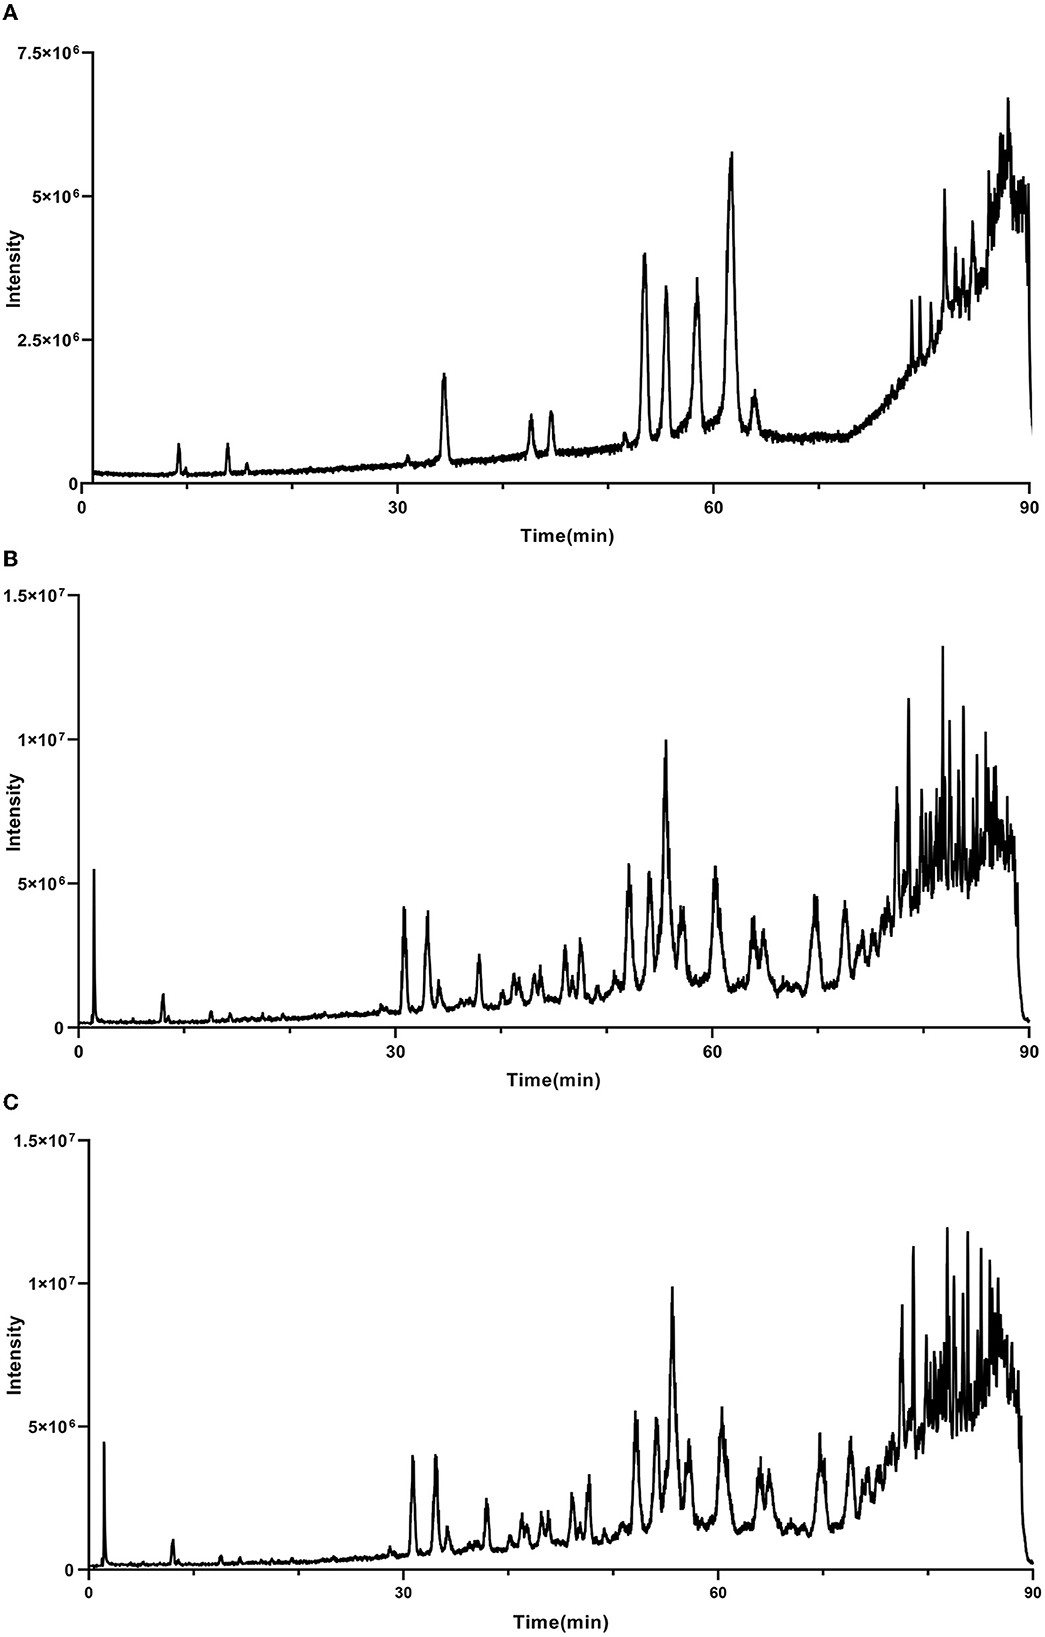
Figure 5. Total ion chromatogram of maceration extract and ultrasound extract. (A) Standard; (B) maceration extract; (C) ultrasound extract.
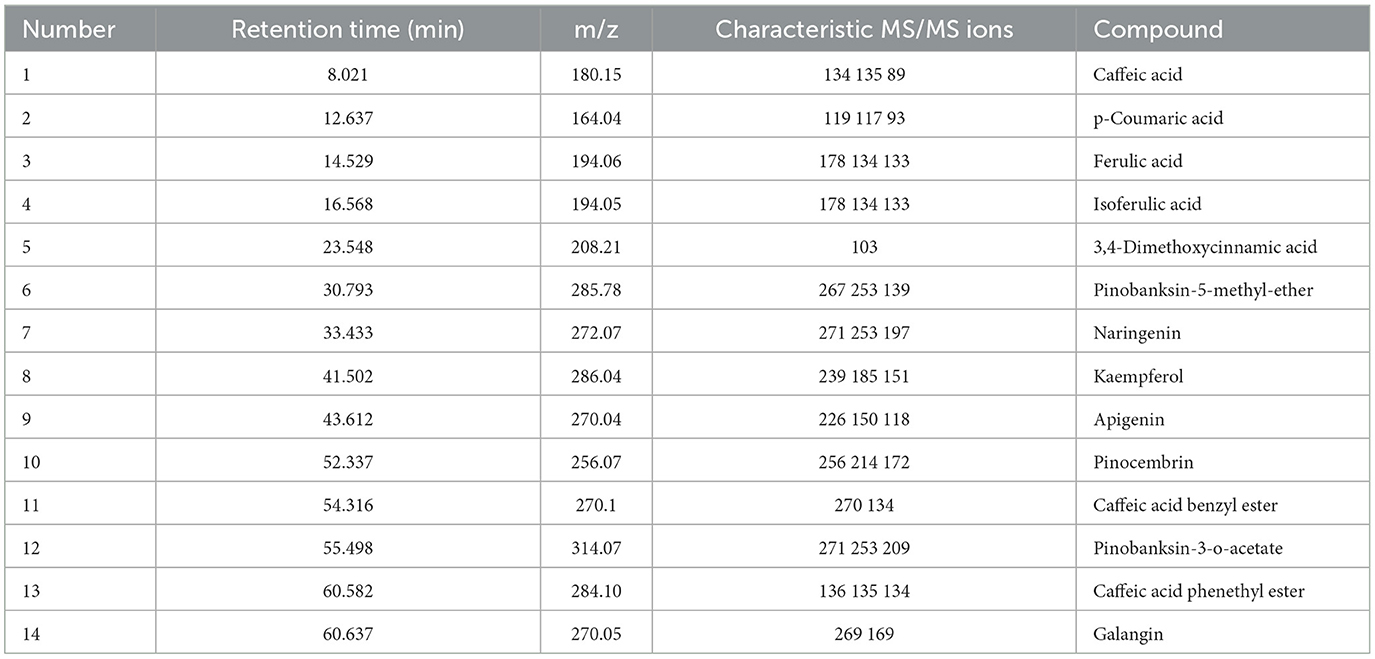
Table 2. Ion fragment parameters of propolis extraction.
In addition to the qualitative analysis, HPLC was also applied to provide a quantitative analysis of the contents of polyphenols in propolis extracts. The HPLC chromatograms of propolis compositions of the propolis extracts prepared with maceration or optimized ultrasound treatment are shown in Figure 6, and the contents of phenolic compounds were calculated and are illustrated in Table 3. Based on the results of HPLC-Q-TOF MS/MS analysis, a total of 14 typical polyphenol standards were used for analysis. As shown in Figure 6, ultrasound treatment did not change the types of polyphenols in propolis, which was in line with the reported ultrasound extraction of phenolic compounds from fresh olives (Deng et al., 2017). Although sonochemistry effects were able to cause the degradation of polyphenols (Liao et al., 2015), the mild ultrasound conditions used in this study might just produce a small number of free radicals and thus minimized the negative effects. Furthermore, as shown in Table 3, it was notable that the contents of polyphenols in Chinese propolis were significantly increased by 17.29–29.06% in ultrasound extracts compared with those in maceration extracts, which was in line with their higher TFC and TPC as illustrated in Sections 3.2 and 3.3. As mentioned above, the collapse of cavitation bubbles caused agitation of the reagent in the reactor, which could enhance the mass transfer and increase the extraction yield (Shirsath et al., 2012). A similar phenomenon was also reported for the extraction of polyphenols from Picea abies bark, where the contents of p-coumaric acid in the ultrasound extract were increased by 617.07% compared with the maceration extract (Chmelová et al., 2020).
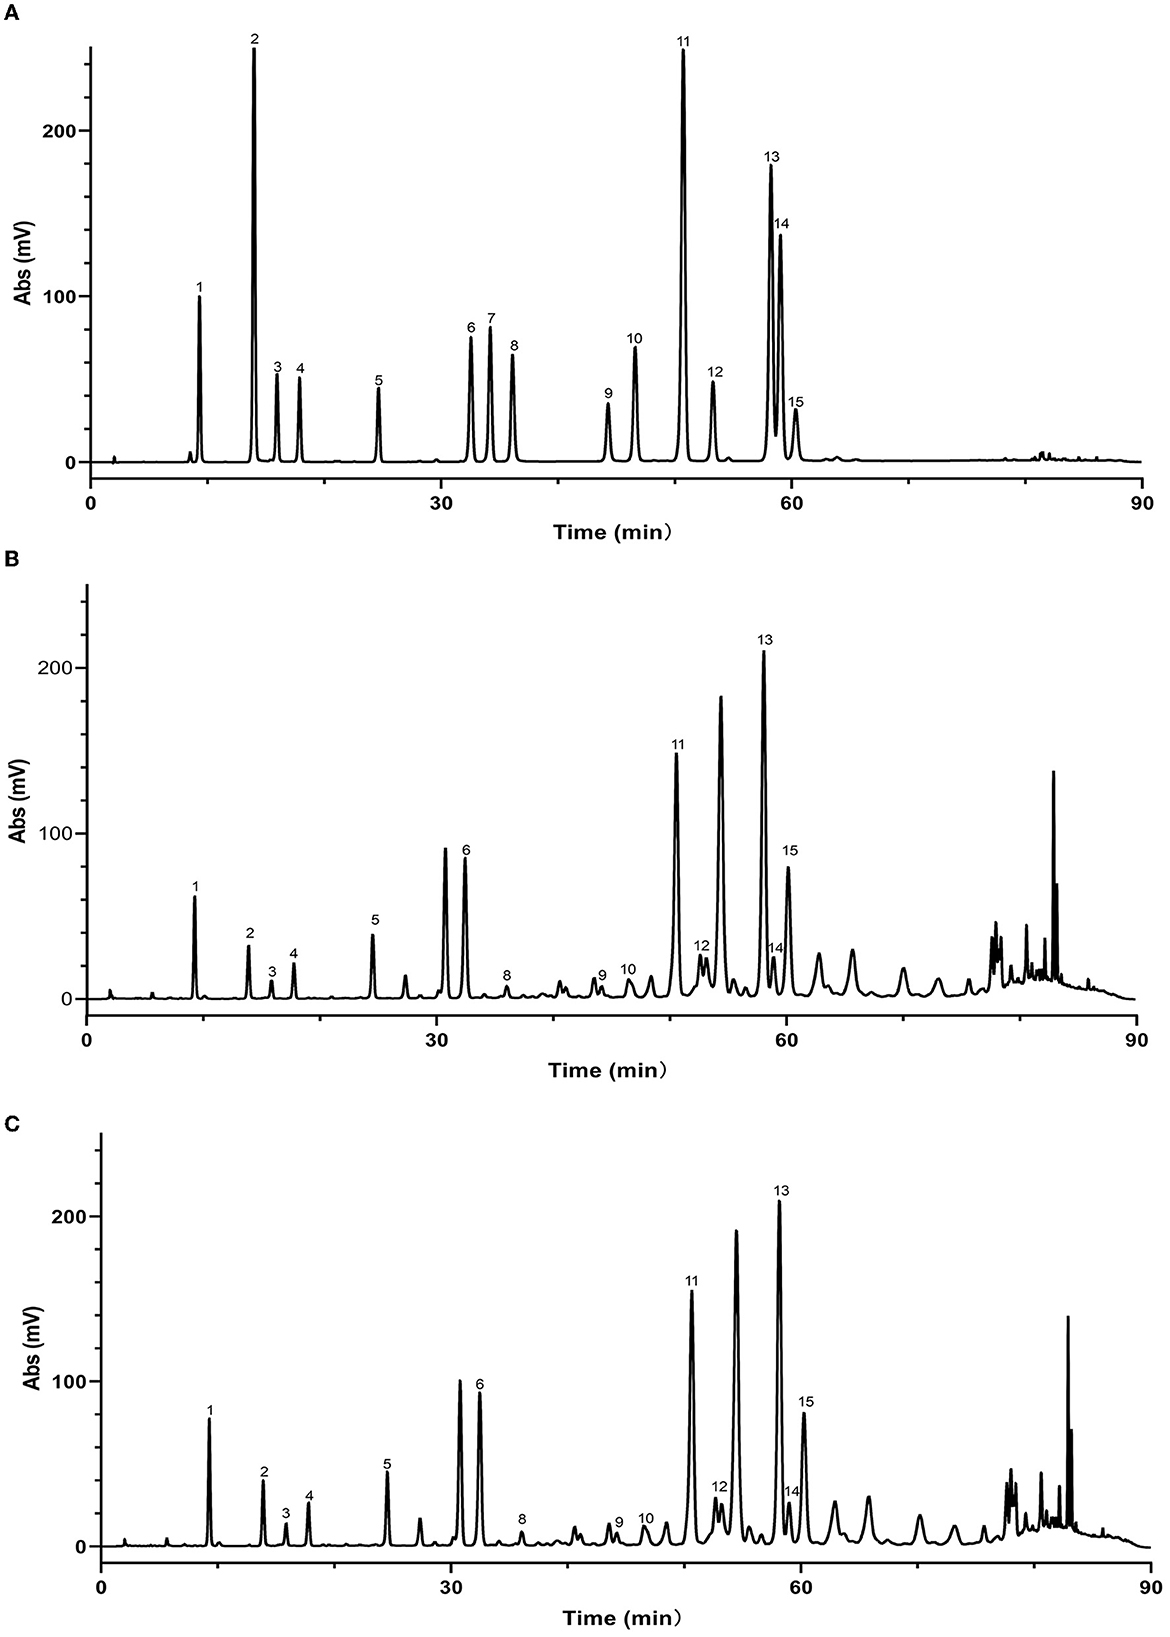
Figure 6. High performance liquid chromatograms of maceration extract and ultrasound extract. (A) Standard; (B) maceration extract; (C) ultrasound extract. 1. Caffeic acid; 2. p-Coumaric acid; 3. Ferulic acid; 4. Isoferulic acid; 5. 3,4-Dimethoxycinnamic acid; 6. Pinobanksin; 7. Naringenin; 8. Quercetin; 9. Kaempferol; 10. Apigenin; 11. Pinocembrin; 12. Caffeic Acid Benzyl Ester; 13. Chrysin; 14. Caffeic acid phenethyl ester; 15. Galangin.
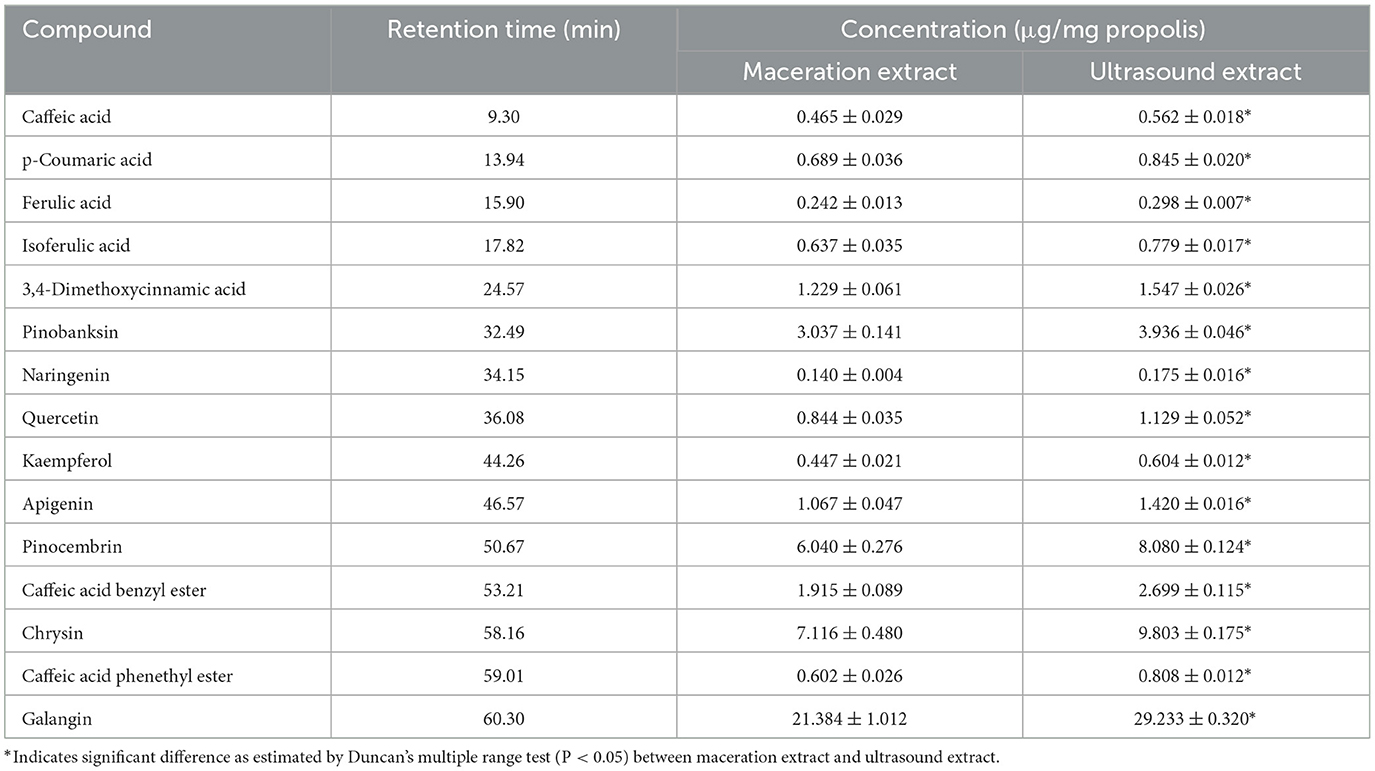
Table 3. The content of common compounds of maceration extract and ultrasound extract.
As shown in Table 3, galangin, chrysin and pinobanksin were the most abundant substances in propolis extract. The contents of galangin, chrysin and pinobanks in ultrasound extracts were 36.70, 29.60 and 37.76%, respectively, higher than in those in maceration extracts. The increase in the extraction yield of polyphenol monomers probably contributed to the enhancement of antioxidant activities in ultrasound extracts (as discussed in Section 3.3). Galangin is a kind of polyhydroxy flavone with a hydroxyl group located in positions 3, 5 and 7. During scavenging superoxide, the H atom from hydroxyl moieties located in position 3 and position 5 could associate with superoxide (Caruso et al., 2022). In addition, the antioxidant activity of galangin was proved in rodent models of cadmium-induced renal damage (Arab et al., 2022) and streptozotocin-induced diabetic cardiomyopathy in vitro (Abukhalil et al., 2021). Two kinds of derivatives of pinobanksin, i.e., pinobanksin-5-methylether and pinobanksin-3-o-acetate, were identified in propolis extract. The antioxidant mechanisms of pinobanksin include hydrogen atom transfer and electron transfer (Zheng et al., 2018). Besides, a previous study reported that pinobanksin derivatives which attached ester group with different alkyl chains also retained strong antioxidant activity (Zheng et al., 2018). The antioxidant ability of chrysin, the primary component of the propolis extract in this study, was attributed to substituents in ring A (Naz et al., 2019).
As shown in Table 3, ultrasound treatment significantly enhanced the extraction yield of polyphenols, indicating the great potential of ultrasound in producing highly-bioactive propolis extract.
3.6. FT-IR analysis
The FT-IR analysis was adopted to further identify the functional groups present in propolis extracts. As shown in Figure 7, a broad peak at 3,377 cm−1 for both ultrasound extract and maceration extract were correlated with -OH wagging which was particular to phenolic groups (Sillero et al., 2020; Bao et al., 2021). It is well known that the location and the number of -OH group determine the antioxidant capacity of polyphenols (Heim et al., 2002). Therefore, the wide and intense peak in propolis extract could be a reason for its strong antioxidant activities. The peak at 2925 cm−1 was assigned to the stretching vibration of C-H in aromatic methoxy groups, methyl and methylene groups of side chains (Sillero et al., 2020; Bao et al., 2021). The peak at 2851 cm−1 was attributed to C=O in aromatic rings (Heidari et al., 2019). Peaks at 1,640 cm−1, 1,513 cm−1 and 1,451 cm−1 were correlated with C=O stretching (Bao et al., 2021), C=C stretching vibration in aromatic rings (Heidari et al., 2019) and the vibration of aromatic skeleton (Sillero et al., 2020); their existence suggested that polyphenols are the main component of propolis extract. The peaks between 921 and 700 cm−1 were attributed to the vibrational modes of C-OH in carbohydrate (Laaroussi et al., 2023). Furthermore, the position of the peaks for the maceration and the ultrasound extracts did not show too much of a difference, indicating that the types of the functional groups were similar, which was in line with the HPLC analysis (Section 3.4). However, the slight differences in the intensities of some peaks were possibly due to the degradation of some components. Similar results were also observed for the FT-IR spectra of the bioactive compounds from blue butterfly pea flowers extracted by ultrasound and conventional methods (Mehmood et al., 2019).
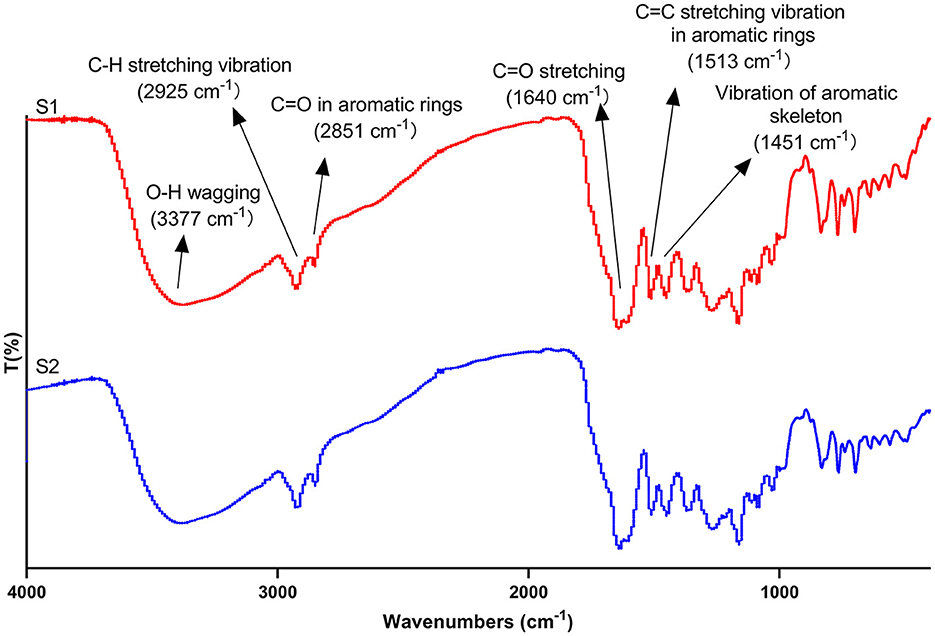
Figure 7. Fourier transform infrared spectroscopy spectra of maceration extract (S1) and ultrasound extract (S2).
3.7. Surface morphology of the extracts
In this study, SEM was used to assess the surface morphology of the propolis extracts and propolis residues obtained by maceration and ultrasound-assisted extraction. As shown in Figures 8A, B, compared to the maceration extract, the ultrasound extract showed smaller and more uniformly-distributed particles. Likewise, as shown in Figures 8c, d after maceration extraction, the surfaces of the residue powders were intact and relatively smooth; however, the powders were broken into smaller fragments after ultrasound-assisted extraction. This was attributed to the breakage of particles induced by ultrasound shear forces and instantaneous high pressures (Shirsath et al., 2012). Also, as shown in Figures 8b, d ultrasound cavitation also caused erosion on the surface of both the extracts and the residues, which could increase the contact area between the propolis surface and the solvent leading to a higher yield. Similar results were also observed for the SEM micrographs of ultrasound-extracted Millettia speciosa Champ (Zhao et al., 2017), where the Millettia speciosa Champ. powder was destroyed into smaller fragments after being treated with ultrasound at 500 W for 15 min.
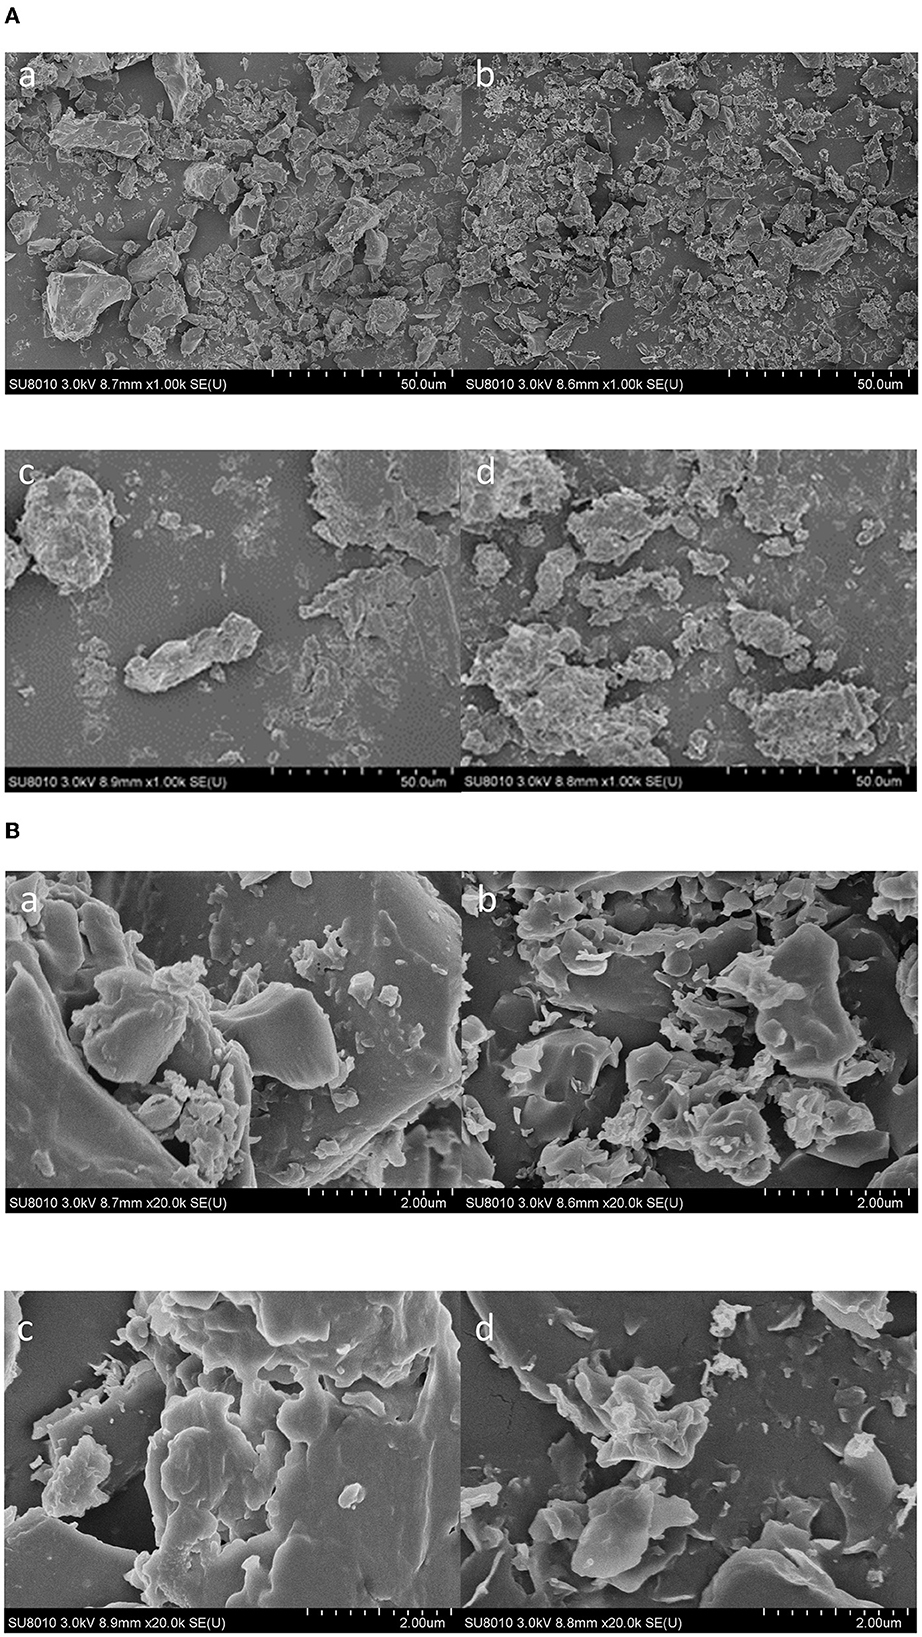
Figure 8. Scanning electron microscopy graphs of maceration extract (a), ultrasound extract (b), and propolis residues from maceration extraction (c) and ultrasound extraction (d) with the magnification of 1000× (A) and 20000× (B).
4. Conclusion
In summary, this study utilized the ultrasound-assisted approach to extract polyphenols from the Chinese propolis. The results showed that the highest TPC and TFC of the extract were obtained at a solid-to-liquid ratio of 60:1, an ultrasound power of 135 W, and an ultrasound duration of 20 min, where the extract also showed the highest antioxidant activities. The kinetic study showed that ultrasound significantly increased the saturated concentration (Cs), initial extraction rate (h) and rate constants (k) of the extraction process, indicating that ultrasound could not only accelerate the extraction process but also increase the maximum extraction volume of phenolic compounds. The qualitative analysis of phenolic compounds in propolis extracts demonstrated that ultrasound did not change the types of polyphenol compositions in the propolis extract; while the quantitative analysis revealed that the contents of polyphenols such as isoferulic acid, galangin, chrysin and pinocembrin in the ultrasound extract were much higher than those in the maceration extract. The FT-IR analysis indicated that the types of functional groups were similar in the two extracts. SEM analysis showed that ultrasound treatment led to the erosion on the surface of propolis and the breakdown of propolis particles, which were the possible mechanisms for the improved extraction yield. The results suggested that a mild ultrasound-assisted extraction is a promising approach for propolis extraction with high efficiency and short extraction time.
Data availability statement
The raw data supporting the conclusions of this article will be made available by the authors, without undue reservation.
Author contributions
Conceptualization and methodology: SP, SL, XM, and FH. Data curation: SP and SL. Formal analysis: SP, MZ, and SL. Funding acquisition: FH. Writing–original draft preparation: SP. Writing–review and editing: SP, MZ, SL, XM, and FH. All authors have read and agreed to the published version of the manuscript.
Funding
This work was supported by the earmarked fund for Modern Agroindustry Technology Research System from the Ministry of Agriculture of China (grant number CARS-44).
Conflict of interest
The authors declare that the research was conducted in the absence of any commercial or financial relationships that could be construed as a potential conflict of interest.
Publisher's note
All claims expressed in this article are solely those of the authors and do not necessarily represent those of their affiliated organizations, or those of the publisher, the editors and the reviewers. Any product that may be evaluated in this article, or claim that may be made by its manufacturer, is not guaranteed or endorsed by the publisher.
Supplementary material
The Supplementary Material for this article can be found online at: https://www.frontiersin.org/articles/10.3389/fsufs.2023.1131959/full#supplementary-material
References
Abukhalil, M. H., Althunibat, O. Y., Aladaileh, S. H., Al-Amarat, W., Obeidat, H. M., Al-Khawalde, A. A. A., et al. (2021). Galangin attenuates diabetic cardiomyopathy through modulating oxidative stress, inflammation and apoptosis in rats. Biomed. Pharmacother. 138, 111410. doi: 10.1016/j.biopha.2021.111410
Ainsworth, E., and Gillespie, K. (2007). Estimation of total phenolic content and other oxidation substrates in plant tissues using Folin-Ciocalteu reagent. Nat. Protoc. 2, 875–877. doi: 10.1038/nprot.2007.102
Arab, H. H., Ashour, A. M., Eid, A. H., Arafa, E. A., Al Khabbaz, H. J., Abd El-Aal, S. A., et al. (2022). Targeting oxidative stress, apoptosis, and autophagy by galangin mitigates cadmium-induced renal damage: role of SIRT1/Nrf2 and AMPK/mTOR pathways. Life Sci. 291, 120300. doi: 10.1016/j.lfs.2021.120300
Bankova, V. (2005). Chemical diversity of propolis and the problem of standardization. J. Ethnopharmacol. 100, 114–117. doi: 10.1016/j.jep.2005.05.004
Bao, N., Wang, D., Fu, X., Xie, H., Gao, G., Luo, Z., et al. (2021). Green extraction of phenolic compounds from lotus seedpod (receptaculum nelumbinis) assisted by ultrasound coupled with glycerol. Foods 10, 239. doi: 10.3390/foods10020239
Bhadange, Y. A., Saharan, V. K., Sonawane, S. H., and Boczkaj, G. (2022). Intensification of catechin extraction from the bark of Syzygium cumini using ultrasonication: optimization, characterization, degradation analysis and kinetic studies. Chem. Eng. Process. 181, 109147. doi: 10.1016/j.cep.2022.109147
Caruso, F., Berinato, M., Hernandez, M., Belli, S., Smart, C., Rossi, M., et al. (2022). Antioxidant properties of bee propolis and an important component, galangin, described by X-ray crystal structure, DFT-D and hydrodynamic voltammetry. PLoS ONE 17, e0267624. doi: 10.1371/journal.pone.0267624
Chemat, F., Rombaut, N., Sicaire, A., Meullemiestre, A., Fabiano-Tixier, A., Abert-Vian, M., et al. (2017). Ultrasound assisted extraction of food and natural products. Mechanisms, techniques, combinations, protocols and applications. a review. Ultrason. Sonochem. 34, 540–560. doi: 10.1016/j.ultsonch.2016.06.035
Chen, J., Xu, Z., Zhu, W., Nie, R., and Li, C. (2016). Novel proanthocyanidin dimer analogues with the C-ring-opened diaryl-propan-2-gallate structural unit and enhanced antioxidant activities. J. Funct. Foods 21, 290–300. doi: 10.1016/j.jff.2015.12.023
Chi, Y., Luo, L., Cui, M., Hao, Y., Liu, T., Huang, X., et al. (2020). Chemical composition and antioxidant activity of essential oil of chinese propolis. Chem. Biodivers. 17:e1900489. doi: 10.1002/cbdv.201900489
Chmelová, D., Škulcová, D., Legerská, B., Horník, M., and Ondrejovič, M. (2020). Ultrasonic-assisted extraction of polyphenols and antioxidants from Picea abies bark. J. Biotechnol. 315, 25–33. doi: 10.1016/j.jbiotec.2020.04.003
Cui, J., Duan, X., Ke, L., Pan, X., Liu, J., Song, X., et al. (2022). Extraction, purification, structural character and biological properties of propolis flavonoids: a review. Fitoterapia 157, 105106. doi: 10.1016/j.fitote.2021.105106
Deng, J., Xu, Z., Xiang, C., Liu, J., Zhou, L., Li, T., et al. (2017). Comparative evaluation of maceration and ultrasonic-assisted extraction of phenolic compounds from fresh olives. Ultrason. Sonochem. 37, 328–334. doi: 10.1016/j.ultsonch.2017.01.023
Fu, X., Wang, D., Belwal, T., Xu, Y., Li, L., Luo, Z., et al. (2021). Sonication-synergistic natural deep eutectic solvent as a green and efficient approach for extraction of phenolic compounds from peels of Carya cathayensis Sarg. Food Chem 355, 129577. doi: 10.1016/j.foodchem.2021.129577
Gardana, C., Scaglianti, M., Pietta, P., and Simonetti, P. (2007). Analysis of the polyphenolic fraction of propolis from different sources by liquid chromatography-tandem mass spectrometry. J. Pharm. Biomed. Anal. 45, 390–399. doi: 10.1016/j.jpba.2007.06.022
Hamzah, N., and Leo, C. (2015). Microwave-assisted extraction of trigona propolis: the effects of processing parameters. Int. J. Food Eng. 11, 861–870. doi: 10.1515/ijfe-2015-0106
Heidari, G., Najafpour, G., Mohammadi, M., and Moghadamnia, A. (2019). Microwave ultrasound assisted extraction: determination of quercetin for antibacterial and antioxidant activities of iranian propolis. Int. J. Eng. 32, 1057–1064. doi: 10.5829/ije.2019.32.08b.01
Heim, K., Tagliaferro, A., and Bobilya, D. (2002). Flavonoid antioxidants: chemistry, metabolism and structure-activity relationships. J. Nutr. Biochem. 13, 572–584. doi: 10.1016/S0955-2863(02)00208-5
Jiang, X., Tao, L., Li, C., You, M., Li, G. Q., Zhang, C., et al. (2020a). Grouping, spectrum-effect relationship and antioxidant compounds of chinese propolis from different regions using multivariate analyses and off-line anti-DPPH assay. Molecules 25, 3243. doi: 10.3390/molecules25143243
Jiang, X., Xie, H., Li, C., You, M., Zheng, Y., Li, G., et al. (2020b). Chinese propolis inhibits the proliferation of human gastric cancer cells by inducing apoptosis and cell cycle arrest. Evid. Based Complement. Alternat. Med. 2020, 2743058. doi: 10.1155/2020/2743058
Jin, Y., Yang, P., Wang, L., Gao, Z., Lv, J., Cui, Z., et al. (2022). Galangin as a direct inhibitor of vWbp protects mice from Staphylococcus aureus-induced pneumonia. J. Cell. Mol. Med. 26, 828–839. doi: 10.1111/jcmm.17129
Kocot, J., Kielczykowska, M., Luchowska-Kocot, D., Kurzepa, J., and Musik, I. (2018). Antioxidant potential of propolis, bee pollen, and royal jelly: possible medical application. Oxid. Med. Cell Longev. 2018, 7074209. doi: 10.1155/2018/7074209
Kurek-Gorecka, A., Keskin, S., Bobis, O., Felitti, R., Gorecki, M., Otreba, M., et al. (2022). Comparison of the antioxidant activity of propolis samples from different geographical regions. Plants 11, 1203. doi: 10.3390/plants11091203
Kurek-Górecka, A., Rzepecka-Stojko, A., Górecki, M., Stojko, J., Sosada, M., Swierczek-Zieba, G., et al. (2013). Structure and antioxidant activity of polyphenols derived from propolis. Molecules 19, 78–101. doi: 10.3390/molecules19010078
Laaroussi, H., Ferreira-Santos, P., Genisheva, Z., Bakour, M., Ousaaid, D., El Ghouizi, A., et al. (2023). Unveiling the techno-functional and bioactive properties of bee pollen as an added-value food ingredient. Food Chem. 405, 134958. doi: 10.1016/j.foodchem.2022.134958
Liao, J., Guo, Z., and Yu, G. (2021). Process intensification and kinetic studies of ultrasound-assisted extraction of flavonoids from peanut shells. Ultrason. Sonochem. 76, 105661. doi: 10.1016/j.ultsonch.2021.105661
Liao, J., Qu, B., Liu, D., and Zheng, N. (2015). New method to enhance the extraction yield of rutin from Sophora japonica using a novel ultrasonic extraction system by determining optimum ultrasonic frequency. Ultrason. Sonochem. 27, 110–116. doi: 10.1016/j.ultsonch.2015.05.005
Liu, Y., Kong, K., Wu, D., Liu, H., Li, H., Zhang, J., et al. (2022). Pomegranate peel-derived punicalagin: ultrasonic-assisted extraction, purification, and its alpha-glucosidase inhibitory mechanism. Food Chem. 374, 131635. doi: 10.1016/j.foodchem.2021.131635
Luo, Q., Zhang, J., Li, H., Wu, D., Geng, F., Corke, H., et al. (2020). Green extraction of antioxidant polyphenols from green tea (Camellia sinensis). Antioxidants 9, 785. doi: 10.3390/antiox9090785
Mehmood, A., Ishaq, M., Zhao, L., Yaqoob, S., Safdar, B., Nadeem, M., et al. (2019). Impact of ultrasound and conventional extraction techniques on bioactive compounds and biological activities of blue butterfly pea flower (Clitoria ternatea L.). Ultrason. Sonochem. 51, 12–19. doi: 10.1016/j.ultsonch.2018.10.013
Mousavi, S., Nateghi, L., Dakheli, M., Ramezan, Y., and Piravi-Vanak, Z. (2022). Maceration and ultrasound-assisted methods used for extraction of phenolic compounds and antioxidant activity from Ferulago angulata. J. Food Process. Preserv. 46, e16356. doi: 10.1111/jfpp.16356
Natolino, A., and Porto, D. C. (2020). Kinetic models for conventional and ultrasound assistant extraction of polyphenols from defatted fresh and distilled grape marc and its main components skins and seeds. Chem. Eng. Res. Des. 156, 1–12. doi: 10.1016/j.cherd.2020.01.009
Naz, S., Imran, M., Rauf, A., Orhan, I. E., Shariati, M. A., Iahtisham Ul, H., et al. (2019). Chrysin: pharmacological and therapeutic properties. Life Sci 235, 116797. doi: 10.1016/j.lfs.2019.116797
Olgierd, B., Kamila, Z., Anna, B., and Emilia, M. (2021). The pluripotent activities of caffeic acid phenethyl ester. Molecules 26, 1335. doi: 10.3390/molecules26051335
Oroian, M., Ursachi, F., and Dranca, F. (2020a). Influence of ultrasonic amplitude, temperature, time and solvent concentration on bioactive compounds extraction from propolis. Ultrason. Sonochem. 64, 105021. doi: 10.1016/j.ultsonch.2020.105021
Oroian, M., Ursachi, F., and Dranca, F. (2020b). Ultrasound-assisted extraction of polyphenols from crude pollen. Antioxidants 9, 322. doi: 10.3390/antiox9040322
Oses, S., Pascual-Mate, A., Fernandez-Muino, M., Lopez-Diaz, T., and Sancho, M. (2016). Bioactive properties of honey with propolis. Food Chem. 196, 1215–1223. doi: 10.1016/j.foodchem.2015.10.050
Saito, É., Sacoda, P., Paviani, L., Paula, J., and Cabral, F. (2020). Conventional and supercritical extraction of phenolic compounds from Brazilian red and green propolis. Sep. Sci. Technol. 56, 3119–3126. doi: 10.1080/01496395.2020.1731755
Samec, D., Karalija, E., Sola, I., Bok, V., and Salopek-Sondi, B. (2021). The role of polyphenols in abiotic stress response: the influence of molecular structure. Plants 10, 118. doi: 10.3390/plants10010118
Shao, B., Mao, L., Tang, M., Yan, Z., Shao, J., Huang, C., et al. (2021). Caffeic acid phenyl ester (CAPE) protects against iron-mediated cellular DNA damage through its strong iron-binding ability and high lipophilicity. Antioxidants 10, 798. doi: 10.3390/antiox10050798
Shirsath, S., Sonawane, S., and Gogate, P. (2012). Intensification of extraction of natural products using ultrasonic irradiations—A review of current status. Chem. Eng. Process. Process Intensif. 53, 10–23. doi: 10.1016/j.cep.2012.01.003
Sillero, L., Prado, R., and Labidi, J. (2020). Simultaneous microwave-ultrasound assisted extraction of bioactive compounds from bark. Chem. Eng. Process. Process Intensif. 156, 108100. doi: 10.1016/j.cep.2020.108100
Stanciauskaite, M., Marksa, M., Liaudanskas, M., Ivanauskas, L., Ivaskiene, M., Ramanauskiene, K., et al. (2021). Extracts of poplar buds (Populus balsamifera L., Populus nigra L.) and lithuanian propolis: comparison of their composition and biological activities. Plants 10, 828. doi: 10.3390/plants10050828
Sun, C., Wu, Z., Wang, Z., and Zhang, H. (2015). Effect of ethanol/water solvents on phenolic profiles and antioxidant properties of beijing propolis extracts. Evid. Based Complement. Alternat. Med. 2015, 595393. doi: 10.1155/2015/595393
Taheri, S., Abdullah, T. L., Karimi, E., Oskoueian, E., and Ebrahimi, M. (2014). Antioxidant capacities and total phenolic contents enhancement with acute gamma irradiation in Curcuma alismatifolia (Zingiberaceae) leaves. Int. J. Mol. Sci. 15, 13077–13090. doi: 10.3390/ijms150713077
Ugarte-Romero, E., Feng, H., and Martin, S. (2007). Inactivation of shigella boydii 18 IDPH and listeria monocytogenes scott a with power ultrasound at different acoustic energy densities and temperatures. J. Food Sci. 72, M103–M107. doi: 10.1111/j.1750-3841.2007.00340.x
Wang, P., Cheng, C., Ma, Y., and Jia, M. (2020). Degradation behavior of polyphenols in model aqueous extraction system based on mechanical and sonochemical effects induced by ultrasound. Sep. Purif. Technol. 247, 116967. doi: 10.1016/j.seppur.2020.116967
Wang, W., Gao, Y., Wei, J., Chen, Y., Liu, Q., Liu, H., et al. (2021). Optimization of ultrasonic cellulase-assisted extraction and antioxidant activity of natural polyphenols from passion fruit. Molecules 26, 2494. doi: 10.3390/molecules26092494
Wen, C., Zhang, J., Zhang, H., Dzah, C. S., Zandile, M., Duan, Y., et al. (2018). Advances in ultrasound assisted extraction of bioactive compounds from cash crops - A review. Ultrason. Sonochem. 48, 538–549. doi: 10.1016/j.ultsonch.2018.07.018
Xie, P., Huang, L., Zhang, C., Deng, Y., Wang, X., Cheng, J., et al. (2019). Enhanced extraction of hydroxytyrosol, maslinic acid and oleanolic acid from olive pomace: process parameters, kinetics and thermodynamics, and greenness assessment. Food Chem. 276, 662–674. doi: 10.1016/j.foodchem.2018.10.079
Xu, Z., Cai, Y., Ma, Q., Zhao, Z., Yang, D., Xu, X., et al. (2021). Optimization of extraction of bioactive compounds from baphicacanthus cusia leaves by hydrophobic deep eutectic solvents. Molecules 26, 1729. doi: 10.3390/molecules26061729
Yang, H., Yang, S., Chen, X., Zhang, J., and Zhang, Y. (2023). Dynamic changes in flavonoid, phenolic, and polysaccharide contents in leaves and fruits of sea buckthorn during the growing season in southeastern Tibet plateau. Sci. Horticulturae 307, 111497. doi: 10.1016/j.scienta.2022.111497
Yang, Y., Wang, C., and Wei, M. (2019). Separation and quantification of bioactive flavonoids from Scutellaria barbata using a green procedure. Food Bioprod. Process. 118, 77–90. doi: 10.1016/j.fbp.2019.09.004
Yuan, Y., Zheng, S., Zeng, L., Deng, Z., Zhang, B., Li, H., et al. (2019). The phenolic compounds, metabolites, and antioxidant activity of propolis extracted by ultrasound-assisted method. J Food Sci 84, 3850–3865. doi: 10.1111/1750-3841.14934
Zainal, W., Azian, N., Albar, S., and Rusli, A. (2021). Effects of extraction method, solvent and time on the bioactive compounds and antioxidant activity of Tetrigona apicalis Malaysian propolis. J. Apic. Res. 61, 264–270. doi: 10.1080/00218839.2021.1930958
Zhang, C., Huang, S., Wei, W., Ping, S., Shen, X., Li, Y., et al. (2014). Development of high-performance liquid chromatographic for quality and authenticity control of Chinese propolis. J. Food Sci. 79, C1315–1322. doi: 10.1111/1750-3841.12510
Zhang, C., Shen, X., Chen, J., Jiang, X., and Hu, F. (2017). Identification of free radical scavengers from brazilian green propolis using off-line HPLC-DPPH assay and LC-MS. J. Food Sci. 82, 1602–1607. doi: 10.1111/1750-3841.13730
Zhang, W., Margarita, G., Wu, D., Yuan, W., Yan, S., Qi, S., et al. (2022). Antibacterial activity of chinese red propolis against staphylococcus aureus and MRSA. Molecules 27, 1693. doi: 10.3390/molecules27051693
Zhao, Z., Liu, P., Wang, S., and Ma, S. (2017). Optimization of ultrasound, microwave and Soxhlet extraction of flavonoids from Millettia speciosa Champ and evaluation of antioxidant activities in vitro. J. Food Meas. Charact. 11, 1947–1958. doi: 10.1007/s11694-017-9577-3
Keywords: propolis, extraction, ultrasound, polyphenol, antioxidant activity, microstructure
Citation: Peng S, Zhu M, Li S, Ma X and Hu F (2023) Ultrasound-assisted extraction of polyphenols from Chinese propolis. Front. Sustain. Food Syst. 7:1131959. doi: 10.3389/fsufs.2023.1131959
Received: 26 December 2022; Accepted: 07 February 2023;
Published: 27 February 2023.
Edited by:
Laurent Dufossé, Université de la Réunion, FranceReviewed by:
Pedro Ferreira Santos, University of Minho, PortugalHassan Laaroussi, Sidi Mohamed Ben Abdellah University, Morocco
Copyright © 2023 Peng, Zhu, Li, Ma and Hu. This is an open-access article distributed under the terms of the Creative Commons Attribution License (CC BY). The use, distribution or reproduction in other forums is permitted, provided the original author(s) and the copyright owner(s) are credited and that the original publication in this journal is cited, in accordance with accepted academic practice. No use, distribution or reproduction is permitted which does not comply with these terms.
*Correspondence: Fuliang Hu,  ZmxodUB6anUuZWR1LmNu; Xiaobin Ma, eGlhb2Jpbi5tYUB0ZWFnYXNjLmll