 Roman Aschinger
 Sébastien Boillat
 Chinwe Ifejika Speranza
95% of researchers rate our articles as excellent or good
Learn more about the work of our research integrity team to safeguard the quality of each article we publish.
Find out more
ORIGINAL RESEARCH article
Front. Sustain. Food Syst. , 29 March 2023
Sec. Land, Livelihoods and Food Security
Volume 7 - 2023 | https://doi.org/10.3389/fsufs.2023.1070083
Climate change, land degradation, demographic change and persistent poverty pose major challenges to smallholder farmers in the arid and semi-arid lands of sub-Saharan Africa. Though many studies have focused on how resilient these households are to shocks, very few studies deal with how household resilience varies over time. We provide a longitudinal analysis to assess how the resilience of smallholder households in south-eastern Kenya has varied from 2012 to 2015. We use the Livelihood Resilience Indicator Framework to examine the linkages between livelihood outcomes and livelihood resilience (buffer capacity, self-organization and capacity for learning). We collected data from 134 households on three resilience dimensions: buffer capacity, self-organization, and capacity for learning. We performed principal component analysis to identify the key components of these dimensions and examine their relevance for livelihood outcomes. Our findings show that under drought conditions in 2012, conservation agriculture practices significantly contributed to maize yields. In both years 2012 and 2015, there was a positive correlation between resilience dimensions and food security. Key components of this relation were land area, income, conservation agriculture practices, climate forecasts and actions taken for the upcoming growing season.
Increased frequencies of droughts, floods, tropical storms and heavy rainstorms (Intergovernmental Panel on Climate Change, 2014a; Niang et al., 2014; Ayugi et al., 2020) pose new threats to livelihoods in arid and semi-arid regions (Ulrich et al., 2012; MoALF, 2016). This is particularly the case in Kenya, where the impacts of climate variability and climate change in its arid and semi-arid regions are limiting efforts to achieve food security (Intergovernmental Panel on Climate Change, 2014b). Pastoralism and rain-fed agriculture are the predominant livelihoods in these regions, which are home to about 38% of Kenya's population. This high dependence on climate-sensitive local natural resources and ecosystem services (Government of Kenya, 2012) in combination with low adaptive capacities, inadequate agricultural inputs and technologies, as well as limited extension- and financial services make smallholders in this region particularly vulnerable (Intergovernmental Panel on Climate Change, 2007, 2014a; Government of Kenya, 2018). There is thus a need to enhance their livelihood resilience to climate variability and climate change.
Livelihood resilience refers to the capacity of individuals, social groups, or a social-ecological system (SES) to accommodate stresses, absorb disturbances, self-organize, and learn in order to maintain and improve essential basic structures and ways of functioning under adverse conditions (Carpenter et al., 2001; Berkes et al., 2002; Adger, 2003, 2006; Folke, 2006; Ifejika Speranza, 2013; Denton et al., 2014). Therefore, one can use resilience to describe the ability of a livelihood system to cope with change and recover from adverse consequences (Obrist et al., 2010). Resilience in relation to livelihoods depends on the capacity and agency of actors and households, as well as on social and natural conditions (Adger, 2003). A resilient livelihood is defined by its capability to maintain its key functions (food, income, insurance, poverty reduction, etc.) and to absorb the impacts of disturbances without causing major declines in production and wellbeing (Cumming, 2011; Ifejika Speranza, 2013). A livelihood displaying low sensitivity to shocks and high resilience is therefore considered robust, while a livelihood characterized by low resilience and high sensitivity is considered vulnerable (Allison and Ellis, 2001).
Linking livelihoods to resilience thinking can enhance the understanding of livelihood dynamics in the face of shock-driven changes and help to characterize the ability of livelihoods to recover after disruptions (Marschke and Berkes, 2006; Scoones, 2009; Sallu et al., 2010; Ifejika Speranza et al., 2014). Livelihood resilience has become an integral part of development research (Ifejika Speranza et al., 2014), as livelihoods (capabilities, assets and activities required for a means of living) are increasingly exposed to global environmental change and its interactions with economic, political and social systems (Chambers and Conway, 1992; Bahadur et al., 2015). It thus provides an important lens to examine complex rural development questions (Scoones, 2009).
Livelihood resilience thus focuses on factors and processes that keep livelihoods functioning despite change. Addressing the question of resilience of what, to what and for whom (Quandt, 2018), thus shifts attention from risk management to people's capabilities, assets and activities, and interactions with their social-ecological contexts (Berkes et al., 2002). This approach helps to understand the capabilities that enable smallholders to cope with and adjust to adverse conditions, create options and responses that increase competence to mitigate or overcome adversity (Obrist et al., 2010).
Therefore, a resilience assessment involves characterizing and assessing the exposure to shocks and stresses (Bahadur et al., 2010; Sallu et al., 2010). However, the unpredictability of these shocks and stresses makes it difficult to observe and measure resilience empirically (Carpenter et al., 2001; Obrist et al., 2010; Quandt, 2018). For this reason, several proxy-based approaches to measuring livelihood resilience and its different aspects have been proposed and sometimes applied (cf. Alinovi et al., 2010; Ifejika Speranza et al., 2013, 2014; Boillat et al., 2019; Matter et al., 2021). Developing such indicators pose several challenges. For example, selected indicators should capture the multidimensionality of resilience in the specific context of focus. Existing approaches to select indicators include reviewing literature (e.g., Sina et al., 2019) validated by group discussions and interviews (e.g., Gong et al., 2020; Campbell, 2021), principal component analysis (PCA) (e.g., Liu et al., 2020; Matter et al., 2021), or cluster analysis (e.g., Anbar et al., 2020).
A further challenge is to assess how livelihood resilience varies through time. Most studies on livelihood resilience have focused on a single situation in time or on a single event. Few studies have assessed different resilience dimensions across time in order to monitor livelihood dynamics, gain insights on whether smallholder livelihoods continue functioning despite droughts, and learn about the effectiveness of measures to improve livelihood resilience. In this study, we use a longitudinal approach to analyse livelihood resilience of smallholder farmers in south-eastern Kenya. Analyzing livelihood resilience over time can provide insights into changes in its key components and their relation to livelihood outcomes such as crop yields and food security. By conducting a longitudinal analysis and focusing on livelihood dynamics, temporal changes can be identified, enabling a better understanding of coping-, adaptation-, diversification- and transformation strategies (Scoones, 2009). In the following, we describe the study area, the resilience framework applied, data collected and analysis methods. We then present and discuss the results and conclude.
To conceptualize livelihood resilience, we apply the indicator framework of Ifejika Speranza et al. (2014). The indicator framework is based on three dimensions of livelihood resilience: buffer capacity, self-organization, and capacity for learning. Buffer capacity refers to the capacity to cushion change and use emerging opportunities to achieve better livelihood outcomes (e.g., reduced poverty) (Ifejika Speranza et al., 2013). Self-organization describes the ability of farmers to connect in flexible networks as well as the ability to be involved in the social, economic and institutional environment at other scales than the local one (Milestad and Darnhofer, 2003). The capacity for learning refers to adaptive management and implies that a resilient SES is a learning system, memorizing previous experiences and incorporating them into current actions (COMPAS, 2007). These dimensions can be further decomposed into various contextually and temporally specific proxy indicators (Figure 1), as it is the case with other similar frameworks (Carpenter et al., 2001; Milestad and Darnhofer, 2003; Ifejika Speranza et al., 2013, 2014). The framework implicitly captures agency through smallholder ability to self-organize and to learn. The framework equally weighs all three resilience dimensions. It also captures diversity in all variables based on the premise that a diverse livelihood is likely to be more resilient than a livelihood that depends on fewer capabilities (Figure 2). The variables underpinning the three dimensions have been described in detail in Ifejika Speranza et al. (2014) and empirically tested in Matter et al. (2021).
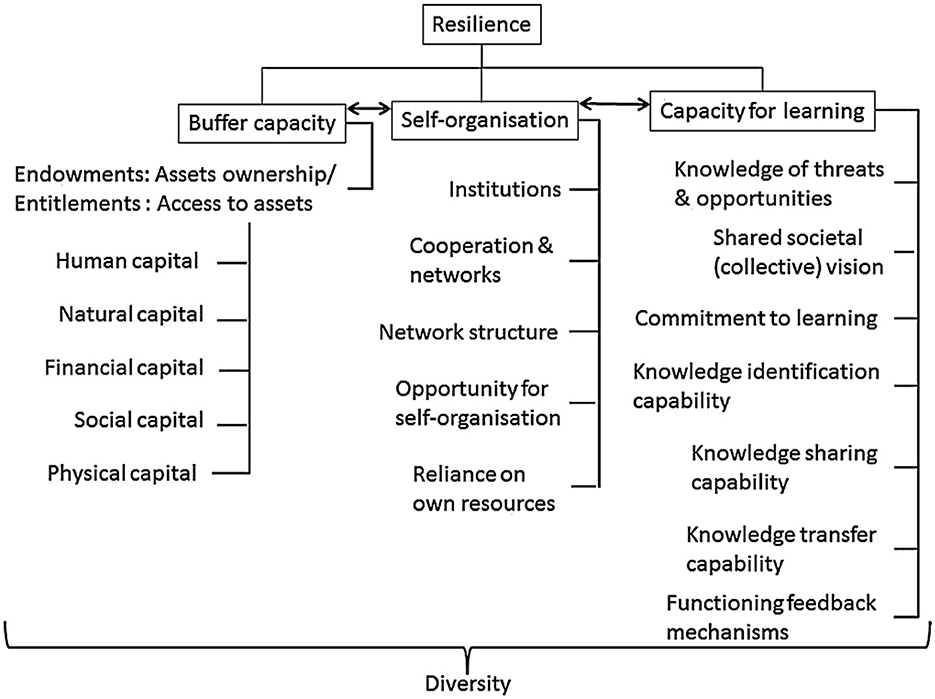
Figure 1. The applied livelihood resilience framework (Ifejika Speranza et al., 2014, p. 112). The data collection instrument (semi-structured household questionnaire) in 2013 and 2016 were based on the livelihood resilience framework of Ifejika Speranza et al. (2014). The questionnaire was structured according to the three resilience dimensions, namely Buffer Capacity (BC), Self-Organization (SO), and Capacity for Learning (CfL).
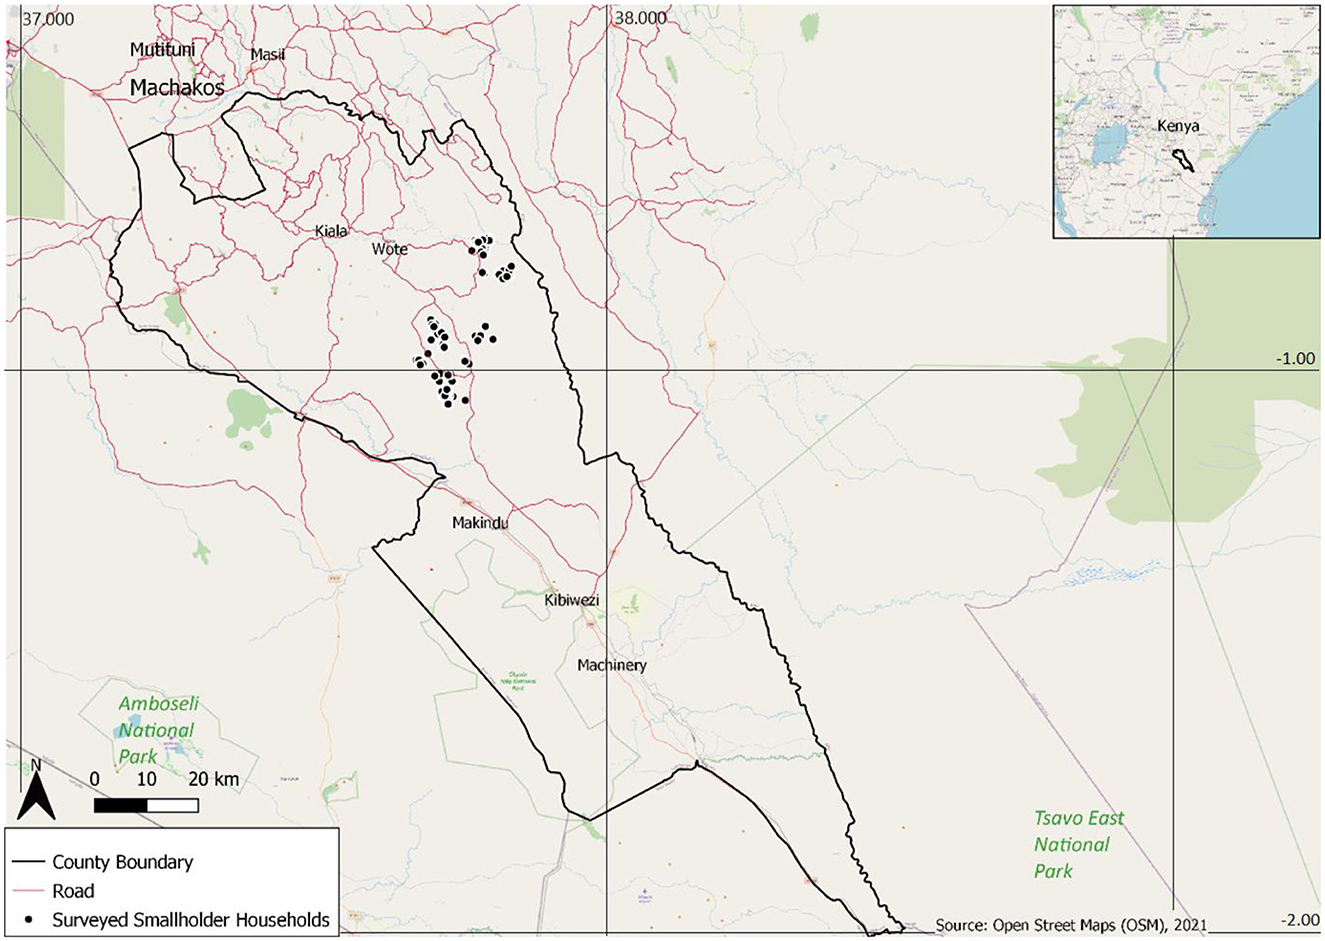
Figure 2. Surveyed smallholder households in Makueni County, Kenya [OSM (Open Street Maps Foundation)., 2021].
Situated in south-eastern Kenya (1° 35'−2° 59' S and 37° 10'−38° 30' E), Makueni County has an arid to semi-arid climate (Gichuki, 2000; MoALF, 2016) (Figure 2). Rainfall is bimodal, with the main rainy and growing season from October to December and a mean rainfall of 348 mm between 1981 and 2010 (Gichuki, 2000). The secondary rainy season lasts from March to May (mean rainfall 1981–2010: 253 mm) (Ifejika Speranza et al., 2008; United States Geological Survey Climate Hazards Center, 2021). The mean annual rainfall from 1981-2010 was 697 mm (United States Geological Survey Climate Hazards Center, 2021). However, rainfall in the region has a high interannual and seasonal variability, posing major constraints on the agricultural sector (Government of Kenya, 2013). This particularity affects maize, the main staple crop (Nowak et al., 2020) whose yields have shown a declining trend since 1979. This trend is expected to continue due to climate change (Mumo et al., 2018; Food Agriculture Organization, 2022). Furthermore, Makueni County has a poverty rate of 34.8% with a significant population with insufficient access to food to meet daily dietary requirements (Government of Kenya, 2018). During the assessed period, growing seasons were characterized by a series of successive droughts with below-average rainfall, which ended only in 2015, when above-average rainfall was recorded.
Our study is based on two household surveys conducted in 2013 and 2016 in the context of previous research projects (Ifejika Speranza et al., 2014; Boillat et al., 2019). A stratified random sampling was applied to survey 134 smallholder households in 38 villages, distributed according to their adoption of conservation agriculture practices as well as according to administrative units and being located in the semi-arid region of Makueni County. The surveyed households are part of a long-term collaboration involving the Kenya-based Center for Training and Integrated Research in Arid and Semi-arid Lands Development (CETRAD), who provides them with capacity building and rural extension activities, and the University of Bern. Data was collected through questionnaires to the 134 households in 2013 (focusing on the farming period 2012) and again in 2016 (focusing on the period 2015) using an adapted version of the 2013 questionnaire, but still largely capturing the same variables so the data sets are comparable. While the survey from 2016 included data on maize yields and food shortages as livelihood outcomes, the survey from 2013 only included data on maize yields. The questionnaires captured variables related with the three dimensions of the livelihood resilience framework (Figure 1), namely BC (e.g., household demographics and livelihood assets, agricultural techniques applied), SO (e.g., membership in farmer groups and role in farmer and other social groups), CfL (e.g., actively sourcing information on weather forecasts, participation in learning events and sharing knowledge), the diversity in the three dimensions as well as livelihood outcomes (e.g., crop yields, pest and disease incidences and food insecurity).
Principal Components Analysis (PCA) allows to identify the most meaningful indicators for enhancing resilience of the surveyed smallholders (Field, 2013; Matter et al., 2021). We applied the following steps to analyse the data (Figure 3), performing all calculations with the IBM SPSS® version 28 software. To ensure the robustness of the results, we applied an iterative approach, comprising a preliminary assessment (Step 2), a PCA assessment (Step 3) and a reliability analysis (Step 4) according to Matter et al. (2021). We repeated these quality control steps until remaining variables passed the preliminary assessment (Step 2), the PCA assessment (Step 3) as well as the reliability analysis (Step 4) Due to missing data for some variables, we ended up with a final sample size of 111 households.
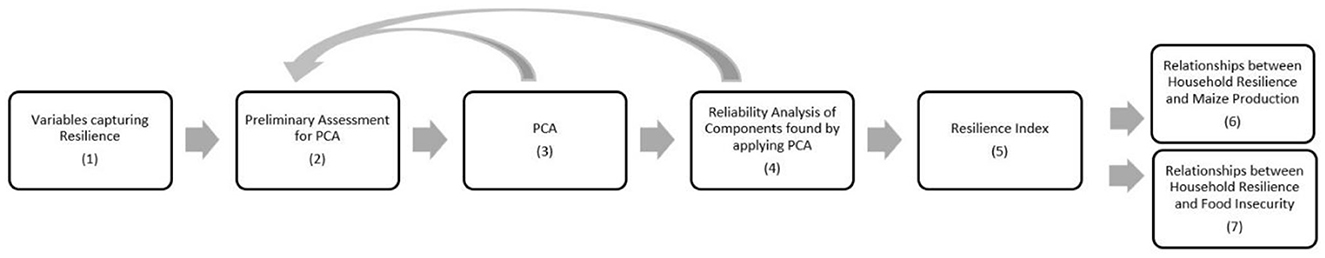
Figure 3. Analysis steps applied for assessing livelihood resilience.
Step 1: Data preparation and selection of variables (Figure 3, Box 1). Based on the framework (Figure 1) of Ifejika Speranza et al. (2014), we selected 62 variables capturing the three dimensions of resilience from the two surveys (see Supplementary material). Table 1 presents a summary of the variables according to the three dimensions. Data with high values corresponding to low resilience (e.g., high distance to markets) were reverse scored. To allow the development of longitudinal indicators to assess livelihood resilience, we employed a single database PCA approach (Libório et al., 2020). We thus compiled the data from both points in time into one single database to allow for a longitudinal analysis of the indicators. We then standardized the aggregated data (Z-scores) to perform the PCA (Field, 2013; Libório et al., 2020).
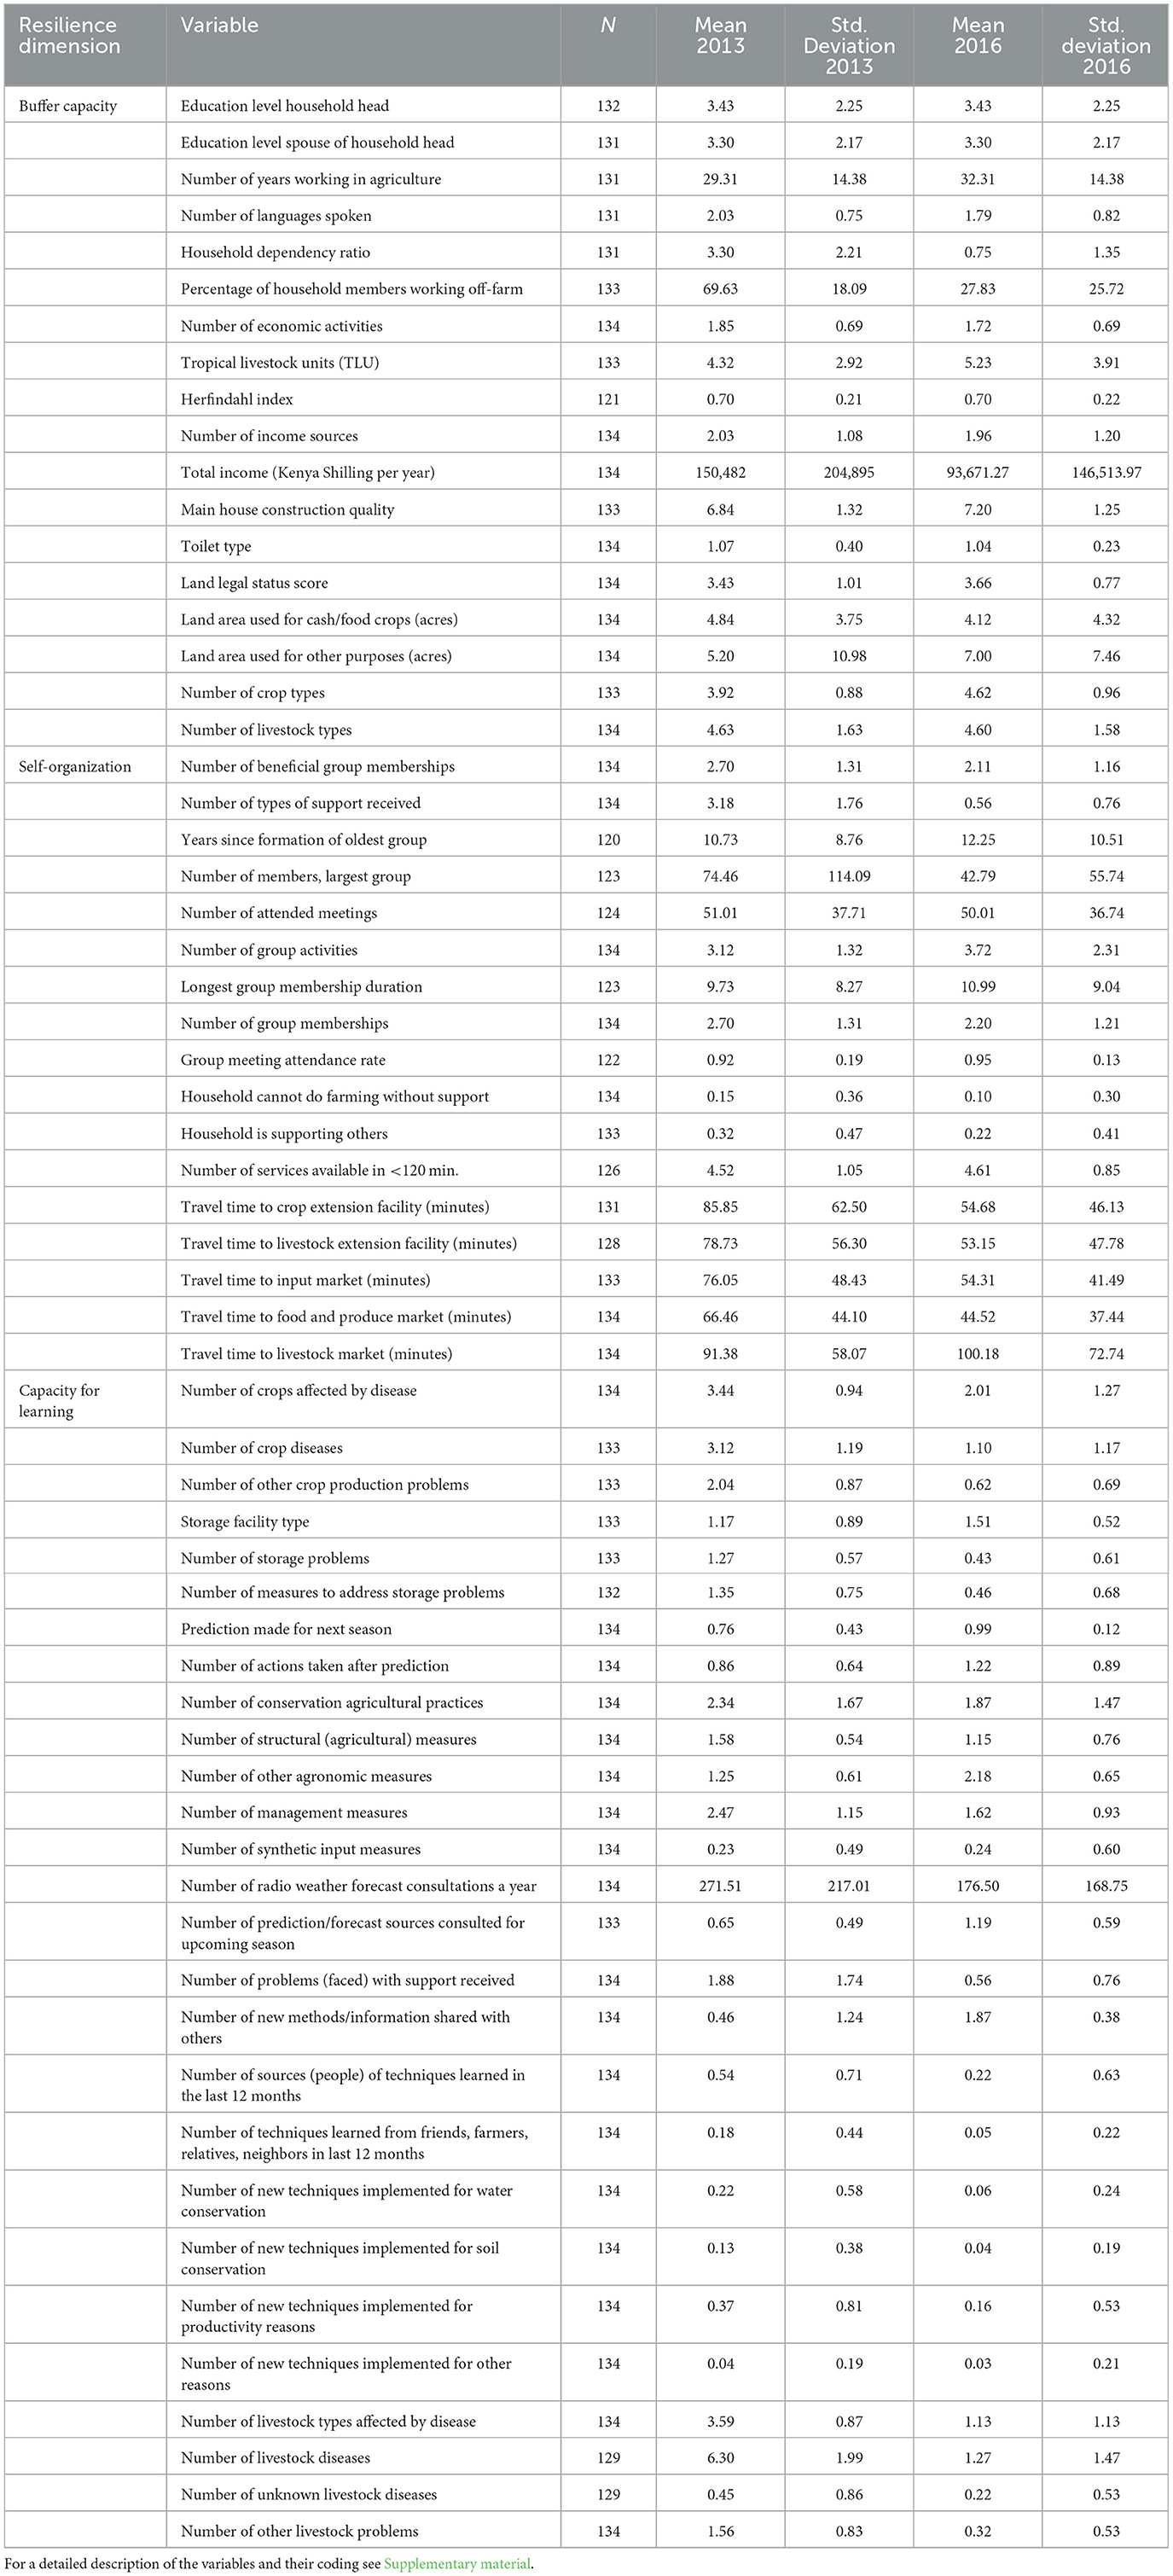
Table 1. Main statistics of variables capturing resilience dimensions.
Step 2: Preliminary assessment of data for fit for a principal component analysis (Figure 3, Box 2): During the process the variables were removed if one of the following conditions applied.
- High amount of missing data
- Inadequate sample size and item to sample size ratio
- Multicollinearity issue (determinant above 0.1E-5; correlation coefficients < 0.8), removal of variables if correlation coefficients >0.8
- Bartlett's test of sphericity not significant
- Kaiser-Meyer-Olkin (KMO) measure of sampling adequacy and individual variable KMO anti-image correlation (anti-image correlation matrix) < 0.5
In total, we excluded 15 of the 62 variables during the process, due to high correlation coefficients or low individual Kaiser-Meyer-Olkin criterion (overall KMO = 0.746). For detailed reasons of removal of individual variables, see Supplementary material.
Step 3: Principal Component Analysis (PCA) (Figure 3, Box 3): We applied a PCA to characterize the respondents' resilience at the two different points in time, characterized by above-(2015) and below-average precipitation (2012). During the process the variables were removed if one of the following conditions applied.
- Extracted communalities after extraction < 0.5
- Total variance explained after varimax rotation < 60% (assurance of validity of PCA)
- Loadings to components < 0.5
In total we excluded 10 variables due to low loading onto components or low communalities after extraction during the process of applying PCA. For detailed reasons of removal of individual variables, see Supplementary material. We applied orthogonal (varimax) rotation under the assumption that the underlying components were independent. Varimax rotation disperses the loadings within the components, leading to more distinct component clusters (Field, 2013).
Step 4: Reliability analysis of identified PCA components (Figure 3, Box 4).
During the process the variables were removed if one of the following conditions applied.
- Components Cronbach's alpha >0.65, removal of variables if Cronbach's alpha < 0.65
- Corrected item-total correlations >0.3, removal of variables if corrected item-total correlations < 0.3
- Cronbach's alpha of item deleted < Cronbach's alpha (increase of 0.1 is tolerated)
Three variables were removed due to low Cronbach's alpha of the components or an increase of Cronbach alpha of the components after excluding variables from components. For detailed reasons of removal of individual variables, see Supplementary material.
Step 5: Building a livelihood resilience index (Figure 3, Box 5):
Subsequent to the PCA, we calculated the scores of the individual households for each component according to the Anderson-Rubin method. The Anderson-Rubin method constitutes a variation of the Bartlett's procedure, in which the least squares formula is adjusted to produce component scores that are not only uncorrelated with other factors, but also uncorrelated with one another (DiStefano et al., 2009; Field, 2013). The resilience scores were obtained through summing the component scores per household and were subsequently divided into four categories of equal range (very low, low, moderate, and high), allowing to categorize households according to their obtained scores.
We then applied the non-parametric Wilcoxon test to check whether the resilience score and its underpinning component scores significantly differed between 2012 and 2015. We used this test because the prerequisites for a parametric procedure (e.g., t-test) were not met, as the results of the PCA were not normally distributed. The effect sizes (r-values) of the results of the Wilcoxon test were calculated according to Equation 1.
The effect sizes were then assessed using the classification of Cohen (1992) displayed in Table 2.
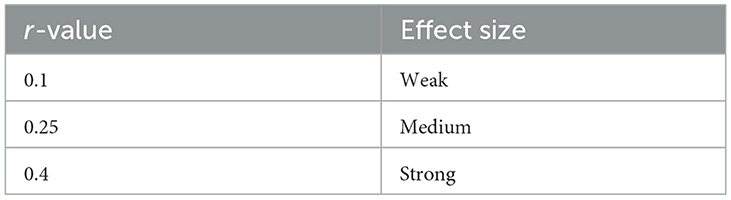
Table 2. Effect sizes of the Wilcoxon test according to Cohen (1992).
Step 6: Examining relationships between livelihood resilience and livelihood outcomes (Figure 3, Box 8 and 9): Finally, we examined the interrelations between resilience, its dimensions and livelihood outcomes (maize yields from October-November-December—OND 2012 and OND 2015, and food security) by applying Spearmen's rho. Data on food shortages (number of days a household was without food), were only available for the year 2015 and were therefore not analyzed for the year 2012.
The 34 variables (Table 3) remaining after performing PCA formed ten components, which were indicatively labeled as “Farming problems” (1), “Infrastructure” (2), “Experimentation with new techniques” (3), “Land area and income” (4), “Forecasts and actions” (5), “Conservation agriculture practices” (6), “Education” (7), “Livestock” (8), “Social capital and diversification” (9) and “Storage facility” (10). Farming problems capture crop and livestock diseases, other problems related to crop production as well as the amount of help received to cope with farming problems. Infrastructure captures the travel times to extension services and markets. Experimentation with new techniques captures the number of new agricultural techniques applied in the last year, as well as the number of information sources for new agricultural techniques. Land area and income relates to the area of land that the household can access, and the amount of income the household generated in the last year. Forecasts and actions relate to the amount of weather forecasts and subsequent actions taken by a household. Conservation agriculture practices capture the number of agricultural practices applied for soil conservation reasons, including synthetic inputs and management measures such as planting drought adapted crops, fallowing, water harvesting and early planting. Education relates to the degree of education of the household head and his spouse, and the number of years the household head has worked in agriculture. Livestock relates to the number of tropical livestock units and livestock types. Social capital and diversification relate to the number of group memberships, group activities and income diversification. Storage facility describes whether a household has stored none, part, or all its yield in a granary. Except for the variable number of income sources, which was found to highly load on land area and income and on social capital and diversification, all other variables loaded exclusively on a single component.

Table 3. Rotated component matrix–resilience.
The resilience scores ranked the 111 households based on the sum of their component scores (Figures 4, 5). The index ranged from −8.19 to 7.63 in 2012, and from −4.33 to 14.47 in 2015 (Table 4). The mean resilience score of −1.275 in 2012 increased to 1.275 in 2015 (Figure 5). While the resilience scores for 2012 did not significantly deviate from normality according to the Kolmogorov-Smirnov test at p < 0.01 (D(111) = 0.053, p = 0.200), the scores for 2015 differed significantly from normality (D(111) = 0.111, p = 0.002). In 2012, one respondent and in 2015, four respondents at the high end of the scale were considered outliers (Table 4).
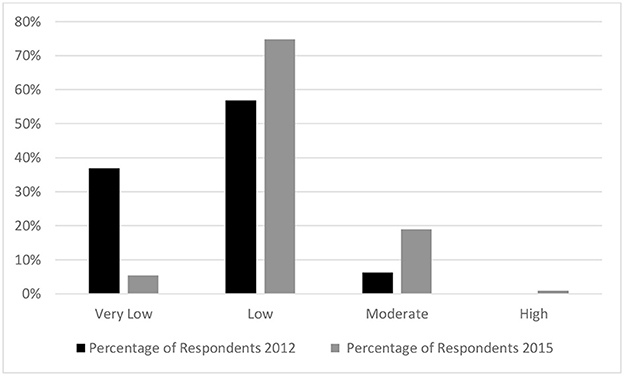
Figure 4. Frequency of resilience score ranges.
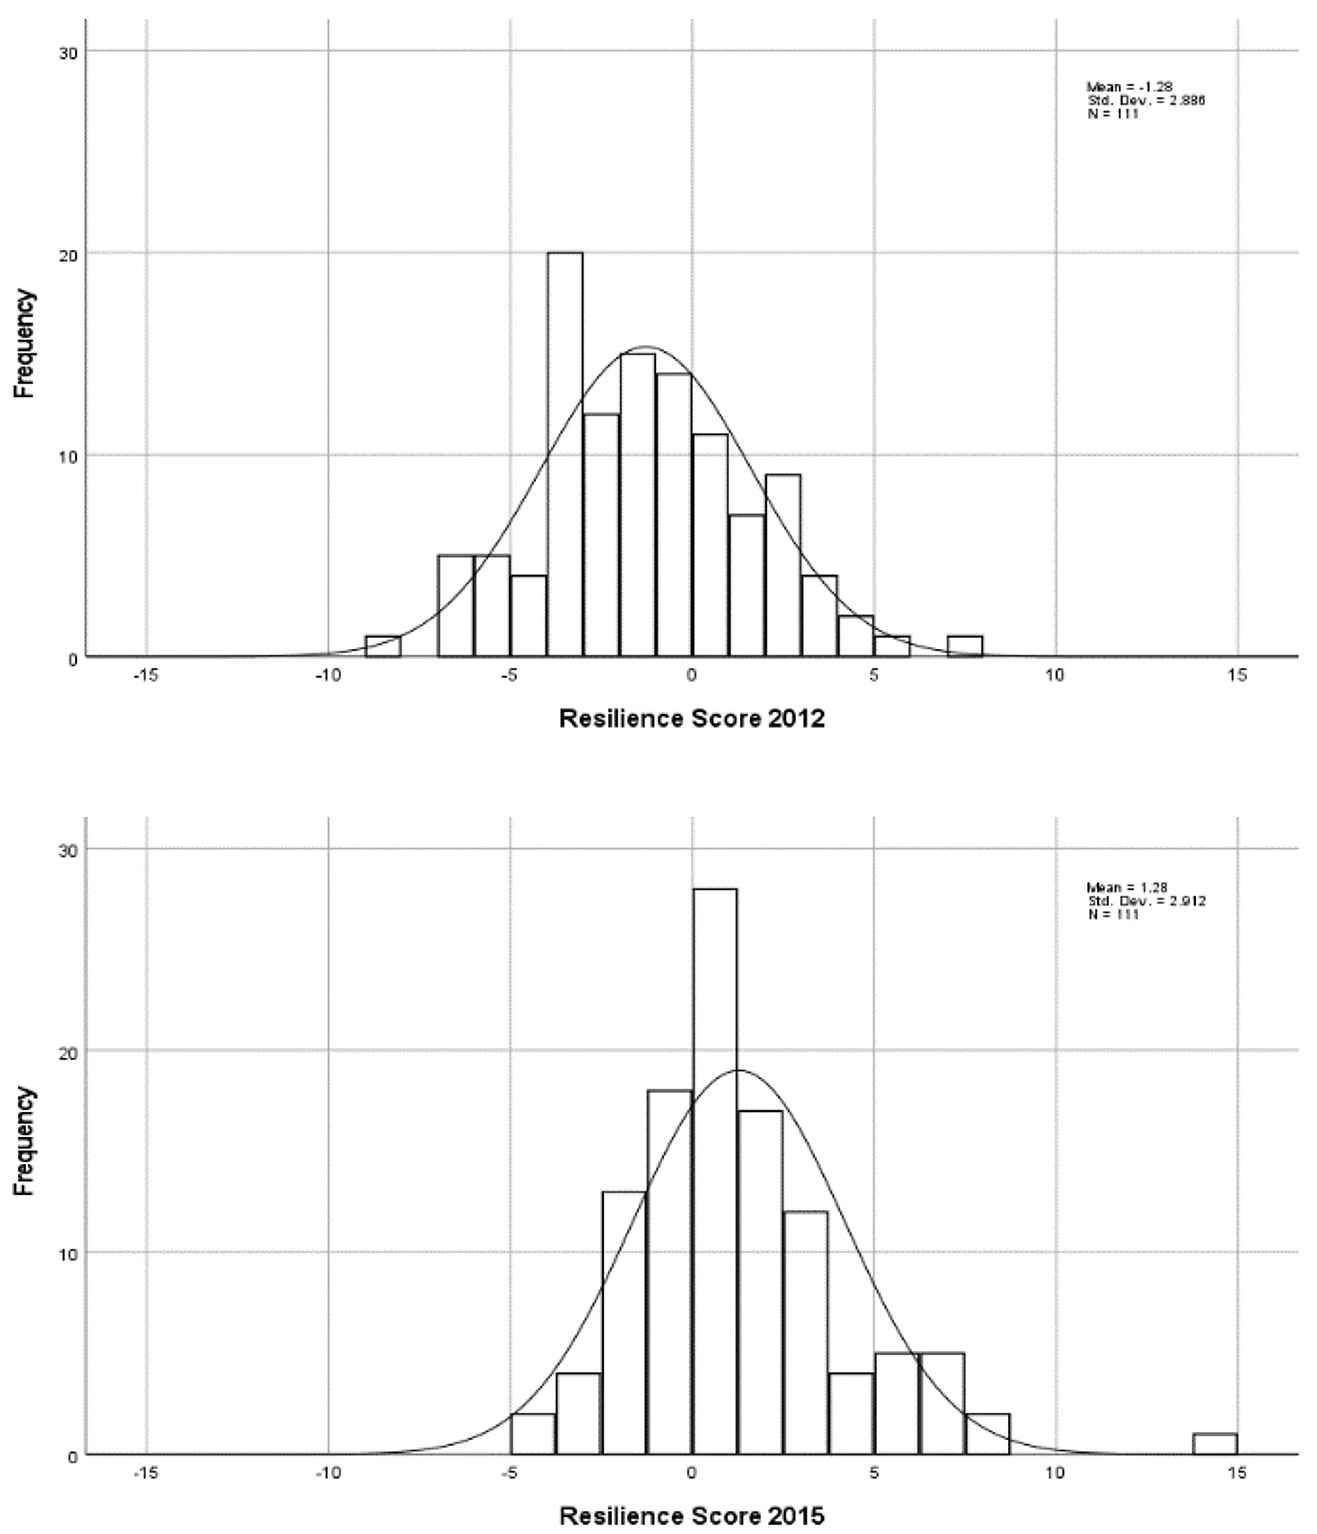
Figure 5. Distributions of resilience scores in 2012 and 2015. We also observed changes between specific resilience components from 2012 to 2015. The results of the Wilcoxon test showed that the components farming problems, infrastructure, forecasts and actions, and storage facility as well as the resilience score had significantly changed within the period from 2012 to 2015.
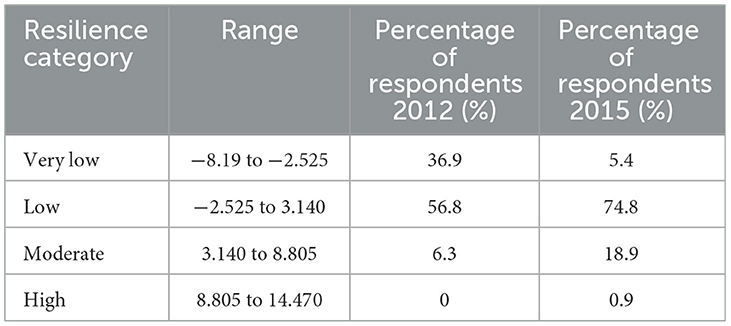
Table 4. Resilience scores ranges.
In 2012 as well as in 2015, the majority of respondents were in the category of low resilience. In 2015, 50 households increased their resilience, 58 remained in the same category as in 2012 and 3 were classified in a lower category (Figure 4).
Using Spearman's rho, we found significant correlations between the livelihood resilience index of 2012 and maize yields, and between that of 2015 and maize yields (N = 80) as well as between the 2015 livelihood resilience index and food insecurity (N = 111) (Supplementary material). Due to a lack of data on food insecurity for the year 2012, we could not assess this relationship for this year.
Significant correlations between the resilience components, and the resilience score and maize yield were only found for the survey from 2012. Specifically, a significant positive correlation was found with conservation agricultural practices (Figure 6). This means that the usage of synthetic inputs, conservation agriculture and management measures (fallowing, early planting, drought tolerant crops and water harvesting) is associated with increased maize yields under below average rainfall conditions.
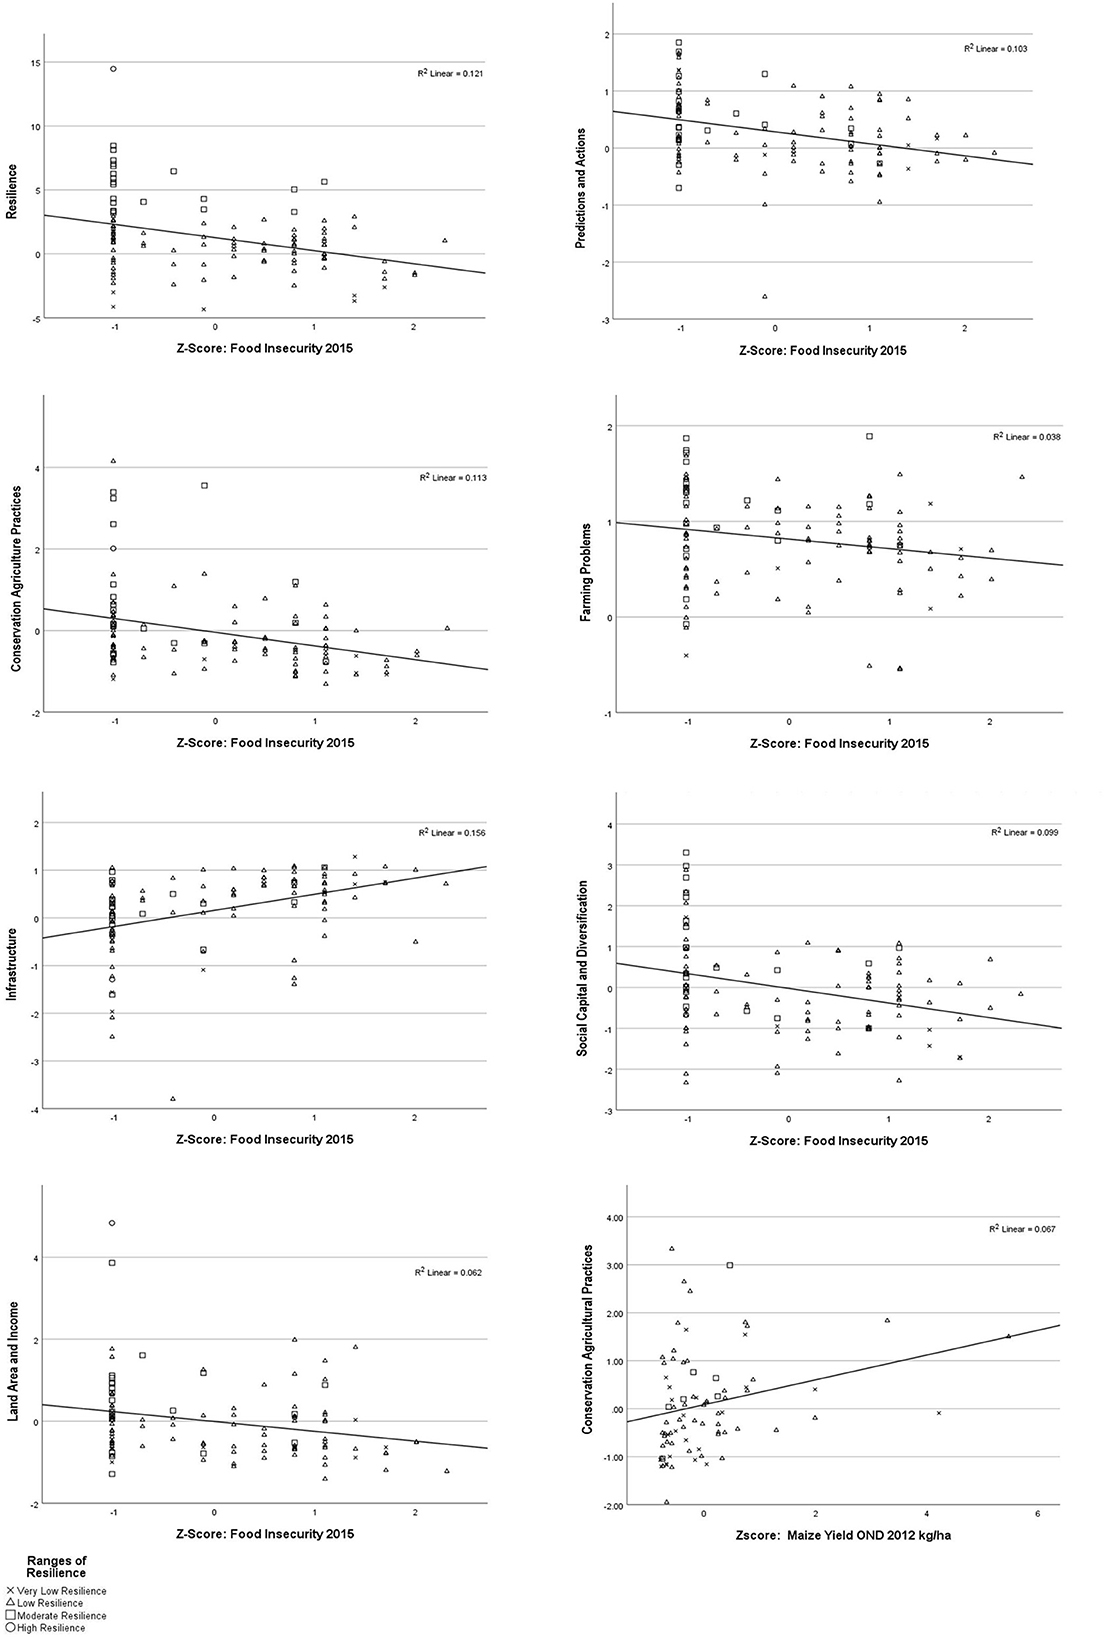
Figure 6. Scatterplots resilience components and food insecurity/maize yields.
Regarding food insecurity in the year 2015, we found significant negative correlations with several components: farming problems, land area and income, forecasts and actions, conservation agricultural practices, social capital and diversification, storage facility as well as with the resilience score (Figure 6). This means that households who underperformed on these indicators had a higher chance of being food insecure. Surprisingly, we also found a significant positive correlation between food insecurity and infrastructure, meaning that households with better access to extension services and markets were worse off regarding food security.
We found several correlations between the different components of resilience for years 2012 and 2015 (Tables 5, 6, Supplementary material). Infrastructure positively correlated with farming problems in 2012, as well as with conservation agricultural practices, forecasts and actions in 2015. A negative relationship existed between farming problems and experimentation with new techniques in 2015, meaning that those smallholders experiencing farming problems are likely not to experiment with new farming practices.
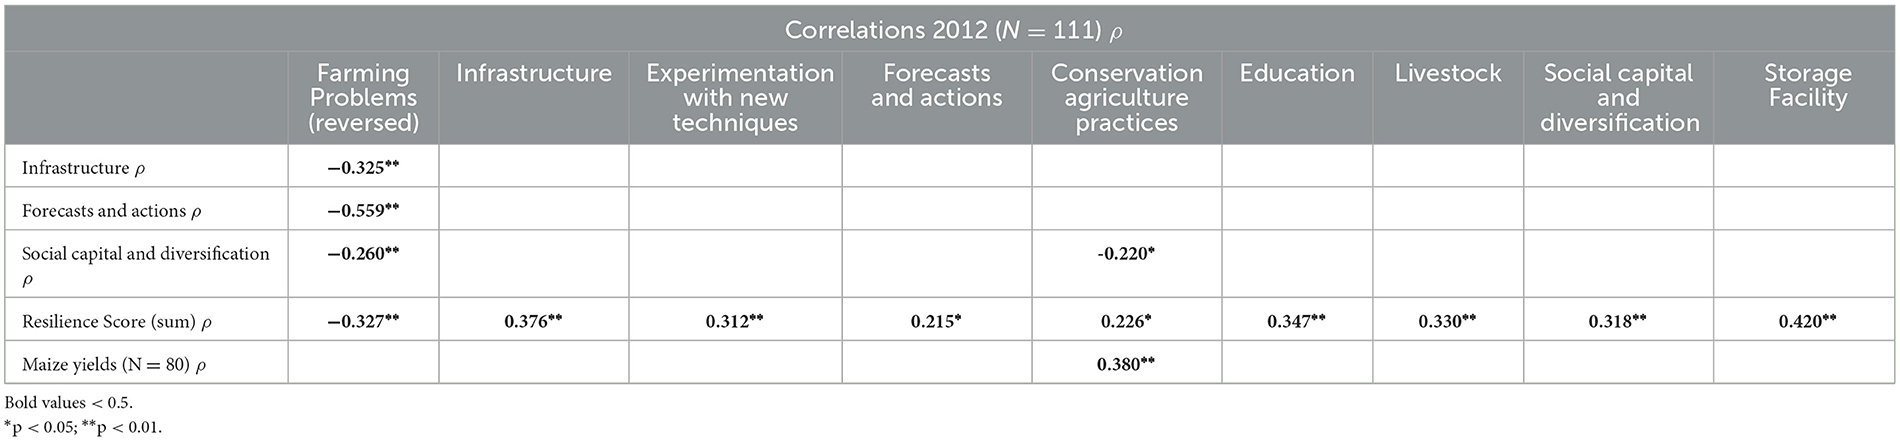
Table 5. Correlation matrix components of resilience 2012 (significant correlations).

Table 6. Correlation matrix components of resilience 2015 (significant correlations).
In 2012, a positive correlation existed between forecasts and actions, and farming problems. In 2015, farming problems negatively correlated with storage facility. Further, the quality of the storage facility was found to positively correlate with land area and income.
While in 2012 households with higher scores of social capital and diversification were experiencing more farming problems, in 2015, the situation was the opposite. Livestock also positively correlated with experimentation with new techniques in 2015.
Our findings show that livelihood resilience varies across time and space. The period 2012–2015 (4 years) was characterized by an overall improvement of resilience in Makueni County.
However, the fact that only four out of ten components of resilience had significantly increased from 2012 to 2015 (4 years), raises questions about whether this trend is sufficient to enable smallholders to cope with future shocks. Factors underpinning resilience also vary over time—a variable that is important for resilience in 2012 becomes less important for livelihood resilience in 2015 (e.g., forecasts and actions related to farming problems). While common variables underpinning livelihood resilience across geographic context such as wealth and financial capital exist (Béné et al., 2016), Awazi and Quandt (2021) show that context matters in capturing livelihood resilience, as variables important for resilience in one context might be less important for resilience in another context. Thus, a robust and multi-dimensional/multi-factorial index is necessary.
Besides the overall resilience increase, our findings also show that the relationships between the different components of resilience, and their relations to livelihood outcomes have changed during the assessed time period. The period from 2012 to 2015 was characterized by a succession of droughts, which ended only in 2015, when above-average rainfall was recorded. We can therefore assume that the OND season in 2015 was the only main growing season during the research period that provided sufficient rainfall for a successful agricultural production.
In 2015, food security positively correlated with resilience, as well as with several of its components. However, the fact that all farmers, although harvesting above-average yields during normal-above average rainfall conditions in 2015, ran out of food at some point during the year, shows that even better-off households are not self-sufficient. Regarding Buffer Capacity, households with more land and income were more food secure. This finding aligns with the results of Matter et al. (2021) and those of Ifejika Speranza et al. (2008), who reported that access to croplands larger than 2 ha reduced the vulnerability to food insecurity during dry seasons as well as during seasons with average precipitation. In 2015, households with farming problems were also food insecure and had fewer storage facilities. The positive correlation between the quality of the storage facility and land area and income, suggest that households with storage facilities can make more money by selling their produce at higher prices or avoid food purchase at higher prices. This also depends on whether they have other sources of income than farming.
Regarding the Self-Organization dimension of resilience, the negative correlation between infrastructure and food security implies that remote households with constrained access to services and markets are more food secure. As shown by Matter et al. (2021), this contrasts the Livelihood Resilience Framework as well as the findings of other studies that show that adequate access to markets and services fosters resilience (e.g., Colting-Pulumbarit et al., 2018). Matter et al. (2021) argue that remote households are likely to be more self-sufficient and have more land and are therefore less exposed to price fluctuations. Likewise Ifejika Speranza et al. (2008) state that massive selling of produce due to cash needs leads to food deficits and seed shortages. Food insecurity may also be related to farmers' lack of engagement with extension services (Ifejika Speranza et al., 2008). This could be explained with privatization processes and reduced support under neoliberal policies and rising costs for farmers (Heidhues et al., 2004; Nyangito et al., 2004; Muyanga and Jayne, 2008; Matter et al., 2021). Hence, socio-economic characteristics of farming households clearly affect their possibilities to access extension services (Makate et al., 2019). Households with higher scores of social capital and diversification in 2015 were found to be more food secure. This result is in line with the findings of Andersson and Gabrielsson (2012), who found that collective action strengthens food production and security. While in 2012, households with higher social capital and diversification were found to experience more farming problems (probably related with drought conditions in 2012), in 2015, the situation was the opposite. Different interpretations apply—those households that face challenges join groups to take advantage of collective capacity or use membership as a means to access support and services accessible to groups and not to individuals (Ulrich et al., 2012; Mukhovi et al., 2020). Studies have also shown that more diversified households have less time to focus on farming and their farming activities and hence negatively affecting their agricultural production (e.g., Pfeiffer and Taylor, 2009; Amare and Shiferaw, 2017). At the same time, they can earn better incomes outside agriculture (Bezu et al., 2012).
Regarding Capacity for Learning under drought conditions, in 2012, maize yield was related to conservation agriculture practices. This finding underlines the importance of conservation agriculture practices and management measures like water harvesting, early planting, growing drought tolerant crops, and using fertilizers and plant protection inputs. It is in line with the results of Matter et al. (2021) for the yield in 2015 and with Boillat et al. (2019), whose findings for the OND rain seasons in 2014 and 2015 suggest that a combination of crop rotation, herbicide and fertilizer application increased the chances of harvesting higher yields. Furthermore, food security was found to be positively related to conservation agriculture practices in 2015, reinforcing the findings of Boillat et al. (2019) that conservation agriculture practices are also beneficial during favorable rainfall conditions.
Forecasts and actions were found to be negatively related to food insecurity in 2015. As the year 2015 was characterized by a strong El Niño event (Siderius et al., 2018), the positive correlation between forecasts and actions and conservation agriculture practices in 2015 suggests that farming households respond to forecasts by applying a wider variety of practices.
This study applied the livelihood resilience framework to assess smallholder livelihood resilience over a period of 4 years (2012–2015). This period might be too short to capture dynamics in livelihood resilience; hence, observations over a longer period might yield more insights. Given more financial resources, the sample size of 111 households could be increased to capture more smallholder households in the study area. The Kaiser–Meyer–Olkin (KMO) Measure showed that 74.6% of variance could be attributed to factors underlying livelihood resilience. Hence, there seems to be other variables not captured in the framework that are important for livelihood resilience.
This study aimed to assess the dynamics in smallholder farmers' livelihood resilience in Makueni County by examining the interrelations between indicators of livelihood resilience and livelihood outcomes in 2012 and 2015. It identified 10 components that characterize livelihood resilience, namely farming problems, infrastructure, experimentation with new techniques, land area and income, forecasts and actions, conservation agriculture practices, educational level, livestock assets, social capital and diversification and storage facility. The results showed that depending on households' scores in the different resilience components, the probability of negative or positive livelihood outcomes altered significantly. Moreover, the study revealed that food insecurity still prevails among the surveyed smallholder population in Makueni County, even under favorable rainfall conditions.
Applying the Livelihood Resilience Indicator Framework in a longitudinal study showed that the impacts of the different resilience dimensions on livelihood outcomes have changed within the period of only 4 years. The dynamic interrelations found between the three dimensions and their components highlight the complexity of interactions underpinning livelihood resilience and its dimensions and the crucial need to address it through continuous monitoring. The various indicator variables found relevant for determining smallholders' resilience in 2012 and 2015, pose a potential starting point for further research on livelihood resilience and monitoring over a longer period.
The raw data supporting the conclusions of this article can be made available by the authors upon request. Requests to access these datasets should be directed to Y2hpbndlLmlmZWppa2Euc3BlcmFuemFAZ2l1Yi51bmliZS5jaA==.
Ethical review and approval was not required for the study on human participants in accordance with the local legislation and institutional requirements. The authorities and participants were informed about the research and fieldwork. Both the authorities' and participants' consent were orally obtained before the data collection.
CI: supervision and project coordination. CI and SB: conceptualization and methodology. RA: data organization, data analysis, and writing of first draft. RA, SB, and CI: interpretation of results and review and editing. All authors have read and approved the submitted version of the manuscript.
This paper builds on the framework, data and insights gained in the research project Resilient agriculture-based livelihoods and resilient agricultural landscapes? Adaptation to climate change in African agriculture funded by the Swiss National Science Foundation (SNSF) under its Ambizione grant [PZ00P1_137068]. Follow-up research was funded by the by NERC DFID El Nino Programme 2016 (Ref. NE/P004091/1) through the project ACRES—Agricultural Climate Resilience to El-Nino in sub-Saharan Africa. SB's work is currently funded by Swiss National Foundation for Scientific Research (SNSF), AgroWork project grant number 176736.
We would like to thank the farming households in Makueni County for taking their time to answer the survey questions to enrich us with knowledge on local circumstances. We likewise want to acknowledge the Center for Training and Integrated Research in Arid and Semi-arid Lands Development (CETRAD) and the research assistants for collaboration on data collection. We thank the reviewers for their constructive comments.
The authors declare that the research was conducted in the absence of any commercial or financial relationships that could be construed as a potential conflict of interest.
All claims expressed in this article are solely those of the authors and do not necessarily represent those of their affiliated organizations, or those of the publisher, the editors and the reviewers. Any product that may be evaluated in this article, or claim that may be made by its manufacturer, is not guaranteed or endorsed by the publisher.
The Supplementary Material for this article can be found online at: https://www.frontiersin.org/articles/10.3389/fsufs.2023.1070083/full#supplementary-material
Adger, W. N. (2003). Social capital, collective action, and adaptation to climate change. Economic Geography, 79, 387–404. doi: 10.1111/j.1944-8287.2003.tb00220.x
Adger, W. N. (2006). Vulnerability. Global Environ. Change 16, 268–281. doi: 10.1016/j.gloenvcha.2006.02.006
Alinovi, L., D'Errico, M., Mane, E., and Romano, D. (2010). Livelihoods strategies and household resilience to food insecurity: an empirical analysis to Kenya. Florence, European University Institute.
Allison, E., and Ellis, F. (2001). The livelihoods approach and management of small-scale fisheries. Marine Policy 25, 377–388. doi: 10.1016/S0308-597X(01)00023-9
Amare, M., and Shiferaw, B. (2017). Nonfarm employment, agricultural intensification, and productivity change: empirical findings from Uganda. Agric. Econ. 48, 59–72. doi: 10.1111/agec.12386
Anbar, A. H., Abu-Dalhoum, M., Maslamani, A., Al Antary, T. M., and Sawwan, J. (2020). Agricultural Patterns in Jordan: a new analytical approach. Fresenius Environ. Bull. 29, 11006–11016. doi: 10.13140/RG.2.2.18007.09128
Andersson, E., and Gabrielsson, S. (2012). ‘Because of poverty, we had to come together’: Collective action for improved food security in rural Kenya and Uganda. Int. J. Agric. Sustain. 10, 1–18. doi: 10.1080/14735903.2012.666029
Awazi, N. P., and Quandt, A. (2021). Livelihood resilience to environmental changes in areas of Kenya and Cameroon: a comparative analysis. Clim. Change, 165, 33. doi: 10.1007/s10584-021-03073-5
Ayugi, B., Tan, G., Niu, R., Dong, Z., Ojara, M., Mumo, L., et al. (2020). Evaluation of meteorological drought and flood scenarios over Kenya, East Africa. Atmosphere, 11, 1–20. doi: 10.3390/atmos11030307
Bahadur, A., Wilkinson, E., Lovell, E., and Tanner, T. (2015). Resilience in the SDGs: developing an indicator for Target 1, 5. that is fit for purpose. London, Overseas Development Institute.
Bahadur, A. V., Ibrahim, M., and Tanner, T. (2010). The resilience renaissance? Unpacking of resilience for tackling climate change and disasters. Brighton, IDS.
Béné, C., Al-Hassan, R., Amarasinghe, O., Fong, P., Ocran, J., Onumah, E., et al. (2016). Is resilience socially constructed? Empirical evidence from Fiji, Ghana, Sri Lanka, and Vietnam. Global Environ. Change 38, 153–170. doi: 10.1016/j.gloenvcha.2016.03.005
Berkes, F., Colding, J., and Folke, C. (2002). “Introduction,” in Berkes, F., Colding, J., and Folke, C. eds. Navigating social-ecological systems: building resilience for complexity and change. Cambridge: Cambridge University Press. p. 1–30. doi: 10.1017/CBO9780511541957.003
Bezu, S., Barrett, C. B., and Holden, S. T. (2012). Does the nonfarm economy offer pathways for upward mobility? Evidence from a panel data study in Ethiopia. World Dev. 40, 1634–1646. doi: 10.1016/j.worlddev.2012.04.019
Boillat, S., Jew, E. K. K., Steward, P. R., Ifejika Speranza, C., Whitfield, S., Mkwambisi, D., et al. (2019). Can smallholder farmers buffer rainfall variability through conservation agriculture? On-farm practices and maize yields in Kenya and Malawi. Environ. Res. Lett. 14, 115007. doi: 10.1088/1748-9326/ab45ad
Campbell, D. (2021). Environmental change and the livelihood resilience of coffee farmers in Jamaica: a case study of the Cedar Valley farming region. J. Rural Stud. 81, 220–234. doi: 10.1016/j.jrurstud.2020.10.027
Carpenter, S., Walker, B., Anderies, J., and Abel, N. (2001). From metaphor to measurement: resilience of what to what? Ecosystem 4, 765–781. doi: 10.1007/s10021-001-0045-9
Chambers, R., and Conway, G. (1992). Sustainable rural livelihoods: Practical concepts for the 21st century. IDS Discussion Paper. Brighton: Institute of Development Studies.
Colting-Pulumbarit, C., Lasco, R., Rebancos, C., and Coladilla, J. (2018). Sustainable livelihoods-based assessment of adaptive capacity to climate change: the case of organic and conventional vegetable farmers in La Trinidad, Benguet, Philippines. J. Environ. Sci. Manage. 21, 57–69. doi: 10.47125/jesam/2018_2/08
COMPAS (2007). Learning endogenous development: building on bio-cultural diversity. Bourton on Dunsmore, Rugby, Warwickshire (UK): Practical Action Publishing. doi: 10.3362/9781780445298
Cumming, G. S. (2011). Spatial resilience: integrating landscape ecology, resilience, and sustainability. Landsc. Ecol. 26, 899–909. doi: 10.1007/s10980-011-9623-1
Denton, F., Wilbanks, T. J., Abeysinghe, A. C., Burton, I., Gao, Q., Lemos, M. C., et al. (2014). “Climate-resilient pathways: adaptation, mitigation, and sustainable development,” in Field, C. B., Barros, V. R., Dokken, D. J., Mach, K. J., Mastrandrea, M. D., Bilir, T. E., Chatterjee, M., Ebi, K. L., Estrada, Y. O., Genova, R. C., Girma, B., Kissel, E. S., Levy, A. N., Maccracken, S., Mastrandrea, P. R., and White, L. L. (eds.) Climate Change 2014: impacts, adaptation, and vulnerability. Part A: global and sectoral aspects. Contribution of working group II to the fifth assessment report of the intergovernmental panel on climate change. Cambridge and New York: Cambridge University Press. p. 1101–1131.
DiStefano, C., Zhu, M., and Mîndrilã, D. (2009). Understanding and using factor scores: considerations for the applied researcher. Pract. Assess. Res. Evaluat. 14, 20. doi: 10.7275/da8t-4g52
Folke, C. (2006). Resilience: the emergence of a perspective for social–ecological systems analyses. Global Environ. Change 16, 253–267. doi: 10.1016/j.gloenvcha.2006.04.002
Food Agriculture Organization. (2022). FAOSTAT Crop production data. Kenya, United Nations, Available online at: https://www.fao.org/faostat/en/#data (accessed 24, 3.2022).
Gichuki, F. (2000). Makueni district profile: rainfall variability, 1950–1997. Working Paper 2. Crewkerne, UK: Drylands Research.
Gong, Y., Zhang, R., Yao, K., Liu, B., and Wang, F. (2020). A livelihood resilience measurement framework for dam-induced displacement and resettlement. Water 12, 1–23. doi: 10.3390/w12113191
Government of Kenya 2018. National Climate Change Action Plan 2018–2022 Nairobi Ministry of Environment Forestry. Available online at: http://www.environment.go.ke/wp-content/uploads/2020/03/NCCAP_2018-2022_ExecutiveSummary-Compressed-1.pdf (accessed on November 19, 2020).
Government of Kenya. (2012). Vision 2030 development strategy for Northern Kenya and other arid lands, final report, Nairobi, Ministry of State for Development of Northern Kenya and other Arid Lands. Available online at: https://www.ndma.go.ke/index.php/resource-center/policy-documents/send/44-policy-documents/4300-vision-2030-development-strategy-for-asals (accessed 18, 2021).
Government of Kenya. (2013). Makueni County First County Integrated Development Plan 2013–2017. Nairobi, Government of Kenya. Available online at: https://makueni.go.ke/download/makueni-county-integrated-development-plan-2013-2017/ (accessed November 20, 2020).
Heidhues, F., Atsain, A., Nyangito, H., Padilla, M., Ghersi, G., Vallée, L., et al. (2004). The Conceptual and Strategic Responses of Various Stakeholders to the African Food Security Crises. Development strategies and food and nutrition security in Africa: an assessment. Washington DC: International Food Policy Research Institute. p. 7–20.
Ifejika Speranza, C. (2013). Buffer capacity: capturing a dimension of resilience to climate change in African smallholder agriculture. Regional Environ. Change 13, 521–535. doi: 10.1007/s10113-012-0391-5
Ifejika Speranza, C., de Chastonay, A., and Oggier, S. (2013). Resilient Agriculture-Based Livelihoods and Resilient Agricultural Landscapes, Bern. (accessed March 2, 2020).
Ifejika Speranza, C., Kiteme, B., and Wiesmann, U. (2008). Droughts and famines: the underlying factors and the causal links among agro-pastoral households in semi-arid Makueni district, Kenya. Global Environ. Change 18, 220–233. doi: 10.1016/j.gloenvcha.2007.05.001
Ifejika Speranza, C., Wiesmann, U., and Rist, S. (2014). An indicator framework for assessing livelihood resilience in the context of social- ecological dynamics. Global Environ. Change 28, 109–119. doi: 10.1016/j.gloenvcha.2014.06.005
Intergovernmental Panel on Climate Change (2007). Fourth Assessment Report: Impacts, Adaptation, and Vulnerability. Contribution of working group II, Cambridge: Cambridge University Press.
Intergovernmental Panel on Climate Change (2014a). Climate change 2013: the physical science basis: Working Group I contribution to the Fifth assessment report of the Intergovernmental Panel on Climate Change. Cambridge, Cambridge University Press. doi: 10.1017/CBO9781107415324
Intergovernmental Panel on Climate Change (2014b). Climate change 2014 impacts, adaptation, and vulnerability Part B: regional aspects: working group II contribution to the fifth assessment report of the intergovernmental panel on climate change. Cambridge, Cambridge University Press.
Libório, M. P., da Silva Martinuci, O., Machado, A. M. C., Machado-Coelho, T. M., Laudares, S., and Bernardes, P. (2020). Principal component analysis applied to multidimensional social indicators longitudinal studies: limitations and possibilities. GeoJournal 87, 1453–1468. doi: 10.1007/s10708-020-10322-0
Liu, W., Li, J., Ren, L., Xu, J., Li, C., Li, S., et al. (2020). Exploring livelihood resilience and its impact on livelihood strategy in rural China. Soc. Indic. Res. 150, 977–998. doi: 10.1007/s11205-020-02347-2
Makate, C., Makate, M., Mutenje, M., Mango, N., and Siziba, S. (2019). Synergistic impacts of agricultural credit and extension on adoption of climate-smart agricultural technologies in Southern Africa. Environ. Develop. 32, 100458. doi: 10.1016/j.envdev.2019.100458
Marschke, M. J., and Berkes, F. (2006). Exploring strategies that build livelihood resilience: a case from Cambodia. Ecol. Soc. 11, 1. doi: 10.5751/ES-01730-110142
Matter, S., Ifejika Speranza, C., and Boillat, S. (2021). Buffer-capacity-based livelihood resilience to stressors—an early warning tool and its application in Makueni couinty, Kenya. Front. Sustain. Food Syst. 213, 645046. doi: 10.3389/fsufs.2021.645046
Milestad, R., and Darnhofer, I. (2003). Building farm resilience: the prospects and challenges of organic farming. J. Sustain. Agric. 22, 81–97. doi: 10.1300/J064v22n03_09
MoALF 2016. Climate Risk Profile for Makueni: Kenya County Climate Risk profile Series. Nairobi Ministry of Agriculture Livestock Fisheries. Available online at: https://cgspace.cgiar.org/handle/10568/80457 (accessed September 28, 2020).
Mukhovi, S. M., Jacobi, J., Llanque, A., Rist, S., Delgado, F., Kiteme, B., et al. (2020). Social self-organization and social-ecological resilience in food systems: lessons from smallholder agriculture in Kenya and indigenous Guaraní communities in Bolivia. Food Stud. 10, 19–42. doi: 10.18848/2160-1933/CGP/v10i01/19-42
Mumo, L., Yu, J., and Fang, K. (2018). Assessing impacts of seasonal climate variability on maize yield in Kenya. Int. J. Plant Prod. 12, 297–307. doi: 10.1007/s42106-018-0027-x
Muyanga, M., and Jayne, T. (2008). Private agricultural extension system in Kenya: practice and policy lessons. J. Agric. Edu. Extension 14, 111–124. doi: 10.1080/13892240802019063
Niang, I., Ruppel, O. C., Abddrabo, M. A., Essel, A., Lennard, C., Padgham, J., et al. (2014). “Africa,” in: Barros, V. R., Field, C. B., Dokken, D. J., Mastrandrea, M. D., Mach, K. J., Bilir, T. E., Chatterjee, M., Ebi, K. L., Estrada, Y. O., Genova, R. C., Girma, B., Kissel, E. S., Levy, A. N., Maccracken, S., Mastrandrea, P. R., and White, L. L. (eds.) Climate change 2014: impacts, adaptation and vulnerability. Part B: regional aspects. Working group II contribution to the fifth assessment report. Cambridge: Cambridge University Press. p. 1199–1266.
Nowak, A., Steward, P., Namoi, N., Kamau, H., Lamanna, C., Rosenstock, T. S., et al. (2020). The business case for resilient agriculture: A financial and risk analysis of maize farming technologies in Kenya. Available online at: https://cgspace.cgiar.org/handle/10568/109031 (accessed March 22, 2022).
Nyangito, H. O., Nzuma, J., Ommeh, H., and Mbithi, M. (2004). Impact of agricultural trade and related policy reforms on food security in Kenya. Available online at: http://erepository.uonbi.ac.ke/handle/11295/16986 (accessed September 20, 2020).
Obrist, B., Pfeiffer, C., and Henley, R. (2010). Multi-layered social resilience: a new approach in mitigation research. Prog. Develop. Stud. 10, 283–293. doi: 10.1177/146499340901000402
OSM (Open Street Maps Foundation). (2021). OpenStreetMaps. London: Open Street Maps Foundation. Available online at: www.openstreetmap.org (accessed March 10, 2021).
Pfeiffer, L. López-Feldman, A., and Taylor, J. E. (2009). Is off-farm income reforming the farm? Evidence from Mexico. Agric. Econ. 40, 125–138. doi: 10.1111/j.1574-0862.2009.00365.x
Quandt, A. (2018). Measuring livelihood resilience: the household livelihood resilience approach (HLRA). World Dev. 107, 253–263. doi: 10.1016/j.worlddev.2018.02.024
Sallu, S. M., Twyman, C., and Stringer, L. C. (2010). Resilient or vulnerable livelihoods? Assessing livelihood dynamics and trajectories in rural botswana. Ecology and Society, 15. Available online at: https://www.ecologyandsociety.org/vol15/iss4/art3/ (accessed April 19, 2020).
Scoones, I. (2009). Livelihoods perspectives and rural development. J. Peasant Stud. 36, 171–196. doi: 10.1080/03066150902820503
Siderius, C., Gannon, K. E., Ndiyoi, M., Opere, A., Batisani, N., Olago, D., et al. (2018). Hydrological response and complex impact pathways of the 2015/2016 El Niño in Eastern and Southern Africa. Earth's Future 6, 2–22. doi: 10.1002/2017EF000680
Sina, D., Chang-Richards, A. Y., Wilkinson, S., and Potangaroa, R. (2019). A conceptual framework for measuring livelihood resilience: relocation experience from Aceh, Indonesia. World Dev., 117, 253–265. doi: 10.1016/j.worlddev.2019.01.003
Ulrich, A., Ifejika Speranza, C., Roden, P., Kiteme, B., Wiesmann, U., Nüsser, M., et al. (2012). Small-scale farming in semi-arid areas: livelihood dynamics between 1997 and 2010 in Laikipia, Kenya. J. Rural Stud. 28, 241–251. doi: 10.1016/j.jrurstud.2012.02.003
United States Geological Survey Climate Hazards Center. (2021). Africa CHIRPS data pentadal, Reston, Virginia. Available online at: https://earlywarning.usgs.gov/fews/ewx/index.html?region=af (accessed June 20, 2021).
Keywords: resilience index, smallholder farming, food security, livelihood resilience, climate resilience, drought, conservation agriculture
Citation: Aschinger R, Boillat S and Ifejika Speranza C (2023) Smallholder livelihood resilience to climate variability in South-Eastern Kenya, 2012–2015. Front. Sustain. Food Syst. 7:1070083. doi: 10.3389/fsufs.2023.1070083
Received: 21 October 2022; Accepted: 06 February 2023;
Published: 29 March 2023.
Edited by:
Amy Quandt, San Diego State University, United StatesReviewed by:
Nyong Princely Awazi, The University of Bamenda, CameroonCopyright © 2023 Aschinger, Boillat and Ifejika Speranza. This is an open-access article distributed under the terms of the Creative Commons Attribution License (CC BY). The use, distribution or reproduction in other forums is permitted, provided the original author(s) and the copyright owner(s) are credited and that the original publication in this journal is cited, in accordance with accepted academic practice. No use, distribution or reproduction is permitted which does not comply with these terms.
*Correspondence: Roman Aschinger, cm9tYW4uYXNjaGluZ2VyQGdpdWIudW5pYmUuY2g=
Disclaimer: All claims expressed in this article are solely those of the authors and do not necessarily represent those of their affiliated organizations, or those of the publisher, the editors and the reviewers. Any product that may be evaluated in this article or claim that may be made by its manufacturer is not guaranteed or endorsed by the publisher.
Research integrity at Frontiers
Learn more about the work of our research integrity team to safeguard the quality of each article we publish.