 Jennifer B. Thompson1,2*Jennifer Symonds1Liz Carlisle3Alastair Iles1Daniel S. Karp4Joanna Ory1Timothy M. Bowles1
- 1Department of Environmental Science, Policy, and Management, University of California, Berkeley, Berkeley, CA, United States
- 2Leibniz Centre for Agricultural Landscape Research, Müncheberg, Germany
- 3Environmental Studies Program, University of California, Santa Barbara, Santa Barbara, CA, United States
- 4Department of Wildlife, Fish, and Conservation Biology, University of California, Davis, Davis, CA, United States
Non-crop vegetation, such as hedgerows and cover crops, are important on-farm diversification practices that support biodiversity and ecosystem services; however, information about their rates and patterns of adoption are scarce. We used satellite and aerial imagery coupled with machine learning classification to map the use of hedgerows/windbreaks and winter cover crops in California's Central Coast, a globally important agricultural area of intensive fresh produce production. We expected that adoption of both practices would be relatively low and unevenly distributed across the landscape, with higher levels of adoption found in marginal farmland and in less intensively cultivated areas where the pressure to remove non-crop vegetation may be lower. Our remote sensing classification revealed that only ~6% of farmland had winter cover crops in 2021 and 0.26% of farmland had hedgerows or windbreaks in 2018. Thirty-seven percent of ranch parcels had cover crops on at least 5% of the ranch while 22% of ranches had at least one hedgerow/windbreak. Nearly 16% of farmland had other annual winter crops, some of which could provide services similar to cover crops; however, 60% of farmland had bare soil over the winter study period, with the remainder of farmland classified as perennial crops or strawberries. Hotspot analysis showed significant areas of adoption of both practices in the hillier regions of all counties. Finally, qualitative interviews revealed that adoption patterns were likely driven by interrelated effects of topography, land values, and farming models, with organic, diversified farms implementing these practices in less ideal, lower-value farmland. This study demonstrates how remote sensing coupled with qualitative research can be used to map and interpret patterns of important diversification practices, with implications for tracking policy interventions and targeting resources to assist farmers motivated to expand adoption.
Introduction
Non-crop vegetation plays important roles on farms. Non-crop vegetation includes any non-harvested plants on the farm including, but not limited to, isolated trees, hedgerows, windbreaks, cover crops, floral strips, and riparian buffers. Planting non-crop vegetation is an example of a diversification practice, or a practice that brings biodiversity to an agroecosystem and helps support ecosystem services. Planned, non-crop vegetation like winter cover crops and hedgerows supports associated biodiversity including soil microbes, pollinators, birds, and other taxa (Verboom and Huitema, 1997; Pereira and Rodríguez, 2010; Morandin et al., 2011; Lecq et al., 2017). In turn, both planted non-crop species and the biodiversity that they support can provide critical ecosystem services (although disservices can also result; Zhang et al., 2007). Such ecosystem services benefit both farms and the surrounding environment (Kremen and Miles, 2012; Tamburini et al., 2020); for instance, by supporting bees, other pollinators, pest predators, and parasitoids, hedgerows bolster crop pollination and pest control services and, by doing so, may allow for high yields with fewer agrochemical inputs (Cranmer et al., 2012; Morandin and Kremen, 2013; Long et al., 2017; Castle et al., 2019; Ponisio et al., 2019; Albrecht et al., 2020). Similarly, cover crops increase nutrient cycling and retention services and maintain healthier soils, which may support yields with fewer inputs while reducing harmful nutrient losses (Brennan and Smith, 2005; Heinrich et al., 2014; Büchi et al., 2018; Lugato et al., 2020). As such, non-crop vegetation can help enhance farm viability by securing livelihoods for farmers while reducing the negative environmental externalities of agriculture (Kremen and Miles, 2012; Kremen et al., 2012).
Given the potential benefits of such diversification practices, it is important to understand rates and patterns of farmer adoption in order to target investments of research, technical assistance, and policy interventions as well as track their impacts over time. Yet such information is rarely available in the United States, including in California, where multiple recent policies make baseline knowledge of the extent of their usage particularly important. For example, California's Healthy Soils Program provides incentives to producers for adopting practices that sequester carbon or reduce greenhouse gas emissions (CDFA California Department of Food Agriculture, 2022), including planting non-crop vegetation. Similarly, California's Climate Scoping Plan (CARB California Air Resources Board, 2022) highlights non-crop vegetation as a strategy for meeting goals related to climate change mitigation in working landscapes. Regional implementation of water quality regulations recognize cover crops for their ability to scavenge nitrogen and reduce nitrate leaching to groundwater (California Regional Water Quality Control Board: Central Coast Region, 2021). Finally, recent state bans on the pesticide chlorpyrifos make natural pest control services–like those that may be provided by hedgerows–all the more critical (Alternatives to Chlorpyrifos Work Group., 2020).
Even with these emerging policies advocating for non-crop vegetation, available estimates from government surveys or expert opinion suggest it is rarely planted on California farms. Cover crops have been grown on only ~5% of farmland in recent years (Brennan, 2017; USDA United States Department of Agriculture, 2019), while statewide estimates for other non-crop vegetation practices, like hedgerows and windbreaks, do not even exist. Qualitative studies have documented significant barriers to adoption for hedgerows and cover crops, especially in California's Central Coast (Esquivel et al., 2021; Carlisle et al., 2022). This region produces mainly vegetables and fruits that are often consumed raw (e.g., lettuce and strawberries), and food safety concerns are paramount. Following a 2006 outbreak of pathogenic E. coli on bagged spinach in which over 200 people became ill and 3 died (Jay et al., 2007), leafy greens buyers required growers to implement comprehensive new food-safety protocols on farmers, intending to minimize the risk of crop contamination with foodborne pathogens from wildlife vectors (Karp et al., 2015). At least 32% of leafy green growers in California's Central Coast reported removing non-crop vegetation on their farms in a survey following the 2006 E. coli outbreak (Beretti and Stuart, 2008). Nearly a decade after the incident, ~45% of California produce growers still reported clearing vegetation to create or expand bare-ground buffers around their fields (Baur et al., 2016), despite evidence suggesting the practice is ineffective at mitigating food-safety risks (Karp et al., 2015; Sellers et al., 2018; Glaize et al., 2021; Weller et al., 2022). Thus, growers often perceive that hedgerows and windbreaks pose food safety risks in attracting and harboring wildlife, and additional supply chain requirements from processors or retailers may actually prohibit hedgerows in close proximity to crops like leafy greens (Carlisle et al., 2022). Other barriers to hedgerow adoption include high costs of initial installation and maintenance, and the relatively long time to mature and provide pest control or pollination benefits, unlike herbaceous non-crop vegetation like insectary strips (Long et al., 2017), not to mention the cost of taking land out of production for non-crop vegetation. Long-term gains are unlikely to motivate adoption for the many growers in the Central Coast with shorter-term land leases (Calo and De Master, 2016; Chapman et al., 2022).
Barriers to cover crop adoption on the Central Coast similarly involve a combination of economic constraints, perceptions of risk, technical challenges, and problems with policy programs and/or incentives (Stuart, 2009). The main obstacle to growing cover crops in the Central Coast is the high cost of land; Monterey and Santa Cruz counties have the 4th and 5th highest agricultural land rents of counties in California (NASS U.S. National Agricultural Statistics Service, 2020). Growing cover crops that could interfere with cash crop production is a major perceived opportunity cost (Carlisle et al., 2022; Chapman et al., 2022). Farms often grow multiple cash crops per year, which requires careful planning to stay on schedule, especially with highly variable weather (Brennan, 2017). In the warm-summer Mediterranean climate (Beck et al., 2020), which has highly variable interannual precipitation, low rainfall reduces cover crop germination and/or growth and discourages growers from planting a cover crop in the first place, especially if additional irrigation could be needed. Unpredictable rain patterns can delay the clearing and incorporation of cover crop residue when soils are heavily saturated late in the winter season (Hartz and Johnstone, 2006). In turn, this delays cash crop planting as growers wait for soils to dry before doing the significant soil and bed preparation operations often used in vegetable and berry production. Residue management is another obstacle to implementing cover crops, since large pieces of plant residue can impede cultivation and planting of small-seeded vegetables (Brennan, 2017).
While social science research has identified barriers to using hedgerows, windbreaks, and cover crops, fine scale information on the extent and patterns of adoption at regional or local landscape scales is unavailable. Such information could identify hotspots and coldspots of hedgerow and cover crop adoption, which would complement social science research and also identify where to concentrate resources to support greater adoption.
Remote sensing offers an opportunity for detecting and quantifying farming practices across wide areas, over time, and at fine scales by using readily available satellite or aerial imagery. Remote sensing of cover crop use to understand adoption patterns and benefits has been successful in the U.S. Midwest (Hively et al., 2009, 2015; Seifert et al., 2018; Kushal et al., 2021). Several studies have also classified non-crop vegetation such as hedgerows and trees via remote sensing (Ghimire et al., 2014; O'Connell et al., 2015). However, previous studies have often focused on regions, such as much of the Midwest, where just one or two crops dominate vast areas of large fields with little natural habitat remaining. Areas like the Central Coast of California pose additional challenges for remote sensing of non-crop vegetation. As one of the most intensively-cropped and productive agricultural regions in the U.S, the Central Coast produces dozens of crops, including strawberries, leafy greens, grapes, and other specialty crops (CDFA California Department of Food Agriculture, 2022). Such crops can be grown nearly year-round in the region's climate, often on small, irregular fields surrounded by varying levels of natural habitat. Remote sensing of non-crop vegetation in agricultural regions like this requires dealing with the many challenges of differentiating between crops, practices, and features on such a biologically diverse and spatially varied landscape.
In this study, we used remote sensing and machine learning to classify and quantify the extent of hedgerows, windbreaks, and cover crops across the Central Coast of California. We chose these diversification practices as they are important for supporting biodiversity and ecosystem services on farms, both within (cover crops) and around (hedgerows/windbreaks) areas of crop production. They are also readily visible from aerial and satellite imagery compared to other diversification practices like compost use or very narrow floral insectary strips. We focused specifically on winter cover crops as cover crops are most commonly used over the winter in this region (Brennan, 2017), when they play a particularly important role reducing nitrate leaching (Jackson et al., 1993). We also coupled remote sensing observations with qualitative interviews with 20 growers and 8 technical advisors to gain insight into patterns of adoption. Our objectives were to provide baseline understanding of practice adoption across a three-county region and to assess spatial patterns of adoption. We expected that adoption of both practices would be relatively low and unevenly distributed across the landscape with higher levels of adoption found in marginal farmland and in less intensively cultivated areas where the pressure to remove non-crop vegetation may be lower. More broadly, our analysis represents a first step toward tracking adoption of key diversification practices in one of the most intensive agricultural regions in the world.
Materials and methods
Study area and data collection
Our study focused on farmland in San Benito, Santa Cruz, and Monterey counties, encompassing 7,787 km2 of California's Central Coast (USDA United States Department of Agriculture, 2019). Farmland within each county was determined with ranch boundary shapefiles provided by each county's agricultural commissioner's office. Here, ranch refers to an agricultural operation and can include rangeland with livestock as well as orchards, annual cropping operations, and mixed operations. The ranch boundaries represent the entire property boundaries, not individual field boundaries. Ranches composed entirely of rangeland, determined by land use classifications provided by the county agricultural commissioners' offices as well as visual inspection, were excluded from the study areas, as many were covered in naturally growing shrubs that could be mistaken for hedgerows in the analysis.
To collect training data for classification algorithms, we conducted “windshield surveys” for hedgerows in July 2019 and for cover crops in January 2021. For each survey, we drove systematically through farmland and recorded GPS points corresponding to several types of crop and non-crop vegetation. Hedgerows were defined as linear strips of shrubs or small trees at least 5 m in length and longer than it was wide. Windbreaks were defined similarly but instead consisted of taller trees. As there was ambiguity between which strips would be classified as hedgerows and others windbreaks, we combined both into a single “hedgerow/windbreak” category. Based on the windshield survey and additional expert image analysis, we identified 98 hedgerows/windbreaks. For cover crops, we identified bare fields (i.e., no plant cover, 171 points), cover crops (76 points), and various winter cash crops (178 points, for full list of crops see Supplementary material). Cover crops were predominantly grasses or grain/vetch/radish/legume mixes with some single-species vetch, mustard, legume, and radish cover crops also recorded. While some crops (e.g., radishes or brassicas) can be both cash and cover crops, we distinguished between them to the best of our ability by noting bed and row formation as cash crops are planted in rows while cover crops are broadcast seeded.
Hedgerow/windbreak classification
Object based image analysis (OBIA) (Blaschke, 2010) was used to classify hedgerows/windbreaks. In OBIA, similar pixels are grouped together as objects and are grown until the algorithm determines it has reached a dissimilar pixel. The spectral, geometric, or textural qualities of the object can be used for land-use classification. Previous studies have had success in employing OBIA to identify small farm elements, like hedgerows, as it eliminates error found in pixel-based classification which could prevent small objects from being properly classified (Sheeren et al., 2009; Tansey et al., 2009; Ghimire et al., 2014; O'Connell et al., 2015).
We utilized pre-processed digital 4-band National Agriculture Imagery Program (NAIP) imagery (NAIP, Aerial Photography Field Office (AFPO), 2018) from 2018 with a spatial resolution of 60 cm2. We used a multiresolution segmentation algorithm in the eCognition software (Trimble Geospatial Imaging, Munich, Germany) to create image objects. For more detailed methods see Supplementary material.
Once images were segmented, we used rule based classification and 1,010 model training image objects from the windshield survey and expert image analysis to classify the objects as one of the following seven land-use: agriculture (row crops), hedgerows/windbreaks, vineyards, non-linear (non-hedgerow) shrubs or trees, bare soil and/or urban, orchards, and water. We used 98 hedgerow/windbreak image objects, 116 orchard objects, 189 shrub/tree objects, 294 vineyard objects, and 311 row crop objects. Objects with a normalized difference vegetation index (NDVI) of <0.1 were classified as bare/urban and excluded from the subsequent classification. While 0.2 is a common threshold for vegetative vs. bare or urban land (Sobrino et al., 2001), we found that the OBIA sometimes included pixels of the hedgerow/windbreak shadow on bare ground, which subsequently lowered the NDVI. Thus, a more conservative threshold was chosen to avoid excluding any possible hedgerows/windbreaks. Objects with a normalized difference water index (NDWI) >0.3 were classified as water. For each remaining unclassified training object, we exported image object information for 35 variables representing object spectral (e.g., NDVI), geometric (e.g., length to width ratio), and textural (e.g., spatial patterns between pixels in a single object) information that could be used to classify each vegetative class (Supplementary Table S1). Highly correlated variables (R2> 0.75) were excluded from the classifier. The remaining 23 image object variables of each training object were used to train a random forest classifier model using R statistical software v4.1.2 (R Core Team, 2022) using the package randomforest (Liaw and Wiener, 2002). The out-of-bag (OOB) error of the random forest model, a measure of prediction error for machine learning models, was 5.82%. Once the ideal classifier parameters were established in R, we ran a random forest model in eCognition using these parameters to classify all the segmented images. We also distinguished between hedgerows/windbreaks and riparian vegetation in our post-classification analysis. Riparian vegetation can consist of shrubs, trees, and other plants with similar spectral properties and shapes as hedgerows. Thus, to avoid over-classification of riparian vegetation as hedgerows/windbreaks, we reclassified all shrub and hedgerow/windbreak objects bordering water as riparian vegetation and it was excluded from subsequent analysis.
After classification, 500 accuracy assessment points in the classified images were randomly created in ArcGIS by equal stratified random sampling. Each point was assigned one of the seven land covers land cover classes based on expert image interpretation or data from the windshield survey, if available, and compared to the model's predicted classification. The overall accuracy was 90.0% and the kappa, another measure of model accuracy, was 0.89. As for our class of interest, hedgerows/windbreaks, there was a producer's accuracy of 97% and a user's accuracy of 63% indicating that the model almost always classified a hedgerow/windbreak if it was there but also tended to over classify other linear elements, such as drainage ditches filled with vegetation, as hedgerows. Thus, to have the most accurate classification possible, all objects classified as hedgerows/windbreaks were manually inspected and reclassified if needed.
Cover crop classification
We used Sentinel-2 satellite imagery for cover crop classifications in Google Earth Engine (Gorelick et al., 2017). We chose Sentinel-2 imagery for its high spatial (10 m) and temporal resolution (5 day), ideal for capturing small fields and multiple dates of imagery. We used temporal aggregation to create composite images by combining multiple days of imagery useful in differentiating crops. We pre-processed satellite imagery to remove cloud cover and create clean images for analysis and added an NDVI band to allow for classifications. For the land use classification, we utilized a two-step classification: threshold and random forest.
To first differentiate perennial vs. annual vegetation, we utilized a rule-based threshold classification. Any pixels that fell below 0.2 NDVI at some point between June 15th, 2020 and January 15th, 2021 were classified as non-perennial, while those that did not fall below 0.2 were classified as perennial as an NDVI below 0.2 indicated a bare field and thus the harvest of an annual crop. We used 0.2 NDVI as it is a common cutoff for differentiating between bare soil and green vegetation (Sobrino et al., 2001). If the NDVI of the pixel never dropped below 0.2, then the soil was likely never bare and thus likely contained a perennial crop. We clipped threshold classification to ranch boundaries. The threshold classification was found to have an overall accuracy of 85% based on an accuracy assessment. The non-perennial class had a user's accuracy of 79% and producer's accuracy of 100%, indicating that the model almost always correctly classified non-perennial land, but included some perennial land in the non-perennial class. This means that while it may include some perennial land, the non-perennial boundaries used for subsequent classification likely did not incorrectly exclude non-perennial land.
For the second part of the classification, we classified all the remaining non-perennial vegetated land into the following classes: cover crops, annual crops, strawberries, and bare-field classes from the median pixel values of December 15, 2020 through February 28, 2021. We selected these dates as they are a common time for winter cover crops in the region before the beds are prepared for the spring crop and they also resulted in the highest model accuracy. We used NDVI, the blue band, and green band as classification variables in a random forest classifier of 100 classification trees. We clipped this classification to the boundaries from the previous threshold classification of non-perennial land, i.e., we only consider these classification results in land determined to be non-perennial agriculture. We used 80% of ground truth data points per class for classifier training, while the remaining 20% were used for accuracy testing (Shelestov et al., 2017). The cover crop classifier was found to be 87% accurate with a kappa of 0.82. Here, we report on our class of interest, cover crops, which had both a user's accuracy of 87% and a producer's accuracy of 87%.
Statistical analysis
Hedgerow/windbreak and cover crop usage, calculated as the percent of a ranch's total area occupied by hedgerows/windbreaks or cover crops, was calculated for every ranch within the boundary shapefile provided. To determine the role of soil type/land quality on diversification practice usage, farmland classification maps were taken from the Natural Resource Conservation Services and the presence of the practice per farmland type (i.e., local importance, statewide importance, grazing land, other land, prime farmland, and unique farmland) was calculated (California Department of Conservation. [n.d.]). Spatial autocorrelation of hedgerows/windbreaks and cover crops was determined using Moran's i (Moran, 1950) and hot spot analysis of hedgerow/windbreak usage was analyzed using Getis-Ord*in ArcGIS (Ord and Getis, 1995). Getis-Ord* takes a feature's value, here a ranch's hedgerow/windbreak or cover crop usage, and compares it to neighboring features; significant clustering of high values indicates a hot spot. Due to a large variation of ranch sizes, as well as distance between ranches in each county, each county was analyzed for hotspots separately to ensure that the appropriate scale was used for the distance matrix needed to calculate the Getis-Ord* statistic. When calculating spatial statistics, a key step is to determine the distance or number of neighbors to compare each feature to that is both appropriate for spatial statistics but also relevant to the spatial context of the study. The distance band, defined as how far away a ranch can be located to be considered another ranch's neighbor, for each county was calculated with the incremental spatial autocorrelation tool in ArcGIS. This tool calculates the global Moran's i at increasing distances to determine a distance where one can find peak clustering for the dataset. The distance band chosen for each county for the hedgerow/windbreak hotspots was 8.37, 9.58, and 4.43 km and for the cover crop hotspot analysis 8.73, 9.91, and 4.43 km (Monterey, Santa Cruz, and San Benito, respectively). The False Discovery Rate was applied which decreases the critical p-value thresholds needed to indicate a hot spot in order to address issues with spatial autocorrelation in the dataset which could inflate the number or significance of hot or coldspots.
Qualitative interviews
In February 2019, we conducted semi-structured, in-depth interviews with 20 farmers in the California Central Coast region who grow organic lettuce as either their primary cash crop or part of a diverse array of crops. We focused on lettuce because it is the most economically valuable vegetable crop grown in the region (CDFA California Department of Food Agriculture, 2022). Within our interview sample, farms ranged in size from 4 acres to over 10,000 acres (mean: 1,935 acres; median: 100 acres) and spanned four counties: Monterey (5 interviews), San Benito (4), Santa Cruz (5), and Santa Clara (1), with 5 additional farmers spanning multiple of these counties. Details of participant recruitment and interview procedures can be found in Esquivel et al. (2021) and Carlisle et al. (2022). Briefly, we selected a stratified sample of all organic farms in these counties that listed organic lettuce as a crop and contacted farmers that reflected ecological diversity (e.g., crop diversity) and a diversity of farm scales (i.e., sizes), geographical locations within the study region, and cultural backgrounds/first languages. Twenty farmers agreed to participate and completed an interview. Because we deliberately included farm types that are less common (highly diversified, medium-sized, direct-market), our sample represents a higher-than-average adoption of cover cropping and hedgerows. In 2020, we also interviewed five additional conventional wholesale farmers in order to include the perspectives of larger, less-diversified farmers who are more representative of the average farm type in our study area.
To complement interviews with growers, in May 2019 we conducted semi-structured, in-depth interviews with 8 technical assistance providers whose names came up repeatedly in interviews with growers. While this was not a systematically representative sample of technical assistance providers in the region, interviewing these individuals allowed us to verify and build on what we learned from grower interviews about patterns of adoption of cover crops and hedgerows. Because these technical assistance providers spoke from their knowledge of the sector as a whole, they could both generalize across multiple operations and speak candidly about sensitive issues that might not be comfortable topics to investigate in the context of a specific operation. These interviews thus provided an opportunity for us to test hypotheses about patterns of adoption that were implied in our grower interviews.
Interview questions posed to both groups (Supplementary material) focused on diversification practices, crop and non-crop diversity, and how farm-level decisions were shaped by various market and policy factors. We began by asking open-ended questions (e.g., what practices do you currently use to maintain or improve soil health on your farm?), and followed with more specific questions (e.g., do you grow any non-crop plants on your farm, such as hedgerows, buffers, or habitat for beneficial insects?). Interviews were digitally recorded and transcribed verbatim. We analyzed interview transcripts in NVivo 12, using an iterative coding method following an open, axial, and selective coding procedure (Corbin and Strauss, 1990). To identify key factors influencing farmer adoption of cover crops and hedgerows, data were coded into thematic categories, such as “Land Costs,” “Pressures from Buyers,” and “Peer Learning and Influence.”
Results
Hedgerows/windbreaks
Our study area included 4,371 ranches across 1,260 km2. Average ranch size in each county was 0.5, 0.18, and 0.1 km2 (or 124, 44, and 24 acres) for Monterey, San Benito, and Santa Cruz counties, respectively. Hedgerows/windbreaks were detected on 22% of the ranches across all 3 counties (Figure 1), with 18% of ranches in San Benito, 27% in Monterey, and 21% in Santa Cruz County having hedgerows. The average length of a hedgerow/windbreak was 116 m. The total area covered in hedgerow/windbreaks across all counties was 3.27 km2 or 0.26% of the study area. Ranches with hedgerows/windbreaks showed significant spatial autocorrelation (Table 1), indicating that ranches with hedgerows/windbreaks were near other ranches with hedgerows.
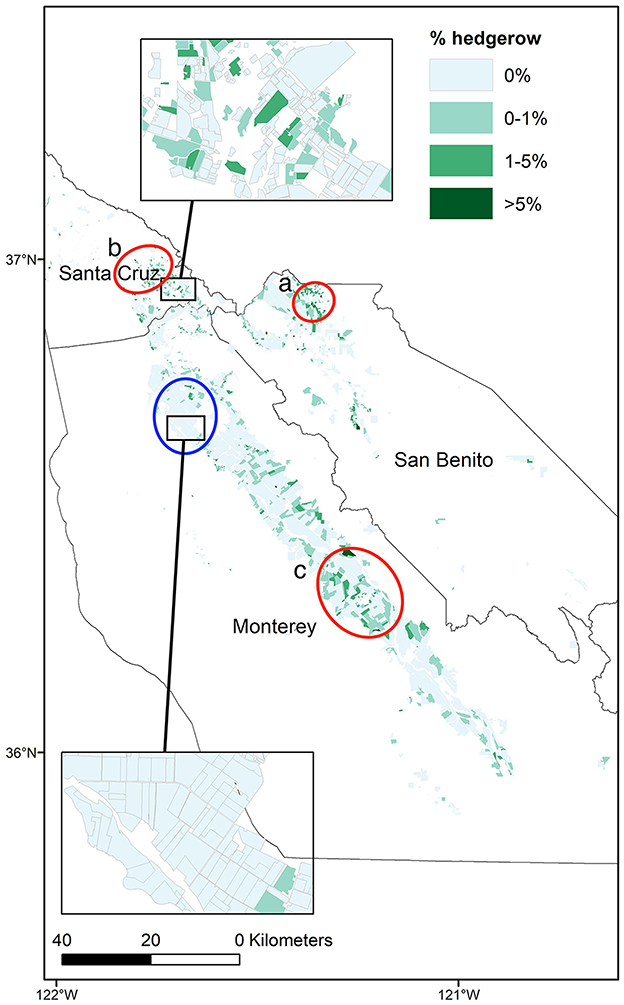
Figure 1. Map of Monterey, San Benito, and Santa Cruz counties showing the percent area of each ranch covered by hedgerows. Inset maps show areas of higher (Santa Cruz) and lower (Monterey) hedgerow adoption. Red ovals indicate significant hotspots of hedgerow adoption, while blue ovals indicate coldspots.
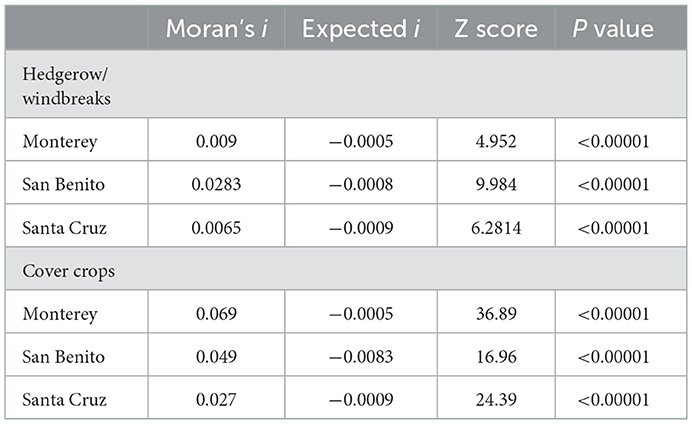
Table 1. Moran's i spatial autocorrelation assessment; significant values indicate spatial autocorrelation of the practice within each county.
The Getis-Ord G* indicated that there are several significant hotspots of hedgerow/windbreak usage. Most notably, these include the most northeast section of San Benito County between (a) the CA-156 highway and nearby hills, (b) the hillier part of the primary Santa Cruz County agricultural region near the census-designated places of Amesti and Freedom, and (c) a hotspot near the cities of Soledad and Greenfield in Monterey County (Figure 1). There were no hotspots detected in the large swath of prime agricultural land between and directly surrounding the cities of Watsonville and Salinas and, notably, a strong coldspot near Salinas in Monterey County.
Cover crops
We found that 74.9 km2 of farmland across the three counties in our study was planted with cover crops over the winter 2020–2021 season. This represents only 5.9% of total farmland area with 37% of ranches having least 5% of their fields cover cropped at this time. Santa Cruz County had the largest percentage of cover cropped farmland at 15.4%, whereas 5.1% of land was cover cropped in Monterey and 5.8% in San Benito (Table 2). In contrast, fields with bare soil constituted the majority of Central Coast farmland (59.9% of land; Supplementary Table S4).
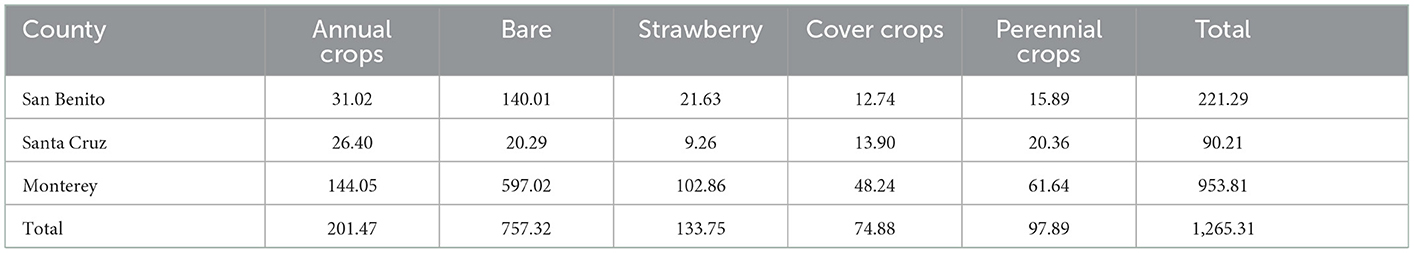
Table 2. Land use cover (in km2) in each county from the cover crop classifier.
Just as for hedgerows/windbreaks, significant spatial autocorrelation was found between ranches that adopted cover crops, indicating clustering of cover crop adoption (Table 1). The Getis-Ord G* analysis indicated significant hotpots of cover crop usage within each county. The hotspots in (a) Santa Cruz and (b) San Benito were located in nearly the same areas as the hedgerow/windbreak hotspots (Figure 2) while the cover crop hotspot in (c) Monterey County was found in areas near the Pajaro River and the census-designated place, Las Lomas. No other hotspots were found in Monterey County but significant cold spots existed near the cities of (d) Salinas, (e) Gonzales, and (f) Greenfield.
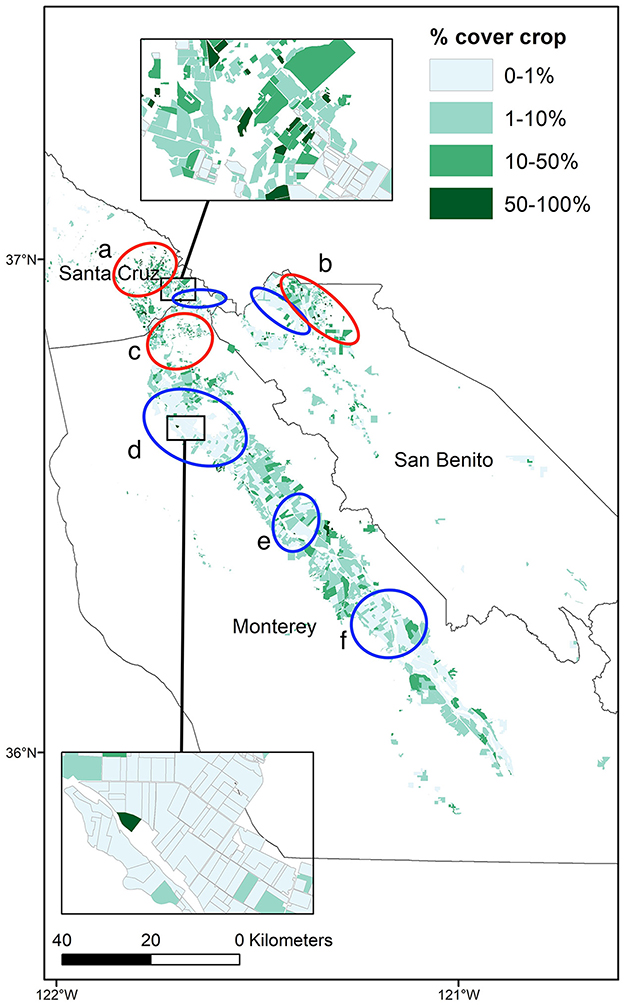
Figure 2. Map of Monterey, San Benito, and Santa Cruz counties showing the percent area of each ranch covered by cover crops. Inset maps show areas of higher (Santa Cruz) and lower (Monterey) hedgerow adoption. Red ovals indicate significant hotspots of hedgerow adoption while blue ovals indicate coldspots.
Adoption and farmland type
Nearly 60% of our study area was classified as “Prime Farmland” but less than half of the total area classified as hedgerows/windbreaks or cover crops was located in this prime farmland area (Table 3). Prime farmland is defined as very important in meeting U.S. food, feed, forage, and fiber needs due to ideal physical and chemical characteristics such as water availability, soil type, and climate. Conversely 16.8% of the area classified as hedgerows/windbreaks and 16.2% of cover crops were located on “Unique Farmland,” which made up just 8.5% of the study area (Table 3). Unique farmland, like prime farmland, has characteristics that make it valuable for growing crops but specifically for more specialized and regional high-value crops such as almonds, citrus, grapes, etc.
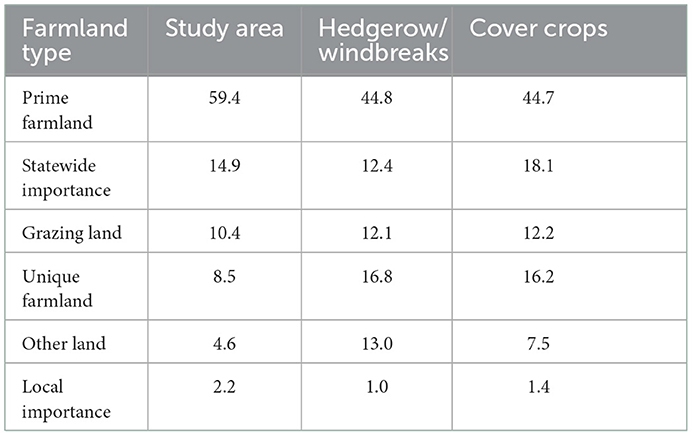
Table 3. Percent of total study area and percent of mapped hedgerow/windbreaks and cover crops found in each of the NRCS important farmland classifications.
Patterns of adoption
The significant spatial autocorrelation in the locations of hedgerows/windbreaks and cover crops suggests possible biophysical and social mechanisms influencing their adoption, some of which we were able to investigate through our interviews. Hotspots of adoption for hedgerows/windbreaks and cover crops overlapped in Santa Cruz and San Benito counties, coinciding with some of the hillier and less attractive farmland. The only hedgerow/windbreak hotspot in Monterey County was found at the southern end of the valley where there are many vineyards that use windbreaks around and within their fields as observed during the windshield surveys. Different management considerations and supply chain pressures may make it easier to establish and maintain hedgerows/windbreaks in vineyards vs. intensive vegetable and berry production systems.
In our interviews with organic farmers and technical assistance providers, we deliberately explored two hypotheses for the pattern of lower cover crop and hedgerow/windbreak adoption on high-value farmland in the flat areas of Monterey County. The first hypothesis was that higher farmland rent discouraged producers from taking any land out of cash crop production, due to financial pressures to bring in enough revenue to cover these rents (Guthman, 2004). We reasoned that these pressures connected to land rent would bear more heavily on those farming high value lands in Monterey County, where irrigated farmland rent averages US$2,050/acre, as compared with those farming in San Benito County with rents of US$725/acre and in hillier areas of Santa Cruz County (NASS U.S. National Agricultural Statistics Service, 2020).
This hypothesis was widely confirmed in our interviews, with 11 of 20 growers and all 8 technical assistance providers citing higher land rent costs as a significant discouragement to take any land out of production by planting cover crops or hedgerows/windbreaks (Table 4).
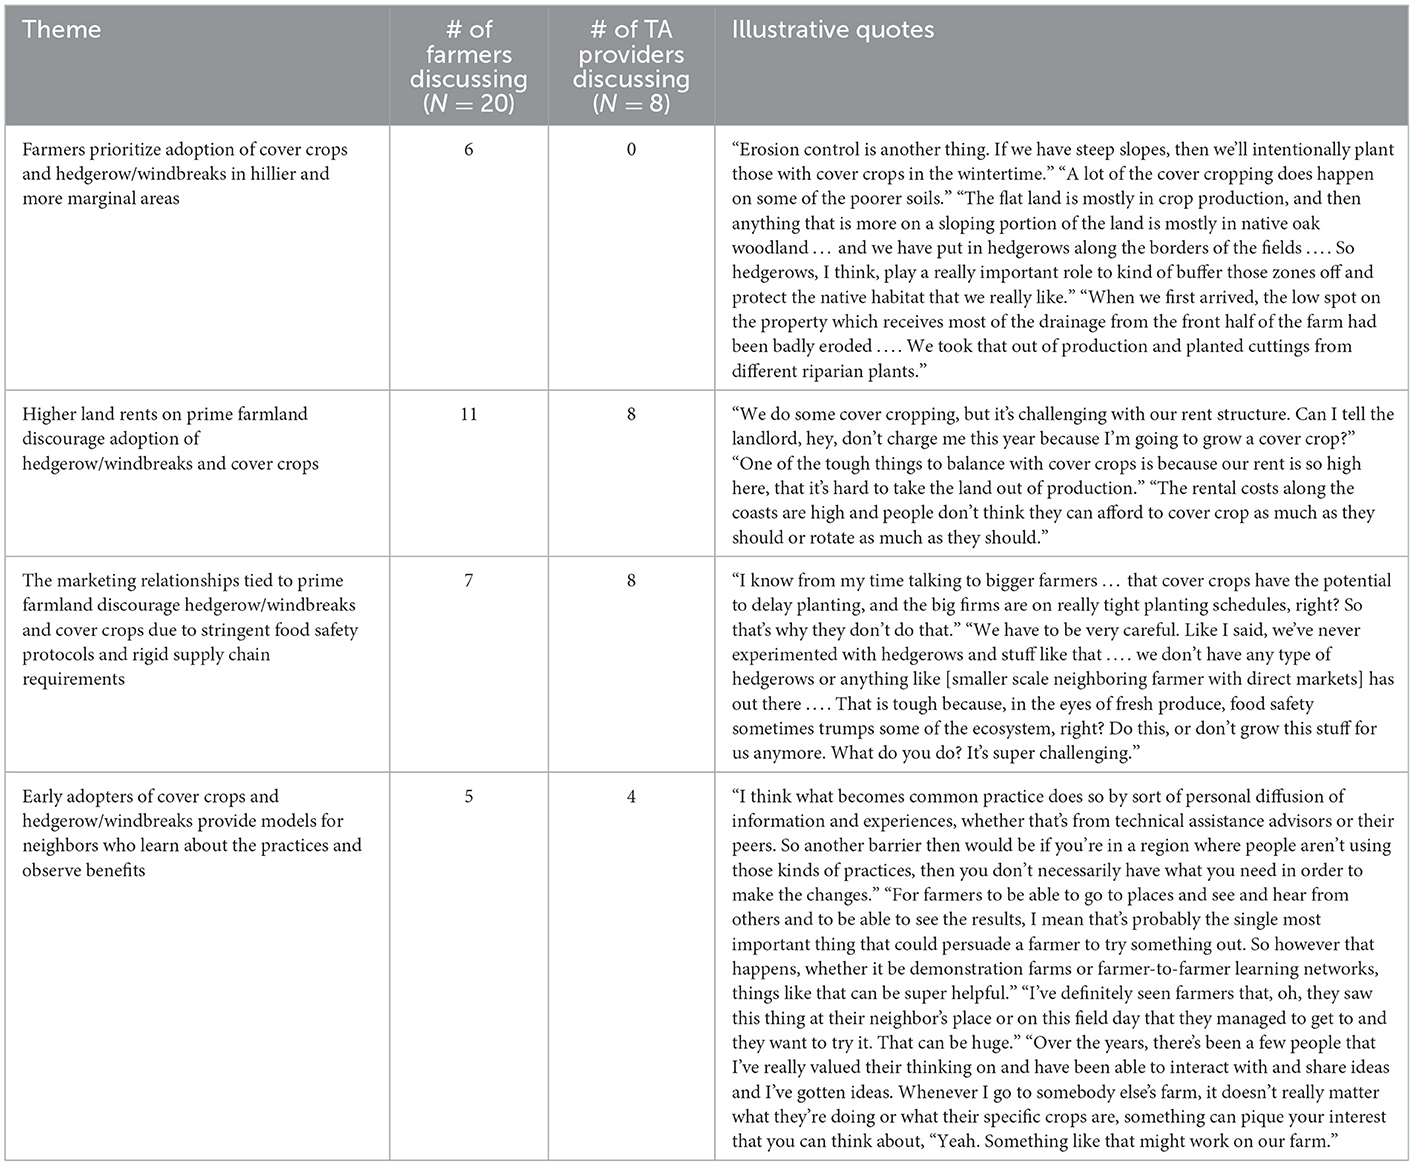
Table 4. Key themes and quotes helping to explain patterns of adoption of cover crops and hedgerow/windbreaks from interviews with 20 growers and 8 technical assistance providers in California's Central Coast.
We also explored a related hypothesis, which speaks to the complexity of social and ecological relationships in this agricultural region. Growers on high-value farmland, we hypothesized, not only faced pressures to maximize land in production; these same financial pressures pushed these growers to scale their operations into the hundreds of acres, which in turn forced them to work with wholesale buyers. These wholesale buyers imposed stringent food safety requirements, discouraging farmers from planting any non-crop vegetation, and in some cases asking them to remove existing hedgerows. At the same time, the rigid harvesting schedules required by these buyers discouraged growers from planting cover crops, as they were unwilling to take any risk of getting delayed with spring planting. Buyers at this scale could also penalize growers for having any “foreign material” in the field at the time of harvesting, with cover crop residue counting as one such source of “foreign material.” This hypothesis was also widely confirmed in our interviews, with 7 of 20 growers and all 8 technical assistance providers citing discouragement from large scale buyers as a factor in decisions to avoid cover crops and hedgerows/windbreaks (Table 4).
Additionally, two other patterns of adoption emerged from our interviews, even though we did not design our questions to deliberately explore these hypotheses. For one, a number of farmers (n=6, Table 4) reported that they prioritize adoption of cover crops and hedgerows/windbreaks in hillier areas prone to erosion, as well as other marginal lands. In explaining why they did this, farmers typically cited their own stewardship values, although we suspect some farmers may also be motivated to avoid county penalties when sediment accumulates on roads. Additionally, some remnant native vegetation in hillier regions may be counted as hedgerows/windbreaks when in proximity to cropped areas–and several of the farmers we spoke to mentioned deliberately maintaining this native vegetation as part of their approach to farming adjacent to wildlands.
Secondly, a number of farmers (n = 5, Table 4) mentioned learning about practices like cover cropping and hedgerows/windbreaks from watching fellow farmers, often their neighbors. Half of the technical assistance providers we spoke to mentioned this form of peer learning as a key factor in adoption of these practices. This may partially explain the observed spatial autocorrelation (and existence of hotspots) in hedgerow/cover crop adoption.
In contrast, conventional growers (n = 5) discussed a trend of moving away from cover cropping and hedgerows, practices that were more widely used in the past. For these growers, like the large-scale, wholesale organic growers, the quick turnover necessitated by intensive planting schedules made cover cropping prohibitive. One grower stated he plants cover crops only on 1% of winter acres because of the non-stop planting of new crops. For conventional farms, cover crops are used in special circumstances where they can help solve a problem in the field. For example, one conventional farmer uses cover cropping on fields next to a river that is prone to flooding. In this case, cover crops can help dry the area and prevent flooding, which reduces the delay in accessing the field for planting. Additionally, farmers who produce both organic and conventional produce (split operations) reported using cover crops only on their organic land.
Discussion
Our study shows that adoption of two key diversification practices, hedgerows/windbreaks and winter cover crops, is low and patchily distributed throughout the Central Coast agricultural region of California. This remote sensing analysis provides the first spatially-detailed information on the extent and pattern of hedgerow/windbreak and cover crop presence in California. While most ranches did not have any hedgerows/windbreaks (78%), the identification of several hotspots of adoption suggests that particular landscape and/or social factors and policies may encourage use of hedgerows. For winter cover crops, our finding of 5.9% are consistent with literature estimates of about 5% of Central Coast total farmland area cover cropped (Brennan, 2017), and also similar to the statewide average of 4.8% of “available” farmland cover cropped (USDA United States Department of Agriculture, 2019). While this figure does not account for winter cash crops, some of which provide similar ecosystem services as cover crops, ~60% of farmland in the Central Coast was mapped as having bare soil between mid-December and the end of February (Supplementary Table S4). Despite their many benefits, adoption of non-crop vegetation like cover crops and hedgerows/windbreaks is limited in California's Central Coast due to persistent structural and technical barriers.
Remote sensing of non-crop vegetation in complex agricultural landscapes
Our study successfully identified hedgerows/windbreaks in a heterogeneous agricultural landscape using easily accessible NAIP imagery with 90.0% accuracy. Other studies have also used OBIA to identify hedgerows and related vegetation in agricultural settings with varying levels of accuracy (Vannier and Hubert-Moy, 2008; Sheeren et al., 2009; Ghimire et al., 2014; O'Connell et al., 2015). The high accuracy of our model is likely due to the high resolution of recent NAIP imagery. Given that some hedgerows are quite narrow, fine-scale imagery is necessary to distinguish hedgerows from other linear elements in heterogeneous agricultural landscapes.
Our study also successfully mapped cover crops in a highly complex agricultural landscape with dozens of cash crop types–including overwintering crops like broccoli–as well as irregular field sizes and the presence of different land uses (e.g., rangeland and riparian areas) with 87% accuracy. Previous studies that have leveraged the increasing availability of satellite data (e.g., Landsat and Sentinel) alongside cloud computing resources (e.g., Google Earth Engine) to map cover crops in agricultural landscapes have been conducted in much more simplified agricultural landscapes (Howard et al., 2012; Ok et al., 2012; Shelestov et al., 2017; Phan et al., 2020). Higher accuracy has been reported when remote detection of winter cover crops is based solely on vegetation presence (Seifert et al., 2018) rather than needing to distinguish between cover crops and other overwintering cash crops as in our study area.
There were several limitations to our study. Other papers reported similar difficulties to those we encountered; most noticeably, model confusion between hedgerows/windbreaks and other small farm elements such as drainage ditches and shrubs. In our case, this led to the over classification of other linear elements as hedgerows, as noted by the lower user's accuracy of the model, which had to be manually checked, reducing some of the time saving benefits of remote sensing. Additional ground-truth data of hedgerows/windbreaks and other linear elements would likely improve model accuracy in the future. Additional data for the cover crop classification model would also be useful as certain crops like carrots and fennel were not found in enough fields to generate the recommended 40–120 training points needed per class (Mather and Koch, 2011). Due to the limited number of ground truth points for many of the cash crops, winter cash crops were grouped into a single class with a high variation of spectral properties. This made distinguishing the cash crop class from the cover crop class more difficult, though some cash crops grown over winter provide similar ecosystem services as cover crops. For example, broccoli, cauliflower, cabbage scavenge high amounts of nitrogen during the winter that could reduce nitrate leaching (Smith et al., 2013). Broccoli also leaves a significant amount of high-quality residue as a nitrogen source for the subsequent crop, whereas other common crops in rotation, like lettuce and spinach, have shallower root systems and produce much less biomass and fewer residues. We estimated annual cash crops (other than strawberries) covered 16% of farmland (Supplementary Table S4), vs. 60% with bare soil, but we could not distinguish crop species or varieties. Remote sensing that could distinguish cash crops and map their cover would allow for a more complete assessment of risks and opportunities for at least some important services of winter plant cover.
In addition, typical crop classification distinguishes crops based on unique NDVI values (Foerster et al., 2012; Howard et al., 2012). Many cover crops found in the region were a mixture rather than a sole crop, often comprised of species also grown as cash crops (e.g., brassicas), which makes distinguishing by NDVI values more difficult. Finally, since cover crop classifications have pixel noise, field-based or OBIA classification could provide higher classification accuracy (Ok et al., 2012; Li et al., 2015), but a dataset with accurate field boundaries is not available for this region where fields often contain several different crops planted in blocks or are managed in distinct sections.
Patterns of adoption
Integrating qualitative interviews with remote sensing allowed for interpreting patterns of adoption and provided insight into biophysical and socio-economic drivers of adoption patterns. Our remote sensing of hedgerows/windbreaks found significant clustering of the practice, with strong hotspots of use in the hillier, less intensively farmed areas of San Benito and Santa Cruz counties. Similar patterns were found for cover crops with a hotspot in the more marginal farmland of Monterey County. A study of farms across 20 counties in Indiana found that cover cropped fields were significantly steeper than non-cover cropped fields, likely for erosion control, and that farms that cover cropped were often smaller (Lira and Tyner, 2018), much like the mid-sized farms in our region that have reported using similar diversification practices (Esquivel et al., 2021). This was also supported in our interviews where many farmers reported maintaining hedgerows/windbreaks and cover crops in hilly or less prime farmland to prevent erosion. The paucity of cover crops and hedgerows/windbreaks in areas like the prime flatland area of Monterey County likely also stems from high rents and pressures growers in intensively managed farms face to keep as much land in production as possible as well as maintain “clean” fields for buyers. While Prime Farmland made up about 60% of our study area, <45% of both cover crops and hedgerows/windbreaks were found on Prime Farmland. Conversely, both practices were overrepresented in Unique Farmland and “Other” farmland, which can be marginal land. Landscape elements (hedgerows, tree clusters, riparian buffers) have been found to be inversely correlated with the presence of intensively farmed land (often with livestock) (Klimek et al., 2014). We also noted many hedgerows/windbreaks and windbreaks in vineyards during our windshield survey. Vineyards are commonly found on land classified as Unique Farmland, especially in the south of Monterey County, which could explain the hedgerow/windbreak hotspot in this area. Moreover, farmers we interviewed who were raising crops on “Unique Farmland” tended to be small or mid-sized and more likely to sell their produce through regional grocery stores, community supported agriculture, farmers markets, or regional aggregators–alternative agri-food networks that could help offset the costs of using these practices while also imposing less pressure to meet supply chain requirements (Esquivel et al., 2021).
Social mechanisms can influence the formation of hotspots. Early adopters could provide models for neighbors who learn about the practices and observe benefits. Peer influence and localized farming norms may also support diffusion. In California's Sacramento Valley, farmers reported that other farmers were the most important source of knowledge regarding edge plantings on their farms (Garbach and Long, 2017), while several farmers in our interviews also mentioned learning about such practices from their neighbors.
In general, organic farmers are more likely to use hedgerows/windbreaks and cover crops than conventional growers, given their greater reliance on the ecosystem services, rather than synthetic inputs, as well as organic certification guidelines, which encourage these practices. In this region, these practices are more common among smaller to mid-scale organic farms (Esquivel et al., 2021). Santa Cruz County had the highest percentage of cover cropped fields, has a high percentage of organic production (12% of acres), and it also has the smallest average farm size (102 acres; USDA United States Department of Agriculture, 2019) compared to San Benito County and Monterey County (853 and 1,214 acres, respectively). This indicates a greater prevalence of large-scale agricultural production in the latter counties, which may explain the lower levels of cover cropping. This is consistent with our interviews that large-scale farms working with wholesale buyers are disincentivized to plant cover crops and hedgerows. Cold spots in the counties may represent large areas of intensive, commercial conventional farming.
Conclusions: Remote sensing of agricultural practices to track and support policy goals
A number of federal and state policies depend on adoption of agricultural practices like hedgerows/windbreaks and cover cropping to help meet goals related to climate change mitigation, water quality, pollination, and more. For instance, California's Healthy Soils Program pays farmers and ranchers to adopt agricultural practices, including cover crops and hedgerows, known to reduce greenhouse gas emissions or increase soil carbon. It also funds demonstration projects meant to enhance adoption through regionally specific practice implementation. Yet the state currently has no means of tracking the efficacy of the Healthy Soils Program, especially whether adoption is maintained following the three-year grants or if demonstration projects spur adoption beyond direct grantees. At the state and national level, there is also no mechanism in place to track impacts of federal programs like the Environmental Quality Incentives Program and the Conservation Stewardship Program, both of which provide support for farmers to adopt these and other practices and have been recently expanded with passage of the Inflation Reduction Act (Inflation Reduction Act, 2022).
Our regional analysis reveals that aerial and satellite imagery can be used to map adoption of hedgerows/windbreaks and cover crops with a high degree of accuracy even in complex agricultural landscapes. The overall percentage of cover crops (~5%) matches past expert estimates for the study region and statewide adoption rates. Future work should distinguish and map winter cash crops that could provide similar services. We also provide new data on hedgerow/windbreak crop adoption in the Central Coast. Relative to other methods of tracking adoption like surveys, this approach is also able to identify spatial patterns, including the existence of hot and coldspots of adoption. Coupling remote sensing with qualitative interviews provided insights into the drivers behind these patterns, including interrelated factors related to topography, land values, and farming model that either enabled or hindered adoption. In turn, this understanding could inform creation of enabling policies while using remote sensing tools to evaluate progress.
Data availability statement
Publicly available datasets were analyzed in this study. This data can be found here: https://www.usgs.gov/centers/eros/science/usgs-eros-archive-aerial-photography-national-agriculture-imagery-program-naip and https://scihub.copernicus.eu/.
Ethics statement
The studies involving human participants were reviewed and approved by Committee for Protection of Human Subjects. Written informed consent for participation was not required for this study in accordance with the national legislation and the institutional requirements.
Author contributions
JT, JS, and TB conceived the idea. JT and JS designed the methodology, collected, and analyzed data. LC and JO conducted and analyzed interviews. TB, DK, and AI acquired funding. JT, JS, LC, and TB co-wrote the manuscript. All authors contributed critically to the drafts and gave final approval for publication.
Funding
This work was supported by USDA AFRI Grant #2019-67019-29537 and NSF Coupled Natural Humans Systems Grant #1824871 to TB.
Acknowledgments
Special thanks to Ariel Adair, Dr. Hannah Waterhouse, and Kait Libbey for help with ground truth data collection. We would also like to thank Sam Earnshaw for providing consulting on hedgerows/windbreaks in the area, as well as Dr. Karen Lowell and Prof. Patrick Baur for helpful comments that improved the manuscript.
Conflict of interest
The authors declare that the research was conducted in the absence of any commercial or financial relationships that could be construed as a potential conflict of interest.
Publisher's note
All claims expressed in this article are solely those of the authors and do not necessarily represent those of their affiliated organizations, or those of the publisher, the editors and the reviewers. Any product that may be evaluated in this article, or claim that may be made by its manufacturer, is not guaranteed or endorsed by the publisher.
Supplementary material
The Supplementary Material for this article can be found online at: https://www.frontiersin.org/articles/10.3389/fsufs.2023.1052029/full#supplementary-material
References
Albrecht, M., Kleijn, D., Williams, N. M., Tschumi, M., Blaauw, B. R., Bommarco, R., et al. (2020). The effectiveness of flower strips and hedgerows on pest control, pollination services and crop yield: a quantitative synthesis. Ecol. Lett. 23, 1488–1498. doi: 10.1111/ele.13576
Alternatives to Chlorpyrifos Work Group. (2020). Towards Safer and More Sustainable Alternatives to Chlorpyrifos: An Action Plan for California (p.152). Available online at: https://www.cdpr.ca.gov/docs/chlorpyrifos/pdf/chlorpyrifos_action_plan.pdf (accessed September 22, 2022).
Baur, P., Driscoll, L., Gennet, S., and Karp, D. (2016). Inconsistent food safety pressures complicate environmental conservation for California produce growers. Calif. Agric. 70, 142–151. doi: 10.3733/ca.2016a0006
Beck, H. E., Zimmermann, N. E., McVicar, T. R., Vergopolan, N., Berg, A., and Wood, E. F. (2020). Publisher correction: present and future Köppen-Geiger climate classification maps at 1-km resolution. Sci. Data 7, 1–2. doi: 10.1038/s41597-020-00616-w
Beretti, M., and Stuart, D. (2008). Food safety and environmental quality impose conflicting demands on central Coast growers. Calif. Agric. 62, 68–73. doi: 10.3733/ca.v062n02p68
Blaschke, T. (2010). Object based image analysis for remote sensing. ISPRS J. Photogramm. Remote Sens. 65, 2–16. doi: 10.1016/j.isprsjprs.2009.06.004
Brennan, E. B. (2017). Can we grow organic or conventional vegetables sustainably without cover crops? Horttechnology 27, 151–161. doi: 10.21273/HORTTECH03358-16
Brennan, E. B., and Smith, R. F. (2005). Winter cover crop growth and weed suppression on the central coast of California. Weed Technol. 19, 1017–1024. doi: 10.1614/WT-04-246R1.1
Büchi, L., Wendling, M., Amossé, C., Necpalova, M., and Charles, R. (2018). Importance of cover crops in alleviating negative effects of reduced soil tillage and promoting soil fertility in a winter wheat cropping system. Agric. Ecosyst. Environ. 256, 92–104. doi: 10.1016/j.agee.2018.01.005
California Department of Conservation. (n.d.). Important Farmland Categories. Available online at: https://www.conservation.ca.gov/dlrp/fmmp/Pages/Important-Farmland-Categories.aspx (accessed December 15 2022).
California Regional Water Quality Control Board: Central Coast Region (2021). Proposed General Waste Discharge Requirements for Discharges from Irrigated Lands. Order No. R3-2021-0040. State of California Central Coast Regional Water Quality Control Board.
Calo, A., and De Master, K. (2016). After the incubator: factors impeding land access along the path from farmworker to proprietor. J. Agric. Food Syst. Commun. Dev. 6, 111–127. doi: 10.5304/jafscd.2016.062.018
CARB California Air Resources Board (2022). Draft 2022 Scoping Plan Update. Available online at: https://ww2.arb.ca.gov/sites/default/files/2022-05/2022-draft-sp.pdf (accessed September 9, 2022).
Carlisle, L., Esquivel, K., Baur, P., Ichikawa, N. F., Olimpi, E. M., Ory, J., et al. (2022). Organic farmers face persistent barriers to adopting diversification practices in California's Central Coast. Agroecol. Sustain. Food Syst. 46, 1145–1172. doi: 10.1080/21683565.2022.2104420
Castle, D., Grass, I., and Westphal, C. (2019). Fruit quantity and quality of strawberries benefit from enhanced pollinator abundance at hedgerows in agricultural landscapes. Agric. Ecosyst. Environ. 275, 14–22. doi: 10.1016/j.agee.2019.01.003
CDFA California Department of Food Agriculture (2022). California Agricultural Statistics Review 2020–2021. California Department of Food and Agriculture. Available online at: https://www.cdfa.ca.gov/Statistics/PDFs/2021_Ag_Stats_Review.pdf (accessed December 15, 2022).
Chapman, M., Wiltshire, S., Baur, P., Bowles, T., Carlisle, L., Castillo, F., et al. (2022). Social-ecological feedbacks drive tipping points in farming system diversification. One Earth 5, 283–292. doi: 10.1016/j.oneear.2022.02.007
Corbin, J. M., and Strauss, A. (1990). Grounded theory research: Procedures, canons, and evaluative criteria. Qual. Sociol. 13, 3–21.
Cranmer, L., McCollin, D., and Ollerton, J. (2012). Landscape structure influences pollinator movements and directly affects plant reproductive success. Oikos 121, 562–568. doi: 10.1111/j.1600-0706.2011.19704.x
Esquivel, K., Carlisle, L., Ke, A., Olimpi, E., Baur, P., Ory, J., et al. (2021). The “Sweet Spot” in the Middle: Why Do Mid-Scale Farms Adopt Diversification Practices at Higher Rates? Front. Sustain. Food Syst. 5. doi: 10.3389/fsufs.2021.734088
Foerster, S., Kaden, K., Foerster, M., and Itzerott, S. (2012). Crop type mapping using spectral–temporal profiles and phenological information. Comput. Electron. Agric. 89, 30–40. doi: 10.1016/j.compag.2012.07.015
Garbach, K., and Long, R. F. (2017). Determinants of field edge habitat restoration on farms in California's Sacramento Valley. J. Environ. Manag. 189, 134–141. doi: 10.1016/j.jenvman.2016.12.036
Ghimire, K., Dulin, M. W., Atchison, R. L., Goodin, D. G., and Shawn Hutchinson, J. M. (2014). Identification of windbreaks in Kansas using object-based image analysis, GIS techniques and field survey. Agroforest. Syst. 88, 865–875. doi: 10.1007/s10457-014-9731-4
Glaize, A., Young, M., Harden, L., Gutierrez-Rodriguez, E., and Thakur, S. (2021). The effect of vegetation barriers at reducing the transmission of Salmonella and Escherichia coli from animal operations to fresh produce. Int. J. Food Microbiol. 347, 109196. doi: 10.1016/j.ijfoodmicro.2021.109196
Gorelick, N., Hancher, M., Dixon, M., Ilyushchenko, S., Thau, D., and Moore, R. (2017). Google earth engine: planetary-scale geospatial analysis for everyone. Remote Sens. Environ. 202, 18–27. doi: 10.1016/j.rse.2017.06.031
Guthman, J. (2004). “Agrarian dreams,” in Agrarian Dreams (Oakland, CA: University of California Press).
Hartz, T. K., and Johnstone, P. R. (2006). Nitrogen availability from high-nitrogen-containing organic fertilizers. Horttechnology 16, 39–42. doi: 10.21273/HORTTECH.16.1.0039
Heinrich, A., Smith, R., and Cahn, M. (2014). Winter-killed cereal rye cover crop influence on nitrate leaching in intensive vegetable production systems. Horttechnology 24, 502–511. doi: 10.21273/HORTTECH.24.5.502
Hively, W. D., Duiker, S., McCarty, G., and Prabhakara, K. (2015). Remote sensing to monitor cover crop adoption in southeastern Pennsylvania. J. Soil Water Conserv. 70, 340–352. doi: 10.2489/jswc.70.6.340
Hively, W. D., Lang, M., McCarty, G. W., Keppler, J., Sadeghi, A., and McConnell, L. L. (2009). Using satellite remote sensing to estimate winter cover crop nutrient uptake efficiency. J. Soil Water Conserv. 64, 303–313. doi: 10.2489/jswc.64.5.303
Howard, D. M., Wylie, B. K., and Tieszen, L. L. (2012). Crop classification modelling using remote sensing and environmental data in the Greater Platte River Basin, USA. Int. J. Remote Sens. 33, 6094–6108. doi: 10.1080/01431161.2012.680617
Inflation Reduction Act. (2022). H.R.5376, 117th Cong.§2. Available online at: https://www.congress.gov/bill/117th-congress/house-bill/5376/text (accessed December 15, 2022).
Jackson, L., Wyland, L., Klein, J., Smith, R., and Koike, S. (1993). In lettuce production, winter cover crops can decrease soil nitrate, leaching potential. Calif. Agric. 47, 12–15. doi: 10.3733/ca.v047n05p12
Jay, M. T., Cooley, M., Carychao, D., Wiscomb, G. W., Sweitzer, R. A., Crawford-Miksza, L., et al. (2007). Escherichia coli O157:H7 in feral swine near spinach fields and Cattle, Central California Coast. Emerg. Infect. Dis. 13, 1908–1911. doi: 10.3201/eid1312.070763
Karp, D. S., Gennet, S., Kilonzo, C., Partyka, M., Chaumont, N., Atwill, E. R., et al. (2015). Comanaging fresh produce for nature conservation and food safety. Proc. Nat. Acad. Sci. 112, 11126–11131. doi: 10.1073/pnas.1508435112
Klimek, S., Lohss, G., and Gabriel, D. (2014). Modelling the spatial distribution of species-rich farmland to identify priority areas for conservation actions. Biol. Conserv. 174, 65–74. doi: 10.1016/j.biocon.2014.03.019
Kremen, C., Iles, A., and Bacon, C. (2012). Diversified farming systems: an agroecological, systems-based alternative to modern industrial agriculture. Ecol. Soc. 17. doi: 10.5751/ES-05103-170444
Kremen, C., and Miles, A. (2012). Ecosystem services in biologically diversified versus conventional farming systems: benefits, externalities, and trade-offs. Ecol. Soc. 17. doi: 10.5751/ES-05035-170440
Kushal, K., Zhao, K., Romanko, M., and Khanal, S. (2021). Assessment of the spatial and temporal patterns of cover crops using remote sensing. Remote Sens. 13, 2689. doi: 10.3390/rs13142689
Lecq, S., Loisel, A., Brischoux, F., Mullin, S. J., and Bonnet, X. (2017). Importance of ground refuges for the biodiversity in agricultural hedgerows. Ecol. Indic. 72, 615–626. doi: 10.1016/j.ecolind.2016.08.032
Li, Q., Wang, C., Zhang, B., and Lu, L. (2015). Object-based crop classification with Landsat-MODIS enhanced time-series data. Remote Sens. 7, 16091–16107. doi: 10.3390/rs71215820
Liaw, A., and Wiener, M,. (2002). “Classification and Regression by randomForest.” R News, 2, 18-22. Available online at: https://CRAN.R-project.org/doc/Rnews/ (accessed September 22, 2022).
Lira, S. M., and Tyner, W. E. (2018). Patterns of cover crop use, adoption, and impacts among Indiana farmers. J. Crop Improv. 32, 373–386. doi: 10.1080/15427528.2018.1432515
Long, R. F., Garbach, K., and Morandin, L. A. (2017). Hedgerow benefits align with food production and sustainability goals. Calif. Agric. 71, 117–119. doi: 10.3733/ca.2017a0020
Lugato, E., Cescatti, A., Jones, A., Ceccherini, G., and Duveiller, G. (2020). Maximising climate mitigation potential by carbon and radiative agricultural land management with cover crops. Environ. Res. Lett. 15, 094075. doi: 10.1088/1748-9326/aba137
Mather, P. M., and Koch, M. (2011). Computer Processing of Remotely-sensed Images: An Introduction. Hoboken, NJ: John Wiley and Sons.
Moran, P. A. (1950). Notes on continuous stochastic phenomena. Biometrika 37, 17–23. doi: 10.1093/biomet/37.1-2.17
Morandin, L., Long, R., Pease, C., and Kremen, C. (2011). Hedgerows enhance beneficial insects on farms in California's Central Valley. Calif. Agric. 65, 197–201. doi: 10.3733/ca.v065n04p197
Morandin, L. A., and Kremen, C. (2013). Hedgerow restoration promotes pollinator populations and exports native bees to adjacent fields. Ecol. Appl. 23, 829–839. doi: 10.1890/12-1051.1
NASS U.S. National Agricultural Statistics Service (2020). Cash Rents Survey. United States Department of Agriculture. Available online at: https://www.nass.usda.gov/Surveys/Guide_to_NASS_Surveys/Cash_Rents_by_County/
O'Connell, J., Bradter, U., and Benton, T. G. (2015). Wide-area mapping of small-scale features in agricultural landscapes using airborne remote sensing. ISPRS J. Photogramm. Remote Sens. 109, 165–177. doi: 10.1016/j.isprsjprs.2015.09.007
Ok, A. O., Akar, O., and Gungor, O. (2012). Evaluation of random forest method for agricultural crop classification. Eur. J. Remote Sens. 45, 421–432. doi: 10.5721/EuJRS20124535
Ord, J. K., and Getis, A. (1995). Local spatial autocorrelation statistics: distributional issues and an application. Geogr. Anal. 27, 286–306. doi: 10.1111/j.1538-4632.1995.tb00912.x
Pereira, M., and Rodríguez, A. (2010). Conservation value of linear woody remnants for two forest carnivores in a Mediterranean agricultural landscape. J. Appl. Ecol. 47, 611–620. doi: 10.1111/j.1365-2664.2010.01804.x
Phan, T. N., Kuch, V., and Lehnert, L. W. (2020). Land cover classification using Google Earth Engine and random forest classifier—The role of image composition. Remote Sens. 12, 2411. doi: 10.3390/rs12152411
Ponisio, L. C., Valpine, P., de, M'Gonigle, L. K., and Kremen, C. (2019). Proximity of restored hedgerows interacts with local floral diversity and species' traits to shape long-term pollinator metacommunity dynamics. Ecol. Lett. 22, 1048–1060. doi: 10.1111/ele.13257
R Core Team (2022). R: A Language and Environment for Statistical Computing. R Foundation for Statistical Computing, Vienna, Austria. Available online at: https://www.R-project.org/.
Seifert, C. A., Azzari, G., and Lobell, D. B. (2018). Satellite detection of cover crops and their effects on crop yield in the Midwestern United States. Environ. Res. Lett. 13, 064033. doi: 10.1088/1748-9326/aac4c8
Sellers, L. A., Long, R. F., Jay-Russell, M. T., Li, X., Atwill, E. R., Engeman, R. M., et al. (2018). Impact of field-edge habitat on mammalian wildlife abundance, distribution, and vectored foodborne pathogens in adjacent crops. Crop Prot. 108, 1–11. doi: 10.1016/j.cropro.2018.02.005
Sheeren, D., Bastin, N., Ouin, A., Ladet, S., Balent, G., and Lacombe, J.-P. (2009). Discriminating small wooded elements in rural landscape from aerial photography: a hybrid pixel/object-based analysis approach. Int. J. Remote Sens. 30, 4979–4990. doi: 10.1080/01431160903022928
Shelestov, A., Lavreniuk, M., Kussul, N., Novikov, A., and Skakun, S. (2017). “Large scale crop classification using Google earth engine platform,” in 2017 IEEE International Geoscience and Remote Sensing Symposium (IGARSS) (Fort Worth, TX), 3696–3699.
Smith, R., Cahn, M., and Hartz, T. K. (2013). Survey of nitrogen uptake and applied irrigation water in broccoli, cauliflower and cabbage production in the Salinas Valley. CDFA FREP Proc. 89, 117–119
Sobrino, J. A., Raissouni, N., and Li, Z.-L. (2001). A comparative study of land surface emissivity retrieval from NOAA data. Remote Sens. Environ. 75, 256–266. doi: 10.1016/S0034-4257(00)00171-1
Stuart, D. (2009). Constrained choice and ethical dilemmas in land management: Environmental quality and food safety in California agriculture. J. Agric. Environ. Ethics 22, 53–71. doi: 10.1007/s10806-008-9129-2
Tamburini, G., Bommarco, R., Wanger, T. C., Kremen, C., van der Heijden, M. G. A., Liebman, M., et al. (2020). Agricultural diversification promotes multiple ecosystem services without compromising yield. Sci. Adv. 6, eaba1715. doi: 10.1126/sciadv.aba1715
Tansey, K., Chambers, I., Anstee, A., Denniss, A., and Lamb, A. (2009). Object-oriented classification of very high resolution airborne imagery for the extraction of hedgerows and field margin cover in agricultural areas. Appl. Geograp. 29, 145–157. doi: 10.1016/j.apgeog.2008.08.004
USDA United States Department of Agriculture (2019). 2017 Census of Agriculture (Report no. AC-17-A-51). United States Department of Agriculture. Available online at: https://www.nass.usda.gov/Publications/AgCensus/2017 (accessed December 15, 2022).
Vannier, C., and Hubert-Moy, L. (2008). “Detection of wooded hedgerows in high resolution satellite images using an object-oriented method,” in IGARSS 2008-2008 IEEE International Geoscience and Remote Sensing Symposium, Vol. 4 (Boston, MA: IEEE), 4–731.
Verboom, B., and Huitema, H. (1997). The importance of linear landscape elements for the pipistrellePipistrellus pipistrellus and the serotine batEptesicus serotinus. Landsc. Ecol. 12, 117–125. doi: 10.1007/BF02698211
Weller, D. L., Love, T. M., Weller, D. E., Murphy, C. M., Rahm, B. G., and Wiedmann, M. (2022). Structural equation models suggest that on-farm noncrop vegetation removal is not associated with improved food safety outcomes but is linked to impaired water quality. Appl. Environ. Microbiol. 88, e01600-22. doi: 10.1128/aem.01600-22
Keywords: diversified farming systems, non-crop vegetation, remote sensing, cover crops, hedgerows, random forest, windbreaks
Citation: Thompson JB, Symonds J, Carlisle L, Iles A, Karp DS, Ory J and Bowles TM (2023) Remote sensing of hedgerows, windbreaks, and winter cover crops in California's Central Coast reveals low adoption but hotspots of use. Front. Sustain. Food Syst. 7:1052029. doi: 10.3389/fsufs.2023.1052029
Received: 23 September 2022; Accepted: 04 January 2023;
Published: 25 January 2023.
Edited by:
Carol Williams, University of Wisconsin–Madison, United StatesReviewed by:
Gina Nichols, University of California, Davis, United StatesMitchell Hunter, University of Minnesota Twin Cities, United States
Copyright © 2023 Thompson, Symonds, Carlisle, Iles, Karp, Ory and Bowles. This is an open-access article distributed under the terms of the Creative Commons Attribution License (CC BY). The use, distribution or reproduction in other forums is permitted, provided the original author(s) and the copyright owner(s) are credited and that the original publication in this journal is cited, in accordance with accepted academic practice. No use, distribution or reproduction is permitted which does not comply with these terms.
*Correspondence: Jennifer B. Thompson,  jennifer.thompson@zalf.de