 Evangeline Corcoran1*
 Mehdi Afshar2,3†
 Stelian Curceac4†
 Azam Lashkari3†
 Muhammad Mohsin Raza5†
 Sebastian Ahnert1,6‡
 Andrew Mead4‡
 Richard Morris3‡
- 1The Alan Turing Institute, London, United Kingdom
- 2Department of Civil Engineering, Faculty of Engineering, Middle East Technical University, Ankara, Türkiye
- 3Department of Computational and Systems Biology, John Innes Centre, Norwich, United Kingdom
- 4Statistics and Data Science Section, Intelligent Data Ecosystems, Rothamsted Research, Harpenden, Hertfordshire, United Kingdom
- 5Department of Mathematics, College of Engineering, Mathematics and Physical Sciences, University of Exeter, Exeter, United Kingdom
- 6Department of Chemical Engineering and Biotechnology, School of Technology, University of Cambridge, Cambridge, United Kingdom
Identifying and implementing management actions that can mitigate the impacts of climate change on domestically grown crops is crucial to maintaining future food security for the United Kingdom (UK). Crop models serve as critical tools for assessing the potential impacts of climate change and making decisions regarding crop management. However, there is often a gap between yields predicted by current modeling methods and observed yields. This has been linked to a sparsity of models that investigate crop yield beyond field scale or that include data on crop management or crop protection factors. It remains unclear whether the lack of available data imposes these limitations or if the currently available data presents untapped opportunities to extend models to better capture the complex ecosystem of factors affecting crop yield. In this paper, we synthesize available data on plant physiology, management, and protection practices for agricultural crops in the UK, as well as associated data on climate and soil conditions. We then compare the available data to the variables used to predict crop yield using current modeling methods. We find there is a lack of openly accessible crop management and crop plant physiology data, particularly for crops other than wheat, which could limit improvements in current crop models. Conversely, data that was found to be available at large scales on climate and soil conditions could be used to explore upscaling of current approaches beyond the field level, and available data on crop protection factors could be integrated into existing models to better account for how disease, insect pest and weed pressures may impact crop yield under different climate scenarios. We conclude that while a lack of available data on crop management, protection, physiology, at scales other than field level, and for species other than wheat currently hampers advancement of modeling methods for UK crops, future investment into data collection and management across a broader range of factors affecting crops, at larger scales and for a broader range of crop species could improve predictions of crop plant development and yield.
1. Introduction
Different studies have already shown that the climate change has negative effects on crop yield and these effects are likely to have a major negative impact on future crops unless significant steps are taken to mitigate and adapt to changing conditions and extreme weather events (Lobell et al., 2011; Campbell et al., 2016). Domestically grown produce is the largest food source for the United Kingdom (UK); therefore, ensuring UK farmers can make well-informed, evidence-based decisions regarding the management, selection and breeding of local arable crops is critical for maintaining future food security of the nation and its trade partners (Department for Environment, Food, and Rural Affairs, 2021). Furthermore, while it is recognized globally that agriculture is one of the food production sectors likely to be most adversely affected by changing climate conditions, crops grown outdoors in the UK have been shown to be particularly vulnerable to variations in weather patterns such as temperature and precipitation which impact the availability of water to plants, the water balance of soil, and the ability of farmers to traverse fields to carry out management activities such as pesticide spraying, harvesting and seedbed preparation (Knox et al., 2010; Harkness et al., 2020; Department for Environment, Food, and Rural Affairs, 2021).
Models that predict crop yield have long been relied upon as a key tool for decision support and risk management (Afshar et al., 2021). In recent years there has been a shift toward using crop models to predict yield under possible climate change conditions and drive adaptational practices (Challinor et al., 2013; Kadiyala et al., 2015; Jones et al., 2017; Challinor et al., 2018). Current crop models vary widely in approach, ranging from process or mechanistic-based models, that are developed using experimental agronomic and physiological data to explain and predict crop growth and development under different management and environmental conditions, statistical-or machine learning-based models that link different datasets such as meteorological variables, soil conditions, or vegetation indices obtained from remotely sensed data to observed crop yields (Chenu et al., 2009; Watson et al., 2015; Rötter et al., 2018; Huang et al., 2019; Silva and Giller, 2021). However, a common issue across contemporary modeling approaches is that there are frequently substantial differences between predicted and observed yields (Snyder et al., 2017; Silva and Giller, 2021). These yield gaps, when coupled with increased yield volatility and inter-annual variability detected in recent decades, revealed substantial uncertainty around yield predictions produced by current crop models, and therefore imposed uncertainties to management actions that are necessary to mitigate climate change effects and safeguard future food security (Beza et al., 2017; Gobbett et al., 2017; Hoffmann et al., 2018; Addy et al., 2020; Raza and Bebber, 2022).
A recent review of current trends in crop modeling has revealed key limitations of current approaches in monitoring of crop yield information (Silva and Giller, 2021). These limitations mainly revolve around the predominant focus of current crop models on field-scale crop yield variations with little consideration to how these findings can be scaled to farm or landscape levels at which management and policy decisions are often made (Silva and Giller, 2021). Other than scale limitations, it was also revealed that relatively little research had been undertaken on modeling non-cereal crops, and that the effects of nutrients other than nitrogen, pests, pathogens, and disease on crops have rarely been integrated into predictions (Silva and Giller, 2021). It is unclear though whether these limitations are due to a lack of available data related to the management practices at larger scales, due to the specific motivations driving the development of models, or an incomplete understanding of how interaction of these factors with climate and soil conditions affects crop yield (Beza et al., 2017; Gobbett et al., 2017; Snyder et al., 2017; Beveridge et al., 2018; Silva and Giller, 2021).
The aim of this review is to collate and characterize recent models of UK arable crop yields and compare the data inputs currently used to inform yield predictions with the openly accessible data that is available on crops grown in the UK. This includes available data on crop management practices, crop protection, and crop plant physiology as well as associated metadata on weather conditions and soil properties. This comparison will identify the overlap and gaps between available data and the data required by current modeling methods. In addition, opportunities to improve model predictions of crop yield under changing climate conditions at field and landscape scales through the integration of novel data sources will be elucidated.
2. Literature review methods
2.1. Available datasets
Data sources containing information on factors that may influence arable crop growth in the UK were identified using Scopus and Web of Science databases, as well as UK government open data records. The datasets were then categorized based on which factors the variables they included related to (Table 1). In order to assist in identification of opportunities for future integration of novel data sources into crop yield models, datasets on factors that could potentially impact crop growth were included in Table 1 even if similar data had not previously been used as crop yield model inputs in the past. These factors included ‘crop management,’ ‘crop plant physiology,’ ‘climate,’ ‘crop protection,’ ‘land use,’ and ‘soil.’ A category for ‘crop yield’ was also included to identify datasets containing yield observations as well as associated metadata that could be used in model development and validation. For several of these broad categories/factors, datasets were further sorted into sub-categories including ‘crop planning’ and ‘crop nutrition’ under ‘crop management’, ‘genotype’ and ‘phenotype’ under crop plant physiology,’ ‘disease,’ ‘weed,’ and ‘insect pests’ within ‘crop protection,’ and various meteorological variables for climate.
Table 1. Categories and sub-categories assigned to variables in reviewed datasets and required as inputs into reviewed crop models.
In order to ensure recent trends in crop yield could be explored, only sources for which the most recent data collection occurred during or after 2016 were included. For data on climate variables, only datasets that provided data from 1990 or earlier were included. This additional cut-off was put in place to ensure long-term meteorological trends were captured within the datasets, so that models of crop yield developed on these datasets could feasibly be trained to potentially account for these effects (Intergovernmental Panel on Climate Change, 2014; Addy et al., 2021).
For each dataset included in this review, we gathered and summarized information on variable categories and sub-categories, key references, access constraints, period and frequency of data collection, spatial coverage, crop species observed, and accessibility (Table 2). Coverage of datasets was described using the following labels on the size of the area for which data were collected: ‘Global,’ ‘Europe’ for datasets covering the whole of the European continent, ‘UK’ for datasets covering the entirety of the United Kingdom, ‘Regional’ for datasets covering part of the United Kingdom that include multiple agricultural fields and farms, and ‘Field’ for datasets for which data was collected from a single field or several fields at a single farm.
Table 2. Summary of available datasets on factors affecting crop yield in the UK.
2.2. Current modeling methods
Existing crop yield models in the UK were identified using Scopus and Web of Science databases, and UK government open data records. Only models which explicitly predict crop yield for part or the entirety the UK, and that were published or last updated from 2016 onwards, were included. This latter time restriction was to reflect the current state of crop models with respect to recent trends and increased inter-annual variability in yield (Beza et al., 2017; Gobbett et al., 2017; Hoffmann et al., 2018; Addy et al., 2020). These models were then categorized based on the variables they require as input using the same categories used to summarize the datasets based on the variables they contained (Table 1). This categorization system was used to help identify where the available datasets could be used as input variables of models, where gaps exist between the currently available datasets and the required datasets by contemporary modeling methods, and where datasets are available on factors that have not previously been integrated into crop yield models.
For each model included in this review, we gathered and summarized, where applicable, information on categories and sub-categories of their input variable, key reference, date of publication or most recent update, modeling method (i.e., statistical-, process-, or machine learning-based), the spatiotemporal resolution of their input and output variables, and crop types for which they can predict yield (Table 3). The spatial scale of model predictions was described using the same labels used to describe the coverage of available datasets.
Table 3. Summary of current models for predicting crop yield in the UK.
2.3. Heatmap comparison of datasets and models
Heatmaps comparing the relative proportion of datasets available for each variable at various spatiotemporal resolutions to the relative proportion of process-and statistical-based models requiring input data for that variable at the same spatiotemporal resolution were developed using the ‘pheatmap’ package (Kolde, 2019) in R environment (R Core Team, 2021) and presented in (Figures 1, 2) respectively.
Figure 1. Heatmap displaying relative proportion of available data on each variable at each temporal resolution and geographic scale compared relative proportion of process-based models requiring input data on that variable at the same temporal resolution and geographic scale.
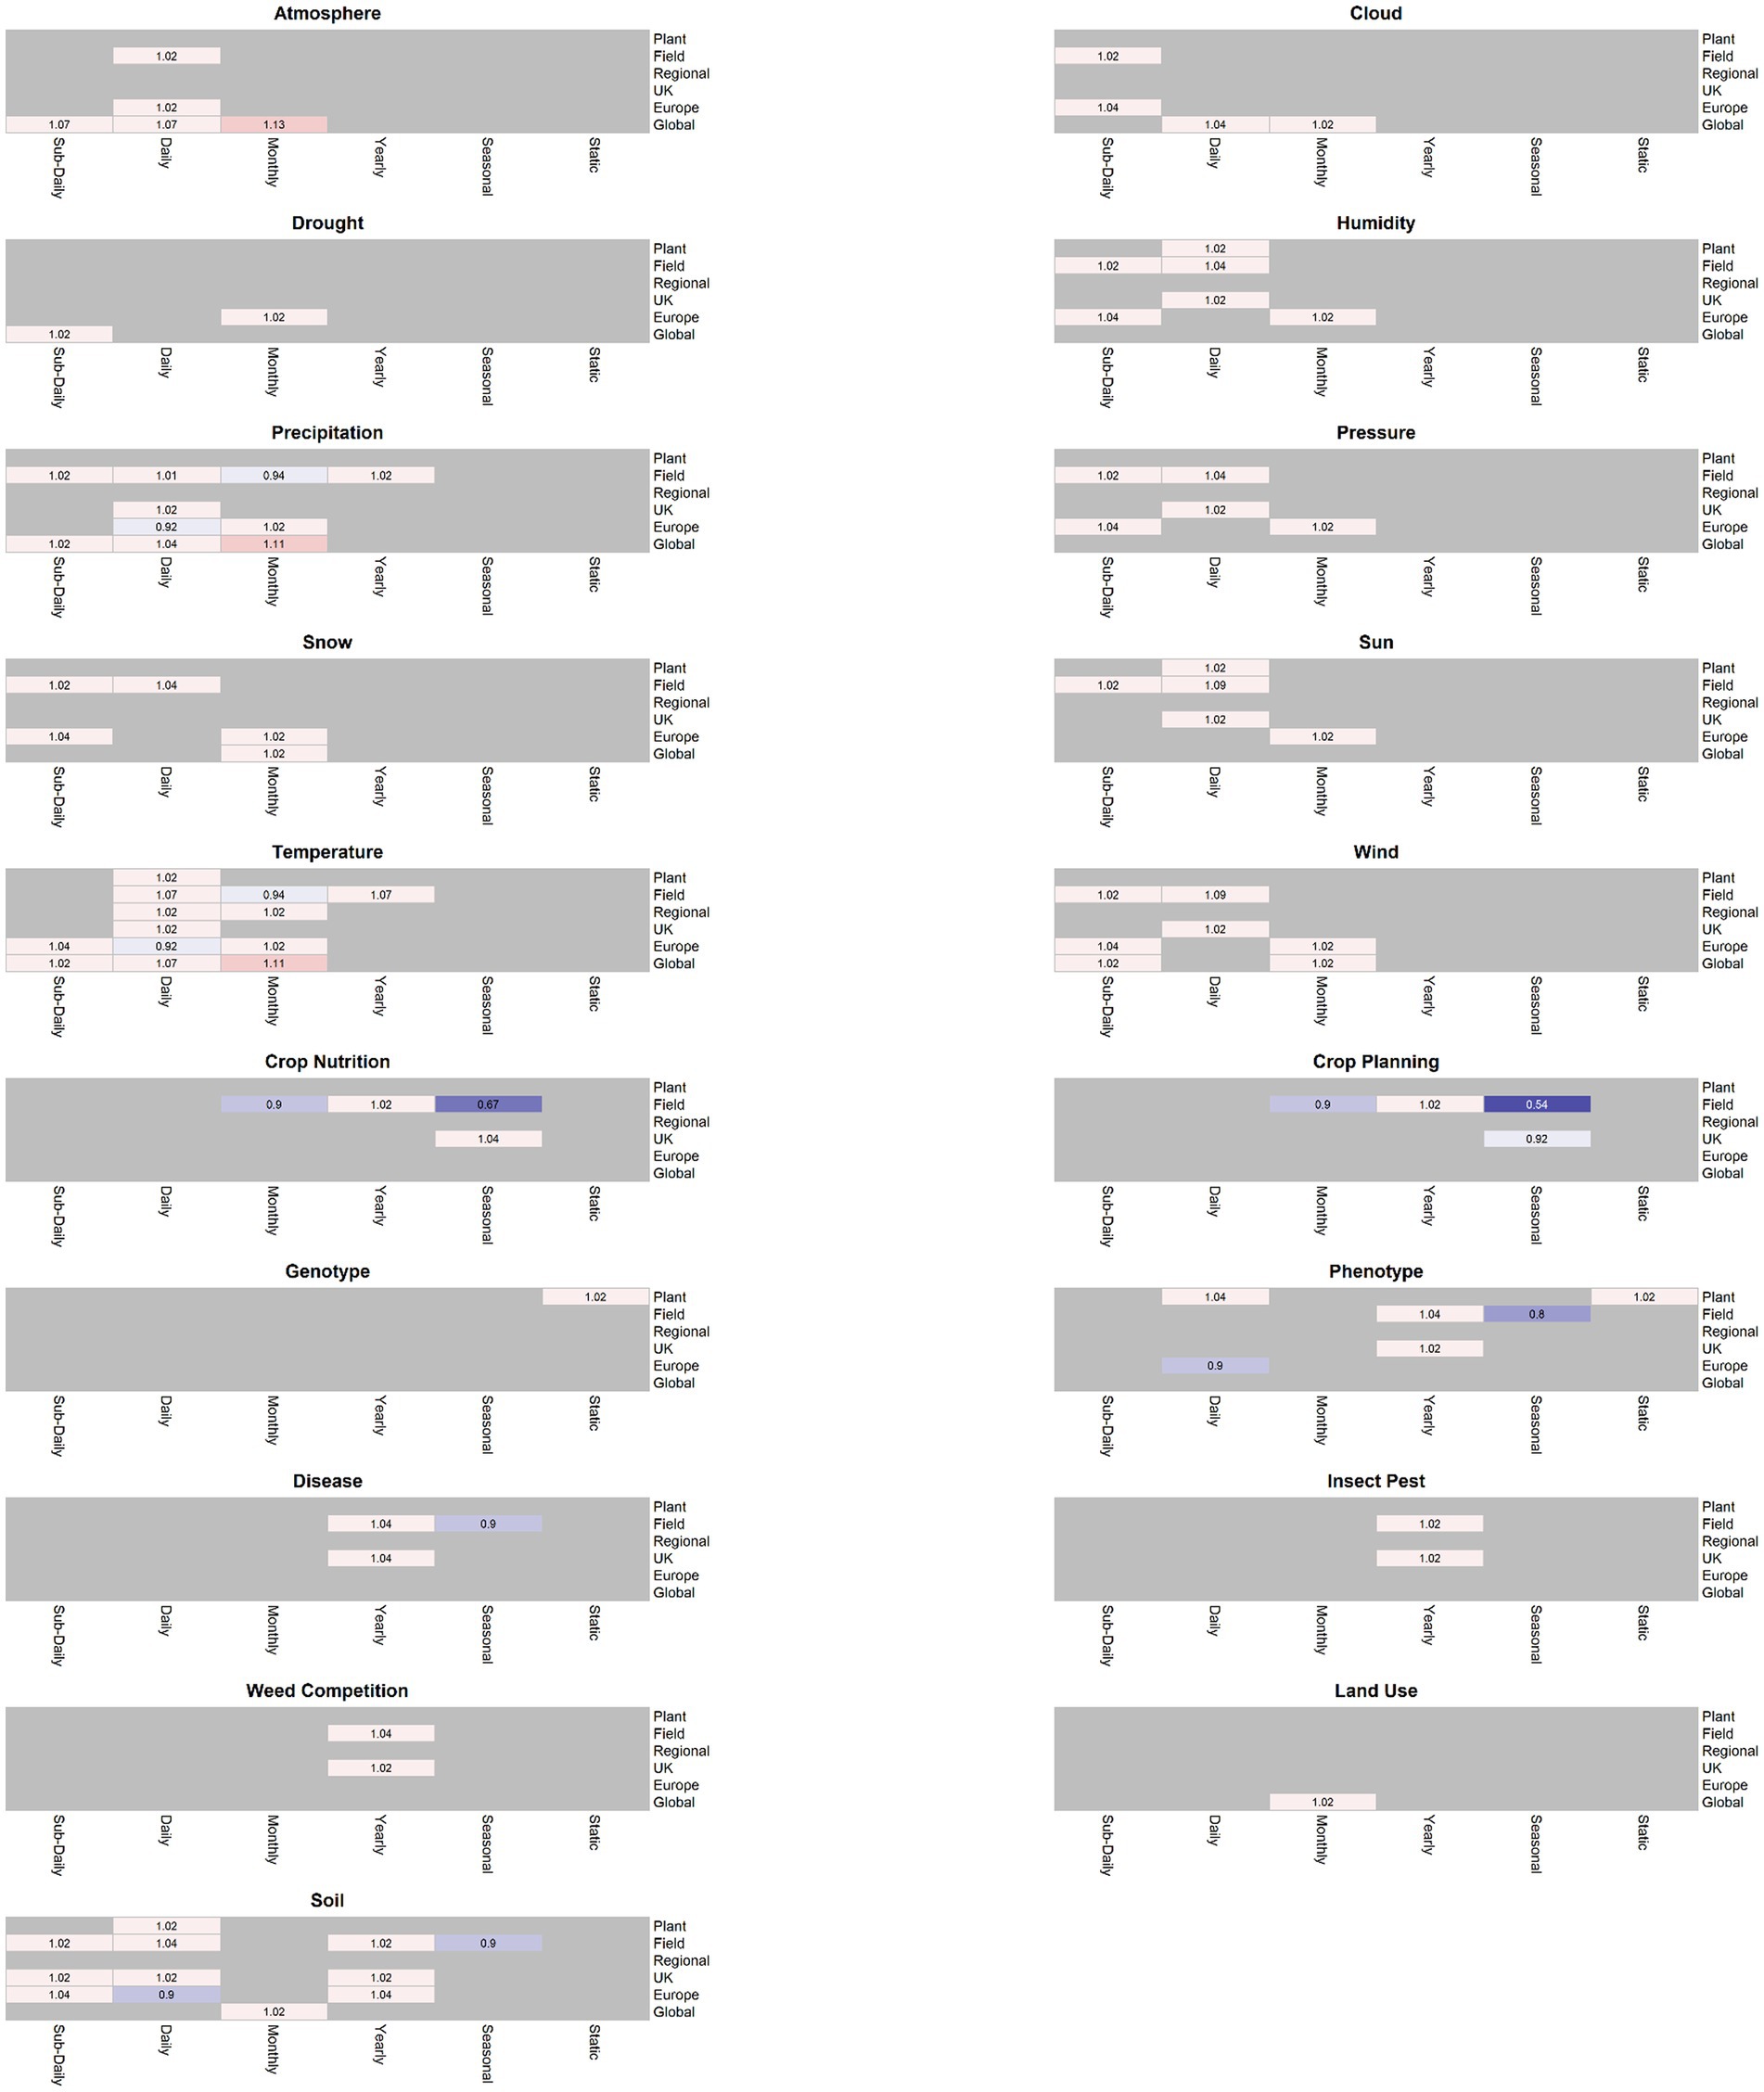
Figure 2. Heatmap displaying relative proportion of available data on each variable at each temporal resolution and geographic scale compared relative proportion of statistical models requiring input data on that variable at the same temporal resolution and geographic scale.
The relative proportion of data to models used to shade each cell in the heatmap grids shown in (Figures 1, 2) was calculated as:
where is the number of available datasets containing information on a single variable at a single spatial and temporal resolution, is the total number of datasets identified in the literature review, is the number of available models requiring input data at the same spatial and temporal resolution as , and is the total number of models identified in the literature review. Heatmap grid cells with a value of one would therefore indicate an exact match in number of available datasets to number of current models that require input data on the same variable at the same spatiotemporal scale. Values greater than one therefore indicates a relatively higher proportion of available datasets compared to models requiring input data on the same variable at the same spatiotemporal scale, this includes instances where data is available but not currently used in any current models. Grid cells with values less than one indicates a relative lack of available data compared to the proportion of models requiring data on the same variable at the same certain spatiotemporal scale, this includes cases where current models require data on a variable at a certain spatiotemporal scale but there are no datasets currently openly available at that scale. Grey grid cells indicate where there is neither available data nor a model requiring input data on a variable at the specified spatiotemporal resolution.
3. Literature review results
3.1. Available datasets
A total of 46 unique relevant datasets were identified that provide information on factors that could impact arable crop growth and could be used as inputs for crop yield models for the UK (Table 2). The overall majority of these datasets (40 datasets, 87%) were openly accessible.
Data on climate for areas under cultivation was found to be most abundant in the current literature, with 27 (59%) datasets reporting on climate variables. The most abundant sub-categories of climate variables in the current literature were (a) temperature, which was included in 19 (41%) datasets, (b) precipitation, which was included in 16 (35%) datasets, (c) atmospheric gas and wind which were both included in 10 (22%) datasets. Combinations of temperature, precipitation, and atmospheric gas variables were commonly reported within the same dataset, with six (13%) datasets reporting measures of all three.
Overall, climate data was equally available at global and field scales, with 10 datasets providing information on climate data at each spatial resolution. Of the most well represented variable sub-categories, temperature data was equally available at global and field scales with six datasets providing data for each of spatial scales. Similarly, precipitation data were available in six and seven datasets at global and field scales, respectively. Atmosphere data were predominantly available at global scale (eight datasets), in which, one of them were providing a dataset covering Europe and one of them at field scale.
Climate data were available for a wide range of years, with data collected from the years 1700 to 2021 and were most commonly available at monthly intervals, with 15 datasets providing data at this temporal resolution. Finer temporal scale climate data were also often available, with 12 datasets providing measurements at a daily resolution and six datasets at a sub-daily resolution (i.e., hourly).
Ten relevant datasets containing information on soil properties were identified, comprising 22% of total datasets. The majority (six datasets) of these datasets containing information on soil properties also contained climate metadata with the same coverage, spatial and temporal resolution. Four datasets provided coverage for the entirety of Europe, three provided soil information at field scales, and one dataset (Terraclimate) provided global coverage (Abatzoglou et al., 2018). Datasets related to the soil conditions were available between years 1853 and 2021, with global, European, and field scale data all available between years 1958 and 2016. Soil data was predominantly available at sub-daily resolution in four available datasets (Table 2). Three datasets were available at both daily and yearly resolution, and one of them provided monthly data.
Six datasets (13% of total relevant datasets) contained information on crop management practices. Four datasets included annual data on both crop planning and crop nutrition for wheat crops at field scale, and two datasets provided information on crop nutrition only, with data available from 1968 to 2020.
Seven crop plant physiology datasets (15% of total datasets) were identified, six of which provided data on phenotypic variables. Yearly data on phenotype traits were available and openly accessible at field scale for wheat crops between 1974 and 2018 and for a wider range of crops at a coarser grain across the UK for 2020–2022. Image datasets from which phenotypic traits of individual plants could be extracted were also available but not openly accessible.
Five relevant crop protection datasets (11% of total datasets) were also included, with four of these datasets containing information on disease and two containing data on both weed competition and insect pests. Yearly disease and insect pest data were available at field scale for wheat crops between 2004 and 2019, while yearly data on weed competition were available at field scale between 1991 and 2019 for wheat, maize, oats, and potatoes. Data on disease, weed competition and insect pests were also at a coarser grain level with UK wide coverage for a range of crop species between 2012–2022.
Only two datasets (4% of total datasets) included data on drought and land use, and a single dataset was identified with information on genotype variables. Drought and land use data was available at a global scale and monthly temporal resolution between 1850 and 2018. Additional annual land use was available at UK wide scale from 2015 to 2021. In terms of genotypic data, annotated transcriptomes for oilseed rape plants were found to be available.
Seven datasets (15% of total relevant datasets) included measurements of crop yield. Four of these datasets reported annual wheat yield at field scale, with the remaining three datasets reporting annual yield of various crops (barley, beans, cereals, linseed, maize, oats, oilseed rape, peas, rye, soy, sunflower, sugar beet, and wheat) for the entirety of Great Britain or the United Kingdom.
3.2. Current modeling methods
Twenty-seven relevant models were identified in the literature review (Table 3), 17 of which were process-based models (Figure 1) and 10 of which were statistical models (Figure 2), including two models with machine learning-based components. As indicated in Table 3, for nine out of 10 statistical models openly accessible data on all input data was available at the required spatiotemporal resolution, while openly accessible data at the required spatiotemporal resolution for all input variables was only available for 10 out of 17 process-based models. The majority of models (22 models, 81%) predicted crop yield for wheat. Other crops for which yield was frequently predicted were maize (9 models, 33%), oilseed rape (8 models, 30%), potatoes (7 models, 26%), barley (7 models, 26%), and sugar beet (6 models, 22%). Crop yields were also predicted for beans, soy, rice, millet, peas, sorghum, peanut, sugarcane, sunflower, oats, tomato, onions, and quinoa with five or fewer models.
Most models (21 models, 78%) required input data at field scale, and all but one of these models produced crop yield predictions at field scale (20 models, 74%). Three models that required input data and predicted crop yield at field scale were also used to predict crop yield at other scales: the ECOSSE model at UK scale, the WOFOST model at regional scale, and the AquaCrop model at global scale (Steduto et al., 2009; Richards et al., 2017; De Wit et al., 2019). Additionally, three models that required input data at field scale only have been used to predict crop yield at a larger scale: The APSIM and DSSAT models at global scale, and the ORCHIDEE crop model for the entirety of Europe (Jones et al., 2003; Holzworth et al., 2014; Wu et al., 2016).
Climate data was used to predict crop yield in all process-based models but was used to predict crop yield in only three of the 10 statistical models identified in the literature review. The climate variables most often included as input data were temperature which was required by 17 models (63%), and precipitation which was required by 16 models (59%). All but one model that required precipitation data also required input data on temperature. Input data on the remaining climate variables (cloud, humidity, pressure, snow, radiation, wind, and drought) was required in less than half of the identified models of UK crop yield. The PEPIC model was the only model identified that did not require input data on temperature or precipitation, and instead factored data on humidity, radiation, and wind into predictions (Liu et al., 2016). Climate input data was most often needed at daily scale (18 models, 67%) for predicting seasonal or annual crop yields.
Twenty-one models (78%) required input data on crop management, including 88% of process-based models and 70% of statistical models. For all these models, data on crop planning was required, while data on crop nutrition was needed to predict crop yield with 17 models (63% of total models). Models most often required crop management input data at a seasonal scale, with 17 models (63%) using seasonal crop planning or crop nutrition data to predict seasonal or annual crop yield. Soil data was included as input in 13 (48%) of the identified models, including 11 process-based and two statistical models. The majority of models incorporating soil data (9 models, 50% of all total relevant models) required a single static measurement of all soil properties incorporated into crop yield predictions.
Six models (22%) included data on crop plant physiology, including three process-based and three statistical models. Of the process-based models, the Yield-SAFE model used a static measurement of initial biomass at field scale, the CLM model included monthly data on leaf area index at field scale, and the DailyDayCent model included constants reflecting the potential growth and drought or nutrient stress sensitivity of specific plants (Begum et al., 2017). For the statistical models, measurements of phenotypic traits were collected at daily or 5-daily intervals from experimental plants or from images of plants taken by on-ground sensors or satellites (Okom et al., 2017; Ozalp, 2020; Florence et al., 2021).
Two models (7%) included data on land use, the ECOSSE model which included static land classes and the Roth-CNP model which factored 20-and 50-year changes in land use into seasonal or annual crop yield estimates (Muhammed et al., 2018). One model (4%) incorporated data on disease into predictions of crop yield, using seasonal, field scale measurements of Septoria tritici to predict field scale wheat yield (van den Bosch et al., 2022). None of the models identified in the literature review used input data on crop plant genotype.
4. Discussion
This literature review demonstrated that data required as inputs by current models for predicting UK crop yield is considerably less diverse in terms of variables, spatial scale, and temporal resolution than the data and associated metadata that is available for UK crops from the year 1990 up to the year 2022. This is indicated in Figures 1, 2 by the relatively high proportion of data available at various scales compared to current models which utilize data at these scales as input. In line with the previous review of crop models conducted by Silva and Giller (2021), most models identified in the literature review rely on temperature, precipitation, crop planning, crop nutrition, and soil data to predict crop yield, whereas recent available datasets report measures of a wider range of weather, plant physiology and crop protection variables. Also similar to the findings of the Silva and Giller (2021) review, current models of crop yield predominantly require input and produce predictions at field scale, but our literature review revealed that relevant data is available on most variables at larger scales. This suggests that upscaling current methods to predict crop yield at a coarser scale across the UK may be feasible by integrating the available large-scale data temperature, precipitation, and soil variables (Manivasagam and Rozenstein, 2020; Peng et al., 2020; Chen et al., 2021). These coarse scale predictions could then be used to inform development of agricultural policy and decisions for managing crops at a regional or national scale (Manivasagam and Rozenstein, 2020; Peng et al., 2020; Chen et al., 2021).
However, it is important to consider whether current models developed based on observations from a limited number of fields can be used to predict a response in yield for crops grown under varying conditions not captured within the field scale data on which the models were originally parameterized. More specifically, data used to parameterize current field scale models does not include observations covering the full range of scenarios (including various combinations of different weather and soil conditions, management practices, and crop protection strategies) under which crops are grown throughout the entire extent of the UK. It is therefore unknown whether the uncertainty around the prediction for any particular scenario will be too large to enable differences between in crop yield response between scenarios to be discriminated. The current parameters of field scale models may also not be valid for predicting crop responses in larger spatial parcels. It is recommended that further research be undertaken to compare yield estimates resulting from the application of current field scale models to data that is upscaled or derived from novel areas to actual observed yield values from these areas to investigate the limits of their current parameters and identify sources of uncertainty (Manivasagam and Rozenstein, 2020; Peng et al., 2020; Chen et al., 2021). It would also be worthwhile exploring where introduce aggregation into current modeling methods, as it is unknown whether producing predictions at smaller scales and then aggregating the predictions to a larger scale grid reduces or increases uncertainty than using aggregated large-scale data as model inputs.
Most models identified in our literature review predicted yield of wheat, which was in line with the findings of Silva and Giller (2021). Data on wheat is also most readily available. This includes crop management practices and protection information for which relatively little data for crops other than wheat is available. The large amount of data that is available on wheat, combined with the fact that wheat is the dominant arable crop grown globally, may explain the proliferation of models centered around predicting yields of wheat (Frich et al., 2002; Slater et al., 2021). This may also partially explain why previous studies have demonstrated that yield prediction accuracy is relatively high for wheat compared to other crops (Iizumi et al., 2013; Doi et al., 2020). As a wide variety of other crops are grown in the UK, the relative scarcity of available data and crop yield models developed to predict yield of other crops is a major limiting factor of current modeling methods and could potentially hinder the ability of the UK agri-food industry to prepare for and adapt to the potential effects of climate change (Doi et al., 2020).
Measurements of temperature and precipitation are the climate variables most often used to predict crop yield in the UK in the identified models. Many datasets reporting measurements of these variables are available at both global and field scales, though there was still a relative lack of field scale data compared to the number of stastical models requiring this data input as indicated by the low relative proportion value indicated in Figure 1. This abundance of data and the strong associations between increased temperature, increased precipitation and increased crop growth may account for these variables being widely incorporated into current crop yield models (Slater et al., 2021). However, there has been a significant increase in yield volatility for major UK crops such as wheat in recent years which can only be partially explained by seasonal variation in temperature and precipitation (Iizumi and Ramankutty, 2016; Hunt et al., 2019; Slater et al., 2021). Therefore, the extension of current models to explicitly account for other climate variables may provide insight into the drivers of yield volatility and enable UK farmers to better adapt to extreme and changing climate conditions (Arnell and Freeman, 2021; Slater et al., 2021; Zhu et al., 2022). Data on the effect of excessive precipitation, which may cause waterlogging of soil, could also potentially be integrated into crop models to better account for future climate conditions that are likely to be more extreme (Ploschuk et al., 2018).
In particular, it may be advantageous to explore the effects of air relative humidity, wind, and atmospheric gas variables for which recently published data is available. Higher levels of carbon dioxide have been associated with increased growth of crops, including wheat, and may therefore provide further explanation for recently observed increases in inter-annual yield variability (Addy et al., 2021), and increased atmospheric ozone concentration has been demonstrated to have an adverse effect on crop yield (Emberson et al., 2018). Increased air relative humidity has been found to increase crop yield in simulation or controlled experimental studies but could also be beneficial in predicting the effects of disease pressure on crops as more humid conditions are likely to support increased growth of fungal pathogens leading to yield loss (Velásquez et al., 2018; Romero et al., 2022). Similarly, incorporating available wind data into crop models may also allow better accounting for disease pressure on crops as higher wind speed may aid the dispersal of fungal spores (Rieux et al., 2014; Mukherjee et al., 2021).
Soil data was also found to be relatively widely available and used to predict crop yield in over half of the identified models at field scale and for the whole of Europe, resulting in a relatively even proportion of available data to models as indicated in Figures 1, 2. However, all models integrating soil data included static measurements of soil properties such as starting soil carbon or classification of soil type, while data are available on fluctuating soil properties, including soil temperature and moisture at yearly, daily, and sub-daily resolutions. Explicitly incorporating a variable related to soil properties into models of UK crop yield may allow for more accurate predictions of future crop growth. However, it should be also noted here that due to the high amount of rainfall over UK and high rates of soil moisture during crop growth seasons, the soil moisture deficit might not significantly add information in crop yield prediction models. On the other hand, other variables related to droughts, such as heat waves would be more beneficial in such applications. Examination of direct and indirect effects of climate change and heat waves have been demonstrated to result in heat stress to plants and negatively impact yield (Asseng et al., 2011; Zhao et al., 2016, 2017). Previous crop models have also failed to capture the effects of soil properties related to soil fertility, such as adequate concentration of essential nutrients in plant-available forms in soil, soil pH, and presence of micro-organisms that may aid in or hinder plant growth (Jones et al., 2017). The increased availability of soil data identified in the literature review may help to address this current critical limitation of crop yield modeling methods (Jones et al., 2017).
Relatively few datasets are available on crop planning and crop nutrition despite crop management variables being required as inputs into models of crop yield more often than data of any other variable category. This is indicated by the relatively low proportion of data to models evident in Figures 1, 2, particularly for field scale as well as seasonal resolution data. A large number of current modeling methods required data on fertilizer treatment, nitrogen application rate, and plant available nitrogen but only five datasets provided data on fertilizer, predominantly at field scale, and no datasets contained explicit information on nitrogen available or applied to plants. Similar to the overall trend in the datasets, most available data is on management of wheat crops. This relative lack of crop management data, particularly for crops other than wheat, could be a major limiting factor for current models of UK crop yield as many current models assume potential yield losses due to disease, pests, and weed competition will be controlled through management practices (Jones et al., 2017). Inadequate data on management practices can therefore lead to inaccurate predictions of crop yield, with many models predicting higher yields than are actually observed due to a failure to account for poor or ineffective management (Jones et al., 2017). Many models also assume homogeneity across fields for which crop yields are predicted when crop planning and nutrition practices often vary between fields (Jones et al., 2017; Afshar et al., 2021).
More available data on management practices for a wider variety of UK crops could improve our understanding of the effects of disease, pests and weeds on crop yield and better account for between-fields variability in predictions (Challinor et al., 2018). The challenge, however, lies in how more abundant and varied data on crop management for UK crops other than wheat could be obtained. One way to overcome to this issue is to use remote sensing datasets and retrievals related to nutrition and other management practices (Afshar et al., 2021; Mandel et al., 2022). Grey literature, such as reports generated by UK-based independent agricultural consultancies could also be investigated as a possible sources of additional crop management data. Further investment should also be put into furthering collaborations between researchers and farmers to directly source data on crop management practices (e.g., sowing date, amount of nutrition, irrigation timing) that could be used to validate remote sensing observations. However, the need to ensure anonymity for data providers from the agricultural industry may pose challenges to developing open and reproducible models, and there may be a self-selection bias in that larger farms with more access to advanced machinery capable of automatically logging yield data might be more likely to contribute (Challinor et al., 2018).
Only a small number of models explicitly incorporate input data on plant phenotype into predictions of crop yield, as indicated by relatively high proportion of available data to models indicated in Figures 1, 2 at scales for which phenotype data or models requiring phenotype data as inputs existed. Process-based models including this type of data do so by incorporating data on variables measured once at the start of the growing season, such as initial biomass in the Yield-SAFE model (Palma et al., 2018) or that can be measured at field scale using remote sensing observations as well, such as leaf area index in the Community Land Model (Lawrence et al., 2019). This may be due to the relatively low amount of available data on crop plant phenotype that was found to be available through the literature review. However, in recent years, there have been significant advancements in technology for high-throughput plant imaging platforms which have led to collection of large, high-resolution time-series image datasets of crop plants from which detailed data on dynamic phenotypic traits could be collected, though these datasets are often not openly available, particularly in their native, high-resolution (Choudhury et al., 2019). Extracting data from these datasets currently poses a significant bottleneck as manual analysis tends to be very time consuming and requires high expertise, whereas automated analysis methods using computer vision could be applied to image datasets to potentially extract phenotype data more accurately and efficiently (Lee et al., 2018; Yang et al., 2020). Integrating automatically extracted phenotype data into models of crop yield could then help to account for gaps between yield predicted with current models and actual observed yields by allowing identification of plant traits that increased growth and tolerance to stresses caused by changing climate conditions, in turn aiding farmers in selecting and breeding more resilient cultivars (Lee et al., 2018; Yang et al., 2020).
No identified models explicitly take genotype data into account when predicting crop yield and no relevant datasets on the genetics of crop plants grown in the UK were found to be openly available. A small number of models indirectly account for some degree of within-species variation in crop yield by examining the difference between cultivars, which can be empirically represented as differing based on genotype-specific parameters (GSPs) estimated from laboratory or field study data (Begum et al., 2017; Addy et al., 2020). Integrating data on cultivars or GSPs has been found to improve yield predictions, however the assumptions made by current modeling approaches may not reflect the full complexity of genotype-by-environment interactions which may lead to gaps between predicted and observed yields (Acharya et al., 2017; Oliveira et al., 2021). For instance, different gene combinations may lead to different responses to varying temperatures, while current models assume all genotypes will respond in the same way (Acharya et al., 2017; Oliveira et al., 2021). The integration of explicit and detailed genotype data into crop models, possibly by substituting a genetics-based module component for the dynamic module component that is encapsulated in many current crop yield models, could allow more within-species variation in yield to be included in predictions (Hwang et al., 2017). Grey literature such as official registration documents for annual variety assessment and data from genetic progress trials that compare varietal differences at various times of registrations could also be explored to better understand the impact of changing population genotypes on crop yield over long time periods.
Crop protection data was only considered in one model, which coincides with the findings of Silva and Giller (2021). Recently published openly accessible data was found to be available for the impacts of insect pests, weed competition and disease on wheat crops. As previously mentioned, many current models of UK crop yield to fail to account for crop losses resulting from poor crop protection and elevated levels of disease, pests and/or weeds, often leading to overestimates of predicted yield (Jones et al., 2017; Velásquez et al., 2018; Raza and Bebber, 2022; Romero et al., 2022). These errors in yield estimates can be exacerbated by the fact that weather conditions favorable for plant growth may also lead to increased growth of invasive weeds, pests, and pathogens (Jones et al., 2017). Integrating explicit data on crop protection variables may prove difficult as injuries and damages to crops caused by weeds, pathogens, and insect pests tend to be very complex, multifaceted interactions (Jones et al., 2017; Velásquez et al., 2018; Raza and Bebber, 2022; Romero et al., 2022) However, there is potential for the available datasets on these biotic factors to be used to correct or adjust yield predictions as a post-processing step in order to assist in addressing gaps between current yield predictions and observed trends in yield. Due to the availability of data it may be logical to begin developmental of these post-processing steps to account for the complex pressures of disease, insect pests and weeds for predictions of wheat yield in the UK.
5. Conclusion
A major limitation identified in current modeling methods for crop yield for the UK was that majority of models were driven by inputs that cannot be predicted in advance without uncertainty such as weather and soil conditions, which is likely to introduce added uncertainty into crop yield predictions that may undermine the value of these predictions to make decisions regarding crops. Machine learning models including random forest, neural network, or convolutional neural network models could prove useful in improving predictions of crop yield under varying near-term climate conditions, as a high degree of prediction accuracy has been achieved for major crops such as maize and soybean in the US and other non-UK regions when trained on at least 30 years of historical weather data (Crane-Droesch, 2018; Russello, 2018; Ansarifar et al., 2021). Collection and integration of data on extreme weather events into models of meteorological impacts on UK crops could also improve the accuracy of crop yield predictions as increased frequency of extreme weather events is expected under many future climate scenarios (Konduri et al., 2020).
This limitation of the unpredictability of climate and soil data ties into another key finding of this literature review, which was that the relative lack of openly accessible data on crop management, crop protections, and crop physiology poses a significant challenge to improving current models of crop yield in the UK. The scarcity of data on these variables may at least partially explain why contemporary models predominantly input data on factors that are beyond our ability to directly control, such as weather, as opposed to those that we can such as management and crop protection practices. Strategies such as increased collaboration with farmers or agricultural industry stakeholders to collect and anonymize data, and machine-learning based methods for automated analysis of high-throughput plant image datasets could potentially address these gaps.
This literature review also highlights the untapped potential to extend current crop models by integrating openly accessible data available for UK crops. In particular, two key avenues for future research that could lead to improved predictions of crop yield to inform more effective management practices for growing climate change resistant crops were identified. Firstly, scaling up of current models to predict crop yield at a coarse-grain scale for the whole of the UK using recently published datasets on weather and soil variables with global and European coverage should be explored. Secondly, models should be extended to explicitly integrate available data on crop protection, including data on disease, insect pests and weed competition. Incorporating data on these crop protection factors into post-processing corrections to model predictions could allow for a more nuanced, holistic understanding of the complex crop growth ‘ecosystem’ and contribute to explaining yield gaps. It is possible that the aforementioned strategies for improving crop yield model predictions may also be of benefit if applied to model for crops from regions outside the UK, such as temperate parts of Europe and the US that have historically exhibited similar long-term trends of climate, pathogens and pest on crop growth. It is also possible that existing process-based models which account for environmental impacts on crop growth, but which have not previously been used to model crop growth in the UK, could be applied to data from UK crops (Roberts et al., 2017; Manivasagam and Rozenstein, 2020; Weih et al., 2022). However, it remains uncertain how the parameters of current crop models may limit their application to data from different crop species or from areas of different sizes or with different environmental and management conditions. It is therefore important that research be undertaken to quantify and uncover possible source of uncertainty surrounding predictions made using current models using data from novel contexts and scales before using these predictions to inform crop management and policy decisions.
Author contributions
EC led the literature review, conducted the analysis of the identified relevant datasets and models, and wrote the first draft. MA, SC, AL, and MR contributed to the literature review. EC, MA, SC, AL, MR, SA, AM, and RM contributed to defining the scope of the review and to reviewing and editing the manuscript. All authors contributed to the article and approved the submitted version.
Funding
This work was supported by Wave 1 of The UKRI Strategic Priorities Fund under the EPSRC grant EP/W006022/1, particularly the “Environment and Sustainability” theme within that grant and The Alan Turing Institute.
Acknowledgments
The authors thank the Research Compute Platforms group at The Alan Turing Institute for providing computational resources which aided in conducting the literature review, and the Rothamsted Research Electronic Research Archive (e-RA) Project Team for facilitating access to relevant datasets.
Conflict of interest
The authors declare that the research was conducted in the absence of any commercial or financial relationships that could be construed as a potential conflict of interest.
Publisher’s note
All claims expressed in this article are solely those of the authors and do not necessarily represent those of their affiliated organizations, or those of the publisher, the editors and the reviewers. Any product that may be evaluated in this article, or claim that may be made by its manufacturer, is not guaranteed or endorsed by the publisher.
References
Abatzoglou, J. T., Dobrowski, S. Z., Parks, S. A., and Hegewisch, K. C. (2018). Terraclimate, a high-resolution global dataset of monthly climate and climatic water balance from 1958-2015. Sci Data 5:170191. doi: 10.1038/sdata
Acharya, S., Correll, M., Jones, J. W., Boote, K. J., Alderman, P. D., Hu, Z., et al. (2017). Reliability of genotype-specific parameter estimation for crop models: insights from a Markov chain Monte-Carlo estimation approach. Trans. ASABE 60, 1699–1712. doi: 10.13031/trans.12183
Addy, J. W. G., Ellis, R. H., Macdonald, A. J., Semenov, M. A., and Mead, A. (2020). Investigating the effects of inter-annual weather variation (1968–2016) on the functional response of cereal grain yield to applied nitrogen, using data from the Rothamsted long-term experiments. Agric. For. Meteorol. 284:107898. doi: 10.1016/j.agrformet.2019.10789
Addy, J. W. G., Ellis, R. H., Macdonald, A. J., Semenov, M. A., and Mead, A. (2021). The impact of weather and increased atmospheric CO2 from 1892 to 2016 on simulated yields of UK wheat. J. R. Soc. Interface 284:179. doi: 10.1016/j.agrformet.2019.107898
Afshar, M. H., Foster, T., Higginbottom, T. P., Parkes, B., Hufkens, K., Mansabdar, S., et al. (2021). Improving the performance of index insurance using crop models and Phenological monitoring. Remote Sens. 13:924. doi: 10.3390/rs13050924
Agriculture and Horticulture Development Board. Data from: recommended lists for cereals and oilseeds (RL) harvest results (archive). AHDB knowledge library. (2020). Available at: https://ahdb.org.uk/knowledge-library/recommended-lists-for-cereals-and-oilseeds-rl-harvest-results-archive
Ansarifar, J., Wang, L., and Archontoulis, S. V. (2021). An interaction regression model for crop yield prediction. Sci. Rep. 11:17754. doi: 10.1038/s41598-021-97221-7
Arnell, N. W., and Freeman, A. (2021). The effect of climate change on agro-climatic indicators in the UK. Clim. Chang. 165:40. doi: 10.1007/s10584-021-03054-8
Asseng, S., Foster, I. A. N., and Turner, N. C. (2011). The impact of temperature variability on wheat yield. Glob. Change Biol. 17, 997–1012. doi: 10.1111/j.1365-2486.2010.02262.x
Atkinson, M. D., Kettlewell, P. S., Poulton, P. R., and Hollins, P. D. (2008). Grain quality in the Broadbalk wheat experiment and the winter North Atlantic oscillation. J. Agric. Sci. 146, 541–549. doi: 10.1017/S0021859608007958
Ballabio, C., Panagos, P., and Montanarella, L. (2016). Mapping topsoil physical properties at European scale using the LUCAS database. Geoderma 261, 110–123. doi: 10.1016/j.geoderma.2015.07.006
Barichivich, J., Osborn, T. J., Harris, I., van der Schrier, G., and Jones, P. D. (2021). Monitoring global drought using the self-calibrating palmer drought severity index [in “state of the climate in 2020” eds. R. J. H. Dunn, F. Aldred, N. Gobron, J. B. Miller, and K. M. Willett Bull. Am. Meteorol. Soc. 102, S11–S142. doi: 10.1175/BAMS-D-21-0098.1
Begum, K., Kuhnert, M., Yeluripati, J., Glendining, M., and Smith, P. (2017). Simulating soil carbon sequestration from long term fertilizer and manure additions under continuous wheat using the daily day cent model. Nutr. Cycl. Agroecosystems 109, 291–302. doi: 10.1007/s10705-017-9888-0
Beveridge, L., Whitfield, S., and Challinor, A. (2018). Crop modelling: towards locally relevant and climate-informed adaptation. Clim. Chang. 147, 475–489. doi: 10.1007/s10584-018-2160-z
Beza, E., Silva, J. V., Kooistra, L., and Reidsma, P. (2017). Review of yield gap explaining factors and opportunities for alternative data collection approaches. Eur. J. Agron. 82, 206–222. doi: 10.1016/j.eja.2016.06.016
Borsche, M., Kaiser-Weiss, A. K., Undén, P., and Kaspar, F. (2015). Methodologies to characterize uncertainties in regional reanalyses. Adv. Sci. Res. 12, 207–218. doi: 10.5194/asr-12-207-2015
Bottcher, U., Weymann, W., Pullens, J. W. M., Olesen, J. E., and Kage, H. (2020). Development and evaluation of HUME-OSR: a dynamic crop growth model for winter oilseed rape. Field Crops Res 246:107679. doi: 10.1016/j.fcr.2019.107679
Campbell, B. M., Vermeulen, S. J., Aggarwal, P. K., Corner-Dolloff, C., Girvetz, E., Loboguerrero, A. M., et al. (2016). Reducing risks to food security from climate change. Glob. Food Sec. 11, 34–43. doi: 10.1016/j.gfs.2016.06.002
Challinor, A. J., Muller, C., Asseng, S., Deva, C., Nicklin, K. J., Wallach, D., et al. (2018). Improving the use of crop models for risk assessment and climate change adaptation. Agric. Syst. 159, 296–306. doi: 10.1016/j.agsy.2017.07.010
Challinor, A. J., Stafford, M. S., and Thornton, P. (2013). Use of agro-climate ensembles for quantifying uncertainty and informing adaptation. Agric. For. Meteorol. 170, 2–7. doi: 10.1016/j.agrformet.2012.09.007
Chen, S., He, L., Cao, Y., Wang, R., Wu, L., Wang, Z., et al. (2021). Comparisons among four different upscaling strategies for cultivar genetic parameters in rainfed spring wheat phenology simulations with the DSSAT-CERES-wheat model. Agric. Water Manag. 258:107181. doi: 10.1016/j.agwat.2021.107181
Chen, M., Xie, P., Janowiak, J. E., and Arkin, P. A. (2002). Global land precipitation: a 50-yr monthly analysis based on gauge observations. J. Hydrometeorol. 3, 249–266. doi: 10.1175/1525-7541(2002)003<0249:GLPAYM>2.0.CO;2
Chenu, K., Chapman, S. C., Tardieu, F., McLean, G., Welcker, C., and Hammer, G. L. (2009). Simulating the yield impacts of organ-level quantitative trait loci associated with drought response in maize: a ‘gene-to-phenotype’ modeling approach. Genetics 183, 1507–1523. doi: 10.1534/genetics.109.105429
Choudhury, S. D., Samal, A., and Awada, T. (2019). Leveraging image analysis for high-throughput plant phenotyping. Front. Plant Sci. 10:508. doi: 10.3389/fpls.2019.00508
Coleman, K., Whitmore, A. P., Hassall, K. L., Shield, I., Semenov, M. A., and Dobermann, A. (2021). The potential for soybean to diversify the production of plant-based protein in the UK. Sci. Total Environ. 767:144903. doi: 10.1016/j.scitotenv.2020.144903
Copernicus (2022). Data from: Agrometeorological indicators from 1979 to present derived from reanalysis. Copernicus Clim. Chang. Serv. doi: 10.24381/cds.6c68c9bb
Cornes, R., van der Schrier, G., van den Besselaar, E. J. M., and Jones, P. D. (2018). An ensemble version of the E-OBS temperature and precipitation datasets. J. Geophys. Res. Atmos. 123, 9391–9409. doi: 10.1029/2017JD028200
Cowtan, K, National Center for Atmospheric Research Staff (Eds) (2019). The climate data guide: global surface temperatures: BEST: Berkeley earth surface temperatures. Available at: (https://climatedataguide.ucar.edu/climate-data/global-surface-temperatures-best-berkeley-earth-surface-temperatures)
Crane-Droesch, A. (2018). Machine learning methods for crop yield prediction and climate change impact assessment in agriculture. Environ. Res. Lett. 13:114003. doi: 10.1088/1748-9326/aae159
Dai, A. (2017). Dai global palmer drought severity index (PDSI). Research data archive at the National Center for Atmospheric Research. Comput. Inform. Syst. Lab. doi: 10.5065/D6QF8R93
de Rooy, W., de Vries, H., van Dalum, C., de Haan, S., Lenderink, G., van Marseille, G. J., et al. (2017). Harmonie verification and evaluation. Hirlam Technical Report 70:79.
De Wit, A., Boogaard, H., Fumagalli, D., Janssen, S., Knapen, R., and Van Kraalingen, D. (2019). 25 years of the WOFOST cropping systems model. Agric. Syst. 168, 154–167. doi: 10.1016/j.agsy.2018.06.018
Dee, D. P., Balmaseda, M., Balsamo, G., Engelen, R., Simmons, A. J., and Thepaut, J. N. (2014). Toward a consistent reanalysis of the climate system. Bull. Amer. Meteor. Soc. 95, 1235–1248. doi: 10.1175/BAMS-D-13-00043.1
Department for Environment, Food, and Rural Affairs. (2020). Agriculture in the United Kingdom 2020. Available at: (https://www.gov.uk/government/statistics/agriculture-in-the-united-kingdom-2020).
Department for Environment, Food, and Rural Affairs. (2021). United Kingdom food security report. Available at: (https://www.gov.uk/government/collections/united-kingdom-food-security-report).
Doi, T., Sakurai, G., and Iizumi, T. (2020). Seasonal predictability of four major crop yields worldwide by a hybrid system of dynamical climate prediction and eco-physiological crop-growth simulation. Front. Sustain. Food Syst 4. doi: 10.3389/fsufs.2020.00084
Dubache, G., Li, S., Zheng, X., Zhang, W., and Deng, J. (2019). Modeling ammonia volatilization following urea application to winter cereal fields in the United Kingdom by a revised biogeochemical model. Sci. Total Environ. 660, 1403–1418. doi: 10.1016/j.scitotenv.2018.12.407
Emberson, L. D., Pleijel, H., Ainsworth, E. A., van der Berg, M., Ren, W., Osborne, S., et al. (2018). Ozone effects on crops and consideration in crop models. Eur. J. Agron. 100, 19–34. doi: 10.1016/j.eja.2018.06.002
European Soil Data Centre. Data from: maps of indicators of soil hydraulic properties for Europe. European Soil Data Centre. (2016). Available at: https://esdac.jrc.ec.europa.eu/content/maps-indicators-soil-hydraulic-properties-europe#tabs-0-description=1
Florence, A., Revill, A., Hoad, S., Rees, R., and Williams, M. (2021). The effect of antecedence on empirical model forecasts of crop yield from observations of canopy properties. Agriculture 11:258. doi: 10.3390/agriculture11030258
Frich, P., Alexander, L. V., Della-Marta, P., Gleason, B., Haylock, M., Tank Klein, A. M. G., et al. (2002). Observed coherent changes in climatic extremes during the second half of the twentieth century. Clim. Res. 19, 193–212. doi: 10.3354/cr019193
Gobbett, D., Hochman, Z., Horan, H., Navarro Garcia, J., Grassini, P., and Cassman, K. (2017). Yield gap analysis of rainfed wheat demonstrates local to global relevance. J. Agric. Sci. 155, 282–299. doi: 10.1017/S0021859616000381
Harkness, C., Semenov, M. A., Areal, F., Senapati, N., Trnka, M., Balek, J., and Bishop, J. (2020.) Adverse weather conditions for UK wheat production under climate change. Agric. For. Meteorol. 282-283::107862. doi: 10.1016/j.agrformet.2019.107862
Haro-Monteagudo, D., Daccache, A., and Knox, J. (2018). Exploring the utility of drought indicators to assess climate risks to agricultural productivity in a humid climate. Hydrol. Res. 49, 539–551. doi: 10.2166/nh.2017.010
Harris, I. C., and Jones, P. D. (2017). Data from: CRU TS4.00: climatic research unit (CRU) time-series (TS) version 4.00 of high-resolution gridded data of month-by-month variation in climate (Jan. 1901-Dec. 2015). Centre Environ. Data Analysis. doi: 10.5285/edf8febfdaad48abb2cbaf7d7e846a86
Hoffmann, M. P., Haakana, M., Asseng, S., Hohn, J. G., Palosuo, T., and Ruiz-Ramos, M. (2018). How does inter-annual variability of attainable yield affect the magnitude of yield gaps for wheat and maize? An analysis at ten sites. Agric. Syst. 159, 199–208. doi: 10.1016/j.agsy.2017.03.012
Holzworth, D. P., Huth, N. I., de Voil, P. G., Zurcher, E. J., Herrmann, N. I., McLean, G., et al. (2014). APSIM – evolution towards a new generation of agricultural systems simulation. Environ. Model. Softw. 62, 327–350. doi: 10.1016/j.envsoft.2014.07.009
Huang, J., Gomez-Dans, J. L., Huang, H., Ma, H., Wu, Q., and Lewis, P. E. (2019). Assimilation of remote sensing into crop growth models: current status and perspectives. Agric. For. Meteorol. 276–277:107609. doi: 10.1016/j.agrformet.2019.06.008
Hull, R., Perryman, S., and Storkey, J. (2021). Data from: Broadbalk weed survey data 1991-2020. Electron. Rothamsted Archive Rothamsted Res. doi: 10.23637/rbk1-weeds_1991-2020_01
Hunt, M. L., Blackburn, G. A., Carrasco, L., Redhead, J. W., and Rowland, C. S. (2019). High resolution wheat yield mapping using Sentinel-2, remote Sens. Environment 233:111410. doi: 10.1016/j.rse.2019.111410
Hwang, C., Correll, M. J., Gezan, S. A., Zhang, L., Bhakta, M. S., Vallejos, C. E., et al. (2017). Next generation crop models: a modular approach to model early vegetative and reproductive development of the common bean (Phaseolus vulgaris L). Agric. Syst. 155, 225–239. doi: 10.1016/j.agsy.2016.10.010
Iizumi, T., and Ramankutty, N. (2016). Changes in yield variability of major crops for 1981-2010 explained by climate change, 390 environ. Res. Lett. 11:3. doi: 10.1088/1748-9326/11/3/034003
Iizumi, T., Sakuma, H., Yokozawa, M., Luo, J. J., Challinor, A. J., Brown, M. E., et al. (2013). Prediction of seasonal climate-induced variations in global food production. Nat. Clim. Chang. 3, 904–908. doi: 10.1038/nclimate1945
Intergovernmental Panel on Climate Change (2014). Climate change 2014: Synthesis report. In Contribution of working groups I, II and III to the fifth assessment report of the intergovernmental panel on climate change, Ed. R. K. Pachauri and L. A. Meyer (IPCC, Geneva, Switzerland), 151.
Jarvis, S. G., Redhead, J. W., Henrys, P. A., Risser, H. A., Da Silva Osório, B. M., and Pywell, R. F. (2020). Data from: CEH land cover plus: pesticides 2012-2017 (England, Scotland and Wales). NERC Environ. Inform. Data Centre. doi: 10.5285/99a2d3a8-1c7d-421e-ac9f-87a2c37bda62
Jones, J., Antle, J. M., Basso, B., Boote, K., Conant, R., and Foster, I. (2017). Brief history of agricultural systems modelling. Agric. Syst. 155, 240–254. doi: 10.1016/j.agsy.2016.05.014
Jones, J. W., Hoogenboom, G., Porter, C. H., Boote, K. J., Batchelor, W. D., and Hunt, L. A. (2003). The DSSAT cropping system model. Eur. J. Agron. 18, 235–265. doi: 10.1016/S1161-0301(02)00107-7
Kadiyala, M. D. M., Nedumaran, S., Singh, P., Chukka, S., Irshad, M. A., and Bantilan, M. C. S. (2015). An integrated crop model and GIS decision support system for assisting agronomic decision making under climate change. Sci. Total Environ 521-522, 123–134. doi: 10.1016/j.scitotenv.2015.03.097
Kendall, S. L., Holmes, H., White, C. A., Clarke, S. M., and Berry, P. M. (2017). Quantifying lodging-induced yield losses in oilseed rape. Field Crops Res 211, 106–113. doi: 10.1016/j.fcr.2017.06.013
Knox, J., Morris, J., and Hess, T. (2010). Identifying future risks to UK agricultural crop production. Agriculture 39, 245–248. doi: 10.5367/oa.2010.0015
Kolde, R. (2019). Pheatmap: a function to draw clustered heatmaps. R package version 1.0.12. Available at: https://rdrr.io/cran/pheatmap
Konduri, V. S., Vandal, T. J., Ganguly, S., and Ganguly, A. R. (2020). Data science for weather impacts on crop yield. Front. Sustain. Food Syst. 4:2020. doi: 10.3389/fsufs.2020.00052
Lawless, C., Semenov, M. A., and Jamieson, P. D. (2005). A wheat canopy model linking leaf area and phenology. Eur. J. Agron. 22, 19–32. doi: 10.1016/j.eja.2003.11.004
Lawrence, D. M., Fisher, R. A., Koven, C. D., Oleson, K. W., Swenson, S. C., Bonan, G., et al. (2019). The community land model version 5: description of new features, benchmarking, and impact of forcing uncertainty. J. Adv. Model Earth Syst. 11, 4245–4287. doi: 10.1029/2018MS001583
Lee, U., Chang, S., Putra, G. A., Kim, H., and Kim, D. H. (2018). An automated, high-throughput plant phenotyping system using machine learning-based plant segmentation and image analysis. PLoS One 13:e0196615. doi: 10.1371/journal.pone.0196615
Liu, W., Yang, H., Folberth, C., Wang, X., Luo, Q., and Schulin, R. (2016). Global investigation of impacts of PET methods on simulating crop-water relations for maize. Agric. For. Meteorol. 221, 164–175. doi: 10.1016/j.agrformet.2016.02.017
Lobell, D. B., Schlenker, W., and Costa-Roberts, J. (2011). Climate trends and global crop production since 1980. Science 333, 616–620. doi: 10.1126/science.1204531
Macholdt, J., Piepho, H., Honermeier, B., Perryman, S., Macdonald, A., and Poulton, P. (2020). The effects of cropping sequence, fertilization and straw management on the yield stability of winter wheat (1986–2017) in the Broadbalk wheat experiment, Rothamsted. UK. J Agric Sci 158, 65–79. doi: 10.1017/S0021859620000301
Mądry, W., Derejko, A., Studnicki, M., Paderewski, J., and Gacek, E. (2017). Response of winter wheat cultivars to crop management and environment in post-registration trials. Czech J. Genet. Plant Breed. 53, 76–82. doi: 10.17221/28/2016-CJGPB
Mandel, A., Majumder, A., Dhaliwal, S. S., Toor, A. S., Mani, P. K., Naresh, R. K., et al. (2022). Impact of agricultural management practices on soil carbon sequestration and its monitoring through simulation models and remote sensing techniques: a review. Crit. Rev. Environ. Sci. Technol. 52, 1–49. doi: 10.1080/10643389.2020.1811590
Manivasagam, V. S., and Rozenstein, O. (2020). Practices for upscaling crop simulation models from field scale to large regions. Comput. Electron. Agric. 175:105554. doi: 10.1016/j.compag.2020.105554
Menne, M. J., Durre, I., Vose, R. S., Gleason, B. E., and Houston, T. G. (2012). An overview of the global historical climatology network-daily database. J. Atmos. Ocean. Technol. 29, 897–910. doi: 10.1175/JTECH-D-11-00103.1
Met Office Hadley Centre. Data from: UKCP18 regional projections on a 12km grid over the UK for 1980-2080. Centre for Environmental Data Analysis. (2018). Available at: https://catalogue.ceda.ac.uk/uuid/589211abeb844070a95d061c8cc7f604
Morton, R. D., Marston, C. G., O’Neil, A. W., and Rowland, C. S. (2021). Land cover map 2020 (land parcels, GB). NERC EDS Environ. Inform. Data Centre. doi: 10.5285/0e99d57e-1757-451f-ac9d-92fd1256f02a
Muhammed, S. E., Coleman, K., Wu, L., Bell, V. A., Davies, J. A. C., Quinton, J. N., et al. (2018). Impact of two centuries of intensive agriculture on soil carbon, nitrogen and phosphorus cycling in the UK. Sci. Total Environ 634, 1486–1504. doi: 10.1016/j.scitotenv.2018.03.378
Mukherjee, R., Gruszewski, H. A., Bilyeu, L. T., Schmale, D. G., and Boreyko, J. B. (2021). Synergistic dispersal of plant pathogen spores by jumping-droplet condensation and wind. PNAS 118:e2106938118. doi: 10.1073/pnas.2106938118
National Centre for Biotechnology Information. Data from: PRJNA578690 [Vernalisation and floral transition in autumn drive winter-annual life history in oilseed rape]. NCBI Sequence Read Archive. (2020). Available at: https://trace.ncbi.nlm.nih.gov/Traces/sra/?run=SRR10317724
Okom, S., Russell, A., Chaudhary, A. J., Scrimshaw, M. D., and Francis, R. A. (2017). Impacts of projected precipitation changes on sugar beet yield in eastern England. Met. Apps 24, 52–61. doi: 10.1002/met.1604
Oliveira, F. A. A., Jones, J. W., Pavan, W., Bhakta, M., Vallejos, C. E., and Correll, M. J. (2021). Incorporating a dynamic gene-based process module into a crop simulation model. In Silico Plants :3. doi: 10.1093/insilicoplants/diab011
Osório, B., Redhead, J. W., Jarvis, S. G., May, L., and Pywell, R. F. (2019). Data from: CEH land cover plus: Fertilisers 2010-2015 (England). NERC Environ. Inform. Data Centre. doi: 10.5285/15f415db-e87b-4ab5-a2fb-37a78e7bf051
Ozalp, O. (2020). Investigating potato production in the future by the EU-28 countries using sentinels and EU open datasets. Remote Sens. Agric. Ecosyst. Hydrol. 115280V: 11528. doi: 10.1117/12.2574355
Palma, J. H. N., Crous-Duran, J., Graves, A. R., Garcia De Jalon, S., Upson, M., and Oliveira, T. S. (2018). Integrating belowground carbon dynamics into yield-SAFE, a parameter sparse agroforestry model. Agrofor. Syst. 92, 1047–1057. doi: 10.1007/s10457-017-0123-4
Parker, D. E., Legg, T. P., and Folland, C. K. (1992). A new daily Central England temperature series, 1772-1991. Int. J. Climatol. 12, 317–342. doi: 10.1002/joc.3370120402
Peng, B., Guan, K., Tang, J., Ainsworth, E. A., Asseng, S., Bernacchi, C. J., et al. (2020). Towards a multiscale crop modelling framework for climate change adaptation assessment. Nat. Plan. Theory 6, 338–348. doi: 10.1038/s41477-020-0625-3
Perryman, S., Scott, T., and Hall, C. (2018). Data from: mean monthly rainfall at Rothamsted march 1853 - July 2018 electronic Rothamsted archive. Rothamsted Res. doi: 10.23637/RMMRAIN5318
Perryman, S., Scott, T., and Hall, C. (2019). Data from: Rothamsted 30-year mean meteorological data 1961-1990 electronic Rothamsted archive. Rothamsted Res. doi: 10.23637/OARES30YrMeans6190
Perryman, S., Scott, Y., and Hall, C. (2020a). Data from: annual mean air temperature anomaly at Rothamsted 1878-2019 electronic Rothamsted archive. Rothamsted Res. doi: 10.23637/rms-RMAAtempanomaly-1
Perryman, S., Scott, T., and Hall, C. (2020b). Data from: annual mean air temperature at Rothamsted 1878-2019 electronic Rothamsted archive. Rothamsted Res. doi: 10.23637/rms-RMAAtemp-02
Perryman, S., Scott, T., and Hall, C. (2020c). Data from: mean monthly temperature at Rothamsted October 1985-September 2017 electronic Rothamsted archive. Rothamsted Res. doi: 10.23637/rmsmmtemp10850917
Perryman, S., and Wilmer, W. (2021). Data from: Broadbalk crop nutrient content, wheat 1968-2017. Electronic Rothamsted archive. Rothamsted Res. doi: 10.23637/rbk1-BKNUTRW-01
Ploschuk, R. A., Miralles, D. J., Colmer, T. D., Ploschuk, E. L., and Striker, G. G. (2018). Waterlogging of winter crops at early and late stages: impacts on leaf physiology, Growth and Yield. Front. Plant Sci. 9:01863. doi: 10.3389/flps.2018.01863
Pradhan, A., and Glendining, M. (2021). Data from: Broadbalk wheat experiment brown foot rot (Fusarium spp.) 1992-2009 electronic Rothamsted archive. Rothamsted Res. doi: 10.23637/rbk1-bfr-01
R Core Team (2021). R: A language and environment for statistical computing. R Foundation for Statistical Computing, Vienna, Austria. Available at: https://www.R-project.org
Raza, M. M., and Bebber, D. P. (2022). Climate change, biotic yield gaps and disease pressure in cereal crops. bio Rxiv. doi: 10.1101/2022.08.12.503729
Richards, M., Pogson, M., Dondini, M., Jones, E. O., Hastings, A., Henner, D. N., et al. (2017). High-resolution spatial modelling of greenhouse gas emissions from land-use change to energy crops in the United Kingdom. GCB Bioener. 9, 627–644. doi: 10.1111/gcbb.12360
Rieux, A., Soubeyrand, S., Bonnot, F., Klein, E. K., Ngando, J. E., Mehl, A., et al. (2014). Long-distance wind-dispersal of spores in a fungal plant pathogen: estimation of anisotropic dispersal kernels from an extensive field experiment. PLoS One 9:e103225. doi: 10.1371/journal.pone.0103225
Roberts, M. J., Braun, N. O., Sinclair, T. R., Lobell, D. B., and Schlenker, W. (2017). Comparing and combining process-based crop models and statistical models with some implications for climate change. Environ. Res. Lett. 12:095010. doi: 10.7916/D8M05HCN
Robinson, E. L., Blyth, E. M., Clark, D. B., Comyn-Platt, E., and Rudd, A. C. (2020). Climate hydrology and ecology research support system meteorology dataset for Great Britain (1961-2017) [CHESS-met]. NERC Environ. Inform. Data Centre. doi: 10.5285/2ab15bf0-ad08-415c-ba64-831168be7293
Romero, F., Cazzato, S., Walder, F., Vogelgsang, S., Bender, S. F., and van der Heijden, M. G. (2022). Humidity and high temperature are important for predicting fungal disease outbreaks worldwide. New Phytol. 234, 1553–1556. doi: 10.1111/nph.17340
Rothamsted Research (2017). Data from: Broadbalk mean long-term winter wheat yields. Rothamsted Res. doi: 10.23637/KeyRefOABKyields
Rothamsted Research (2019). WGIN diversity data 2004 to 2019. Rothamsted Res. Available at: https://rrescloud.rothamsted.ac.uk/index.php/s/7I4jNYDMy9rvUqL
Rötter, R., Appiah, M., Fichtler, E., Kersebaum, K. C., Trnka, M., and Hoffmann, M. P. (2018). Linking modelling and experimentation to better capture crop impacts of agroclimatic extremes – a review. Field Crops Res 221, 142–156. doi: 10.1016/j.fcr.2018.02.023
Russello, H. (2018). Convolutional neural networks for crop yield prediction using satellite images (IBM Center for advanced studies), vol. 2018.
Saha, S., Moorthi, S., Pan, H., Wu, X., Wang, J., Nadiga, S., et al. (2010). Data from: NCEP climate forecast system reanalysis (CFSR) monthly products, January 1979 to December 2010. Research data archive at the National Center for Atmospheric Research. Comput. Inform. Syst. Lab. doi: 10.5065/D6DN438J
Schaphoff, S., von Bloh, W., Rammig, A., Thonicke, K., Biemans, H., and Forkel, M. (2018). LPJmL4 – a dynamic global vegetation model with managed land – part 1: model description. Geosci. Model Dev. 11, 1343–1375. doi: 10.5194/gmd-11-1343-2018
Scott, T. (2014). The U.K. environmental change network Rothamsted. Physical and atmospheric measurements. Harpenden, UK: Lawes Agriculture Trust Co. Ltd
Silva, J., and Giller, K. (2021). Grand challenges for the 21st century: what crop models can and can’t (yet) do. J. Agric. Sci. 158, 794–805. doi: 10.1017/S0021859621000150
Slater, L. J., Huntingford, C., Pywell, R. F., Redhead, J. W., and Kendon, E. J. (2021). Resilience of UK crop yields to changing climate extremes. Earth Syst. Dynam. Discuss. 2021, 1–25. doi: 10.5194/esd-2021-92
Snyder, K., Miththapala, S., Sommer, R., and Braslow, J. (2017). The yield gap: closing the gap by widening the approach. Exp. Agric. 53, 445–459. doi: 10.1017/S0014479716000508
Stanley, S., Antoniou, V., Askquith-Ellis, A., Ball, L. A., Bennett, E. S., Blake, J., et al. (2021). Data from: daily and sub-daily hydrometeorological and soil data (2013-2019) [COSMOS-UK]. NERC Environ. Inform. Data Centre. doi: 10.5285/b5c190e4-e35d-40ea-8fbe-598da03a1185
Steduto, P., Hsiao, T. C., Raes, D., and Fereres, E. (2009). Aqua crop—the FAO crop model to simulate yield response to water: I. Concepts and Underlying Principles. Agron. J. 101, 426–437. doi: 10.2134/agronj2008.0139s
UK Centre for Ecology and Hydrology. Data from: ASSIST large scale field experiment yield data. UK Centre for Ecology and Hydrology Data Catalogue. (2022) Available at: https://catalogue.ceh.ac.uk/documents/7add7039-498c-4df0-a2ac-d9fd44bbda38
van den Bosch, F., Smith, J., Wright, P., Milne, A., van den Berg, F., Kock-Appelgren, P., et al. (2022). Maximizing realized yield by breeding for disease tolerance: a case study for Septoria tritici blotch. Plant Pathol. 71, 535–543. doi: 10.1111/ppa.13509
van Grinsven, H. J. M., Ebanyat, P., Glendining, M., Gu, B., Hijbeek, R., Lam, S. K., et al. (2022). Establishing long-term nitrogen response of global cereals to assess sustainable fertilizer rates. Nature Food 3, 122–132. doi: 10.1038/s43016-021-00447-x
Velásquez, A. C., Castroverde, C., and He, S. Y. (2018). Plant-pathogen warfare under changing climate conditions. Curr. Biol. 28, R619–R634. doi: 10.1016/j.cub.2018.03.054
Watson, J., Challinor, A. J., Fricker, T. E., and Ferro, C. A. T. (2015). Comparing the effects of calibration and climate errors on a statistical crop model and a process-based crop model. Clim. Chang. 132, 93–109. doi: 10.1007/s10584-014-1264-3
Watts, C. W., and Glendining, M. J. (2017). Castells-Brooke, NID. Data from: Woburn experimental farm soil and field maps. Electronic Rothamsted archive. Rothamsted Res. doi: 10.23637/ws-soil-maps-01
Weih, M., Adam, E., Vico, G., and Rubiales, D. (2022). Application of crop growth models to assist breeding for intercropping: opportunities and challenges. Front. Plant Sci. 13:720486. doi: 10.3389/fpls.2022.720486
Wentz, F. J., Scott, J., Hoffman, R., Leidner, M., Atlas, R., and Ardizzone, J. (2015). Data from: remote sensing systems cross-calibrated multi-platform (CCMP) 6-hourly ocean vector wind analysis product on 0.25 deg grid, version 2.0. Remote Sens. Syst. doi: 10.56236/RSS-uv6h30
Whetton, R., Zhao, Y., Shaddad, S., and Mouazen, A. M. (2017). Nonlinear parametric modelling to study how soil properties affect crop yields and NDVI. Comput. Electron. Agric. 138, 127–136. doi: 10.1016/j.compag.2017.04.016
Wu, X., Vuichard, N., Ciais, P., Viovy, N., De Noblet-Ducoudre, N., Wang, X., et al. (2016). ORCHIDEE-CROP (v0), a new process-based agro-land surface model: model description and evaluation over Europe. Geosci. Model Dev. 9, 857–873. doi: 10.5194/gmd-9-857-2016
Xie, P., Yatagai, A., Chen, M., Hayasaka, T., Fukushima, Y., Liu, C., et al. (2007). A gauge-based analysis of daily precipitation over East Asia. J. Hydrometeorol. 8, 607–626. doi: 10.1175/JHM583.1
Yang, W., Feng, H., Zhang, X., Zhang, J., Doonan, J. H., Batchelor, W. D., et al. (2020). Crop phenomics and high-throughput phenotyping: past decades, current challenges, and future perspectives. Mol. Plant 13, 187–214. doi: 10.1016/j.molp.2020.01.008
Zhao, C., Liu, B., Piao, S., Wang, X., Lobell, D. B., and Huang, Y. (2017). Temperature increase reduces global yields of major crops in four independent estimates. PNAS 114, 9326–9331. doi: 10.1073/pnas.1701762114
Zhao, C., Piao, S., Huang, Y., Wang, X., Ciais, P., Huang, M., et al. (2016). Field warming experiments shed light on the wheat yield response to temperature in China. Nat. Commun. 7:13530. doi: 10.1038/ncomms13530
Keywords: crop modeling, crop yield, crop management, prediction, food security, climate, soil
Citation: Corcoran E, Afshar M, Curceac S, Lashkari A, Raza MM, Ahnert S, Mead A and Morris R (2023) Current data and modeling bottlenecks for predicting crop yields in the United Kingdom. Front. Sustain. Food Syst. 7:1023169. doi: 10.3389/fsufs.2023.1023169
Edited by:
Bruno José Rodrigues Alves, Brazilian Agricultural Research Corporation (EMBRAPA), BrazilReviewed by:
Philippe Debaeke, Institut National de la Recherche Agronomique de Toulouse, FranceValentina Baldazzi, Institut Sophia Agrobiotech, France
Copyright © 2023 Corcoran, Afshar, Curceac, Lashkari, Raza, Ahnert, Mead and Morris. This is an open-access article distributed under the terms of the Creative Commons Attribution License (CC BY). The use, distribution or reproduction in other forums is permitted, provided the original author(s) and the copyright owner(s) are credited and that the original publication in this journal is cited, in accordance with accepted academic practice. No use, distribution or reproduction is permitted which does not comply with these terms.
*Correspondence: Evangeline Corcoran, ZWNvcmNvcmFuQHR1cmluZy5hYy51aw==
†These authors have contributed equally to this work
‡These authors have contributed equally to this work and share last authorship