
94% of researchers rate our articles as excellent or good
Learn more about the work of our research integrity team to safeguard the quality of each article we publish.
Find out more
ORIGINAL RESEARCH article
Front. Sustain. Food Syst., 23 March 2023
Sec. Nutrition and Sustainable Diets
Volume 7 - 2023 | https://doi.org/10.3389/fsufs.2023.1021906
This article is part of the Research TopicRole of Multi-Sector Research and Development Approach in Promoting Sustainable Healthier DietsView all 6 articles
 Lara Yacoub Bach1*
 Bethany E. Jana1
 Chisom Freda Adaeze Egwatu1Corey Jane Orndorff1Rinad Alanakrih1Joy Okoro1Megan K. Gahl1,2
Introduction: Sustainable diets and their overall impact on the environment and human health have garnered global attention. Environmental impact, human nutrition, and affordability are three relevant dimensions for assessing overall sustainability of diets. Using a relative sustainability score, we compare the Mediterranean, paleo, ketogenic, vegetarian, and vegan diets, along with the World Health Organization dietary guidelines in order to evaluate which diets are most sustainable.
Methods: Environmental, nutrition, and price data on individual food items were collected and used to analyze diets. Using an online meal- prep program, one week's worth of meals standardized at 2,000 kilocalories per day was generated for each diet. Estimates of greenhouse gas emissions, eutrophication, land use, water withdrawals, nutritional quality, and affordability were calculated. Ultimately an overall relative sustainability score based on these metric averages were used to compare diets.
Results: Our model indicates that vegan, Mediterranean, and vegetarian diets are the most sustainable across all metrics while meat-heavy diets, such as the ketogenic diet, have the greatest negative environmental impact. A diet based on the World Health Organization's dietary guidelines performed poorly with regards to affordability, environmental impacts, and nutritional quality. Diets with higher nutritional quality included the vegan, paleo, and Mediterranean diets. Diets that eliminate meat were the cheapest both by total cost and by cost per gram of food.
Discussion: Diets with the highest overall sustainability score share a common characteristic: they all suggest that consumers committed to sustainability should prioritize ‘plant-forward' diets. In contrast, diets rich in meat and animal products perform poorly overall but especially in terms of environmental sustainability.
Sustainable diets and their overall impact on the environment and human health have garnered global attention. With the increasing demands of a growing global population and the effects of climate change, individual and collective dietary choices may be key to a viable future (Jarmul et al., 2019). According to the Food and Agriculture Organization (FAO), sustainable diets are defined as nutritionally adequate, safe, healthy, economically affordable, culturally acceptable, and imposing minimal environmental degradation on the planet (Food and Agriculture Organization of the United Nations, 2023). Sustainable diets are, therefore, a combination of food choices that ensure the protection of human health, human rights, and the environment.
In this paper, the term “sustainability” refers to three quantifiable metrics of a sustainable diet as defined by the FAO—environmental impact, nutritional quality, and affordability. First, environmental impact refers to ecological alterations brought by food production, harvest, transport, and storage. Second, nutritional quality refers to the relative presence of vital nutrients to unhealthy components in a food item. The nutritional content of commonly consumed food items is important to consider as it contributes to the physical health and development of human populations. Lastly, affordability of food items refers to the accessibility of diets and their subsequent adoption. Consideration of these three metrics within the frame of sustainability serves to further understanding of short and long-term effects of food system practices on both human consumption and environmental health.
In a 2014 study, Masset et al. evaluated the sustainability of foods commonly consumed by the French population using these exact three dimensions of sustainability. Each food item was assessed for sustainability by calculating a score based on environmental impact indicators, nutritional quality, and price. To measure the environmental impact of foods, the authors used three environmental indicators: greenhouse gas emissions (GHG), air acidification, and freshwater eutrophication. They found that meat, fish, eggs, and dairy had the highest impact on the environment (Masset et al., 2014). Additionally, foods with higher environmental impact, particularly GHG emissions, were also typically the least affordable and had lower nutritional quality per kilogram. Most plant-based food items had higher overall sustainability scores than animal-based products (Masset et al., 2014).
Masset et al. (2014) focused on food sustainability at an individual food item level, but because food is not consumed in isolation, the authors stressed the importance of building on their results: “The results of our analysis need to be integrated at the diet level to identify culturally acceptable food combinations that are nutritious, environmentally friendly, and economical, so these practical and achievable sustainable dietary patterns can be listed in official recommendations and communicated to the general public” (Masset et al., 2014). This study serves to do exactly that—extend their analysis of the sustainability of individual foods by evaluating sustainability at the diet level.
Using similar methods, this paper evaluates the sustainability of popular diets that are purportedly healthy or environmentally friendly: Mediterranean, ketogenic, vegan, vegetarian, paleo, and a diet based on the World Health Organization's (WHO) nutritional guidelines. Some evidence has shown that the Mediterranean diet promotes an increased life expectancy because of its high nutritional quality (Sezaki et al., 2022). The ketogenic diet is thought to alleviate chronic conditions by cutting out sugars and carbs and inducing a state of ketosis in the body; in an effort to adopt a healthier lifestyle and lose fat, some individuals choose to adhere to the ketogenic diet (Appavu et al., 2016). Vegan and vegetarian diets, which primarily consist of plant-based products, are believed to be among the most environmentally sustainable (Chai et al., 2019; Segovia-Siapco and Sabaté, 2019; Rabès et al., 2020). While some vegans and vegetarians make food decisions based on perceived environmental sustainability, many also value animal welfare, another relevant component of food system adequacy (Hopwood et al., 2020). The paleo diet enacts a return to the “natural” state of human diets before the Neolithic revolution by restricting consumption of all processed foods. Some believe that this is the healthiest state for humans due to the evolution of our metabolic systems (Harvard T. H. Chan School of Public Health, 2023). A diet that follows WHO nutritional guidelines is intended for the reader as a general guiding manual for a healthy diet based on the best available nutritional information (World Health Organization., 2018).
This analysis utilized the three sustainability dimensions outlined by Masset et al. (2014) as its primary metrics: environmental impact, nutritional quality, and affordability. Analyzed together, these metrics were used to calculate a sustainability measure that could be compared across all chosen diets.
To extend the findings from Masset et al. (2014) we evaluated six different diets: Mediterranean, paleo, vegetarian, ketogenic, vegan, and the World Health Organization guidelines (WHO), as previously defined. These diets were selected based on their relative popularity and perceived health or environmental benefits. The Mediterranean diet involves the consumption of abundant fresh, local, plant-based foods, olive oil as the main source of fat, limited intake of meat products, and scarce processed and sugary foods (Estruch et al., 2018; Finicelli et al., 2022). The ketogenic diet is a low-carbohydrate, moderate-protein, and high-fat diet that focuses on the consumption of meat, fatty fish, eggs, butter, cheese, nuts, healthy oils, and elimination of sugary foods, grains, starches, and alcohol (Hamdy et al., 2018; McSwiney et al., 2018; O'Neill and Raggi, 2020). The paleo diet involves consuming abundant meat, fish, eggs, vegetables, fruits, and nuts, and limiting intake of processed foods, sugars, grains, and dairy (Genoni et al., 2019; Cambeses-Franco et al., 2021). The vegan diet is a plant-based diet characterized by a complete elimination of animal-derived products (Radnitz et al., 2015; Bakaloudi et al., 2021). The vegetarian diet eliminates meat intake but allows for regular consumption of non-meat animal products, such as dairy, eggs, milk, and butter (Thedford and Raj, 2011; Fresán and Sabaté, 2019). The WHO diet follows WHO nutritional guidelines: 5 portions of fruits/vegetables per day, total fat intake below 30% of total energy intake, limited sugar, salt, trans-fats, and saturated fats, and consumption of legumes, nuts, and whole grains (Ritchie et al., 2018; World Health Organization., 2018).
In this model, we used the WHO recommendation of 2,000 kilocalories per day to represent a healthy daily intake for adults in all diets analyzed (World Health Organization., 2018). In addition, the model assumes that daily calories would be distributed over four meals: breakfast, lunch, dinner, and a snack. For consistency, we generated a week-long sample of food consumption for each diet using an online database that developed meal plans based on the parameters previously outlined (Eat This Much, 2023). While this meal generator was almost entirely consistent with the requirements for each diet, a few discrepancies noted in the Mediterranean diet were remedied by replacing them with foods that better represented the diet. Specifically, cheddar cheese and beef were changed to feta cheese and tuna, respectively, with modified quantities to achieve 2,000 kilocalories/day.
To check if the diets were appropriately generated, we calculated the macronutrient content and ensured that they matched the dietary guidelines for each diet—such as the ketogenic diet being high in fat and protein and low in carbohydrates (Table 1). Furthermore, to ensure that the categorization of diets as meat-dense or plant-based was correct, we calculated the proportion of animal products consumed in a week for each diet from grams of food and from kilocalories (Table 2).
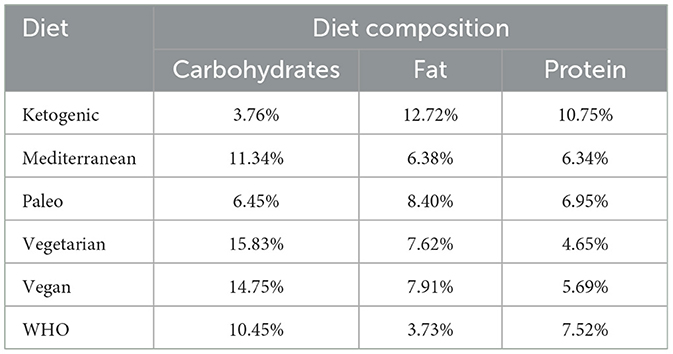
Table 1. Proportion of carbohydrates, fat, and protein in each diet, for 1 week of food at 2,000 kilocalories/day.
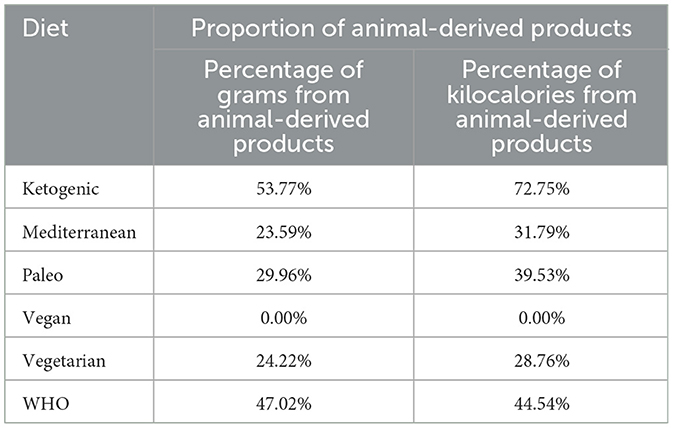
Table 2. Proportion of grams and kilocalories in each diet from animal-derived products (including meat, dairy, eggs, honey, and similar), for 1 week of food at 2,000 kilocalories/day.
To assess the sustainability of each diet, we evaluated the sustainability of each food item in the meals generated for a week. Three main factors were considered: environmental impact, nutritional quality, and affordability, the same metrics defined by Masset et al. (2014) and highlighted by the FAO (Food and Agriculture Organization of the United Nations, 2023). Also similar to Masset et al. (2014), we combined these three dimensions into a single sustainability score in order to identify the highest-scoring, most sustainable diets.
Environmental impact included four indicators: GHG emissions (greenhouse gas emissions, in kilograms of carbon dioxide equivalents—kgCO2e), land use (in square meters—m2), eutrophication potential (in grams of phosphate—), and water withdrawals (in liters—L). These indicators were chosen to keep consistent with Masset et al.'s inclusion of GHG emissions, freshwater eutrophication, and air acidification as environmental metrics. Due to data availability, air acidification was not included in this analysis. Land use and water withdrawals were added to showcase distinct parts of environmental systems across the four indicators—air, land, and water.
Food data for each environmental indicator was obtained from Clark et al. (2022), who integrated 111 environmental datasets from Poore and Nemecek, HESTIA, and the Blue Food Assessment into one consolidated dataset (Poore and Nemecek, 2018; Gephart et al., 2021; Clark et al., 2022). Poore and Nemecek sourced Life Cycle Assessment data from peer-reviewed publications between 2000 and June 2016 and fed model algorithms available on HESTIA while the Blue Food Assessment also synthesizes Life Cycle Assessment data from several sources (Poore and Nemecek, 2018; Gephart et al., 2021). We calculated average metrics for the overarching categories of fruits, seeds, nuts, poultry, seafood, legumes, and vegetables in order to categorize more specific food items in each diet that were not included in Clark et al.'s dataset.
For nutritional quality, we used Masset et al.'s calculation of the SAIN:LIM ratio, a combination of nutritionally adequate (SAIN) and disqualifying (LIM) nutrients of individual foods. As a nutrient profiling approach proposed by the French Food Standard Agency and validated by the World Health Organization, legislators typically use the SAIN:LIM calculation as the building block for nutrient characterization and food labeling across the European Union (Tharrey et al., 2017).
The SAIN score consists of five basic nutrients that are considered “positive” based on their positive contributions to a healthy diet—protein, fiber, calcium, vitamin C, and iron. The LIM consists of three nutrients considered “negative” and as such, should be limited in a healthy diet—saturated fatty acids, added sugars, and sodium. The SAIN nutrients are weighted based on the minimum dietary intake recommended by European researchers while the LIM substances are weighted based on the maximum recommended values (Tharrey et al., 2017). SAIN values greater than or equal to five indicate a positive nutrient density; LIM values ≥7.5 indicate the high presence of nutrients that should be limited. SAIN is divided by LIM to achieve a final total score. Therefore, a food item with higher SAIN:LIM ratio will be considered more nutritious than an item with lower SAIN:LIM. In our model, every food item is assigned a SAIN:LIM as calculated by Masset et al. (2014) based on the item's category (e.g., almonds are categorized as “dried fruits and nuts” and assigned the category's SAIN:LIM of 0.64). The item's SAIN:LIM ratio is then multiplied by the proportion of that item within the diet, which is calculated by dividing the quantity of the item (in grams) by the total amount of food in the diet (in grams).
Prices of food items were obtained from Bai et al. (2021), who consolidated data from the World Bank's 2011 International Comparison Program (ICP). Food prices are computed in accordance to purchase power parity and exchange rates worldwide and are statistically validated by National Agencies; the dataset includes 823 food items from 177 countries and territories (Bai et al., 2021). Similarly to the environmental metrics, we calculated average prices for beef, poultry, pork, deli meats, fish, cheese, yogurt, milk, mixed dishes, salty snacks, desserts, soft drinks, butter, oils, condiments, grains, potatoes, legumes, fruits, vegetables, dried fruits and nuts, and processed fruits and juices in order to categorize food items from our selected diets that were not included in Bai et al.'s dataset.
Environmental impact and affordability measures of each food item were calculated for a one kilogram serving. SAIN:LIM was calculated for a 100-gram serving. In order to determine the total impact for a given diet, the data was converted to values per 1-gram serving and then multiplied by the number of grams recommended for all the servings within that diet. For each diet, we calculated estimated total GHG emissions, land use, eutrophication potential, water withdrawals, SAIN:LIM ratio, and price for seven days of meals to compare the sustainability metrics across diets. In order to calculate a mean value per gram, the total result of each metric was divided by the number of grams consumed in that diet. Like Masset et al. (2014), this model used a relative sustainability score to compare diets across all sustainability metrics. This is a relative measure as the averages are calculated solely based on the diets included in this analysis.
For each diet, we compared the total of each metric to the overall total average across all diets. Similarly, the mean of each metric was compared to the overall mean average across all diets. To obtain relative sustainability scores, points were assigned based on the comparisons of the total and mean of individual diet metrics to the overall total average and overall mean average across all diets, respectively. The sustainability score based on total values normalizes the data with regards to the specific weekly calorie assumption (2,000 kcal/day) while the sustainability score based on mean values normalizes the data with regards to food quantity (grams). The metric based on total values represents the impact each diet would have if individuals consumed 2,000 kcal/day over the course of a week but does not normalize for the quantity (grams) of food. Given that the quantity of food can differ under our 2,000 kcal/day assumption, the sustainability score based on mean values represents a metric that is resistant to changes in quantity, instead providing a measure of impact based on nutrient profile. The mean value is the average, per gram, of each metric within a diet.
For price and environmental impact indicators, one point was assigned if the diet total or mean for that particular metric was below the overall total average or overall mean average, respectively, across all diets, and zero points if it was above. For nutrition, one point was assigned to diets with total or mean SAIN:LIM ratios higher than the overall total average or overall mean average, respectively, of all diets' SAIN:LIM, because a higher SAIN:LIM represents higher nutritional quality. Zero points were assigned if the individual diet's average was lower than the overall average in both scores.
Two sustainability scores, one for mean and one for total, were calculated for each diet, with a maximum of 6 points indicating high sustainability and a minimum of 0 points indicating low sustainability (Table 3). Scoring 0, 1, or 2 indicates the diet is not sustainable in at least one metric and therefore is not representative of a sustainable diet as defined by the FAO (Food and Agriculture Organization of the United Nations, 2023). Scoring 3 or 4 indicates the diet performs well in at least one environmental metric, but it might score poorly across other metrics, and therefore offers moderate sustainability. Scoring 5 indicates the diet offers high sustainability and is likely to be representative of a sustainable diet, while scoring 6 indicates the diet is sustainable across all metrics and represents the FAO's definition of a sustainable diet (Food and Agriculture Organization of the United Nations, 2023).
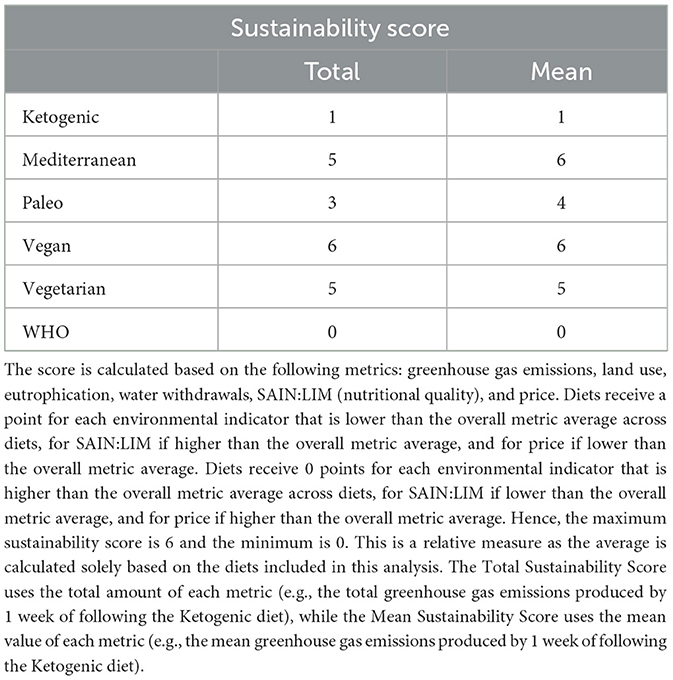
Table 3. Relative sustainability scores of each diet.
To determine the impact that animal derived food had on each sustainability metric, we ran a series of linear regressions in R Studio (Version 1.4.1717), with proportion of animal derived grams as the independent variable and each of the sustainability metrics as dependent variables.
More than half of the food (grams) consumed in a week of the ketogenic diet was made up of animal derived foods, while the WHO diet nearly reached the 50% mark (Table 2). For each of the other four diets, only around 20–30% of their food intake in grams came from animal derived products, demonstrating lesser meat product consumption when compared to the ketogenic and WHO diets. Of note, the Mediterranean and Paleo diets had a greater proportion of kilocalories derived from meat-based products than the vegan and vegetarian diets, both reaching the 30–40% mark and thus approaching the WHO diet's ~45% of kilocalories derived from animal-based products (Table 2).
It is worth noting that the vegetarian diet, even with the elimination of meat, included a significant proportion of animal derived products due to the use of eggs, butter, honey, and cheese. Other diets included both meat and meat derived products. Vegan and vegetarian diets stand as the diets with the complete exclusion and lowest inclusion, respectively, of animal derived products, while the Mediterranean and Paleo diets have moderate inclusion of meat and animal derived products. The WHO and ketogenic diets included the highest amount of meat product in grams, with nearly half of the ketogenic diet composed of animal derived products in both grams and kilocalories.
Meat-containing diets had the highest environmental impact, while plant-based diets had the lowest. The ketogenic diet had the highest total GHG emissions and highest emissions per gram of food, followed closely by the WHO diet (Figure 1A). Vegetarian and vegan diets resulted in the fewest GHG emissions per gram of food, with nearly half or fewer GHG emissions when compared to the meat-heavy ketogenic diet. The Paleo diet also had high GHG emissions, although not as much as ketogenic and WHO diets (Figure 1A).
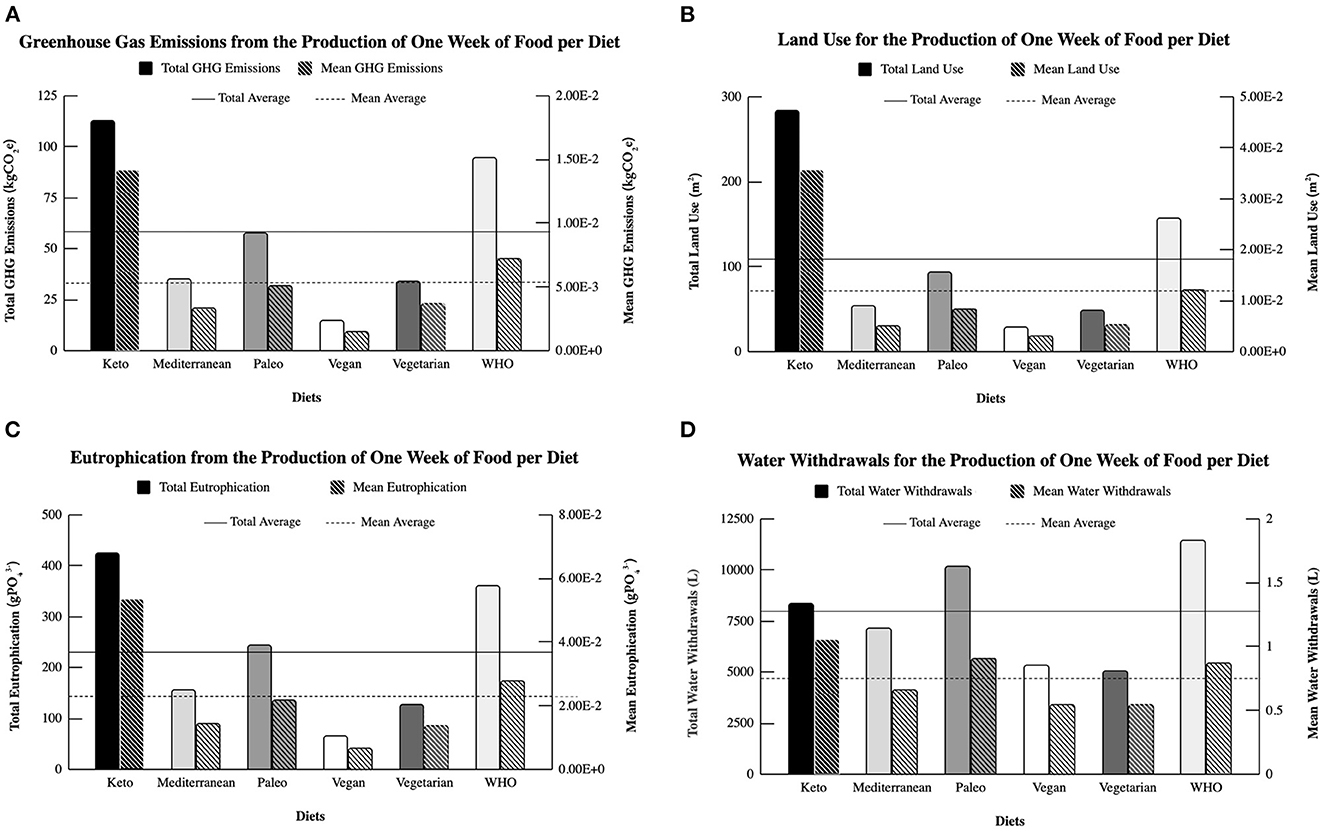
Figure 1. (A) Greenhouse gas emissions (GHG, in kilograms of carbon dioxide equivalents) calculated for each diet from a week of meals at 2,000 kilocalories/day. Total GHG emissions (left Y-axis) are calculated by summing the emissions of all food items within a diet, adjusted to each food's quantity in grams. The accompanying solid line shows the average of total emissions across all diets. Mean GHG emissions (right Y-axis) are calculated by dividing a diet's total GHG emissions by the quantity of food grams within that diet, resulting in a mean value. The accompanying dashed line shows the average of mean emissions across all diets. (B) Land use (in square meters) calculated for each diet from a week of meals at 2,000 kilocalories/day. Total land use (left Y-axis) is calculated by summing the land use of all food items within a diet, adjusted to each food's quantity in grams. The accompanying solid line shows the average of total land use across all diets. Mean land use (right Y-axis) is calculated by dividing a diet's total land use by the quantity of food grams within that diet, resulting in a mean value. The accompanying dashed line shows the average of mean land use across all diets. (C) Eutrophication (in grams of phosphate) calculated for each diet from a week of meals at 2,000 kilocalories/day. Total eutrophication (left Y-axis) is calculated by summing the eutrophication of all food items within a diet, adjusted to each food's quantity in grams. The accompanying solid line shows the average of total eutrophication across all diets. Mean eutrophication (right Y-axis) is calculated by dividing a diet's total eutrophication by the quantity of food grams within that diet, resulting in a mean value. The accompanying dashed line shows the average of mean eutrophication across all diets. (D) Water withdrawals (in liters) calculated for each diet for 1 week of meals at 2,000 kilocalories/day. Total water withdrawals (left Y-axis) are calculated by summing the water withdrawals of all food items within a diet, adjusted to each food's quantity in grams. The accompanying solid line shows the average of total water withdrawals across all diets. Mean water withdrawals (right Y-axis) are calculated by dividing a diet's total water withdrawal by the quantity of food grams within that diet, resulting in a mean value. The accompanying dashed line shows the average of mean water withdrawals across all diets.
The ketogenic diet resulted in the highest total land use per gram of food, followed by the WHO diet, while the vegan diet resulted in the lowest land use (Figure 1B). Except for the WHO diet, all diets barely reached half the land use of the ketogenic diet (Figure 1B). Vegetarian and Mediterranean diets had similar land use per gram, while the Paleo diet came closer to reaching the overall average line for total and mean values (Figure 1B).
The ketogenic diet contributed most significantly to water eutrophication, closely followed by the WHO and paleo diets, respectively, while the vegan diet contributed the least to eutrophication (Figure 1C). Although the vegetarian diet also contributed toward water eutrophication, closely following the Mediterranean diet, it still had a lesser impact than the WHO, ketogenic, and paleo diets (Figure 1C). Notably, the paleo diet's total eutrophication potential reached above the overall total average, indicating that it will not gain a sustainability point, but the mean eutrophication potential is still lower than the overall mean average; hence the distinct relative sustainability scores when comparing total values and mean values (Table 3).
For water withdrawals, the WHO and paleo diets, respectively, had the highest total water use among all diets (Figure 1D). Per gram, the ketogenic diet had higher water withdrawals, followed by the paleo and WHO diets. Vegan and vegetarian diets had similar total and mean water use, the lowest among the diets, while the Mediterranean diet stood at a mid-point between low and high use (Figure 1D).
Overall, the meat-dense diets (ketogenic diet and WHO diet) had high values for the four environmental impact indicators, while those characterized by a reduction of meat products or elimination of meat exhibited mid-level values for these indicators. The vegan diet had the lowest values across all environmental indicators (Figure 1).
The paleo diet had the highest total nutritional quality across all diets, and the vegan and Mediterranean diets followed closely; there were no strong observable patterns among the three (Figure 2). Diets that contained a diversity of food types and limited or eliminated the consumption of meat products (vegan, paleo diet, Mediterranean diet) had the highest nutritional quality (Figure 2). The ketogenic diet almost surpassed the overall total average, performing better than the previous metrics, while the vegetarian and WHO diets had lower SAIN:LIM (Figure 2).
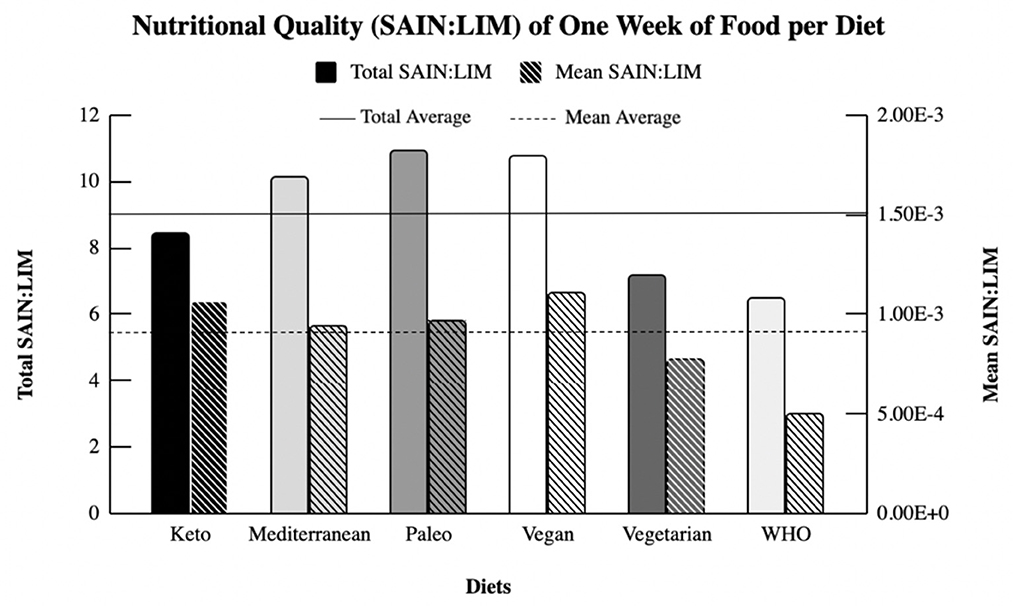
Figure 2. Nutritional quality, shown as the SAIN:LIM ratio, calculated for each diet for 1 week of meals at 2,000 kilocalories/day. Total SAIN:LIM [(Left) Y-axis] is calculated by summing the SAIN:LIM ratios of all food items within a diet, adjusted to each food's quantity in grams. The accompanying solid line shows the average of total SAIN:LIM ratios across all diets. Mean SAIN:LIM [(Right) Y-axis] is calculated by dividing a diet's total SAIN:LIM ratio by the quantity of food grams within that diet, resulting in a mean value. The accompanying dashed line shows the average of mean SAIN:LIM ratios across all diets. SAIN:LIM is a ratio composed of beneficial nutrients in a food item (protein, fiber, calcium, vitamin C, and iron) divided by its maleficial nutrients (saturated fatty acids, added sugars, and sodium) and weighted by their respective quantities.
Interestingly, the diet rankings shift when we examine nutritional quality per gram. The vegan diet has the highest SAIN:LIM per gram, followed by the keto, paleo, and Mediterranean diets, respectively (Figure 2). Diets that restrict or eliminate the intake of entire food groups (such as meat elimination in the vegan diet and carbohydrate restriction in the ketogenic diet) appear to be more nutritious per gram, although all diets had similar SAIN:LIM values (Figure 2). Vegetarian and WHO diets followed behind and had SAIN:LIM values below the overall mean average; the ketogenic diet, however, surpassed the overall mean average and gained its only point in the relative sustainability score calculated with mean values (Table 3).
The WHO diet had the highest total cost among all diets, while the vegetarian diet was the least expensive both in total cost and in cost per gram (Figure 3). Per gram, the ketogenic diet was the most expensive, closely followed by the paleo diet (Figure 3). While the ketogenic diet scored a sustainability point for total cost as it remained relatively affordable compared to the other diets, it did not score a point for its price per gram (Table 3). Inversely, the Mediterranean diet scored a point for having a price per gram lower than the overall mean average but did not score a point for having a high total price (Table 3).
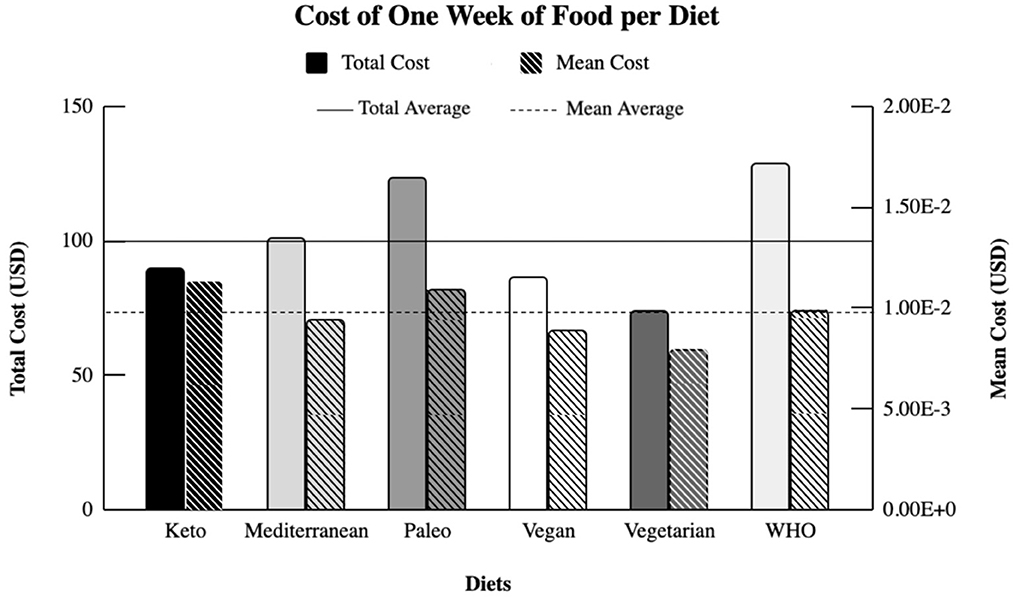
Figure 3. Cost (in US dollars) calculated for each diet for 1 week of meals at 2,000 kilocalories/day. Total cost [(Left) Y-axis] is calculated by summing the price of all food items within a diet, adjusted to each food's quantity in grams. The accompanying solid line shows the average total cost across all diets. Mean price [(Right) Y-axis] is calculated by dividing a diet's total cost by the quantity of food grams within that diet, resulting in a mean value. The accompanying dashed line shows the average mean cost across all diets. Price data was obtained from Bai et al. (2021) and provided by the World Bank's International Comparison Program (ICP) 2011.
The sustainability scores based on total values and mean values show similar results: Across all metrics, the vegan, Mediterranean, and vegetarian diets were the most representative of a sustainable diet in our model, while the paleo diet offered moderate sustainability. The ketogenic and WHO diets were the least sustainable (Table 3). Measures for each diet's environmental impact, nutrition, and affordability metrics are available (Table 4).
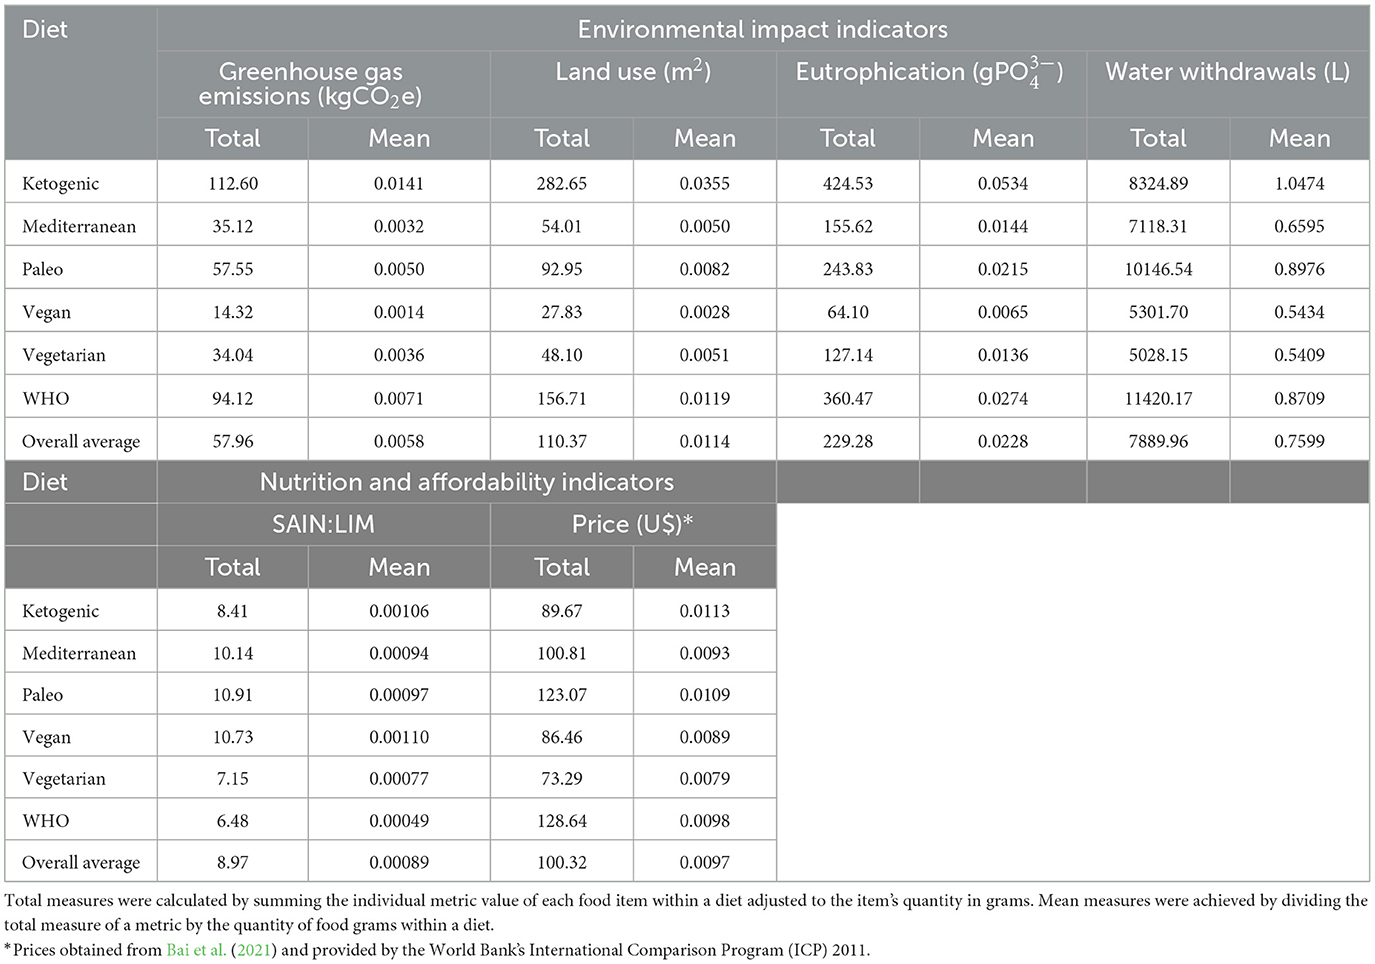
Table 4. Measures for environmental impact, nutrition, and affordability indicators for each diet calculated based on 1 week of meals at 2,000 kcal/day.
The proportion of animal derived products present in each diet, in grams, is significantly and positively correlated with GHG emissions (p = 0.002), land use (p = 0.02), and eutrophication (p = 0.002), and negatively correlated with sustainability score (p = 0.009) (Table 5). Water withdrawals, nutritional quality, and price were not significantly correlated with the total grams of animal-based products in each diet (Table 5).
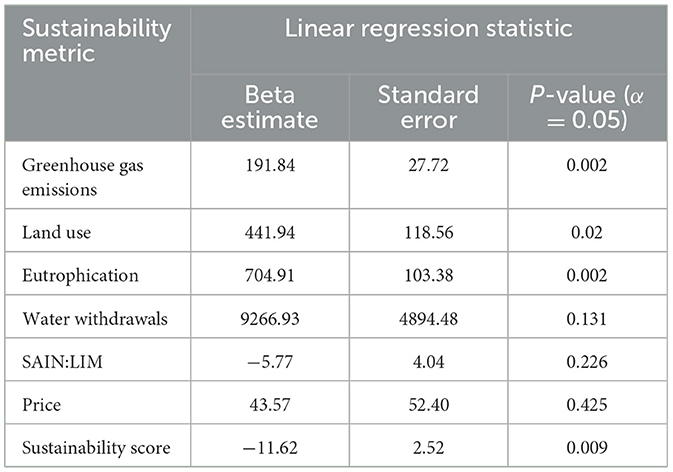
Table 5. Statistical results from a series of linear regressions using the proportion of animal derived grams for each diet calculated based on 1 week of meals at 2,000 kcal/day as the independent variable and each of the sustainability metrics and the overall sustainability score used as dependent variables.
In our model, plant-based diets (vegan and vegetarian) and plant-forward diets, which contain fewer animal products (Mediterranean) have higher relative sustainability when compared to diets that include moderate or high intake of animal products, a finding consistent with previous studies (Tilman and Clark, 2014; Lacour et al., 2018; Segovia-Siapco and Sabaté, 2019). Previous work has demonstrated that adherence to plant-based diets typically results in a smaller environmental footprint (Lacour et al., 2018). The relative sustainability score provided by our model is significantly and inversely associated with the proportion of animal-derived products within each diet: diet sustainability increases as animal-derived product consumption decreases, with vegan diets representing the most sustainable diet of those examined. The heavily meat-based ketogenic diet and the WHO diet received the lowest sustainability scores across environmental impact, nutritional quality, and affordability metrics.
In climate research, GHG emissions often serve as a strong indicator of environmental impact as these emission levels directly correlate with other environmental impact metrics, such as air acidification and freshwater eutrophication, thus impacting the environment as a whole (Röös et al., 2013). The higher GHG emissions of the ketogenic diet compared to the vegan and vegetarian diets are consistent with prior studies that report the detrimental impacts of meat production on the environment (Tichenor et al., 2017; González et al., 2020; Grosso et al., 2020). Hence, results showing higher GHG emissions for the meat-heavy ketogenic diet and the positive correlation between GHG emissions and the proportion of animal products in a diet was expected.
Interestingly, the diet based on WHO guidelines produced the second largest environmental footprint after the ketogenic diet. This finding was not entirely unexpected given that the WHO diet also involved frequent consumption of animal products (Table 2). For both the WHO diet and the ketogenic diet, animal products represented a high proportion of food consumed over a 1-week period both in grams and in kilocalories (Table 2). The high GHG emission and eutrophication levels of the WHO and ketogenic diets in our model are consistent with existing research showing that meat products and processed foods have significant effects on freshwater eutrophication due to runoff and waterway pollution (Tusseau-Vuillemin, 2001; Xue and Landis, 2010). Furthermore, the paleo diet scored a sustainability point for mean eutrophication potential, but not for total eutrophication potential. This indicates that the paleo diet, in our model, contains a few food items that contribute greatly to eutrophication levels, but on average, they are offset by other food items that constitute the majority of the meal plan and do not contribute to eutrophication potential as much. An individual following the paleo diet may find it easy enough to lower their eutrophication footprint by simply avoiding higher-contributing items.
Similarly, the finding that ketogenic and WHO diets have the highest land use is consistent with research demonstrating that meat production needs more physical space than other agricultural practices, especially when accounting for the production of livestock feed (Hallström et al., 2014; Alexandre et al., 2017). Although land use is significantly and positively correlated with meat consumption in our model, the presence of animal-derived products does not appear to be a predictor of water withdrawals, a finding supported by research showing that water productivity has greatly improved in the livestock sector (Mekonnen et al., 2019) and that some food items such as nuts, fruits, and vegetables require more water than livestock (Aleksandrowicz et al., 2016). Still, diets with higher proportions of animal products (ketogenic, WHO, and paleo diets) did not score a sustainability point for water withdrawals in our model as their total and mean values were much higher than the other diets. The vegan and vegetarian diets, for instance, use approximately half of the total water required by the WHO and paleo diets (Table 4).
Overall, our analysis was consistent with Masset et al. (2014)'s findings that animal products have the greatest environmental impact. In terms of nutrition, we initially expected the WHO diet to perform better as it is based on research that prioritizes nutritional quality (World Health Organization., 2018). Thus, it is surprising that the paleo, Mediterranean, and vegan diets had markedly higher SAIN:LIM value quality than a diet based on WHO guidelines (Figure 2). This may be a result of the relatively smaller proportion of animal-based products in these diets, but no conclusions can be inferred as there is not a statistically significant relationship between animal content and SAIN:LIM (Table 5).
Consumption of red and processed meats contribute to cardiovascular disease risk and all-cause mortality (Wolk, 2017); components of red and processed meats, such as saturated fat and sodium, are categorized as unhealthy nutrients and are captured by the SAIN:LIM ratio. Hence, the elimination of processed meats in the paleo diet and the great reduction of red meat in the Mediterranean diet, along with the elimination of both in the vegan and vegetarian diets, could at least partially explain why these diets have better nutritional quality as compared to a diet based on the WHO guidelines in our model. Animal-based products that are not meat, such as dairy, do not show the same correlation with all-cause mortality and are not associated with cardiovascular disease (Farvid et al., 2017). Additionally, these non-meat animal-products have a greater SAIN:LIM ratio due to containing fewer disqualifying nutrients, such as sodium, and higher healthy nutrients, such as calcium (Guo et al., 2017).
The ketogenic diet had interesting results: it scored a sustainability point for mean SAIN:LIM, but not for total SAIN:LIM (Table 3). This means that certain food items contained in the diet may have a rich nutritional profile, but they are not consumed in high quantities and are offset by the consumption of items that have lower SAIN:LIM ratios in this model. This is aligned with the ketogenic diet's characterization of high consumption of lean meats such as fish and chicken and non-starchy vegetables, which have higher SAIN:LIM ratios, but also of items high in saturated fat such as bacon, ham, and similar, which have lower SAIN:LIM ratios. Further analysis on the nutritional quality and physiological impact of red meat, processed meats, and meat consumption in general could provide insight into whether meat and meat products are necessary to meet nutritional requirements.
Although price was not correlated with the amount of animal-based products in our model, the total and mean results for each diet might reflect the high cost of meat when compared to grains, legumes, and other plant-based, energy-dense foods. Vegan and vegetarian diets had the lowest total price and price per gram when compared to the other diets, but not by much (Table 4). No conclusions can be inferred due to the lack of statistical significance. In terms of total cost, the WHO, paleo, and Mediterranean diets were, respectively, the most expensive, with paleo and WHO also not scoring a point for mean cost.
The ketogenic diet scored a point for its total cost, which is lower than the overall total average, likely because of its high relative proportion of calorie-dense products. This means less food, in grams, is needed to achieve 2,000 kilocalories/day. However, the cost per gram of the ketogenic diet is the highest among all diets, which means the individual food items, on average, are relatively expensive compared to the individual food items of other diets. The Mediterranean diet showed the inverse pattern: total cost was high and did not earn the diet a sustainability point, but mean cost was lower than the overall mean average (Table 3). This means that some food items present in small quantities in our model of the Mediterranean diet are expensive enough to increase the total price, but on average, the most consumed items are not as expensive.
These inconclusive results can be explained by the high price of fresh fruits and vegetables, whole grains, lean meat, and other food items considered “healthy,” which are abundant across all diets in our model except for the diets that eliminate meat (Drewnowski, 2010; Darmon and Drewnowski, 2015). Eliminating an expensive food group might have positively impacted the plant-based diet's affordability, even if the diet still includes other expensive food groups. Additionally, the relative affordability of different diets may vary by region. In some areas, meat products are cheaper relative to fresh produce, highlighting the need for region-specific analyses.
Our model provided a broad comparison of sustainability among diets but is subject to a few limitations. First, our analysis of the selected diets is limited to a 7-day period, therefore, there may be less variation in the proposed diets than would occur over a longer period of time. Second, the data we used also had limitations. Notably, the food categorization remained broad and imperfect at times, given that we only had access to larger food groups categories and not data for individual food items. For example, although olive oil and margarine are both fats derived from vegetable oils and are frequently grouped together, they might differ in nutritional quality, price, and environmental impact.
Moreover, the food prices from the 2011 ICP might have changed in subsequent years due to global supply chain pressures, climate change, the COVID-19 pandemic, war conditions in certain countries, among other conflicts impacting energy and food production (Dietrich et al., 2021; Saâdaoui et al., 2022). Still, food prices from the 2011 period were also under the influence of global conflicts, notably a worldwide recession influenced by the US crisis of 2008; therefore, major disruptions now and in the future are likely to further influence the affordability of these diets. Just as location is relevant to define the local costs of food items, the timing is also important when assessing affordability.
The evaluation of environmental impact is also limited as only four indicators were included. Although they are sufficient for our model and based on publicly available data, air acidification potential, pesticide and fertilizer use, and other metrics could be incorporated for an even more holistic measure of environmental impact. Furthermore, this model can be generalized to distinct parts of the world as it uses environmental and price data from over 170 countries, but the implications of the sustainability analyses may differ based on the peculiarities of each location.
Lastly, nutritional quality, affordability, and the four different environmental impacts were weighted equally in the calculation of sustainability scores. Therefore, environmental impacts (GHG emissions, land use, eutrophication, water withdrawals) were weighted more heavily than the other metrics (nutritional quality and affordability). It may be worth considering alternate weighting for each of the sustainability metrics to match organizational or governmental goals.
Our analysis of the relative sustainability score of six popular diets demonstrates the detrimental effect of meat consumption on the environment as well as shows that “plant-forward” diets (which emphasize plant-based foods but include modest amounts of animal-based products) are more nutritious and less expensive. Hence, consumers trying to eat sustainably across all or most sustainability dimensions should follow plant-based diets such as vegan or vegetarian, or diets with a lower proportion of animal products, such as the Mediterranean diet.
The WHO's guidelines are focused on making dietary recommendations based on the nutritional quality of foods. While nutrition is important to consider, based on our findings, the organization has neglected to adequately account for affordability or environmental impact. It may be beneficial to incorporate environmental impact and affordability along with nutritional quality when designing dietary guidelines and recommendations. The WHO and similar organizations should also provide more comprehensive recommendations by tailoring them to particular regions of the world. Although the nutritional quality of diets should remain consistent, the environmental impact measures and price will likely vary by region.
Although four different environmental sustainability measures were included, researchers looking to expand on our work could provide a more comprehensive analysis of environmental sustainability by including additional indicators, such as air acidification. Another way to expand upon our research would be to analyze different variations of the same diets included in our analysis. Diets such as the Mediterranean, vegetarian, or WHO diets are relatively flexible, and variations of a week's worth of food could significantly differ from what was recommended by the meal generator, hence yielding different results. Furthermore, because we were interested in the overall meat consumption within each diet, we did not discriminate between red meat, poultry, dairy, etc. when calculating diet proportions and correlations. A step further would be to check if there are stronger correlations depending on the category of animal product, as red meat has distinct cost and nutritional characteristics from poultry, fish, and other types of meat.
As innovative farm-to-fork food solutions become more widely available and adopted, it may be fruitful to update these analyses, taking new agricultural practices and food production, packaging, and shipping technologies into account. For example, meat production from stem cell culture is considered significantly more efficient and environmentally sustainable, limiting the required water, land, and greenhouse gas metrics as compared to traditional livestock production (Hadi and Brightwell, 2021).
The original contributions presented in the study are included in the article/Supplementary material, further inquiries can be directed to the corresponding author.
MG supervised all data collection and analysis. LY, BJ, CA, CO, RA, and JO collected dietary data and co-wrote the first draft. LY developed tables, figures, captions, collected environmental, nutritional, and financial data. BJ created and performed all statistical analyses and developed Supplementary material. LY and BJ co-wrote all future drafts and formatted the manuscript for submission. All authors contributed to conceptualization of the project idea. All authors contributed to the article and approved the submitted version.
The authors thank Tristan Vratil for advice on statistical analysis and Minerva University for funding publication costs.
The authors declare that the research was conducted in the absence of any commercial or financial relationships that could be construed as a potential conflict of interest.
All claims expressed in this article are solely those of the authors and do not necessarily represent those of their affiliated organizations, or those of the publisher, the editors and the reviewers. Any product that may be evaluated in this article, or claim that may be made by its manufacturer, is not guaranteed or endorsed by the publisher.
The Supplementary Material for this article can be found online at: https://www.frontiersin.org/articles/10.3389/fsufs.2023.1021906/full#supplementary-material
Aleksandrowicz, L., Green, R., Joy, E. J., Smith, P., and Haines, A. (2016). The impacts of dietary change on greenhouse gas emissions, land use, water use, and Health: a Systematic review. PLoS ONE 11, e0165797. doi: 10.1371/journal.pone.0165797
Alexandre, P., Brown, C., Arneth, A., Dias, C., Finnigan, J., Moran, D., et al. (2017). Could consumption of insects, cultured meat or imitation meat reduce global agricultural land use? Glob. Food Secur. 15, 22–32. doi: 10.1016/j.gfs.2017.04.001
Appavu, B., Vanatta, L., Condie, J., Kerrigan, J. F., and Jarrar, R. (2016). Ketogenic diet treatment for pediatric super-refractory status epilepticus. Seizure 41, 62–65. doi: 10.1016/j.seizure.2016.07.006
Bai, Y., Alemu, R., Block, S. A., Headey, D., and Masters, W. A. (2021). Cost and affordability of nutritious diets at retail prices: evidence from 177 countries. Food Policy 99, 101983. doi: 10.1016/j.foodpol.2020.101983
Bakaloudi, D. R., Halloran, A., Rippin, H. L., Oikonomidou, A. C., Dardavesis, T. I., Williams, J., et al. (2021). Intake and adequacy of the vegan diet. A systematic review of the evidence. Clin. Nutr. 40, 3503–3521. doi: 10.1016/j.clnu.2020.11.035
Cambeses-Franco, C., González-García, S., Feijoo, G., and Moreira, M. T. (2021). Is the Paleo diet safe for health and the environment? Sc. Total Environ. 781, 146–177. doi: 10.1016/j.scitotenv.2021.146717
Chai, B. C., van der Voort, J. R., Grofelnik, K., Eliasdottir, H. G., Klöss, I., and Perez-Cueto, F. J. A. (2019). Which diet has the least environmental impact on our planet? A systematic review of vegan, vegetarian, and omnivorous, diets. Sustainability 11, 4110. doi: 10.3390/su11154110
Clark, M., Springmann, M., Rayner, M., Scarborough, P., Hill, J., Tilman, D., et al. (2022). Estimating the environmental impacts of 57,000 food products. Proc. Natl. Acad Sci. 119, e2120584119. doi: 10.1073/pnas.2120584119
Darmon, N., and Drewnowski, A. (2015). Contribution of food prices and diet cost to socioeconomic disparities in diet quality and health: a systematic review and analysis. Nutr Rev. 73, 643–660. doi: 10.1093/nutrit/nuv027
Dietrich, S., Giuffrida, V., Martorano, B., and Schmerzeck, G. (2021). COVID-19 policy responses, mobility, and food prices. Am J Agric Econ. 104, 569–588. doi: 10.1111/ajae.12278
Drewnowski, A. (2010). The cost of US Foods as related to their nutritive value. Am. J. Clin. Nutr. 92, 1181–1188. doi: 10.3945/ajcn.2010.29300
Eat This Much. (2023). Your Personal Diet Assistant. Available online at: https://www.eatthismuch.com/ (Accessed November 30, 2018).
Estruch, R., Ros, E., Salas-Salvadó, J., Covas, M.-I., Corella, D., Arós, F., et al. (2018). Primary prevention of cardiovascular disease with a mediterranean diet supplemented with extra-virgin olive oil or nuts. N. Engl. J. Med. 378, e34. doi: 10.1056/NEJMoa1800389
Farvid, M. S., Malekshah, A. F., Pourshams, A., Poustchi, H., Sepanlou, S. G., Sharafkhah, M., et al. (2017). Dairy food intake and all-cause, cardiovascular disease, and cancer mortality: the golestan cohort study. Am. J. Epidemiol. 185, 697–711. doi: 10.1093/aje/kww139
Finicelli, M., Di Salle, A., Galderisi, U., and Peluso, G. (2022). The Mediterranean diet: an update of the clinical trials. Nutrients 14, 2956. doi: 10.3390/nu14142956
Food and Agriculture Organization of the United Nations. (2023). Sustainable Food and Agriculture. Available online at: https://www.fao.org/sustainability/en/ (accessed January 16, 2023).
Fresán, U., and Sabaté, J. (2019). Vegetarian diets: planetary health and its alignment with human health. Adv. Nutr. 10, 380–388. doi: 10.1093/advances/nmz019
Genoni, A., Lo, J., Lyons-Wall, P., Boyce, M. C., Christophersen, C. T., Bird, A., et al. (2019). A Paleolithic diet lowers resistant starch intake but does not affect serum trimethylamine-N-oxide concentrations in healthy women. Br. J. Nutr. 121, 322–329. doi: 10.1017/S000711451800329X
Gephart, J. A., Henriksson, P. J., Parker, R. W., Shepon, A., Gorospe, K. D., Bergman, K., et al. (2021). Environmental performance of blue foods. Nature 597, 360–365. doi: 10.1038/s41586-021-03889-2
González, N., Marquès, M., Nadal, M., and Domingo, J. L. (2020). Meat consumption: which are the current global risks? A review of recent (2010–2020) evidences. Food Res. Int. 137, 109341. doi: 10.1016/j.foodres.2020.109341
Grosso, G., Fresán, U., Bes-Rastrollo, M., Marventano, S., and Galvano, F. (2020). Environmental impact of dietary choices: role of the Mediterranean and other dietary patterns in an Italian cohort. Int. J. Environ. Res. Public Health 17, 1468. doi: 10.3390/ijerph17051468
Guo, J., Astrup, A., Lovegrove, J. A., Gijsbers, L., Givens, D. I., and Soedamah-Muthu, S. S. (2017). Milk and dairy consumption and risk of cardiovascular diseases and all-cause mortality: dose-response meta-analysis of prospective cohort studies. Eur. J. Epidemiol. 32, 269–287. doi: 10.1007/s10654-017-0243-1
Hadi, J., and Brightwell, G. (2021). Safety of alternative proteins: technological, environmental and regulatory aspects of cultured meat, plant-based meat, insect protein and single-cell protein. Foods 10, 1226. doi: 10.3390/foods10061226
Hallström, E., Röös, E., and Börjesson, P. (2014). Sustainable meat consumption: a quantitative analysis of nutritional intake, greenhouse gas emissions and land use from a Swedish perspective. Food Policy 47, 81–90. doi: 10.1016/j.foodpol.2014.04.002
Hamdy, O., Tasabehji, M. W., Elseaidy, T., Tomah, S., Ashrafzadeh, S., and Mottalib, A. (2018). Fat versus carbohydrate-based energy-restricted diets for weight loss in patients with type 2 diabetes. Curr. Diab. Rep. 18, 128. doi: 10.1007/s11892-018-1103-4
Harvard, T. H., Chan School of Public Health. (2023). Diet Review: Paleo Diet for Weight Loss. The Nutrition Source. Available online at: https://www.hsph.harvard.edu/nutritionsource/healthy-weight/diet-reviews/paleo-diet/#:~:text=The%20Paleo%20diet%2C%20also%20referred,low%2Dglycemic%20fruits%20and%20vegetables (accessed March 9, 2023).
Hopwood, C. J., Bleidorn, W., Schwaba, T., and Chen, S. (2020). Health, environmental, and animal rights motives for vegetarian eating. PLoS ONE 15, e0230609. doi: 10.1371/journal.pone.0230609
Jarmul, S., Liew, Z., Haines, A., and Scheelbeek, P. (2019). Climate change mitigation in food systems: the environmental and health impacts of shifting towards sustainable diets, a systematic review protocol. [version 1; peer review: 1 approved, 2 approved with reservations]. Wellcome Open Res. 4, 205. doi: 10.12688/wellcomeopenres.15618.1
Lacour, C., Seconda, L., Allès, B., Hercberg, S., Langevin, B., Pointereau, P., et al. (2018). Environmental impacts of plant-based diets: how does organic food consumption contribute to environmental sustainability? Front. Nutr. 5, 8. doi: 10.3389/fnut.2018.00008
Masset, G., Soler, L.-G., Vieux, F., and Darmon, N. (2014). Identifying sustainable foods: the relationship between environmental impact, nutritional quality, and prices of foods representative of the French diet. J. Acad. Nutr. Diet. 114, 862–869. doi: 10.1016/j.jand.2014.02.002
McSwiney, F. T., Wardrop, B., Hyde, P. N., Lafountain, R. A., Volek, J. S., and Doyle, L. (2018). Keto-adaptation enhances exercise performance and body composition responses to training in endurance athletes. Metab. Clin. Exp. 83, e1–e2. doi: 10.1016/j.metabol.2017.10.010
Mekonnen, M. M., Neale, C. M. U., Ray, C., Erickson, G. E., and Hoekstra, A. Y. (2019). Water productivity in meat and milk production in the US from 1960 to 2016. Environ. Int. 132, 105084. doi: 10.1016/j.envint.2019.105084
O'Neill, B., and Raggi, P. (2020). The ketogenic diet: pros and cons. Atherosclerosis 292, 119–126. doi: 10.1016/j.atherosclerosis.2019.11.021
Poore, J., and Nemecek, T. (2018). Reducing food's environmental impacts through producers and consumers. Science 360, 987–992. doi: 10.1126/science.aaq0216
Rabès, A., Seconda, L., Langevin, B., Allès, B., Touvier, M., Hercberg, S., et al. (2020). Greenhouse gas emissions, energy demand and land use associated with omnivorous, pesco-vegetarian, vegetarian, and vegan diets accounting for farming practices. Sust Prod. Consumpt. 22, 138–146. doi: 10.1016/j.spc.2020.02.010
Radnitz, C., Beezhold, B., and DiMatteo, J. (2015). Investigation of lifestyle choices of individuals following a vegan diet for health and ethical reasons. Appetite 90, 31–36. doi: 10.1016/j.appet.2015.02.026
Ritchie, H., Reay, D. S., and Higgins, P. (2018). The impact of global dietary guidelines on climate change. Glob. Environ. Change 49, 46–55. doi: 10.1016/j.gloenvcha.2018.02.005
Röös, E., Sundberg, C., Tidåker, P., Strid, I., and Hansson, P.-A. (2013). Can carbon footprint serve as an indicator of the environmental impact of meat production? Ecol. Indicat. 24, 573–581. doi: 10.1016/j.ecolind.2012.08.004
Saâdaoui, F., Ben Jabeur, S., and Goodell, J. W. (2022). Causality of geopolitical risk on food prices: considering the russo–ukrainian conflict. Fin. Res. Lett. 49, 103103. doi: 10.1016/j.frl.2022.103103
Segovia-Siapco, G., and Sabaté, J. (2019). Health and sustainability outcomes of vegetarian dietary patterns: a revisit of the EPIC-Oxford and the Adventist Health Study-2 cohorts. Eur. J. Clin. Nutr. 72, 60–70. doi: 10.1038/s41430-018-0310-z
Sezaki, A., Imai, T., Miyamoto, K., Kawase, F., Shirai, Y., Abe, C., et al. (2022). Association between the Mediterranean diet score and healthy life expectancy: a global comparative study. J Nutr Health Aging 26, 621–627. doi: 10.1007/s12603-022-1811-y
Tharrey, M., Maillot, M., Azaïs-Braesco, V., and Darmon, N. (2017). From the sain, lim system to the SENS algorithm: a review of a French approach of nutrient profiling. Proc. Nutr. Soc. 76, 237–246. doi: 10.1017/S0029665117000817
Thedford, K., and Raj, S. (2011). A vegetarian diet for weight management. J. Am. Diet. Assoc. 111, 816–818. doi: 10.1016/j.jada.2011.04.014
Tichenor, N. E., Peters, C. J., Norris, G. A., Thoma, G., and Griffin, T. S. (2017). Life cycle environmental consequences of grass-fed and dairy beef production systems in the Northeastern United States. J. Clean. Prod. 142, 1619–1628. doi: 10.1016/j.jclepro.2016.11.138
Tilman, D., and Clark, M. (2014). Global diets link environmental sustainability and human health. Nature 515, 518–522. doi: 10.1038/nature13959
Tusseau-Vuillemin, M. H. (2001). Do food processing industries contribute to the eutrophication of aquatic systems? Ecotoxicol. Environ. Saf. 50, 143–152. doi: 10.1006/eesa.2001.2083
Wolk, A. (2017). Potential health hazards of eating red meat. J. Intern. Med. 281, 106–122. doi: 10.1111/joim.12543
World Health Organization. (2018). Healthy Diet. Available online at: https://www.who.int/news-room/fact-sheets/detail/healthy-diet (accessed November 28, 2018).
Keywords: diets, nutrition, food cost, sustainability, greenhouse gas emissions, plant-based
Citation: Yacoub Bach L, Jana BE, Adaeze Egwatu CF, Orndorff CJ, Alanakrih R, Okoro J and Gahl MK (2023) A sustainability analysis of environmental impact, nutritional quality, and price among six popular diets. Front. Sustain. Food Syst. 7:1021906. doi: 10.3389/fsufs.2023.1021906
Received: 17 August 2022; Accepted: 02 March 2023;
Published: 23 March 2023.
Edited by:
Andrea Fongar, Alliance of Bioversity International and CIAT, ItalyReviewed by:
Beatrice Ekesa, Bioversity International, UgandaCopyright © 2023 Yacoub Bach, Jana, Adaeze Egwatu, Orndorff, Alanakrih, Okoro and Gahl. This is an open-access article distributed under the terms of the Creative Commons Attribution License (CC BY). The use, distribution or reproduction in other forums is permitted, provided the original author(s) and the copyright owner(s) are credited and that the original publication in this journal is cited, in accordance with accepted academic practice. No use, distribution or reproduction is permitted which does not comply with these terms.
*Correspondence: Lara Yacoub Bach, bGFyYXliYWNoQHVuaS5taW5lcnZhLmVkdQ==
Disclaimer: All claims expressed in this article are solely those of the authors and do not necessarily represent those of their affiliated organizations, or those of the publisher, the editors and the reviewers. Any product that may be evaluated in this article or claim that may be made by its manufacturer is not guaranteed or endorsed by the publisher.
Research integrity at Frontiers
Learn more about the work of our research integrity team to safeguard the quality of each article we publish.