 David J. Mulla
 Muhammad Tahir
 Jacob M. Jungers
94% of researchers rate our articles as excellent or good
Learn more about the work of our research integrity team to safeguard the quality of each article we publish.
Find out more
ORIGINAL RESEARCH article
Front. Sustain. Food Syst., 28 July 2023
Sec. Agroecology and Ecosystem Services
Volume 7 - 2023 | https://doi.org/10.3389/fsufs.2023.1010383
This article is part of the Research TopicContinuous Living Cover: Adaptive Strategies for Putting Regenerative Agriculture into PracticeView all 23 articles
Perennial grain crops are a potential alternative source of staple foods and animal forage that can also provide additional environmental benefits over annual crops. Intermediate wheatgrass (IWG; Thinopyrum intermedium) is a new perennial dual-use crop for grain and forage, with growing interest among stakeholders as it produces grain in a more environmentally sound manner than current annual crops. DSSAT model simulations were performed for maize and a new DSSAT model for IWG based on data collected from field studies conducted during 2013–2015 at three different locations, i.e., Lamberton, Waseca and Crookston using low (zero), medium (60–80 kg ha−1) and high fertilizer nitrogen (N) rates (120–160 kg ha−1). The DSSAT CERES-Maize and CROPGRO-PFM models used as the basis for simulating IWG were calibrated at the high N rate to predict the yield/biomass, soil water balance, and soil nitrogen balance in maize and IWG, respectively, for the medium and low N rate treatments. Model predictions for maize yield and IWG biomass (0.89 >= Nash Sutcliffe Efficiency >= 0.58), soil profile moisture (0.81 >=NSE>=0.53) ranged from very good to satisfactory for maize and the high N rate in IWG, with nearly satisfactory accuracy for IWG under the medium and zero N rates. Simulation results indicate that low, medium and high N rates produced an average IWG biomass of 7.8, 9.7, and 10.5 t ha−1, in addition to observed grain yield of 0.36, 0.49, and 0.45 t ha−1, respectively. The corresponding N rates produced 5.9, 7.9, and 8.7 t ha−1 maize yield. Soil profile moisture under IWG and maize averaged 0.25 and 0.29 m3m−3, respectively. Averaged over N rates and locations, IWG and maize had values for crop evapotranspiration (ETc) of 592 vs. 517 mm; deep percolation of 100.8 vs. 154.5 mm; and nitrate-N leaching losses of 2.6 vs. 17.9 kg ha−1, respectively. Results indicate that perennial IWG not only produced high biomass under rainfed conditions, but also reduced deep percolation by efficiently using soil profile moisture, leading to nitrate-N leaching losses six to seven times lower than for maize.
Modern societies now demand more from food systems-not only food, fuel, and fiber, but also a variety of ecosystem services. And although today’s farming practices are producing unprecedented yields, they are also contributing to ecosystem problems such as physical and chemical soil degradation, greenhouse gas emissions, and water pollution. Nitrogen leaching from fertilized annual grain crops to groundwater is a health threat for citizens of rural communities relying on well water for drinking. The Midwestern United States is among the most highly productive and intensively farmed maize (corn) production areas in the world, with associated nitrate-N (NO3-N) pollution of groundwater in Minnesota (MN). High nitrogen (N) fertilizer inputs on high organic matter soils in the rainy season result in high leaching and tile drainage losses of NO3-N, leading to groundwater pollution, surface water eutrophication and algal blooms in downstream coastal areas (Kroening and Vaughan, 2019; Christopher et al., 2021). Nitrate concentrations in 27% of 728 river and stream sampling sites of Minnesota exceeded 10 ppm during the years 2000–2010 (Minnesota Pollution Control Agency, 2013). Similarly, 40% of groundwater wells in central Minnesota during recent years had NO3-N concentrations exceeding the permissible limit of 10 ppm. Moreover, groundwater contamination trends from the last decade have remained level (Kroening and Vaughan, 2019). A study conducted for a continuous corn rotation on sandy soil in Central Minnesota during 2011–2014 showed very high in-season NO3-N concentrations averaging 30.3 and 38.0 mg L−1, and end-of-season leaching losses of 71.0 and 96 kg N ha−1 below the rooting zone, corresponding with urea N fertilizer applied at the economic optimum N rate (EONR) of 180 kg ha−1 or the agronomic optimum N rate (AONR) of 225 kg ha−1, respectively (Struffert et al., 2016). In short, the practices accompanying annual row crop agriculture bring environmental problems, which argues for diversification of Midwestern agriculture to provide improved ecosystem services (Pennington et al., 2017; Prokopy et al., 2020).
There is a pressing need to reduce NO3-N losses through improved N management and alternative perennial cropping systems. Reducing N fertilization at EONR under continuous corn rotation in Midwestern row crop agriculture causes high NO3-N leaching losses, while further reducing N rates to bring sustainability within agroecosystems causes an economic loss in terms of reduced grain yields (Struffert et al., 2016). Replacing significant acreage of Midwestern row crops with perennial grain crops is an approach that has received far less attention than fertilizer management strategies for improving ecosystem services. IWG, a perennial grass trademarked by The Land Institute as Kernza®, has multiple environmental and economic benefits (Culman et al., 2013; Jungers et al., 2019). Kernza® not only produces animal forage in spring and fall, but also benefits farmers with high-value human-edible grain yield. Additional benefits of Kernza® include providing continuous living cover on the landscape and significantly higher below-ground biomass beyond those provided by annual cropping systems (Pinto et al., 2021). Perennial crops like Kernza® have an extended growing season, resulting in higher evapotranspiration, and lower runoff and deep percolation losses during late fall and early spring, compared to the fields that are fallow under annual crops. Extended growing time also increases the assimilation of N during the time when it is susceptible to leaching (Huggins et al., 2001). Moreover, extensive rooting systems of Kernza® also result in lower NO3-N and water losses via deep percolation and surface runoff, and higher carbon sequestration, compared to the annual crops. Kernza® grown consecutively over three seasons needs only one pass of the tractor to initially plant seed, leading to reduced input expenses and reduced greenhouse gas emissions (Jungers et al., 2019; Lanker et al., 2020: Reilly et al., 2022).
IWG is a perennial cool-season forage grass and grain crop that is widely adapted throughout the USA and Canada (de Oliveira et al., 2020). Although IWG was initially implemented as a forage crop in the upper Midwest and northern Great Plains due to its winter hardiness and high forage quality, efforts were made to develop IWG into a grain crop by selecting for increased grain size and yield over the last decade (DeHaan et al., 2013). IWG can sustain high yields without replanting for numerous consecutive years, resulting in important climate mitigation benefits (de Oliveira et al., 2018). Reduced nitrate leaching compared with annual wheat (Culman et al., 2013) and maize (Jungers et al., 2019) has been observed with IWG due to its greater whole-crop N use efficiency (Sprunger et al., 2018) and water use efficiency (de Oliveira et al., 2020).
While efforts are being made to improve grain yield, seed size, threshability, shattering resistance, lodging resistance, and develop higher yielding cultivars for farmers (Zhang et al., 2017), much remains unknown about agronomic management, optimum N requirement, ETc potential, and impacts of IWG on deep percolation and NO3-N leaching losses, compared to row crops. The short-term monitoring of yield and NO3-N leaching losses over small experimental areas under highly variable climatic conditions can produce incomplete assessments, while long-term monitoring needs laborious work to collect plant parameters and soil characteristics. Under these circumstances, combining experimental measurements with modeling is a highly useful approach for understanding the relationships among soil, plants, climate change, water quality and other components in agricultural systems, particularly for studying the effects of crop diversification over time (Prokopy et al., 2020). Crop models such as Decision Support System for Agrotechnology Transfer (DSSAT) are not only useful to understand management effects on overall production, but also environmental effects of perennial crops and their management options. These models work well when calibrated with site specific data (Zamora et al., 2009).
The DSSAT model has a modular structure consisting of cropping system, weather, soil, and crop management modules. DSSAT has been tested for various climatic conditions and crop varieties. The CERES-Maize and CROPGRO-PFM (perennial forage model) modules included in DSSAT version 4.7 have the ability to predict yield and biomass production of corn and perennial grasses, respectively. However, forage crop models are still under the development stage (Jones et al., 2003; Hoogenboom et al., 2019), and have not yet been applied for simulation of IWG.
The objectives of this study were to: (1) evaluate the accuracy of using the DSSAT-CERES-Maize and DSSAT-CROPGRO-PFM model to simulate yield and/or biomass, soil water, and soil N balance of IWG vs. corn at three locations in Minnesota; and (2) evaluate how N rates across a range of climatic conditions and soil types affect crop yield/biomass productivity, soil profile moisture, deep percolation and nitrate-N leaching losses for IWG vs. maize in Minnesota.
Experimental data for DSSAT model simulations were collected at three University of Minnesota Agricultural Experiment Station sites located in three different agroecological regions of Minnesota, United States. Soil series studied include a Knoke silty clay loam (Calciaquoll) at Lamberton (44.24, −95.30), a Webster clay loam (Haplaquoll) at Waseca (44.07, −93.53), and a Wheatville loam (Calciaquoll) at Crookston (47.81, −96.62). The Lamberton, Waseca and Crookston sites are situated in southwestern, southern, and northwestern Minnesota, in the Coteau/Drier Blue Earth Till, Rolling Moraine, and Northern Till/Inter-beach Sand Bar agroecoregions, respectively. The Crookston soil is lighter textured, drier and cooler than soil at the other two sites. Weather data including net radiation, maximum and minimum temperature, precipitation, relative humidity and wind speed were obtained from the Minnesota Agricultural Experiment Station weather stations located at each site. At the start of the experiment, soil data for modeling were obtained from soil samples collected at the start of experiment and the USDA soil survey geographic database (SSURGO). We relied on SSURGO for sand, silt, and clay proportion, soil organic carbon, water content at wilting point (drained lower limit), and field capacity (drained upper limit), soil saturated hydraulic conductivity, bulk density, soil pH, cation exchange capacity, water table depth, slope, and drainage conditions. Annual rainfall at Lamberton, Waseca and Crookston from 2013 to 2015 averaged 670 ± 68 mm, 976 ± 134 mm and 479 ± 43 mm, respectively. There was high variation in rainfall amount and distribution during different years (Figure 1). Surface soils ranged in textural class from silty clay loam at Lamberton to clay loam at Waseca, to loam at Crookston (Table 1). The Lamberton and Waseca soils were moderately to poorly drained (soil hydrological group of C/D), while Crookston soil was somewhat moderately drained (soil hydrological group of B/C). All fields were relatively flat (<2% slope) and naturally drained. The Lamberton and Waseca soils had higher soil organic matter, cation exchange capacity and soil water content at −33 and −1,500 kPa, with lower soil saturated hydraulic conductivity, compared to Crookston. The bulk density of soil decreased in the order of Crookston> Lamberton> Waseca.
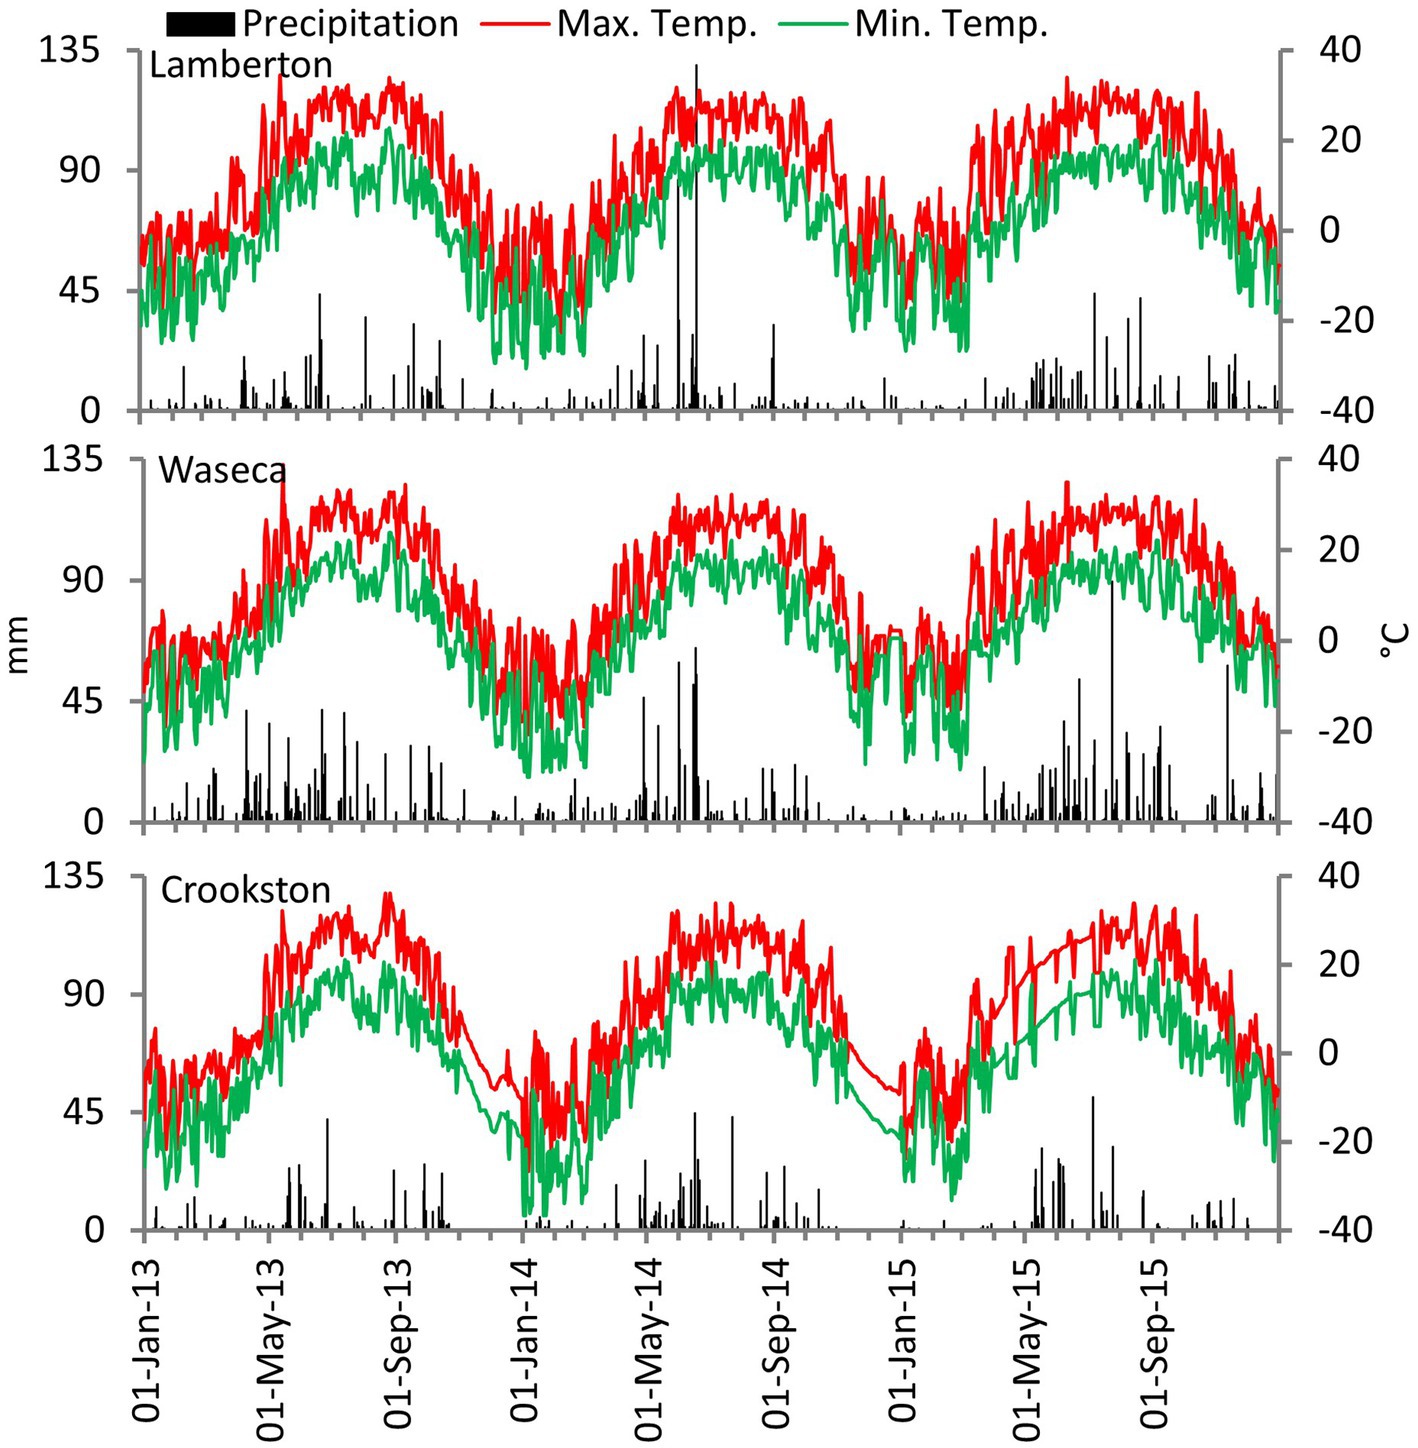
Figure 1. Daily precipitation at experimental sites located in Lamberton (top), Waseca (middle), and Crookston (lower), Minnesota from Jan. 2013 to Dec. 2015.
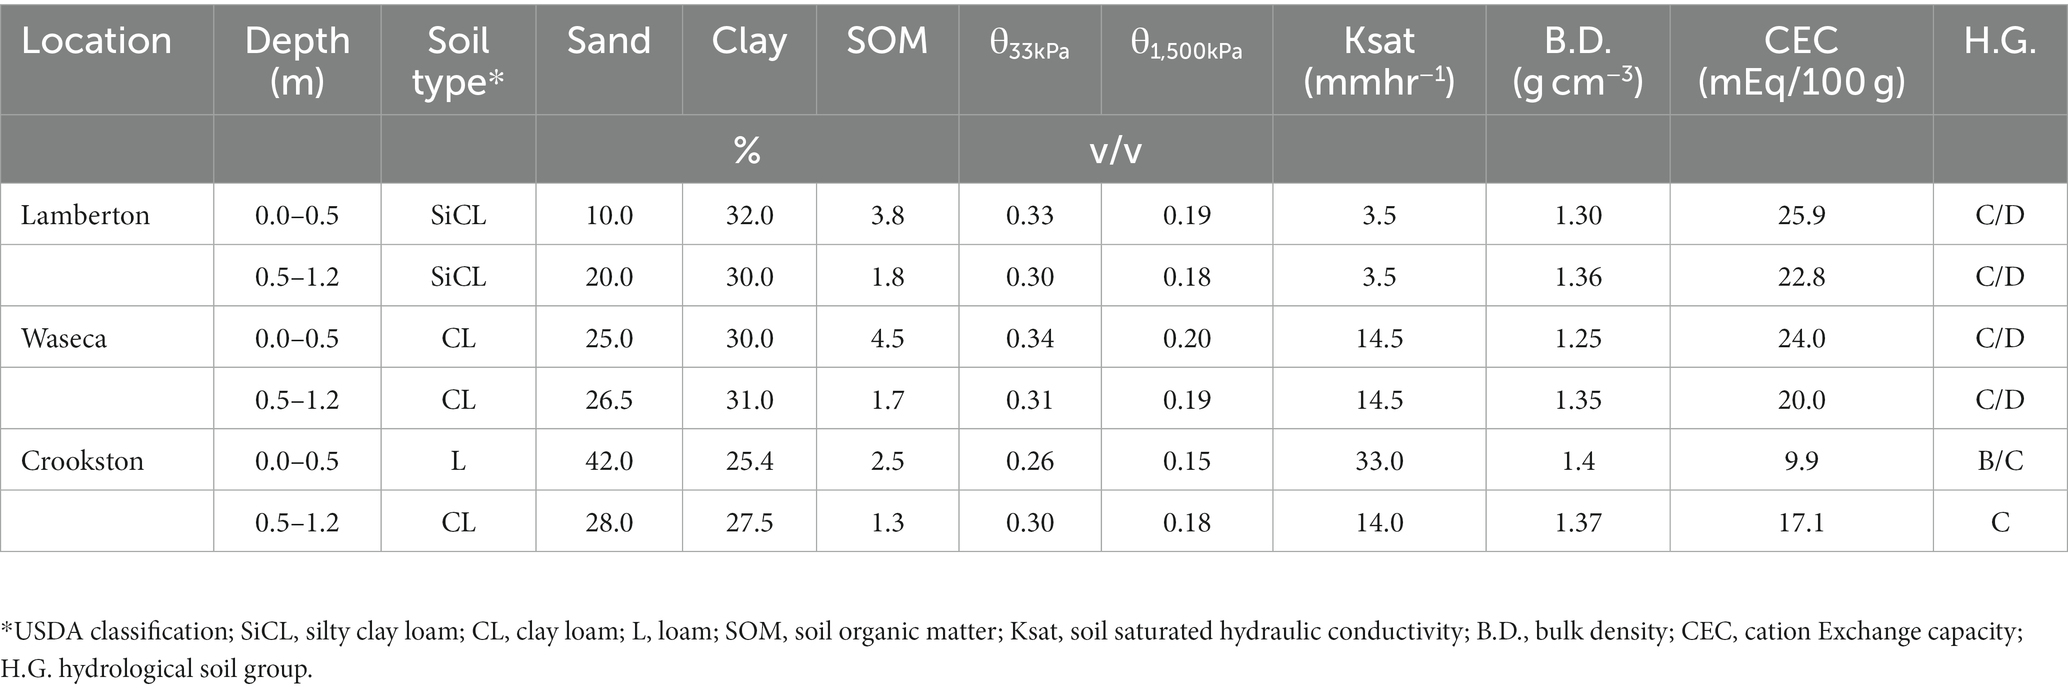
Table 1. Soil profile physico-chemical properties from three experimental field sites used as initial condition inputs for the DSSAT model calibration.
The corn and IWG experiments were initiated in 2013 using three spring-applied fertilizer N rates, i.e., low (zero), medium (80 kg N ha−1) and high (160 kg ha−1). However, during the years 2014–2015, medium and high fertilizer N rates for IWG were reduced to 60 and 120 kg ha−1, respectively. Corn received N fertilizer as pre-plant, while IWG was fertilized in late May. Both crops received N fertilizer urea as broadcast. Corn was planted in May each year at 76 cm row spacings with 86,500 seeds ha−1. IWG (variety TLI-C2) was seeded in August 2011 at Lamberton and Waseca, and in May 2012 at Crookston, at 15-cm row spacing using 18 kg seeds ha−1. Each crop was seeded in a plot size of 4.5 by 7.5 m. The preceding crop at all sites during 2012 was soybean, which received no N fertilizer. During 2012, IWG crop was mowed in the fall. IWG and corn were harvested in mid-August and during last week of September, respectively. Crop yields were estimated annually for the years 2013–2015. The grain yield of IWG was determined by cutting the IWG in a 0.5 m2 sample quadrat to a stubble height of 10 cm. Corn grain yield and biomass were obtained from a 3 m2 area. Grain yield and biomass of corn and IWG were determined after drying at 60°C for 5 days. After yield samples were collected, all remaining biomass from all crop treatments was removed. The NO3-N concentration in the soil solution at 0.50 m depth was determined by collecting soil solution samples with a suction tube lysimeter with porous ceramic cups. We used measured data for soil moisture content and soil profile NO3-N as an initial input (Supplementary Table S1). Details of the IWG field experiments are given in Jungers et al. (2017, 2019), Tautges et al. (2018), and Frahm et al. (2018). Some agronomic parameters for modeling were obtained from IWG trials conducted at Winnipeg, Canada by the Univ. of Manitoba (Cattani and Asselin, 2018) and at Saint Paul, MN (Jungers et al., 2017, 2018). Moreover, we relied on detailed un-published experimental data with replications from the Lamberton, Waseca and Crookston sites for modeling (Supplementary Table S2).
The DSSAT model comprises crop simulation models that predict growth, development and yield for over 42 crops as well as soil water and N balances. DSSAT v4.7.5 has a modular structure consisting of cropping system, weather, soil, and crop management modules. The DSSAT modules CERES-Maize and CROPGRO-PFM (perennial forage model) were used to conduct simulations for maize and IWG, respectively. The perennial CROPGRO-Forage model developed by Rymph et al. (2004) was used in this study to simulate IWG, because it includes storage organs, for a better representation of carbon and N partitioning, and consequently patterns of re-growth. It also has proven ability to predict growth and tissue N composition of perennial grass in response to daily weather, N fertilization, harvest management, and allows winter dormancy or regrowth after 100% foliage harvest or freeze damage. The model code has been improved and used in development of model parameters to allow prediction of several tropical forage crops (Pequeno et al., 2014).
Evaluation of leaching losses was caried out at each of the three sites receiving three N rates applied to corn and IWG during the spring. The DSSAT model was calibrated to assess crop yield/biomass and NO3-N leaching losses at a depth of 1.2 m. DSSAT was calibrated at each of the three sites for high (120–160 kg ha−1) N rates using 2013–2015 data to assess the yield/biomass, soil moisture content, deep percolation, and NO3-N leaching under maize and IWG crop. The model was subsequently validated for medium and low N rates applied at those three sites for the same years. DSSAT model calibration was based on: FAO-56 method for estimation of ETC; Ritchie 1-D tipping bucket method for infiltration; photosynthesis using leaf photosynthesis response curve; organic matter by Century model; hydrology by Ritchie water balance; and soil evaporation by Ritchie-Ceres method, using a modified soil profile. Due to the low slope, runoff potential of all three sites was selected as moderately low. The saturated upper limit (SUL) was considered equal to porosity, calculated from the soil bulk density. Drained upper limit (DUL) and lower limit (LL) were taken as SSURGO value of water content at field capacity, and wilting point, respectively (Table 1). DSSAT was calibrated using data from four replicates at each N rate. For corn simulation, genetic coefficients were calibrated to simulate the response of corn crop to weather and management conditions. The observed experimental data were compared with the model simulation results. The CERES-maize cultivar calibration requires the estimation of six genetic coefficients, i.e., P2 (delay in development with photoperiod above 12.5 h), P5 (thermal time from silking to physiological maturity), PHINT (phyllochron interval), P1 (thermal time from seedling emergence to the end of the juvenile growth period), G2 (maximum possible number of kernels per plant) and G3 (potential kernel growth rate). These coefficients were modified during calibration. First, the coefficients controlling phenology (P1, P2, P5, and PHINT) were modified to match anthesis and maturity dates, and leaf number. Later, the G2, and G3 parameters were adjusted to match the measured and modeled biomass and yield. At each site measured values of tillers m−2 (Supplementary Table S3) were used for site specific calibration.
To adapt CROPGRO-PFM for predicting the regrowth and yield of IWG, we followed an approach to develop the required data and cultivar traits based on: (i) genetic values and relationships reported in literature; and (ii) a comparison with observed experimental growth, biomass and NO3-N leaching losses data from IWG field experiments. Our starting point for IWG was the CROPGRO-PFM model adopted for Brachiaria brizantha (Marandu palisade grass) by Pequeno et al. (2014), included in DSSAT version 4.8 software (Hoogenboom et al., 2019). This module was applied to simulate IWG regrowth and soil water balance based on the experimental conditions for soil, weather, and crop management. As an initial input we considered optimized parameters of plant composition, phenology, and productivity from Pedreira et al. (2011) and Pequeno et al. (2014). Temperature, solar radiation, and photoperiod effects on vegetative partitioning, specific leaf area and photosynthesis were based on optimized parameters from Marandu palisade grass (Pequeno et al., 2014). Carbon and nitrogen mining parameters, and senescence parameters were also calibrated from Marandu palisade grass (Pedreira et al., 2011; Pequeno et al., 2014). Soil-water retention and hydraulic conductivity values obtained from SSURGO soil database (Table 1) were used in model calibration at each experimental location.
Evaluation of model accuracy was performed using the Nash-Sutcliffe coefficient (NSE) as well as graphical comparison of measured and simulated outputs. The NSE equation (Nash and Sutcliffe, 1970) is:
where: Si is simulated data, Oi is observed data, and Om is mean of observed data. NSE values above 0.75 and 0.5 indicate very good and satisfactory model performance, respectively (Moriasi et al., 2007).
Model calibration was limited to use of site specific soil data and optimization of key crop growth parameters. Soil texture, saturated upper limit (SUL), drained upper limit (DUL), lower limit (LL), soil organic matter, bulk density, and soil saturated hydraulic conductivity (Ksat) values at each site obtained from SSURGO soil databases for the 0–0.5 m and 0.5–1.2 m depths (Table 1) were important for accurate calibration of soil profile moisture and deep percolation losses. The values of SUL were 0.51, 0.53, and 0.47 m3 m−3 for 0–0.5 m depth, and 0.49, 0.49, and 0.48 m3 m−3 for 0.5–1.0 m depth for Lamberton, Waseca and Crookston, respectively. The DUL values of the respective sites were 0.33, 0.34, and 0.26 m3 m−3 for 0–0.5 m depth, and 0.30, 0.31, and 0.30 m3 m−3 for 0.5–1.2 m depth. Ksat values at 0–0.5 and 0.5–1.2 m depths for Lamberton (3.5 mm hr−1) were lower than at Waseca (14.5 mm hr−1). Crookston had higher Ksat values at the 0–0.5 m depth (33.0 mm hr−1), compared to the 0.5–1.2 m depth (14.0 mm hr−1). The LL values for the 0–0.5 m and 0.5–1.2 m depths were 0.19 and 0.18 m3 m−3, 0.20 and 0.19 m3 m−3, and 015 and 0.18 m3 m−3 at Lamberton, Waseca, and Crookston, respectively. Corn yield was optimized using maize cultivar coefficient values of: P1 = 220; P2 = 0.75; P5 = 850; G2 = 730; G3 = 9.6; and PHINT = 36.0. The IWG optimized parameters included slight adjustment of DSSAT parameter values related to crop cultivar., eco file (Supplementary Table S4), and species file (Supplementary Tables S5–S8), related to plant composition, phenology, and productivity; temperature, solar radiation and photoperiod effects on vegetative partitioning, root growth, specific leaf area, and photosynthesis; carbon and nitrogen mining; and senescence parameter. Moreover, IWG crop simulation relied on crop management and measured parameters (Supplementary Tables S2, S3) and on initial estimates for soil moisture, soil NO3-N, soil slope, and water table depth.
DSSAT model accuracy in simulating grain yield of corn, and above ground biomass of IWG, soil profile moisture, deep percolation and NO3-N leaching losses across a range in fertilizer N rates and crop type at three Minnesota experimental sites is summarized in Table 2. The overall ability of model to estimate the corn yield and IWG biomass at harvest was very good for calibration (NSE, 0.86 and 0.89) and satisfactory (NSE, ≥0.58 and ≥0.65) for the validation treatments. NSE values indicate that DSSAT model performance during calibration and validation was good for estimating soil profile moisture under corn and IWG at all locations and N rates (NSE, >0.64), except for satisfactory performance (NSE = 0.53) for IWG receiving no N fertilizer. NO3-N leaching loss estimates by DSSAT had lower values of NSE, compared to other model output estimates. NO3-N leaching loss estimates by DSSAT for calibration under corn and IWG (NSE values ranging between 0.76 and 0.63) were very good and satisfactory, respectively. During validation, NSE values for NO3-N leaching losses under corn (0.61–0.51) were satisfactory, while NSE values (0.47–0.43) for IWG showed close to acceptable accuracy at the medium and low N rates.
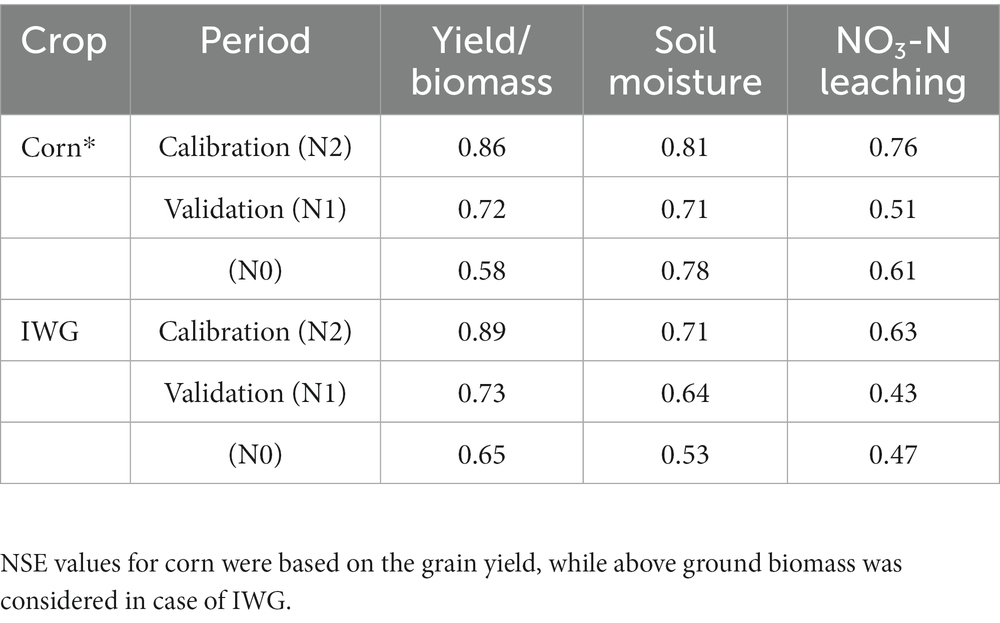
Table 2. Model performance (NSE values) for corn and IWG during calibration and validation.
Simulated corn and IWG grain yield were affected by N rates and experimental site location (Table 3). Grain yield at the low N fertilizer rate averaged 5.25, 6.04, and 5.05 t ha−1 for corn, and 0.37, 0.27, and 0.44 t ha−1 for IWG at Lamberton, Waseca and Crookston, respectively. Relative to the low N fertilizer rate, corn yield at Lamberton, Waseca and Crookston increased by 31.8, 43.5, and 37.2% with medium N rates; while an increase of 60.4, 57.6, and 59.2% was observed with high N rates, respectively. Relative to low N fertilizer rates, IWG grain yield at Lamberton and Waseca increased by 40.5 and 55.6% in response to medium N fertilizer, while high rates caused a reduction in yield. However, IWG grain yield increased by 18.2 and 23.1% with the application of medium and high N fertilizer rates, respectively, compared to no fertilizer application. IWG biomass response to medium and high N rates was lower compared to corn stover biomass at all three Minnesota locations. At the low N rate, IWG produced 7.81, 7.11 and 8.51 t ha−1 biomass at Lamberton, Waseca and Crookston, respectively. Applying medium N rates increased IWG biomass by 26.4, 30.2, and 17.7%, while a further increase of 6.1, 7.0, and 12.0% was observed at high N rates, compared to low N rates. Corn stover biomass with low fertilizer N rates averaged 5.71, 6.49, and 5.54 t ha−1, at Lamberton, Waseca, and Crookston, respectively. Application of medium and high N rates increased the stover biomass at these sites by 36.1 and 48.5%, 36.4 and 49.0%, and 30.0 and 44.6%, respectively. The Waseca site had relatively higher corn yield and stover biomass across different N rates, compared to the Lamberton and Crookston sites, respectively. IWG grain yield and above ground biomass at Waseca, however, were lower across all N rates, compared to the Lamberton and Crookston sites, respectively.
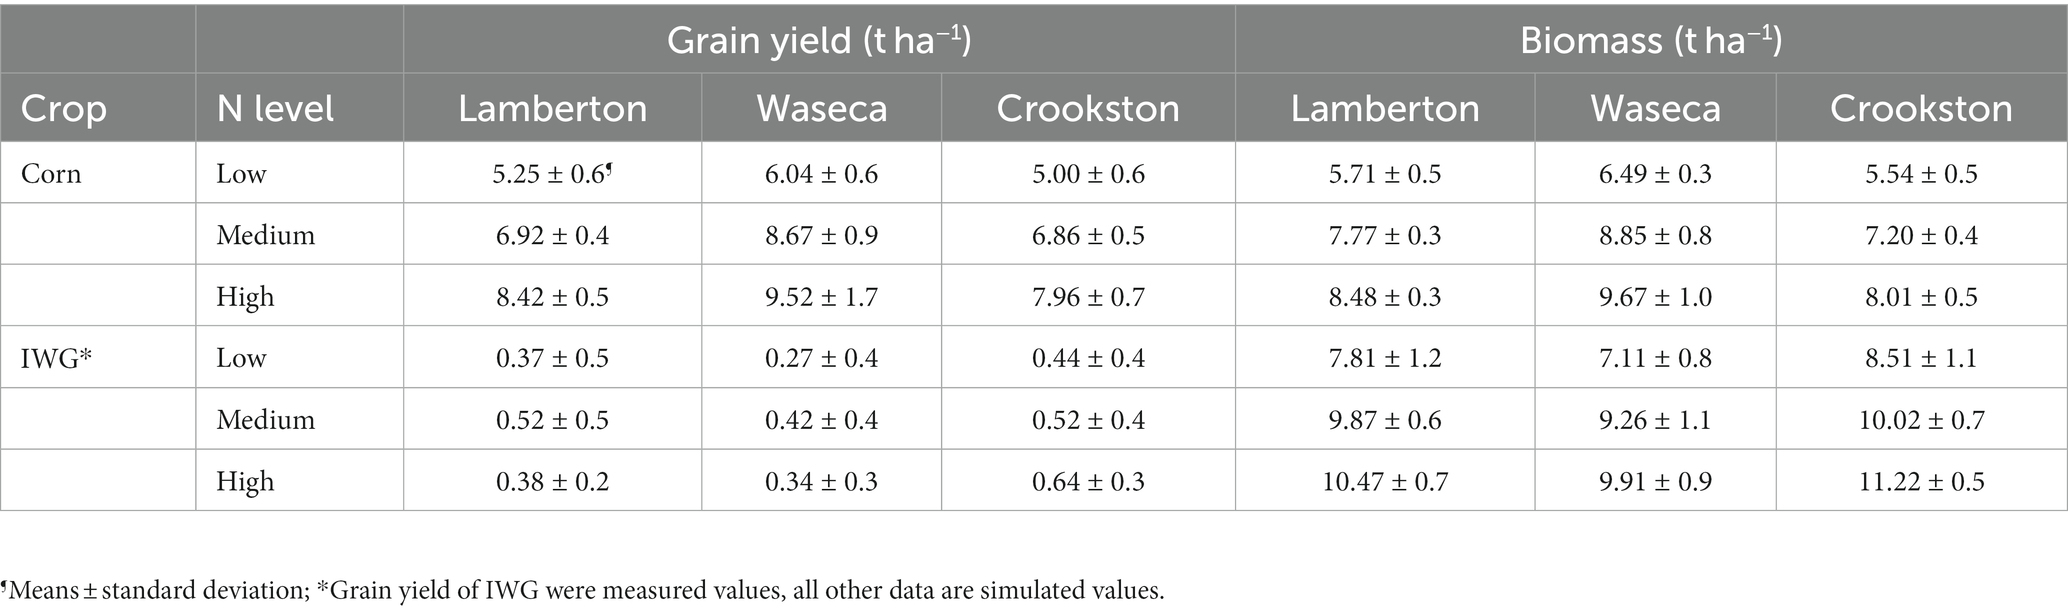
Table 3. Grain and biomass of corn and IWG at different N rates applied at three experimental sites.
ETc values were affected by the type of crop, N rates, as well as spatio-temporal variations in the soil and climatic conditions across experimental locations (Figure 2). Annual ETc of the perennial IWG was greater on average than the annual ETc of corn at all three sites. Averaged across all sites, three-year annual ETc in Low N receiving corn and IWG averaged 504.4 ± 59.3 mm and 573.2 ± 73.8 mm. The application of N fertilizer to corn and IWG increased ETc by 6.6 and 3.9% at medium N rates, and by 8.7 and 5.6% at high N rates, respectively. Across all N rates, corn averaged 527.7 ± 25.5, 582.0 ± 24.3, and 442.4 ± 20.2 mm in annual ETc at Lamberton, Waseca and Crookston, respectively. IWG at the respective sites averaged 15.8, 13.6 and 13.8% higher ETc, compared to corn. Temporal variations in ETc were also observed at all three sites. Averaged across N rates, ETc under corn and IWG was as low as 432.2 and 481.9 mm at Crookston during the year 2013, and as high as 597.0 and 680.6 mm at Waseca during the year 2015, respectively. These two sites during the years 2013 and 2015 received 443 mm and 937 mm annual precipitation.
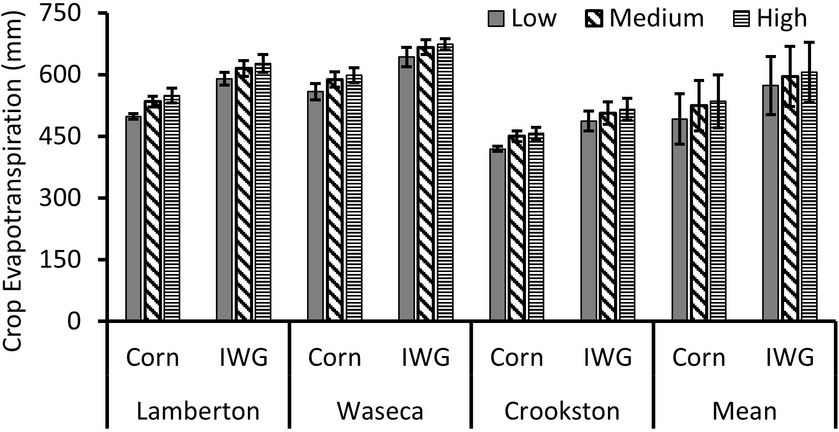
Figure 2. Annual predicted ETc at three Minnesota experimental sites for low, medium and high N fertilizer application rates from Jan. 2013 to Dec. 2015.
Planting perennial instead of annual crops and application of optimum N fertilizer caused a marked reduction in deep percolation losses, though high temporal and spatial effects were observed under both cropping systems (Figure 3). Averaged across all N rates, corn at Lamberton, Waseca and Crookston had 168.6 ± 38.3 mm, 228.1 ± 42.4 mm, and 67.0 ± 18.2 mm of annual deep percolation at a 1.2 m depth, respectively. Regardless of N fertilizer rates, planting perennial IWG reduced deep percolation by 34.7% relative to corn, with a 33.9, 32.2, and 45.7% reduction observed at Lamberton, Waseca and Crookston, respectively. Averaged across all sites, deep percolation under high N rates for corn and IWG averaged 145.0 ± 74.4 mm and 95.3 ± 58.1 mm. Annual deep percolation under corn and IWG across years ranged from 121.3–206.6 mm and 68.1–146.5 mm at Lamberton; 196.0–280.1 mm and 133.2–194.0 mm at Waseca; and 55.5–89.2 mm and 29.8–44.7 mm at Crookston, respectively.
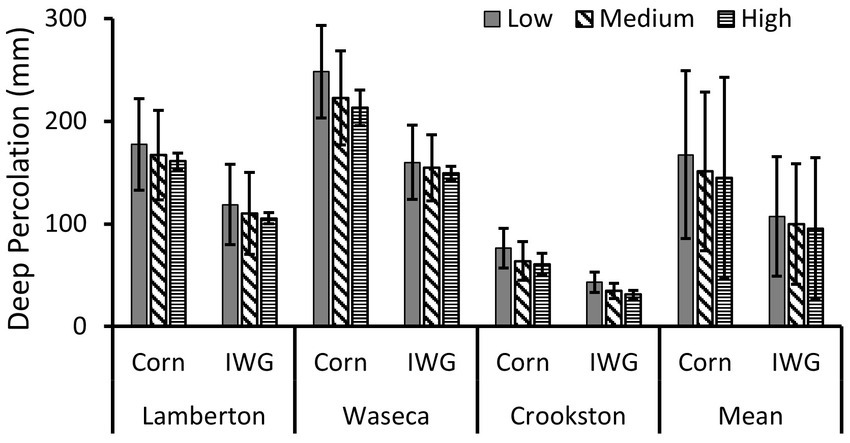
Figure 3. Annual predicted deep percolation at a depth of 1.2 m for three experimental sites receiving low, medium or high N fertilizer application rates in Minnesota from Jan. 2013 to Dec. 2015.
Annual NO3-N leaching losses were substantially reduced by planting perennial IWG, compared to the annual cropping system (Figure 4). In general, IWG resulted in 6–7 times lower annual NO3-N leaching losses, compared to leaching losses observed under corn. Across all N rates during 3 years, corn averaged 17.9 kg ha−1 in NO3-N leaching losses against 2.6 kg ha−1 under IWG. NO3-N leaching losses were also reduced remarkably as N fertilizer rates decreased. Annual NO3-N leaching losses in corn receiving low N averaged 11.3 ± 3.2, 14.3 ± 5.6, and 5.4 ± 2.2 kg ha−1 at Lamberton, Waseca and Crookston, respectively, while nitrate-N leaching losses under IWG averaged only 1.6 ± 0.2, 2.3 ± 0.9, and 0.8 ± 0.2 kg ha−1, respectively. Averaged across all sites, application of N fertilizer at medium rates increased NO3-N leaching losses under corn and IWG relative to a control with no fertilizer by 64.3 and 80.6%, respectively, while increasing N fertilizer to high rates further increased the NO3-N leaching losses under respective crops by 48.3 and 46.2%. Climatic variability across years caused high temporal variations in nitrate-N leaching. NO3-N leaching losses during 2013, 2014, and 2015 averaged 13.1 ± 8.3, 18.9 ± 9.3, and 21.9 ± 16.1 kg ha−1 under corn, and 2.1 ± 1.1, 2.6 ± 1.3, and 3.1 ± 2.1 kg ha−1 under IWG, respectively. Under corn, the highest NO3-N leaching losses (52.2 kg ha−1) were observed with high N rates at Waseca during 2015, while the lowest leaching losses (3.45 kg ha−1) were observed at Crookston with low N rates during 2013. Nitrate-N leaching losses for IWG during the corresponding years at these sites had maximum and minimum values of 7.0 kg ha−1 and 0.63 kg ha−1, respectively.
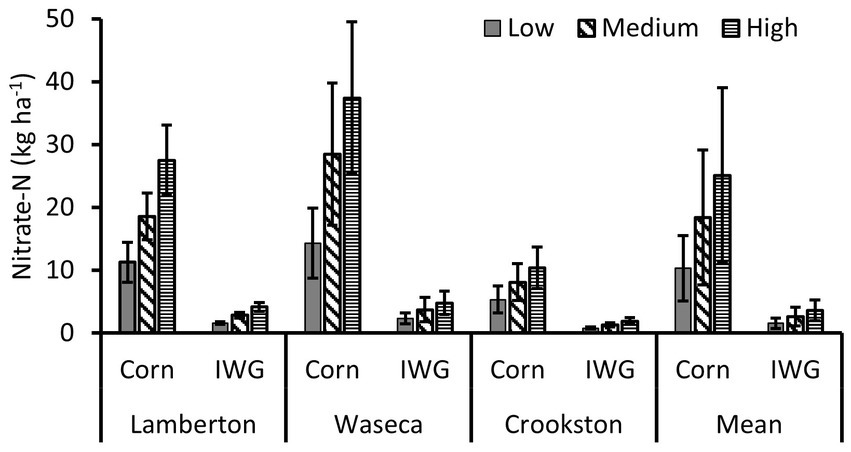
Figure 4. Annual predicted nitrate-N leaching at three Minnesota experimental sites receiving low, medium or high N fertilizer application rates from Jan. 2013 to Dec. 2015.
Soil profile moisture was affected by cropping system, with high spatio-temporal variations observed for Lamberton, Waseca and Crookston sites (Figure 5). Field observations as well as DSSAT modeling indicate that IWG resulted in consistently lower soil moisture, compared to corn. During the months of April and early-May, and in October–November, the presence of perennial IWG averaged substantially lower soil moisture, compared to soil in corn plots. DSSAT simulations of three-year (April–November) soil profile moisture at Lamberton, Waseca and Crookston under corn and IWG averaged 0.27 vs. 0.23 m3/m3, 0.34 vs. 0.29 m3/m3 and 0.26 vs. 0.22 m3/m3, respectively. Soil moisture was on average much higher at Waseca, compared to Lamberton and Crookston. Regardless of N fertilizer rates, soil profile moisture in corn plots during 2013, 2014, and 2015 averaged 0.26, 0.27, 0.29 m3/m3 at Lamberton; 0.33, 0.32, and 0.36 m3/m3 at Waseca; and 0.25, 0.27, and 0.27 m3/m3 at Crookston, respectively. IWG in 2013, 2014 and 2015 had an average soil profile moisture of 0.22, 0.22, and 0.24 m3/m3 at Lamberton; 0.29, 0.26, and 0.30 m3/m3 at Waseca; and 0.21, 0.23, and 0.22 m3/m3 at Crookston, respectively. Overall, there was a good correlation between the measured and simulated soil moisture contents, except for some cases where DSSAT over- predicted soil moisture under IWG.
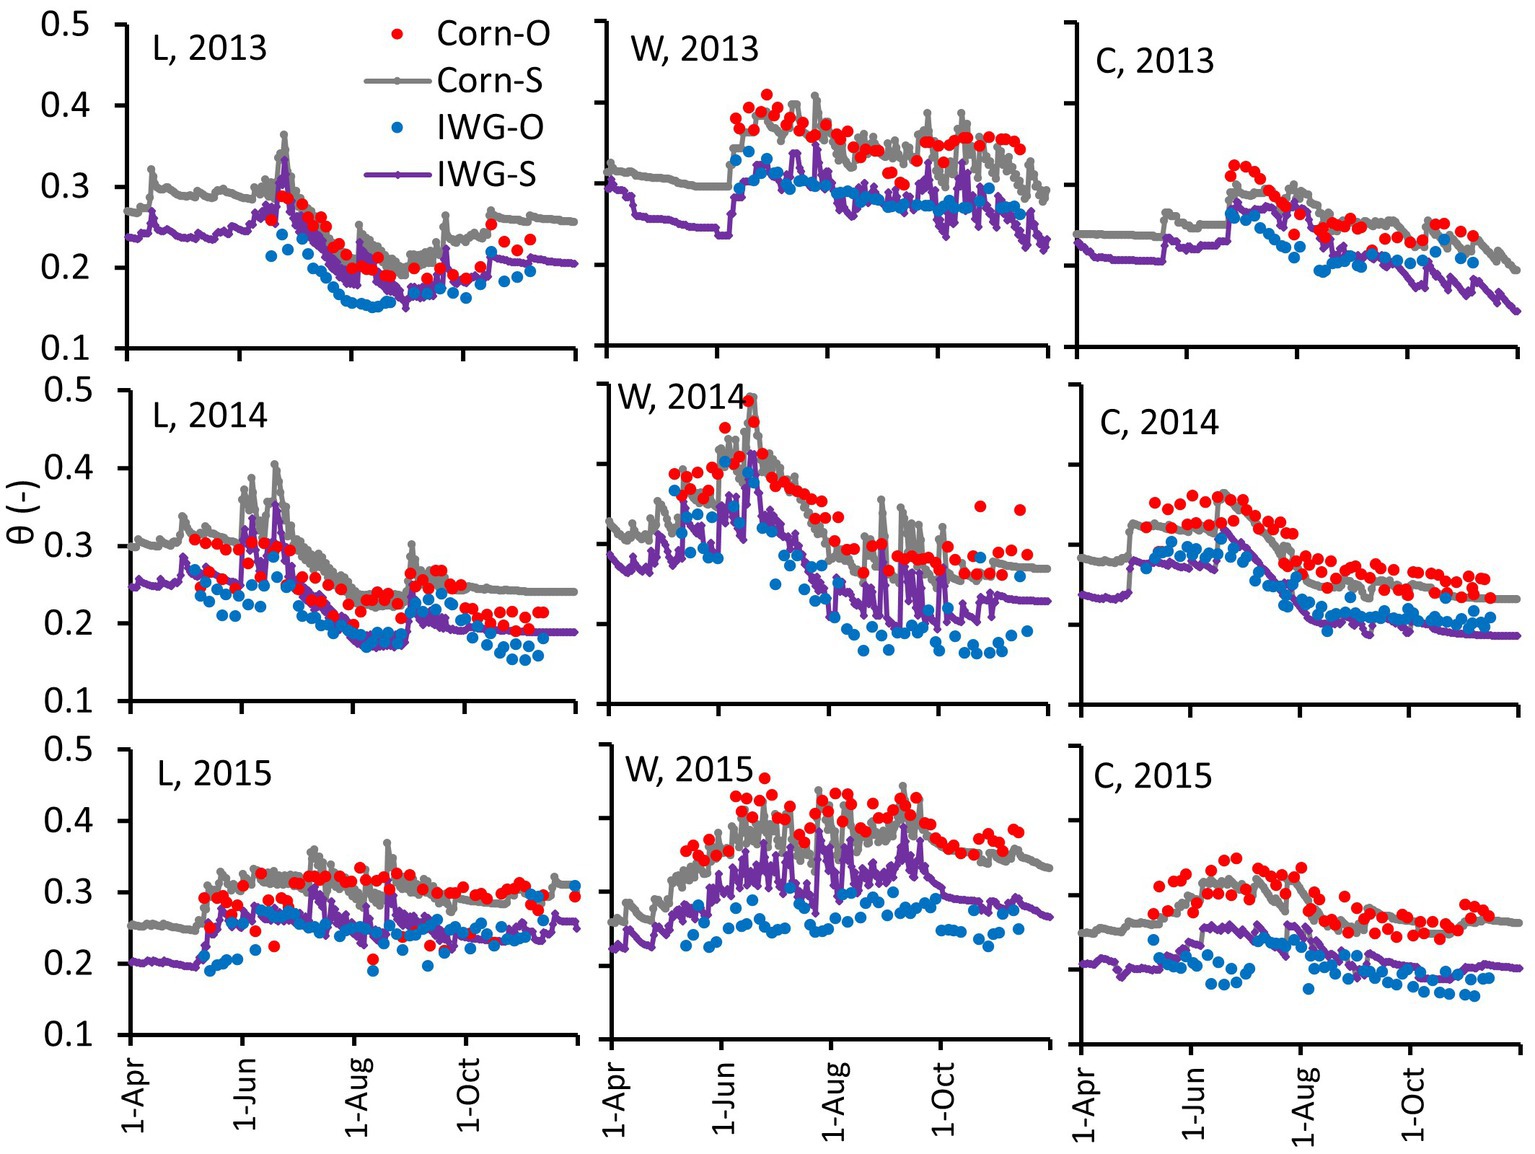
Figure 5. Field observed (O) and DSSAT estimated soil profile (1.2 m depth) moisture at Lamberton (L), Waseca (W), and Crookston (C) under corn and IWG from Apr. 1 to Nov. 30 of 2013 (top row), 2014 (middle row) and 2015 (bottom row).
We calibrated the DSSAT model for estimation of grain yield and stover biomass of corn, and above-ground biomass of IWG, as well as for soil profile moisture before proceeding to assess deep percolation losses and then NO3-N leaching losses. The model was very good to satisfactory in estimating corn grain yield, corn and IWG biomass, and soil moisture under both crops. Generally good to satisfactory performance of the model was observed for estimating NO3-N leaching losses under corn, and IWG crops, respectively. Large variations were observed for soil solution NO3-N concentration measurements, compared to the variations in measured soil moisture. High variability in measured data contribute the lower NSE values associated with nitrate-N leaching in IWG receiving no N fertilizer (Jungers et al., 2019).
The DSSAT model has previously been used to simulate perennial grasses such as Brachiaria brizantha (Marandu palisade grass) by Pequeno et al. (2014), bermudagrass (Cynodon spp.) by Pequeno et al. (2017), and alfalfa (Medicao sativa L.) by Malik et al. (2018). However, this is first attempt to simulate IWG biomass using the DSSAT model. IWG is a relatively new crop with large genetic diversity, and much is still unknown about its adaptability to large variations of climatic and soil conditions. This makes it challenging to calibrate the model for IWG yield as optimized IWG crop parameters are not available for a wide range in soil types and climatic conditions. More detailed studies of IWG are needed in future to improve model performance, particularly for grain yield and nitrate-N leaching. Nevertheless, model performance for IWG biomass was comparable to accuracy of DSSAT estimates for corn yield.
Increasing N fertilizer application from low to medium rates increased IWG grain yield and biomass by 40.5 and 26.4% at Lamberton, and 55.6 and 30.2% at Waseca, respectively. However, further increasing the N fertilizer to high rates at these sites caused a decline in grain yield and only caused a slight increase in IWG biomass. However, a low, but gradual increase of 18.2 and 23.1% in grain yield and 17.7 and 12.0% in biomass was observed at Crookston. IWG is vulnerable to substantial lodging at high N rates (Jungers et al., 2017). Additionally, higher precipitation at Lamberton and Waseca sites might have caused an increase in lodging, and decreases in grain yield, compared to Crookston. In contrast, corn responded strongly to increasing N fertilizer levels. At medium and high N rates, corn yield increased by 36.5 and 16.4%, and biomass by 36.9 and 12.0%, respectively. Previous findings by Jungers et al. (2017) showed that agronomically optimum N rates for maximizing IWG grain yield ranged from 61–96.4 kg N ha−1. However, corn has much higher N requirements. Kaiser et al. (2016) issued N fertilizer guidelines for rainfed continuous corn, indicating that the maximum return to N value (MRTN at 0.05 N price to crop value ratio) for Minnesota corn is 202 kg ha−1, with an acceptable range of 179–224 kg ha−1. Corn yield decreased across locations in the order Waseca>Lamberton>Crookston. This pattern followed the same trends across sites in soil organic matter (Table 1) and precipitation (Figure 1). The higher availability of N by mineralization from organic matter rich soil might have resulted in higher yield of corn. IWG yield and biomass, unlike corn yield and biomass, were not correlated to trends in organic matter or precipitation across sites. The Waseca site with highest organic matter did not show the maximum IWG biomass. The lower yield and biomass of IWG at Waseca was due to lower plant populations (Supplementary Table S3). IWG simulated yield and biomass were similar to values previously reported in Minnesota (Jungers et al., 2017).
IWG showed higher annual DSSAT predicted ETc than for corn at all locations (Figure 2). Annual ETc for corn and IWG averaged 492.3 and 573.7 mm under low N fertilizer, and 535.2 and 605.8 mm under high N rates, respectively. Jungers et al. (2019) estimated no differences in seasonal ETc under both crops with the Denitrification and Decomposition (DNDC) model, however, their data covered only the months between May–October. DSSAT model simulations in the present study, however, were based on annual ETc estimates. Across all years and N rates, IWG averaged a 14.4% (74.5 mm) increase in annual ETc, compared to corn. IWG is a C3 crop that starts growth and transpiration in early spring, compared to C4 corn, which is planted in early May. Thus, higher ETc by IWG during early spring should be considered while making comparisons between the annual and perennials. Application of N fertilizer at medium and high N rates increased crop evapotranspiration under both crops, compared to low N rates. Results indicate that water use efficiency increased with application of N both under corn and perennial IWG at all locations. Previous findings also indicate that water use efficiency of corn and perennial grasses including IWG increased with increasing fertilizer N rates (Ferchaud et al., 2015; Jungers et al., 2019). ETc was highly variable across different locations, mainly because of precipitation. Waseca and Crookston sites showed highest and lowest ETc under both crops, respectively. Moreover, annual average maximum and minimum temperatures at Crookston were 1.83°C and 2.26°C lower than at Lamberton, and 1.71°C and 3.17°C lower than at Waseca, respectively. Cooler weather at Crookston in northwestern Minnesota also contributed to lower ETc than at southern (Waseca) or southwestern Minnesota (Lamberton) locations.
Increases in biomass at higher N rates resulted in higher ETc, and thus was associated with small reductions in deep percolation losses at all sites (Figure 3). However, this reduction in percolation at higher N rates did not cause reductions in NO3-N leaching losses (Figure 4). This suggests that the increase in NO3-N leaching losses with higher N fertilizer rates in maize and IWG were largely driven by the soil solution N concentrations, and that IWG has much lower NO3-N concentrations and NO3-N leaching losses compared to other crops under similar soil and climate conditions (Jungers et al., 2019). Moreover, most NO3-N leaching losses under IWG occurred before or after the active growing season (Supplementary Figures S1, S2). Though decreases in deep percolation for IWG at higher N rates may not be desirable in arid regions where groundwater recharge is important, it does result in more water being available for IWG uptake. Thus, higher production of IWG biomass was observed at Crookston under lower precipitation, compared to Waseca, which received the highest rainfall. Although reducing N fertilization to corn decreased NO3-N leaching, there was an economic loss in the form of reduced grain yields, which would not generally be acceptable for farmers. However, substituting corn with IWG produced both high biomass as well as reasonable grain production. NO3-N leaching under IWG was remarkably low even at higher N fertilizer rates. IWG showed 34.7% lower deep percolation compared to corn (154.5 mm vs. 100.8 mm), however, NO3-N leaching losses for IWG averaged across sites were 6–7 times lower than was observed for corn. This also implies that IWG may have much higher nitrogen use efficiency than corn under these soil and climatic conditions. Previously, higher N use efficiency in IWG has been observed compared to annual wheat and corn (Sprunger et al., 2018; Jungers et al., 2019), respectively. Increased N concentration in IWG aboveground biomass with 60–80 kg N ha−1 fertilizer, compared to unfertilized IWG indicates that N fertilization in IWG increases N use efficiency (Tautges et al., 2018). Thus, reduced deep percolation and NO3-N leaching losses by IWG was caused by higher water and N use efficiency of IWG, compared to annual crops.
IWG may have higher water, and N use efficiency compared to corn due to a variety of reasons. Corn is a C4 crop and initiates growth and transpiration later in the spring compared to IWG, a C3 crop. Thus, corn could have lower water use efficiency and N fertilizer uptake in the spring, resulting in larger NO3-N leaching losses with percolating water. Compared to corn, perennial IWG has an extended growing season, which requires assimilation of soil available N during times when it is susceptible to leaching and annual crops are absent from the landscape. In particular, the absence of corn during the early spring, when precipitation is abundant, causes higher deep percolation and NO3-N leaching losses, compared to percolation and leaching losses when IWG is present. At Lamberton, Waseca and Crookston, 22.6, 23.8, and 26.7% of annual precipitation occurred during the months of April and May when an annual crop was either absent from the field or at an early growth stage, resulting in limited water and N uptake by corn. IWG is a deep-rooted cool-season grass with an extensive rooting system and has the capacity of capturing more water from deeper soil layers than annual crops. Ferchaud et al. (2015) indicated that higher rooting density and rooting depth are important factors, along with a prolonged period for increased water uptake of perennials, compared to annual crops. In Kansas, United States, de Oliveira et al. (2018) demonstrated the ability of IWG in maintaining a relatively high water-use efficiency throughout the whole growing season and having higher ETc, compared to annual crops. Likewise, higher root biomass and distribution of that biomass to deeper depths by perennial grasses than annuals, can improve N utilization by perennials and limit NO3-N leaching losses (Jungers et al., 2019). Estimates using the DNDC model (Jungers et al., 2019) showed lower deep percolation and NO3-N leaching losses than estimates in the present study using DSSAT. However, they simulated only the growing season from May–October, while April received abundant precipitation at all sites.
As these sites were under rainfed conditions, deep percolation and NO3-N leaching losses in corn and IWG were correlated to precipitation amount and distribution. The reduction in precipitation from 814 mm to 479 mm from southern to northwestern Minnesota reduced deep percolation and NO3-N leaching by 3.2 and 3.9 times under corn, and by 3.1 and 2.7 times under IWG, respectively. Similarly, Lamberton results in southwestern Minnesota showed high NO3-N leaching losses. Results indicate that better N management is required for corn in southern and southwestern Minnesota under rainfed conditions, and that IWG would be a better option than N fertilizer management in corn for substantially reducing NO3-N leaching losses, in addition to the benefit of producing IWG grain yield and biomass for animal feed.
Soil profile moisture (1.2 m depth) was higher under corn than IWG throughout the growing period, as indicated by model simulation as well as measured data (Figure 5). Perennial grasses have higher root biomass that extend to deeper soil layers than annual crops. Thus, water uptake capacity from the soil, especially in the deep layers is greater under perennials like IWG, compared to annual crops like maize (Ferchaud et al., 2015). Although Jungers et al. (2019) indicated that soil moisture in the upper 50 cm depth was statistically similar under IWG and corn with different N rates, experimental soil moisture data for IWG showed consistently less soil moisture than for corn. Within the crops, high spatiotemporal variations were observed in soil moisture. The three Minnesota sites studied showed large differences in soil moisture. Regardless of temporal variations, a substantial decrease of 17.8 and 41.2% in water input was observed moving from southern Minnesota to southwestern and northwestern Minnesota, respectively. Likewise, moisture was generally highest in Waseca soil, followed by Lamberton, and lowest in the Crookston soil. Moreover, Waseca, Lamberton and Crookston sites with clay loam, silty clay loam and loamy surface soil texture had soil water retention that followed a similar trend. Thus, the soil profile moisture was affected by both soil water input from precipitation as well as soil water retention capacity.
An accurate DSSAT CERES-Maize (corn) and CROPGRO- PFM (IWG) model was optimized using field measured data under rainfed conditions at low, medium and high fertilizer N rates for the three sites in southwestern, southern and northwestern Minnesota. The calibrated model is able to accurately simulate corn grain and stover biomass, and IWG aboveground biomass, soil profile moisture, deep percolation and NO3-N leaching losses. Accuracy of model output decreased in the order grain yield/biomass> soil moisture> nitrate-N leaching. Model performance was better for calibration compared to validation, and of better accuracy for corn, compared to IWG at all three sites. Results indicated that corn and IWG grain yield averaged 5.4 and 0.36 t ha−1, 7.5 and 0.49 t ha−1, and 8.6 and 0.45 t ha−1, at low, medium and high fertilizer N rates, respectively. The respective N rates also produced IWG biomass of 7.8, 9.7 and 10.5 t ha−1. Averaged over N rates and sites, corn and IWG had 517 mm vs. 592 mm ETc, 154.5 mm vs. 100.8 mm deep percolation, 0.29 m3 m−3 vs. 0.25 m3 m−3 soil profile moisture, and 17.9 kg ha−1 vs. 2.6 kg ha−1 NO3-N leaching losses, respectively. These results indicate that IWG has a potential for significantly reducing deep percolation and NO3-N leaching losses as a result of higher ETc and N uptake efficiency, compared to corn. However, high spatio-temporal variations were observed. Moreover, results indicate that long-term assessment is required for addressing high temporal and spatial variations across sites, in order to facilitate use of the calibrated model at unstudied sites. Additional detailed studies are being carried out in Minnesota to provide more experimental data that can be used for further improvements in model simulations of IWG grain yield and nitrate-N leaching.
The raw data supporting the conclusions of this article will be made available by the authors, without undue reservation.
DM and MT contributed equally to the conceptualization of the article. JJ and MT led the data analysis. MT led the modeling. MT and DM led the writing and editing of the article. All authors contributed to the article and approved the submitted version.
Funding for this project was provided by Minnesota Dept. Agriculture award 169935 with support from the Minnesota Clean Water, Land and Legacy Amendment.
The authors declare that the research was conducted in the absence of any commercial or financial relationships that could be construed as a potential conflict of interest.
The reviewer CW is currently organizing a Research Topic with the author JJ.
All claims expressed in this article are solely those of the authors and do not necessarily represent those of their affiliated organizations, or those of the publisher, the editors and the reviewers. Any product that may be evaluated in this article, or claim that may be made by its manufacturer, is not guaranteed or endorsed by the publisher.
The Supplementary material for this article can be found online at: https://www.frontiersin.org/articles/10.3389/fsufs.2023.1010383/full#supplementary-material
Cattani, D. J., and Asselin, S. R. (2018). Has selection for grain yield altered intermediate wheatgrass? Sustainability 10:688. doi: 10.3390/su10030688
Christopher, S. F., Tank, J. L., Mahl, U. H., Hanrahan, B. R., and Royer, T. V. (2021). Effect of winter cover crops on soil nutrients in two row-cropped watersheds in Indiana. J. Environ. Qual. 50, 667–679. doi: 10.1002/jeq2.20217
Culman, S. W., Snapp, S. S., Ollenburger, M., Basso, B., and DeHaan, L. R. (2013). Soil and water quality rapidly responds to the perennial grain kernza wheatgrass. Agron. J. 105, 735–744. doi: 10.2134/agronj2012.0273
de Oliveira, G., Brunsell, N. A., Crews, T. E., DeHaan, L. R., and Vico, G. (2020). Carbon and water relations in perennial Kernza (Thinopyrum intermedium): an overview. Plant Sci. 295:110279. doi: 10.1016/j.plantsci.2019.110279
de Oliveira, G., Brunsell, N. A., Sutherlin, C. E., Crews, T. E., and DeHaan, L. R. (2018). Energy, water and carbon exchange over a perennial Kernza wheatgrass crop. Agri. For. Meteorol. 249, 120–137. doi: 10.1016/j.agrformet.2017.11.022
DeHaan, L. R., Wang, S., Larson, S. R., Catton, D. J., Zhang, X., and Kantarski, T. (2013). “Current efforts to develop perennial wheat and domesticate Thinopyrum intermedium as a perennial grain” in Perennial crops for food security. eds. C. Batello, L. Wade, S. Cox, N. Pogna, A. Bozzini, and J. Choptiany (Rome, Italy: Proc. the FAO Expert Wor), 390.
Ferchaud, F., Vitte, G., Bornet, F., Strullu, L., and Mary, B. (2015). Soil water uptake and root distribution of different perennial and annual bioenergy crops. Plant Soil 388, 307–322. doi: 10.1007/s11104-014-2335-y
Frahm, C. S., Tautges, N. E., Jungers, J. M., Ehlke, N. J., Wyse, D. L., and Sheaffer, C. C. (2018). Responses of intermediate wheatgrass to plant growth regulators and nitrogen fertilizer. Agron. J. 110, 1028–1035. doi: 10.2134/agronj2017.11.0635
Hoogenboom, G., Porter, C. H., Shelia, V., Boote, K. J., Singh, U., White, J. W., et al. (2019). Decision support system for Agrotechnology transfer (DSSAT) version 4.7.5. DSSAT Foundation, Gainesville, FL. Available at: https://DSSAT.net.
Huggins, D. R., Randall, G. W., and Russelle, M. P. (2001). Subsurface drain losses of water and nitrate following conversion of perennials to row crops. Agron. J. 93, 477–486. doi: 10.2134/agronj2001.933477x
Jones, J. W., Hoogenboom, G., Porter, C. H., Boote, K. J., Batchelor, W. D., Hunt, L. A., et al. (2003). The DSSAT cropping system model. Eur. J. Agron. 18, 235–265. doi: 10.1016/S1161-0301(02)00107-7
Jungers, J. M., DeHaan, L. R., Betts, K. J., Sheaffer, C. C., and Wyse, D. L. (2017). Intermediate wheatgrass grain and forage yield responses to nitrogen fertilization. Agron. J. 109, 462–472. doi: 10.2134/agronj2016.07.0438
Jungers, J. M., DeHaan, L. H., Mulla, D. J., Sheaffer, C. C., and Wyse, D. L. (2019). Reduced nitrate leaching in a perennial grain crop compared to maize in the upper Midwest, USA. Agric. Ecosyst. Env. 272, 63–73. doi: 10.1016/j.agee.2018.11.007
Jungers, J. M., Frahm, C. S., Tautges, N. E., Ehlke, N. J., Wells, M. S., Wyse, D. L., et al. (2018). Growth, development, and biomass portioning of the perennial grain crop Thinopyrum intermedium. Ann. Appl. Biol. 172, 346–354. doi: 10.1111/aab.12425
Kaiser, D. E., Fernandez, F., Lamb, J. A., Coulter, J. A., and Barber, B. (2016). Fertilizing corn in Minnesota. Univ. Minnesota Ext. AG-FO-3790-D (REVISED 2016) Available at: https://extension.umn.edu/crop-specific-needs/fertilizing-corn-minnesota
Kroening, S., and Vaughan, S. (2019). The condition of Minnesota’s groundwater quality, 2013-2017. Minnesota Pollution Control Agency (MPCA) Report. 82 Document number: wq-am1-10. Available at: https://www.pca.state.mn.us/sites/default/files/wq-am1-10.pdf.
Lanker, M., Bell, M., and Picasso, V. D. (2020). Farmer perspectives and experiences introducing the novel perennial grain Kernza intermediate wheatgrass in the US Midwest. Renew. Agri. Food Syst. 35, 653–662. doi: 10.1017/S1742170519000310
Malik, W., Boote, K. J., Hoogenboom, G., Cavero, J., and Dechmi, F. (2018). Adapting the CROPGRO model to simulate alfalfa growth and yield. Agron. J. 110, 1777–1790. doi: 10.2134/agronj2017.12.0680
Minnesota Pollution Control Agency (2013). Nitrogen in Minnesota surface waters: Conditions, trends, sources, and reductions. https://www.pca.state.mn.us/sites/default/files/wq-s6-26i.pdf
Moriasi, D. N., Arnold, J. G., Van Liew, M. W., Bingner, R. L., Harmel, R. D., and Veith, T. L. (2007). Model evaluation guidelines for systematic quantification of accuracy in watershed simulation. Trans. ASABE 50, 885–900. doi: 10.13031/2013.23153
Nash, J. E., and Sutcliffe, J. V. (1970). River flow forecasting through conceptual models part I—A discussion of principles. J. Hydrol. 10, 282–290. doi: 10.1016/0022-1694(70)90255-6
Pedreira, B. C., Pedreira, C. G. S., Boote, K. J., Lara, M. A. S., and Alderman, P. D. (2011). Adapting the CROPGRO perennial forage model to predict growth of Brachiaria brizantha. Field Crops Res. 120, 370–379. doi: 10.1016/j.fcr.2010.11.010
Pennington, D. N., Dalzell, B., Mulla, D., Taff, S., Hawthorne, P., and Polasky, S. (2017). Cost-effective land use planning: optimizing land use and land management patterns to maximize social benefits. Ecol. Econ. 139, 75–90. doi: 10.1016/j.ecolecon.2017.04.024
Pequeno, D. N. L., Pedreira, C. G. S., and Boote, K. J. (2014). Simulating forage production of Marandu palisade grass (Brachiaria brizantha) with the CROPGRO-perennial forage model. Crop Pasture Sci. 65, 1335–1348. doi: 10.1071/CP14058
Pequeno, D. N. L., Pedreira, C. G. S., Boote, K. J., Alderman, P. D., and Faria, A. F. G. (2017). Species-genotypic parameters of the CROPGRO perennial forage model: implications for comparison of three tropical pasture grasses. Grass Forage Sci. 73, 440–455. doi: 10.1111/gfs.12329
Pinto, P., De Haan, L., and Picasso, V. (2021). Post-harvest management practices impact on light penetration and Kernza intermediate wheatgrass yield components. Agronomy 11:442. doi: 10.3390/agronomy11030442
Prokopy, L. S., Gramig, B. M., Bower, A., Church, S. P., Ellison, B., Gassman, P. W., et al. (2020). The urgency of transforming the Midwestern U.S. landscape into more than corn and soybean. Agric. Hum. Values 37, 537–539. doi: 10.1007/s10460-020-10077-x
Reilly, E. C., Gutknecht, J. L., Tautges, N. E., Sheaffer, C. C., and Jungers, J. M. (2022). Nitrogen transfer and yield effects of legumes intercropped with the perennial grain crop intermediate wheatgrass. Field Crops Res. 286:108627. doi: 10.1016/j.fcr.2022.108627
Rymph, S. J., Boote, K. J., Irmak, A., Mislevy, P., and Evers, G. W. (2004). Adapting the CROPGRO model to predict growth and composition of tropical grasses: developing physiological parameters. Soil Crop Sci. Soc. Fla. Proc. 63, 37–51.
Sprunger, C. D., Culman, S. W., Robertson, G. P., and Snapp, S. S. (2018). How does nitrogen and perenniality influence belowground biomass and nitrogen use efficiency in small grain cereals? Crop Sci. 58, 2110–2120. doi: 10.2135/cropsci2018.02.0123
Struffert, A. M., Rubin, J. C., Fernandz, F. G., and Lamb, J. A. (2016). Nitrogen management for corn and groundwater quality in upper Midwest irrigated sands. J. Environ. Qual. 45, 1557–1564. doi: 10.2134/jeq2016.03.0105
Tautges, N. E., Jungers, J. M., DeHaan, L. R., Wyse, D. L., and Sheaffer, C. C. (2018). Maintaining grain yields of the perennial cereal intermediate wheatgrass in monoculture v. biculture with alfalfa in the upper Midwestern USA. J. Agric. Sci. 156, 758–773. doi: 10.1017/S0021859618000680
Zamora, D. S., Jose, S., Jones, J. W., and Cropper, W. P. Jr. (2009). Modeling cotton production response to shading in a pecan alleycropping system using CROPGRO. Agrofor. Syst. 76, 423–435. doi: 10.1007/s10457-008-9166-x
Keywords: Kernza®, corn, modeling, evapotranspiration, deep percolation, nitrate leaching, Minnesota
Citation: Mulla DJ, Tahir M and Jungers JM (2023) Comparative simulation of crop productivity, soil moisture and nitrate-N leaching losses for intermediate wheatgrass and maize in Minnesota using the DSSAT model. Front. Sustain. Food Syst. 7:1010383. doi: 10.3389/fsufs.2023.1010383
Edited by:
Siyabusa Mkuhlani, International Institute of Tropical Agriculture (IITA), KenyaReviewed by:
Hannah Waterhouse, University of California, Berkeley, United StatesCopyright © 2023 Mulla, Tahir and Jungers. This is an open-access article distributed under the terms of the Creative Commons Attribution License (CC BY). The use, distribution or reproduction in other forums is permitted, provided the original author(s) and the copyright owner(s) are credited and that the original publication in this journal is cited, in accordance with accepted academic practice. No use, distribution or reproduction is permitted which does not comply with these terms.
*Correspondence: David J. Mulla, bXVsbGEwMDNAdW1uLmVkdQ==
Disclaimer: All claims expressed in this article are solely those of the authors and do not necessarily represent those of their affiliated organizations, or those of the publisher, the editors and the reviewers. Any product that may be evaluated in this article or claim that may be made by its manufacturer is not guaranteed or endorsed by the publisher.
Research integrity at Frontiers
Learn more about the work of our research integrity team to safeguard the quality of each article we publish.