 Alder Keleman Saxena
 Ximena Cadima Fuentes
 Debbie L. Humphries
94% of researchers rate our articles as excellent or good
Learn more about the work of our research integrity team to safeguard the quality of each article we publish.
Find out more
ORIGINAL RESEARCH article
Front. Sustain. Food Syst., 20 July 2023
Sec. Nutrition and Sustainable Diets
Volume 7 - 2023 | https://doi.org/10.3389/fsufs.2023.1000735
This article is part of the Research TopicFood, Nature & Wellness: Dueling EpistemologiesView all 14 articles
A growing body of research seeks to measure the nutritional contributions of agrobiodiversity to the diets of small-scale farming households. While such articles frequently base analysis on nutritional surveys, particularly using 24-h dietary recall methods, there is as-yet little critical analysis of the benefits and drawbacks of 24-h recalls for assessing the nutritional contributions of agrobiodiversity, or for evaluating the biodiversity conservation implications of particular dietary patterns. The current article draws from mixed-methods research conducted in Cochabamba, Bolivia, between 2011 and 2015. Methods included both ethnographic research and a two-season, household-level survey of 414 households, distributed across a rural–urban gradient between urban Cochabamba and the rural municipality of Colomi. The survey included a 24-h “culinary recall,” recording specific ingredients used to prepare foods, including variety-level information for key crops in the region. Results demonstrate that native crops play an important role in household diets, accounting for around a third of calories reported at the household level, and as much as 57% of caloric availability in the most remote agricultural communities. However, a fine-grained examination of the data shows that nearly a third of all calories reported are provided by potatoes and their derivatives; no other native, improved, or Andeanized crop accounted for more than 1.53% of reported calories. Using ethnographic data, the paper considers reasons for the lack of representation of other crops in dietary recall methods, including the difficulties of capturing the consumption of crops that are seasonal, or consumed as specialty foods under specific circumstances. Drawing from these observations, the paper argues that assessing the importance of local consumption as a driver of agrobiodiversity conservation requires methods that are better attuned to cultural and seasonally driven consumption practices.
In the past decade, the relationship between agrobiodiversity conservation and human food security and nutrition (FSN) has received a great deal of scholarly attention. The emerging body of research on this topic assesses the extent to which agricultural biodiversity—that is, the wide array of varieties of native and traditional crops, under-utilized species, or wild and gathered foods—contributes to food security and/or nutritional adequacy. Broadly speaking, researchers have found a positive association between agrobiodiversity cultivation, harvesting, or consumption and various measures of food security (Ekesa et al., 2009; Powell et al., 2011, 2015; Scurrah et al., 2011; Berti and Jones, 2013; Ickowitz et al., 2014; Jones, 2014, 2017; Jones et al., 2014, 2018; Remans et al., 2014; Keleman Saxena et al., 2016b; Keleman Saxena, 2017; M’Kaibi et al., 2017; Saaka et al., 2017; Lachat et al., 2018; Luna-González and Sørensen, 2018; Gitagia et al., 2019; Anderzén et al., 2020; Zimmerer et al., 2020; Lourme-Ruiz et al., 2021). These findings suggest that with greater agrobiodiversity there are better food and nutrition outcomes. However, these statistically significant, positive associations are often of relatively small magnitude (Jones, 2017), a pattern which is puzzling to long-term observers of the field given the importance of biodiverse crops for rural diets in many high-agrobiodiversity regions of the world (Jones, 2017; Keleman Saxena et al., in review).
In the context of these small-magnitude observed effects, this paper highlights some of the limitations of survey-based methods for understanding larger questions about food security, diet, and agrobiodiversity conservation. We report on data from household surveys of agrobiodiversity and nutrition in the department of Cochabamba, Bolivia, as well as data drawn from ethnographic research on the local uses of specific crops. Early analysis of these data demonstrated the challenge of distinguishing measurable effects of locally cultivated agrobiodiversity on household food security and nutrition outcomes. While initial assessments of the relationship between child anthropometric measures and agrobiodiversity consumption, showed a positive association between the consumption of native crops and child height-for-age scores (HAZ) (Keleman Saxena et al., 2016b), later analyses of a smaller sub-set of the most reliable anthropometric data in the sample did not replicate this association (Keleman Saxena, 2017).
The analysis reported here is a deeper exploration of the survey data to better understand why statistically significant relationships linking agrobiodiversity and food security and nutrition were difficult to pinpoint. In order to answer the question of why effect-sizes were small and/or ephemeral, we asked the question: where and to what extent is agrobiodiversity consumption reported in this dataset at all? To answer this question, we combined an analysis of the survey dataset with an analysis of typical circumstances of food consumption for specific native crops (e.g., specific elements of agrobiodiversity) in the department of Cochabamba, Bolivia. For many such crops, availability, access, and culturally valued consumption circumstances are spatially and temporally patterned. A one-day survey visit may fail to capture the moments or times of year in which these crops are consumed, and surveys that are not purposively sited to capture spatial variability may miss meaningful differences in diets across localities. These spatio-temporal limitations constrain the utility of dietary recall surveys to measure the contributions of agrobiodiversity to household consumption.
Our reflections on the spatio-temporal limitations of nutritional surveys for understanding how cultivated agrobiodiversity contributes to FSN mirror existing literature on the spatial nuances of agrobiodiversity management. This literature urges attention to territorial characteristics and spatial scales in order to understand how agrobiodiversity is managed as a food-system resource (Zimmerer, 1998, 2003; Gergel et al., 2020). While understanding these spatial and temporal dimensions may seem a minor, technical detail, this effort aligns with intersectionality-based approaches, in that it is an important aspect of understanding the “everyday lived experiences, diverse knowledges and intersecting social locations” (Hankivsky et al., 2014, p. 1). These findings also highlight some of the shortcomings of reductionist approaches to generating knowledge about food systems. While survey design often aims to collect data on highly specific constructs that can be measured precisely and analyzed with frequentist statistics, such measurements may not advance understanding of how systems (in this case, the social-ecological systems of agrobiodiversity-as-food) fit together and function (Meadows, 1999; Zhang et al., 2018). We expand on these observations in the discussion and conclusions, providing some suggestions on how field-based methods might be amended to make survey-based research more useful for the study of agrobiodiversity within larger food systems.
Agrobiodiversity and FSN are both multifaceted, complex concepts. Methods to measure them in real-world contexts generally rely on variables which reduce this complexity (Keleman Saxena et al., in review). For example, food security is usually defined as availability, access, utilization, and stability in time (Barrett, 2010), which can be operationalized in household- or individual-level survey questions assessing the extent to which individuals experience these conditions. Nutritional adequacy is operationalized by asking questions about household- or individual-level intake, comparing reported foods recommended intake of particular nutrients, especially micronutrients (Scurrah et al., 2011; Lachat et al., 2018). Dietary diversity, a measure of the number of food groups consumed, is also frequently used in this arena as a proxy for dietary quality (Ickowitz et al., 2014; Powell et al., 2017; Gergel et al., 2020).
Like food security, agrobiodiversity also encompasses a broad definition. The Food and Agriculture Organization (FAO) has characterized agrobiodiversity as:
… the variety and variability of animals, plants, and micro-organisms on earth that are important to food and agriculture which result from the interaction between the environment, genetic resources and the management systems and practices used by people. It takes into account not only genetic, species and agro-ecosystem diversity and the different ways land and water resources are used for production, but also cultural diversity, which influences human interactions at all levels…. It comprises the diversity of genetic resources (varieties, breeds, etc.) and species used directly or indirectly for food and agriculture…. for the production of food, fodder, fibre, fuel and pharmaceuticals, the diversity of species that support production (soil biota, pollinators, predators, etc.) and those in the wider environment that support agro-ecosystems (agricultural, pastoral, forest and aquatic), as well as the diversity of the agro-ecosystems themselves (Food and Agriculture Organization of the United Nations, 1999).
Studies examining the relationships linking agrobiodiversity and food security usually choose discreet, easily measurable parts of this definition, and assess these in relationship to household FSN. Frequently, the measure used is species diversity, whether referring to diversity cultivated on-farm (Scurrah et al., 2011; Jones, 2014), diversity of crops consumed in the diet (Powell et al., 2015, 2017; Keleman Saxena, 2017), or diversity of crops in the larger food system (Remans et al., 2014).
Because data on these variables is frequently captured using surveys at the household or individual levels, understanding the limitations of survey-based data collection is important for advancing this field. In public health nutrition, dietary recall surveys are a common approach for recording a wide variety of foods consumed, usually relying on asking a respondent to freely list all of the foods they have eaten over a defined prior period (e.g., 24 h) (Gibson, 2022). Food frequency questionnaires, which ask individuals to report the frequency with which they consume foods on a pre-determined list, are also used to help generate measures of dietary diversity (Gibson, 2022). While these measurements are primarily designed to estimate the likelihood of an individual’s diet achieving nutritional adequacy, they can also be analyzed in conjunction with measures of agrobiodiversity (e.g., on-farm species richness or variety richness) to assess the relationships linking agrobiodiversity and FSN.
The challenges to using survey-based measurement for understanding the overlap between agrobiodiversity and FSN have been addressed in the existing literature. For example, observers have argued that dietary diversity, as an assessment of dietary quality, is a better measurement than macro- or micro-nutrient intake for understanding the contributions of biodiversity to FSN (Berti and Jones, 2013; High Level Panel of Experts (HLPE), 2017). Similarly, Berti (2015) highlights an important difference in the way that agricultural analysts count types of food when referring to production diversity (e.g., by crop species), versus what nutrition scientists refer to when they discuss dietary diversity (e.g., number of food groups consumed).
The present article extends these discussions of survey methodology by demonstrating how survey design (e.g., via timing of data collection, and the degree of varietal and species-level data elicited by questions) may also influence results and their interpretation. The research reported below uses caloric contribution of individual foods as a core measure for comparing across food types. Because macronutrient reference values are available for a wide variety of crops, this measure allows for species-level (and, to a limited extent, intra-species level) differentiation of crop types. Inter- and intra-species diversity are important measures for agrobiodiversity conservation (especially in potatoes), and aid in understanding temporal patterning of food consumption. However, a calorie-based approach also has important limitations, including the extent to which it may over-weight the nutritional importance of starchy crops while under-weighting other nutrient-rich vegetable foods. We consider these limitations in the discussion section.
The research described here was carried out in 2012–2014 in the department of Cochabamba, Bolivia. The department is located on the Eastern slope of the mid-altitude Andes (further details below). This region of Bolivia was chosen as a research site because of the extent to which it exemplifies a paradox in the relationships linking agrobiodiversity and FSN. Bolivia is, from one perspective, agriculturally rich, being a center of origin and diversity for many crop species (Vavilov, 1926; Sauer, 1969). However, from another perspective, the country has historically been among the world’s most disadvantaged, especially in terms of poverty and child malnutrition. Bolivia’s 2008 DHS survey reported that 30.5% of children under 5 in Cochabamba suffered from stunting (HAZ < -2SD), a figure three points higher than the national average of 27.1% (Coa and Ochoa, 2009).1
Due to its topography, Bolivia presents wide variability in agroecological contexts. On the acutely angled slopes of the Andes, a short linear distance may host a wide variety of climatic conditions, as well as variability in soil types. These conditions also vary seasonally (between wet and dry seasons), and daily (with temperatures fluctuating widely between night and day). This leads to spatial and temporal variability in what kinds of food crops will grow, and when they are harvested. The spatial distribution of agriculture in the Andes has been developed over long time-periods to allow farmers to take advantage of these patterns (Murra, 1985; Zimmerer, 1996; Skarbø, 2014).
There is also patterned variability in the social availability of food in this region. The Andes have long been known for a thriving culture of food exchange (Larson et al., 1995; Larson, 1998). In the larger valley of Cochabamba, during the time of research, most markets did not meet daily; rather vendors attended local markets on one or two set days each week. Products available in markets varied seasonally, with locally cultivated crops present in greater abundance, and at lower prices, close to the harvest season. While non-perishable or processed foods may also travel to these markets over longer distances, the regularity of food supply is often disrupted by, for example, mudslides, transport strikes, or political protest. Such disruptions amplify variation in prices and availability of products, both nationally produced and imported. Hence market availability of food responds to seasonal, spatial, and temporal patterning, as well as stochastic events.
The data and analysis we report here are part of a larger project which aimed to understand the relationships liking agrobiodiversity to food security and food culture using a mixture of qualitative, quantitative, and ethnographic methods. This paper reports specifically on data gathered via (a) surveys, and (b) ethnographic research (participant observation). Readers may refer to other publications (Keleman Saxena et al., 2016a,b; Keleman Saxena, 2017) for a description of the larger project.
Research took place in the rural municipality of Colomi and the departmental capital, the city of Cochabamba. Research sites spanned a distance of 86 km on the national highway and covered an altitudinal range of 2,200–4,200 masl, including the sub-tropical Yungas, the inter-Andean valleys, and high-altitude puna ecoregions. Within this area, nine research sites were purposively selected to represent a range of altitudinal, ecological, and market factors. Altitudinally, sites included an urban area of the city of Cochabamba, located in an inter-Andean valley ecoregion at around 2,700 masl; and multiple rural sites in Colomi, including three sites in the high-altitude puna, located between 3,600 and 4,200 m; three sites in Colomi’s lowland puna, located at 3,200–3,300 m on a valley floor; and two sites in the Yungas, located around 2,200 m (Figure 1 and Table 1). To the extent possible, sites within ecoregions were picked to vary distance from markets and roads.
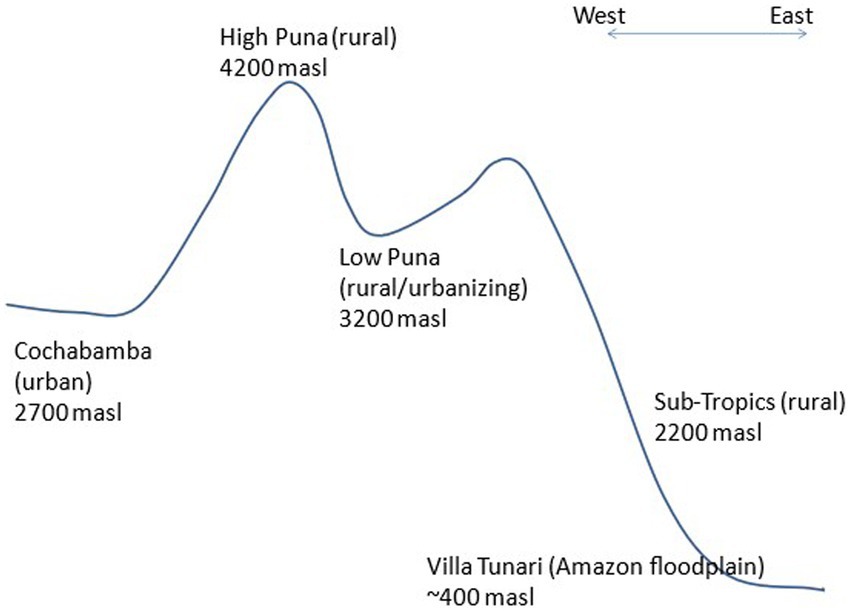
Figure 1. Altitudinal schematic of study sites. The diagram should be read as if the viewer were looking at the Andes in cross-section, standing to the south of the sites in the diagram and looking toward the north. Figure adapted from Keleman Saxena et al. (2016a).
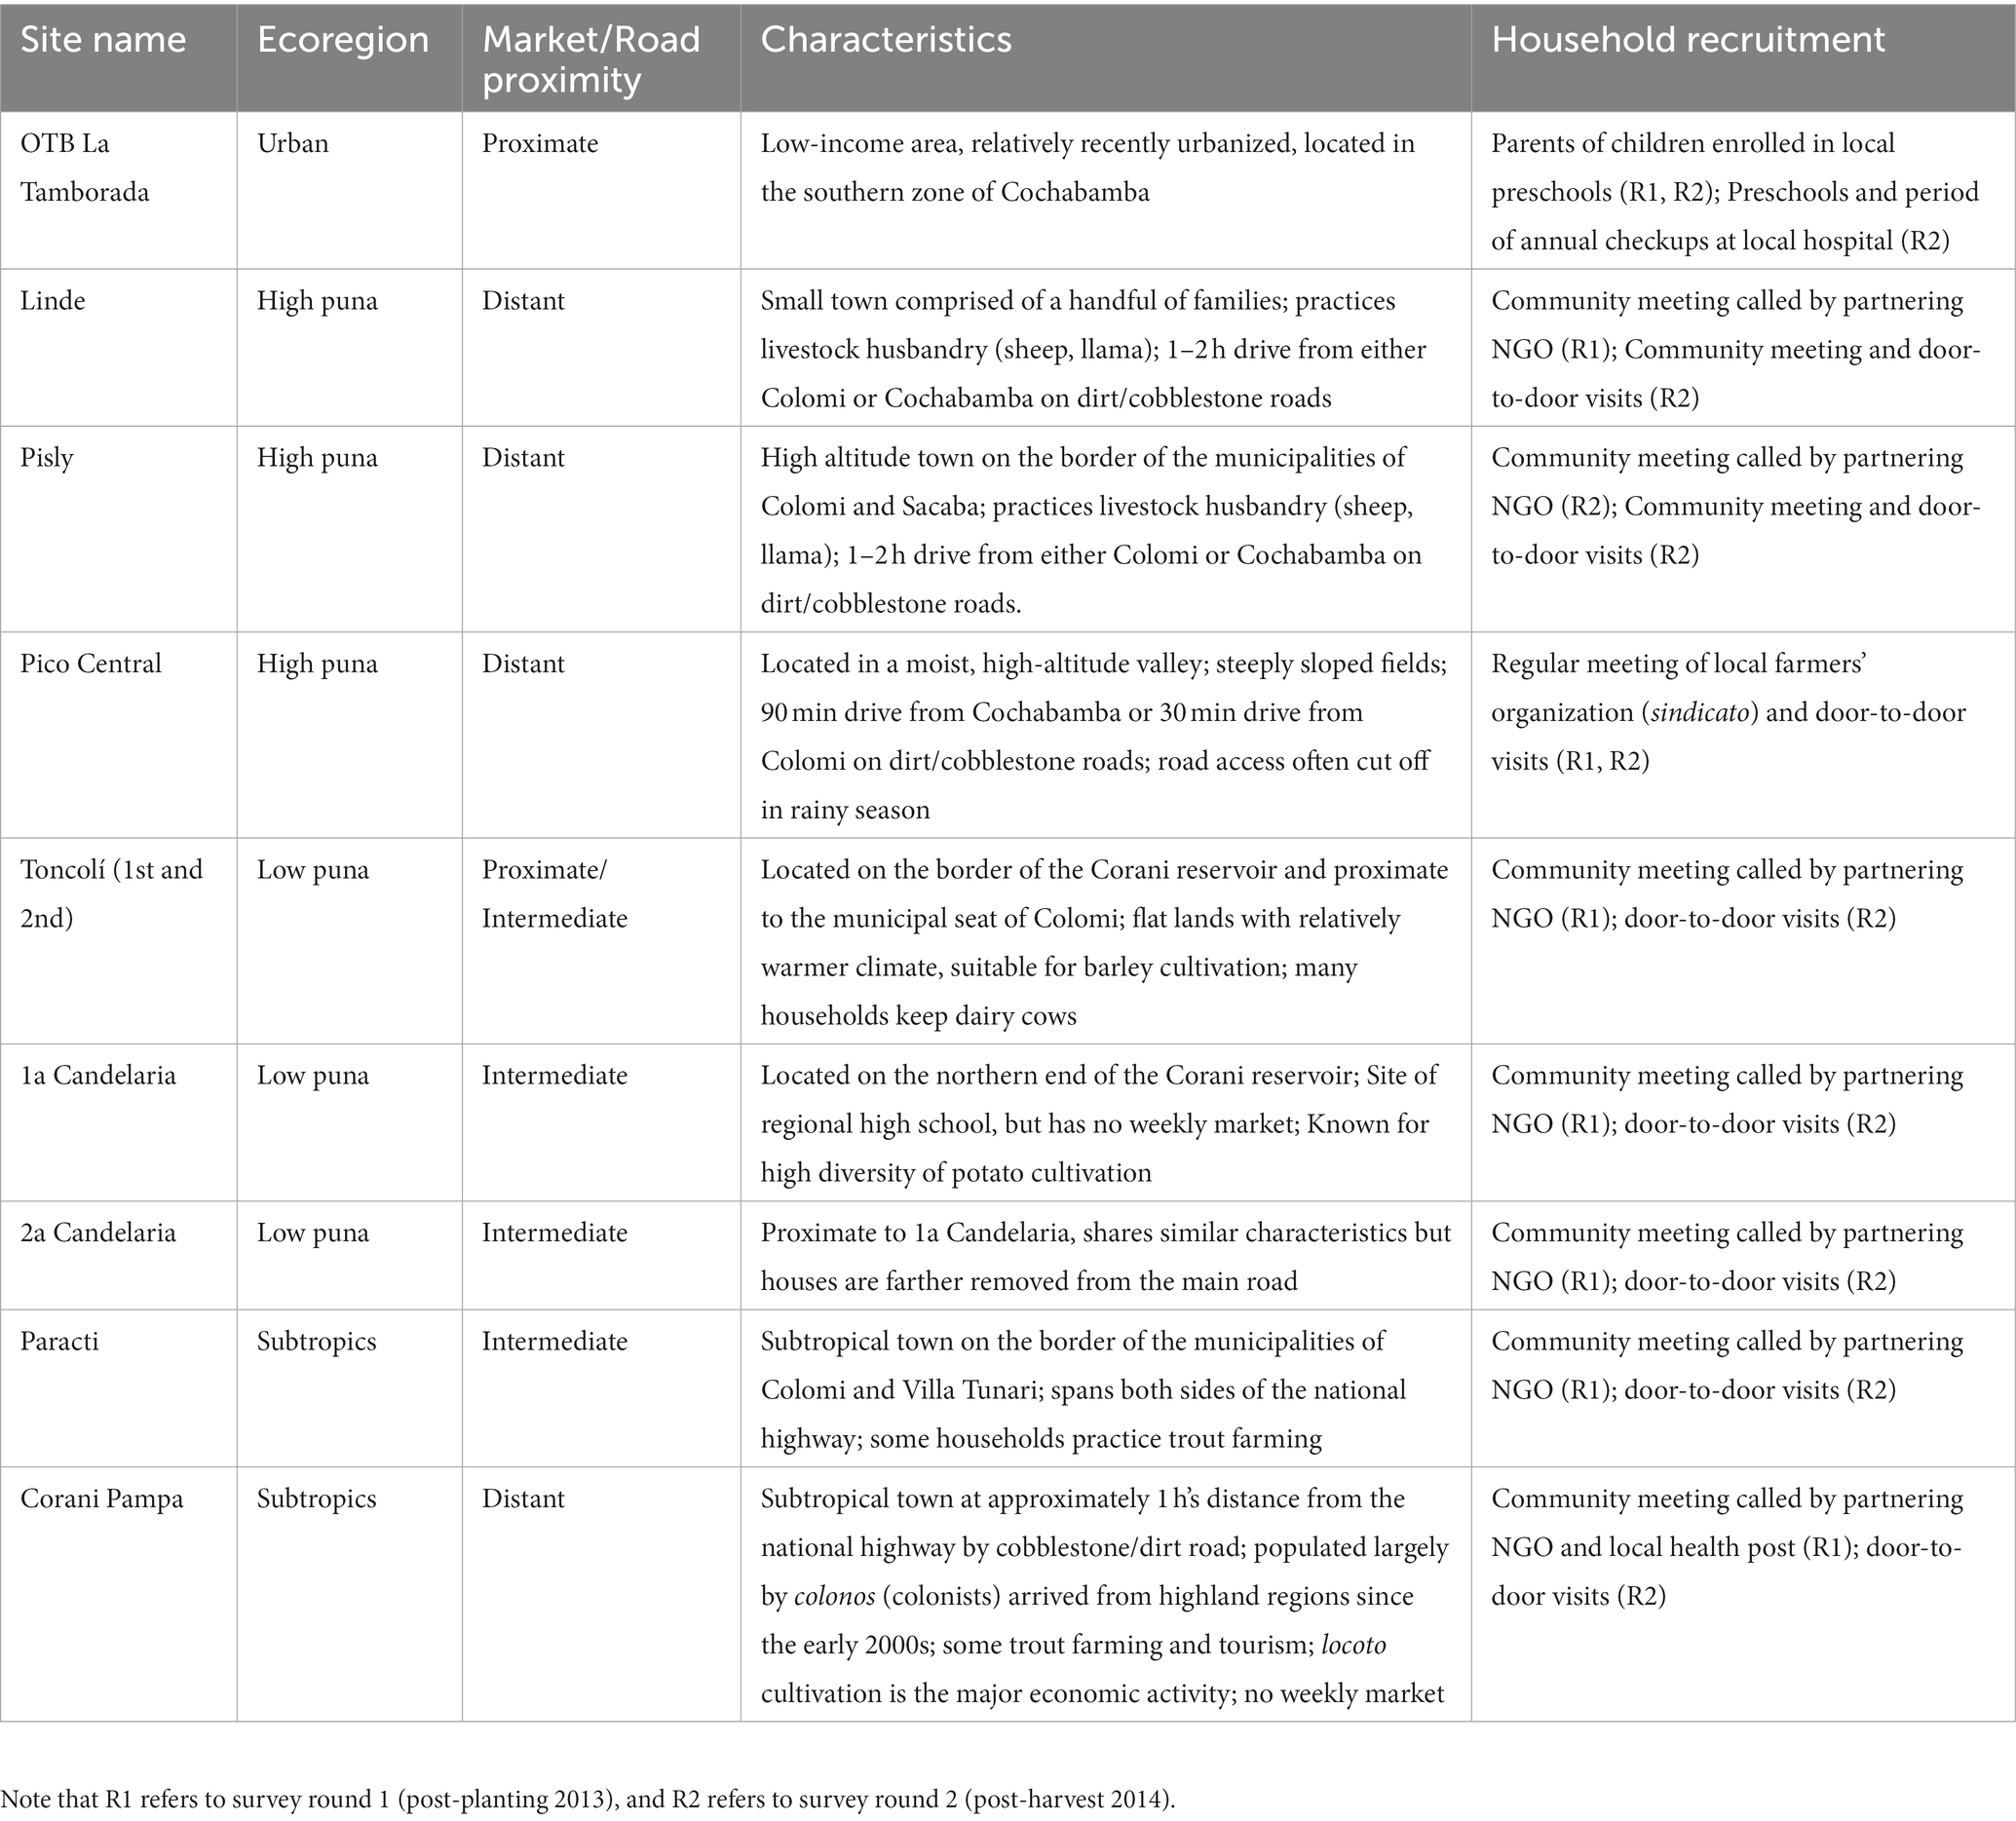
Table 1. Survey sites, site characteristics, and recruitment.
IRB Approval for both qualitative and quantitative research methods was obtained from Yale University’s IRB (Protocol #1107008769). Additionally, approval for survey research was granted by the ethics committee of the Universidad Mayor de San Simón. Prior informed consent was secured verbally from all study participants before collecting data via either quantitative or qualitative methods, using approved consent scripts translated into Spanish and/or Quechua, corresponding to research participants’ preferred language.
Primary ethnographic fieldwork was carried out by the first author over a two-year period (June 2012–July 2014). This was preceded by short visits in 2010 and 2011, and followed by an additional visit in 2015. During this time, the first author undertook participant observation in the nine study communities, as well as in larger public spaces in the surrounding region and in the city of Cochabamba. Participant observation included taking part in food-related events (e.g., farming and food preparation activities, as well as attending fairs and festivals) and making careful observations in food-related spaces (e.g., restaurants, food stalls, open-air markets, supermarkets etc.) in both the urban and rural areas. Over the course of fieldwork, the first author spoke in depth with farmers, household food preparers, chefs, agronomists, NGO workers, and casual observers about the role that agrobiodiversity played in food security and food culture in the region.
The first author additionally observed how food products moved across transport networks linking rural and urban spaces, and under what conditions. Transport-related observations took place during the course of 1–2-h journeys from the city of Cochabamba to field sites in Colomi, which the first author made at a weekly and sometimes daily frequency during main periods of fieldwork. When using public transport, these trips often departed from Cochabamba’s major market center, la Cancha, and arrived at the major market site in the town of Colomi. Because public transport was also often used by small-scale vendors to transport goods for sale, it was possible for the first author to observe and take notes during these journeys.
These observations were recorded in ethnographic field notes and, in some cases, in voice-recorded interviews, which were later transcribed. Field notes and transcriptions were managed in Atlas TI, and specific data relevant to the timing of agrobiodiversity consumption were extracted for the current article. Ethnographic data reported in the present article were cross-checked with the second author, a Cochabamba-based agrobiodiversity researcher who is a lifelong resident of the region.
A panel survey was conducted in two periods: the months following the planting season in Colomi (November–December of 2013), and following the harvest (May–July 2014). As the larger project examined the role of agrobiodiversity in child nutritional health, recruitment targeted households with children under the age of 5. Households were recruited via community-meetings facilitated by local organizations, or by door-to-door knocking (see Table 1). Up-to-date list of households with young children were not readily available, and hence survey-takers used these methods to recruit households until all eligible households had been contacted or were determined to be unreachable.
Survey data was collected from female heads of household or primary food preparers. When neither the female household head nor the primary food preparer was present, data was collected from another individual (usually female) with detailed knowledge of the food that had been prepared in the household the day before the survey.
Surveys were carried out by a 10-person team led by the first author. The survey team consisted primarily of upper-level students in the Universidad Mayor de San Simón (UMSS) nutrition degree program, but also included individuals with training in agronomy and sociolinguistics. Survey-takers were chosen for their language capabilities, in particular the ability to speak Quechua. Prior to fieldwork, survey-takers completed multi-day trainings to familiarize themselves with the motivations, content, and format of the survey; to understand prior informed consent practices; and to practice asking and recording survey questions.
The survey instrument was designed to collect data on multiple variables potentially contributing to food security/nutrition. Specifically, the survey covered: (a) survey respondent individual characteristics; (b) household demographic characteristics; (c) market access/proximity; (d) household wealth and expenditure; (e) government/NGO influence; (f) health and recent infections; (g) household food security; (d) culinary/dietary recall. The survey instrument was reviewed by a bilingual Quechua-Spanish speaker, and Quechua translations of all questions were added to the survey, generating a bilingual survey format. Surveys were administered in the language of primary fluency of the survey respondent, either Spanish or Quechua.
Full methods were published previously in Keleman Saxena (2017). The data reported here are primarily drawn from the culinary/dietary recall. A 24-h “culinary recall,” capturing all dishes prepared in the household the day prior to the survey was administered. This recall was designed to record variety-level identity of locally produced ingredients, as well as the origin of those foods (market vs. home-produced vs. barter). Respondents were asked to report consumption amounts with reference to either a set of plates and cups (including small, medium, and large sizes), similar to those used locally, or a set of styrofoam balls (of a range of sizes), chosen to represent the shape and volume of unprocessed/uncooked food ingredients. The purpose of using these props was to provide a visual reference of food/ingredient volumes that would be more meaningful to respondents than abstract quantities (e.g., “100 g”). The volumes of these plates/balls were measured prior to fieldwork, and were converted to metric volumes of prepared foods or ingredients after the survey was enumerated. The number of individuals consuming each meal (including any guests or missing household members) was also recorded. These data were supplemented with questions about food or drink consumed away from home. Instructions for replicating culinary recall methods are included as Supplementary material.
Survey data were entered into an excel spreadsheet by research assistants who were also members of the survey team. Survey data were checked for accuracy, and errors were corrected.
In consultation with an agronomist trained in local genetic resource management, and outside sources where necessary, ingredients named in the survey were classified as processed, native, Andeanized, introduced, improved, unknown, or animal/meat. Table 2 describes these categories and gives examples of crops and foods belonging to each. Of note, these categories were built to correspond as closely as possible to ethnobotanical origin, also taking into account to the seed system characteristics of each crop/food. However, the resulting groupings do not correspond directly to meaningful nutritional categories (e.g., food groups), which demonstrates the challenges of overlapping the definitions used in ethnobotany, crop-breeding, and nutrition. A very small number of recalls (99, or less than one-tenth of 1% of the total number) were left uncategorized, either because the named ingredient could not be clearly associated to a crop species, or because the respondent had named a dish without identifying the ingredients.
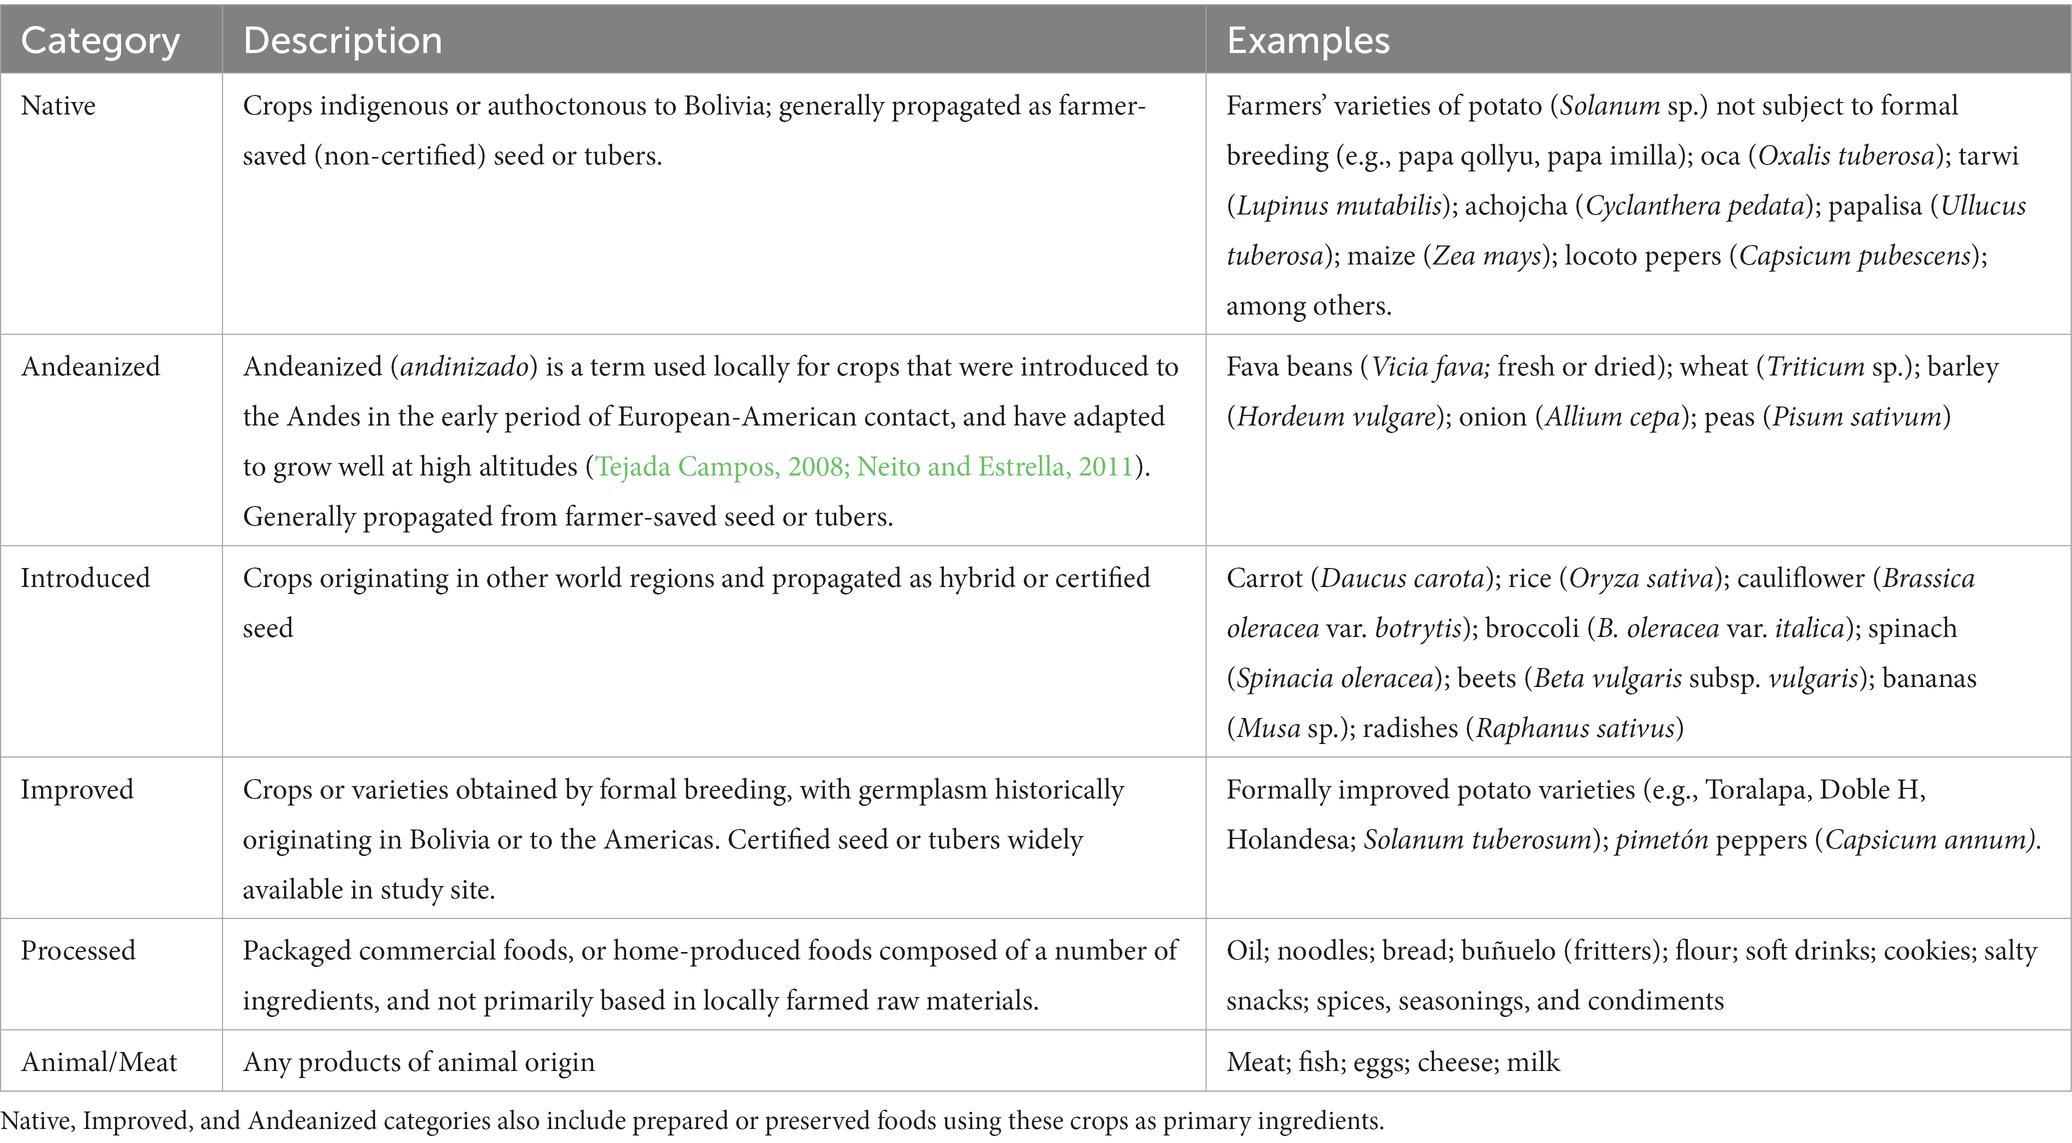
Table 2. Categories of ingredient-type with examples.
Subsequently, researchers generated a table of nutritional values for each type of ingredient named drawing data primarily from the software Nutrisurvey (Erhardt, 2007), and specifically from the program’s databases for Latin America. Values were also sourced from the searchable database of nutritional composition of the Fundación Universitaria Iberoamericana,2 the USDA’s Food Data Central,3 and the Bolivian Government’s Sistema Administrativo de Alimentación (SISADAL). Where necessary, these data were supplemented with information from other sources, including: the nutritional information on the labels of commonly named purchased ingredients; nutritional data associated with web-based recipes for common Bolivian foods (e.g., buñuelos; see Lynn, n.d.) and popular references for individual ingredients not available in other databases (e.g., an article on the seasoning ajino-moto from the website caloriecount.com, now verywellfit.com). Using this table as a database, the volumes of reported ingredients were used to calculate caloric values for each instance in which an ingredient was mentioned in household-level surveys.
The survey collected data from 414 households. After cleaning, the data were divided into three datasets: a cross-sectional dataset of households and children surveyed only in 2013 (N = 106 households); a cross-sectional dataset of households and children surveyed only in 2014 (N = 150 households); and a longitudinal dataset of households and children surveyed in both periods (N = 158 households). The characteristics of these datasets are summarized in Figure 2.
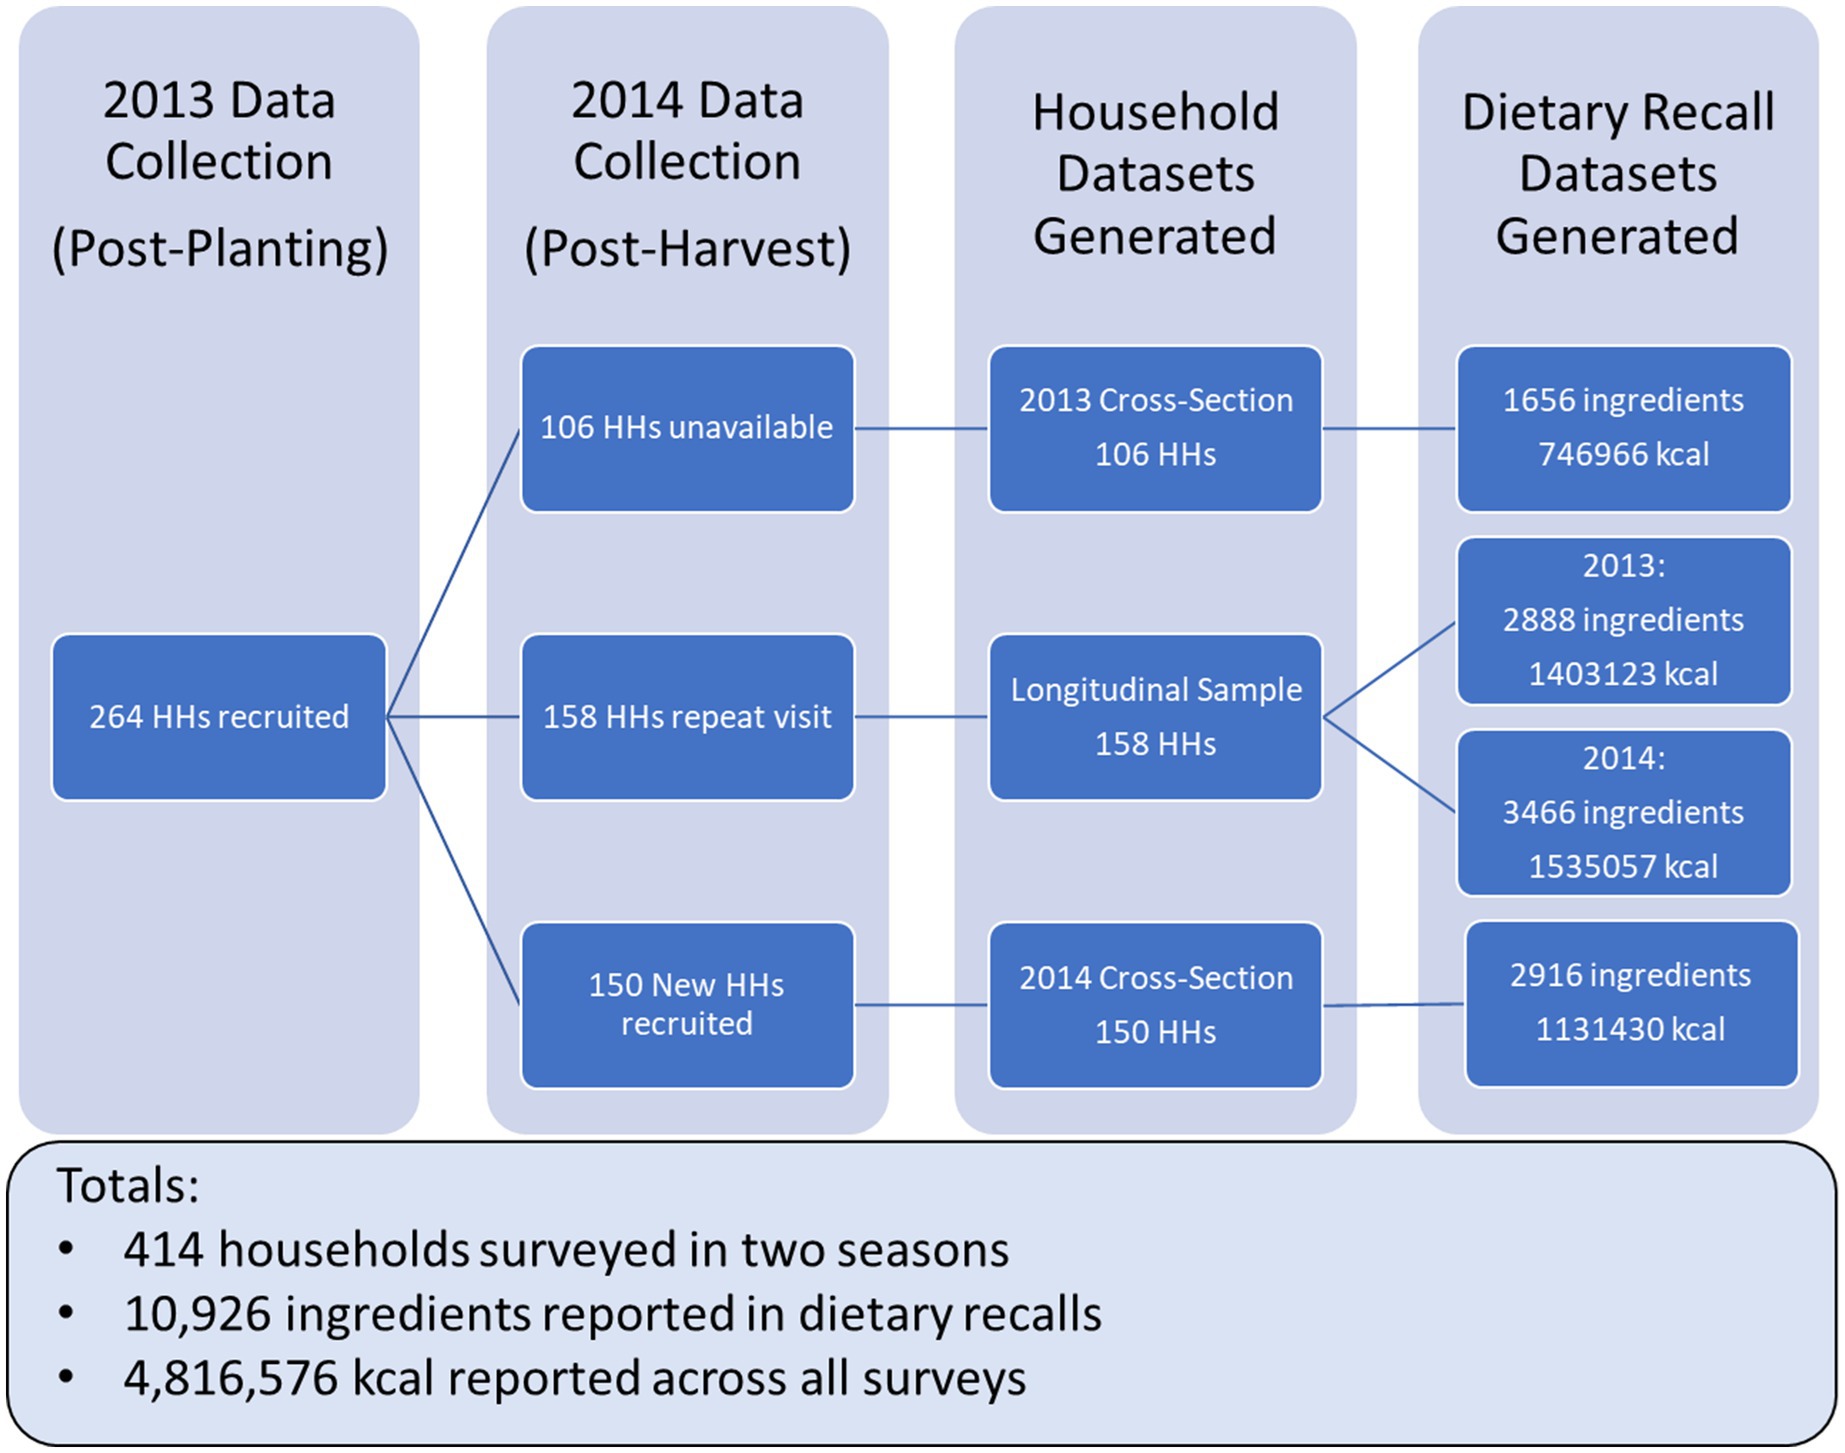
Figure 2. Survey sample by year of recruitment and sub-sets of data.
Initial analyses, which focused on anthropometry (reported in Keleman Saxena et al., 2016b; Keleman Saxena, 2017) prioritized the longitudinal sample which was again narrowed to 117 households to eliminate households for which child anthropometric measurements required additional verification. This longitudinal sample was used to summarize basic demographic data about survey respondents and their households, and was also used for household-level dietary analysis. At the household level, we calculated the caloric contributions of key crop species and crop types (e.g., native vs. Andeanized) to household caloric availability. (Note that caloric availability is not the same as caloric intake, which would require an individual-level measure.) We also assessed each crop type’s contribution to caloric availability varied across seasons, and by region of residence. Descriptive statistics were generated using Microsoft Excel and inferential statistics (paired-sample t-test and analysis of variance) were generated using SPSS (V23).
To understand the broader contributions of agrobiodiversity to regional diets, the average caloric contribution of specific named ingredients was calculated for each household in the longitudinal sample, and averaged within ecoregion. The top contributors by ecoregion were then ranked, and lists of the top 15 crops by caloric contribution for each region were generated. These lists were dominated by potatoes and processed foods (see data below), leading the researchers to ask: to what extent did other native crops appear in the dataset?
To answer this question, the sample was again widened to include all ingredients listed by all 414 households in dietary recall surveys. This resulted in a total of 10,926 individual ingredient recalls in the two survey years (see Figure 2). These are reported for the full sample, and are also broken down by year/season of survey (2013 post-planting and 2014 post-harvest), and by sub-set of the household sample (cross-sectional vs. longitudinal. The number of times an individual ingredient was mentioned by any household was summed, and estimates were made of each ingredient’s contribution to total caloric availability across the 414-hh sample. Descriptive statistics of ingredient recalls were generated using Microsoft Excel.
Table 3 provides a description of the longitudinal sub-sample of the surveyed population. Average household size was 5.97 people in the pre-harvest (2013) season, and 5.64 in the post-harvest season. In the three rural ecoregions, the number of reported household members was larger in the pre-harvest (e.g., planting) season than in the post-harvest season. This trend was reversed in the urban sites, consistent with a pattern of seasonal rural–urban migration. 79.4% of the households responding to the survey classified themselves as “agricultural” whereas the remainder did not. However, this self-classification varied by site, with 84.8–100.0% of households identifying agriculture as a main activity in the rural sites, and only 22% identifying as such in the urban site.

Table 3. Survey population characteristics, 2013 and 2014.
Household food preparers interviewed were, almost without exception, female (data not shown). The average interview respondent age was 30.7 years (±8.67 years). Interviewees had completed an average of 5.42 years of school (±3.91 years), with a higher completion rate (8.0 ± 4.10 years) in the urban site. Eighty eight percent of the interviewees reported that Quechua was their first language, with a maximum of 100% of respondents giving this answer in rural sites, and a low-end value of 61.1% of respondents giving this answer in the urban site. The second most common primary language was Spanish, and a few respondents (N = 3) spoke Aymara as a first language (Table 3).
Mean contributions of each crop category to caloric availability by year are shown in Table 4. On average, within the longitudinal survey sample, approximately one third of reported calories originated from Native crops, accounting for 30.3% (±23.7) of caloric availability in the post-planting season and 32.3% (±24.2) in the post-harvest season. Processed foods were of similar caloric importance, accounting for 35.3% (±19.8) of post-planting season calories and 28.3% (±14.9) of post-harvest season calories. Introduced crops also made important contributions to caloric availability, accounting for 16.2% (±14.5) and 18.0% (±15.9) of calories reported in the post-planting and post-harvest seasons, respectively. Andeanized and improved crops accounted for a smaller percentage of caloric availability (>7%). Meat or other animal products accounted for 9.8% of calories available in each season. The standard deviations from these averages are large, reflecting a wide variation in diets among households.
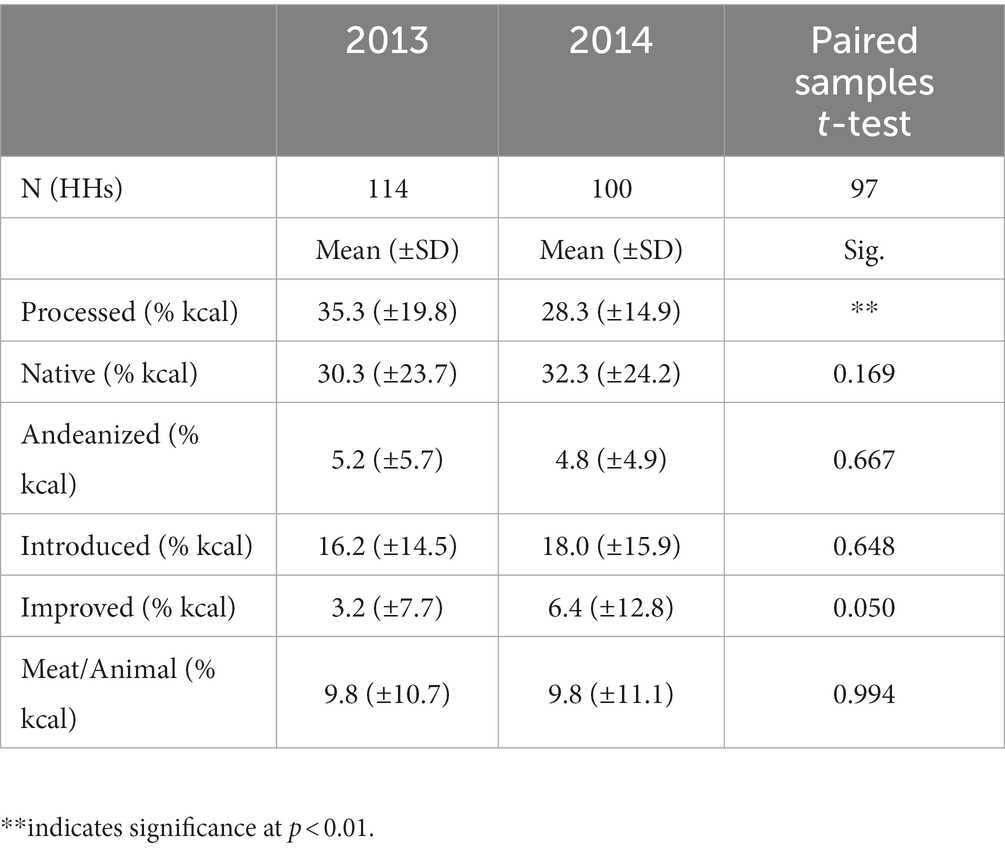
Table 4. Mean % caloric contribution by crop category (2013 and 2014).
The differences in averages suggest some patterns, e.g., that the consumption of Native and improved crops (most of which are locally cultivated) increased in the post-harvest season, while the consumption of processed foods was lower in the post-harvest season. To assess the significance of these trends, we did a paired-samples t-test. This test evaluates the differences between two measurements from the same household, and hence was appropriate for this longitudinal sample. The smaller contribution of processed foods to caloric availability in the post-harvest as opposed to the post-planting season was significant (p < 0.01). No other crop categories showed a significant difference, although the increases in caloric availability from improved and introduced crops in the post-harvest season were borderline significant (p = 0.50 and 0.648, respectively), and the decrease in caloric availability from Andeanized crops was also borderline significant (p = 0.667).
Patterns within these global results change when the data are broken down regionally. Table 5 shows percent contribution of each crop category by ecoregion. Notably, diets in the rural areas differ significantly from those in the urban field site. This is especially marked in the high puna, the most remote of the study regions. Here, foods derived from native crops made up more than half of caloric availability, accounting for 57.4% (±21.1) in the post-planting season and 57.3% (±18.4) in the post-harvest season. While processed foods were the second-most important category, their caloric contribution accounted for only 19.9% (±17.0) of calories in the post-planting period, and 21.7% (±12.7) in the post-harvest period, which was less than in other sites. Meat and animal products also accounted for a lesser proportion of caloric availability than in other sites, making up 5.2% (±6.4) of caloric availability in the post-planting season and 5.1% (±6.2) in the post-harvest season.
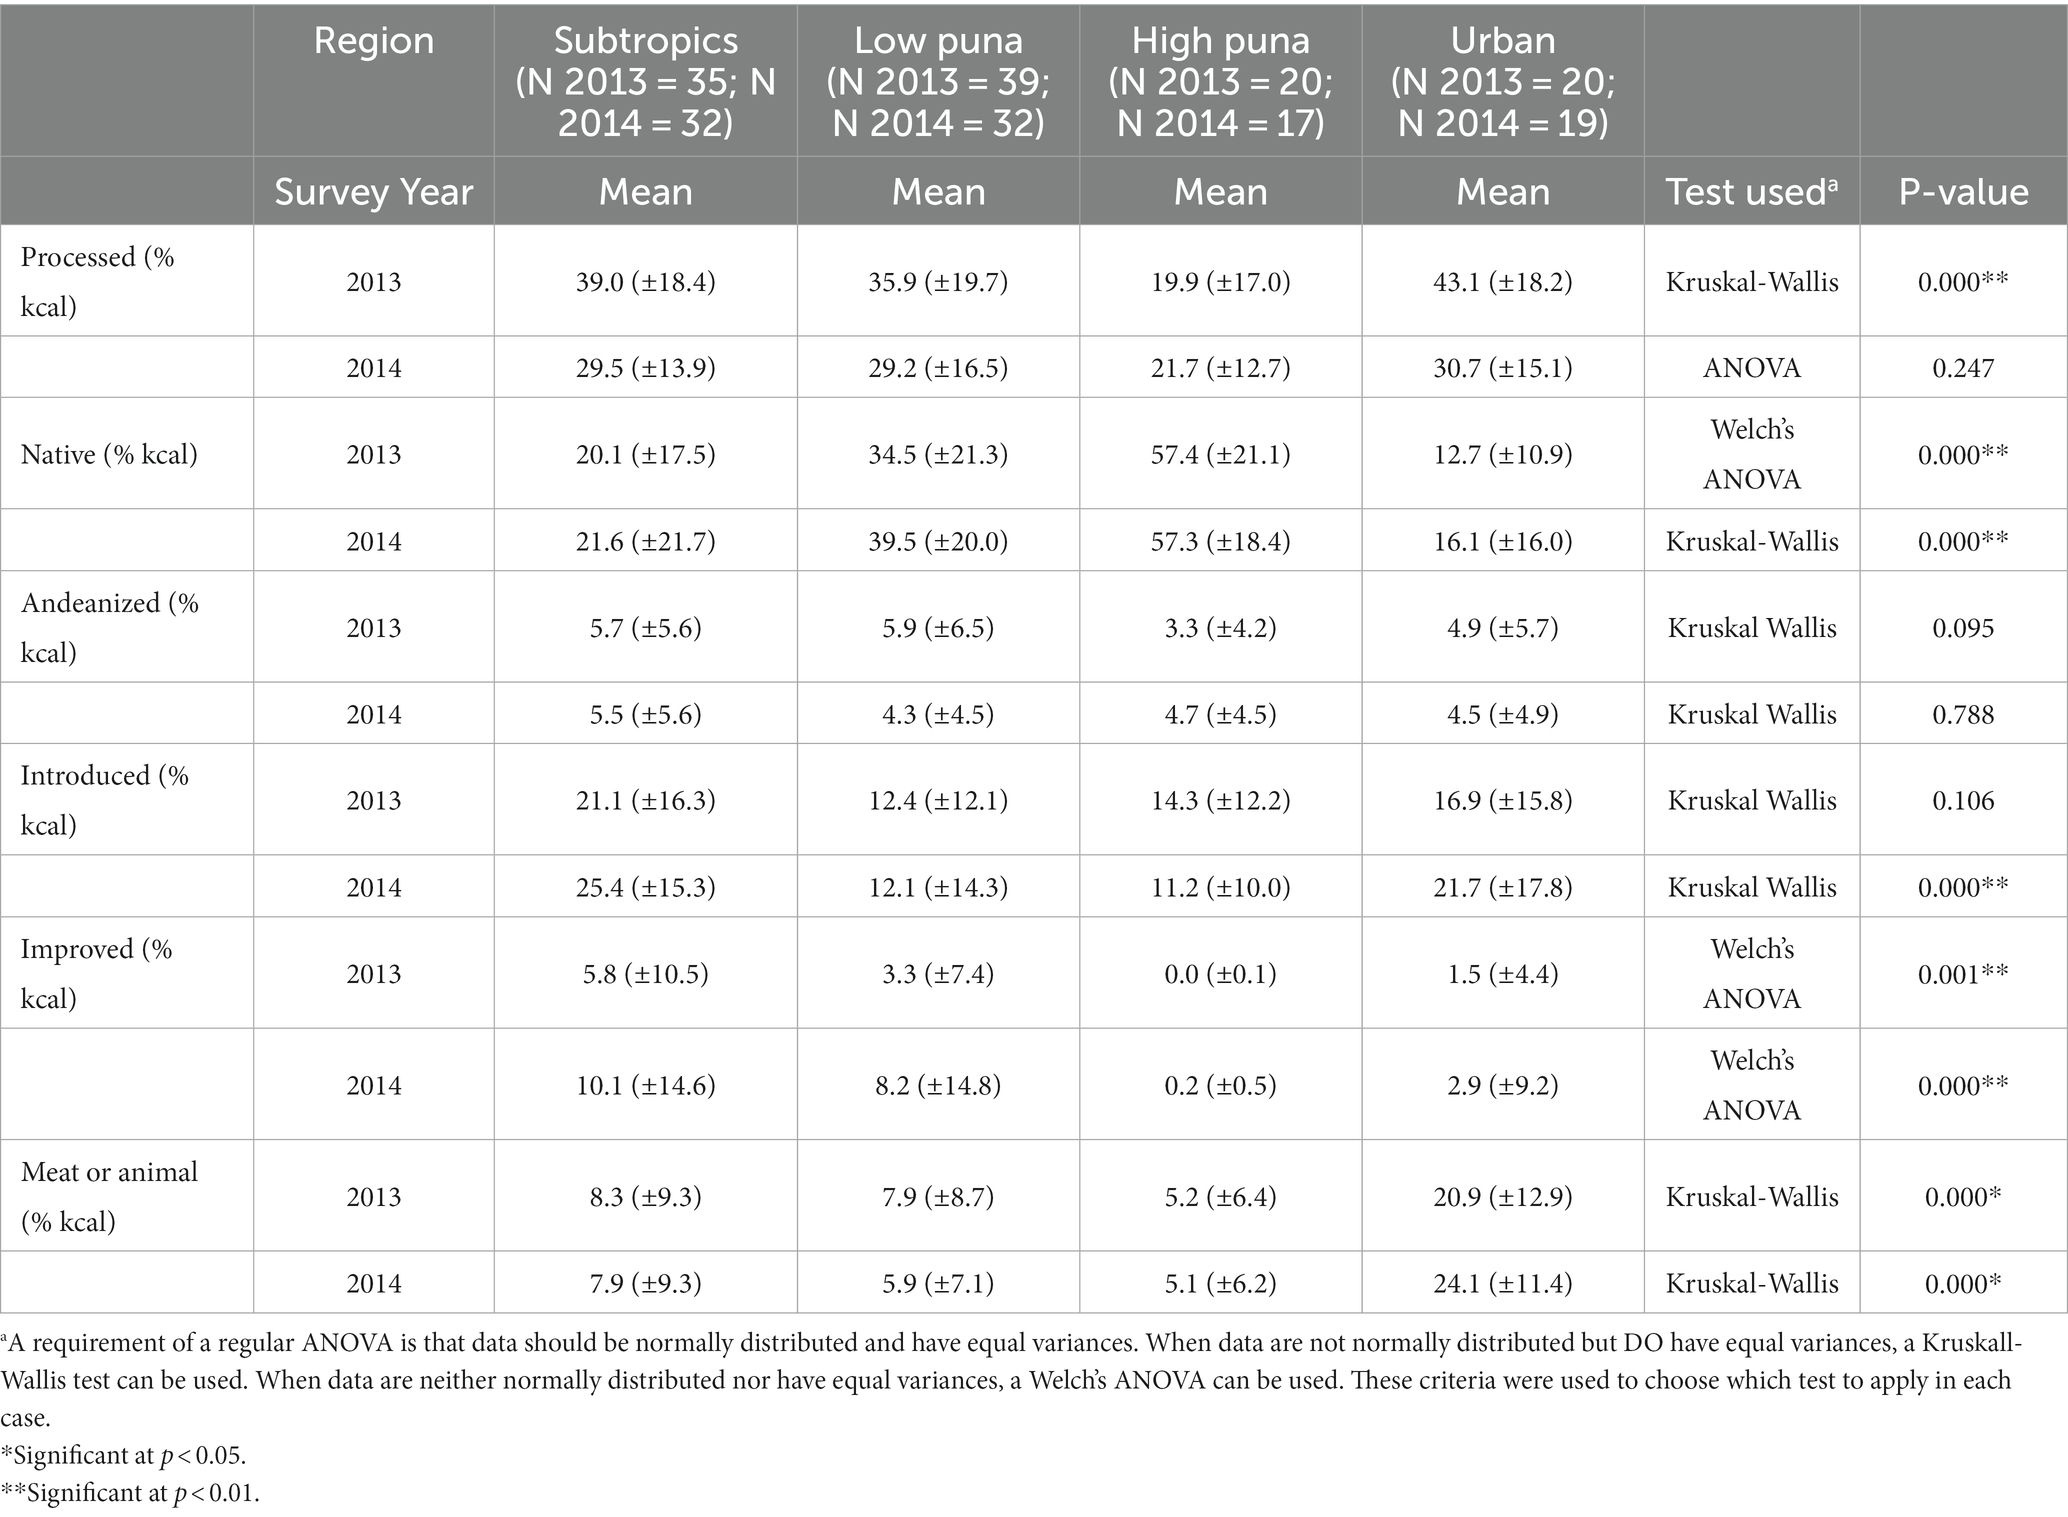
Table 5. Mean % caloric contribution by crop category and by ecoregion (2013 and 2014).
In the low puna, which is a primarily agricultural economy, but better connected to transportation and markets than the high puna, the contribution of native crops to caloric availability was also higher than the full-sample average. Caloric availability from native crops accounted for 34.5% (±21.3) and 39.5% (±20.0) in the post-planting and post-harvest seasons, respectively. Processed foods accounted for a similar proportion of caloric availability to native crops in the post-planting season (35.9% ±19.7), but in the post-harvest season they accounted for a lesser proportion (29.2% ±16.5). The proportion of caloric availability provided by improved crops was higher in the post-harvest season (8.2% ±14.8) than in the post-planting season (3.3% ±7.4). Caloric availability from meat products was lower in the post-planting season (7.9% ±8.7) than in the post-harvest season (5.9% ±7.1).
In the sub-tropics, where survey sites were remote but well connected to transport, and where agriculture largely centers on the production of locoto chile pepper as a cash crop, native crops accounted for a lower proportion of caloric availability than in the two other agricultural sites. Native crops accounted for 20.1% (±17.5) in the post-planting season and 21.6% (±21.7) in the post-harvest-season. Meanwhile, processed foods accounted for 39.0% (±18.4) of caloric availability in the post-planting period, a proportion which decreased to 29.5% (±13.9) in the post-harvest survey. The proportion of calories, provided by improved crops and introduced crops increased in the post-harvest season (from 5.8 to 10.1%, and from 21.1 to 25.4%, respectively). Caloric availability from meat or animal products stayed close to the same, accounting for 8.3% (±9.3) in the post-planting season and 7.9% (±9.3) in the post-harvest season.
Diets in the urban site differed markedly from the three other survey sites, with a higher reliance on processed and animal-based foods. In the urban site, native crops accounted for only 12.7% (±10.9) of caloric availability in the post-planting season and 16.1% (±16.0) in the post-harvest season. Meanwhile, processed foods accounted for 43.1% (±18.2) of caloric availability in the post-planting season, a figure which decreased to 30.7% (±15.1) in the post-harvest season. Meat and other animal projects accounted for a proportion of caloric availability 2.5–5 five times greater than in the other sites, representing 20.9% (±12.9) in the post-planting season and 24.2% (±11.4) in the post-harvest season.
Table 5 also reports results of analyses of the statistical significance in differences of means across the for ecoregional sites. (These were undertaken using a one-way ANOVA, Kruskal-Wallis, and Welch’s ANOVA, as appropriate; see Table 5 for more detail.) Most crop categories show significant differences in percent contribution to caloric availability among regions within each time-period (2013 post-planting or 2014 post-harvest) at the p < 0.05 or p < 0.01 levels. The exceptions are percent caloric availability from processed food (which did not significantly differ among regions in the post-harvest season), percent caloric availability from introduced crop-based foods (where differences across regions were not significant in the post-planting period), and percent caloric availability from Andeanized foods, where differences among regions were not significant in either survey period.
As described above, caloric contribution of all ingredients named in dietary recalls was calculated for the longitudinal sample of households. The contribution of each food type was averaged within ecoregions, and food types were ranked in terms of their percentage contribution to caloric availability. The results of this analysis are reported in Table 6 (for the 2013 post-planting survey) and Table 7 (for the 2014 post-harvest survey).
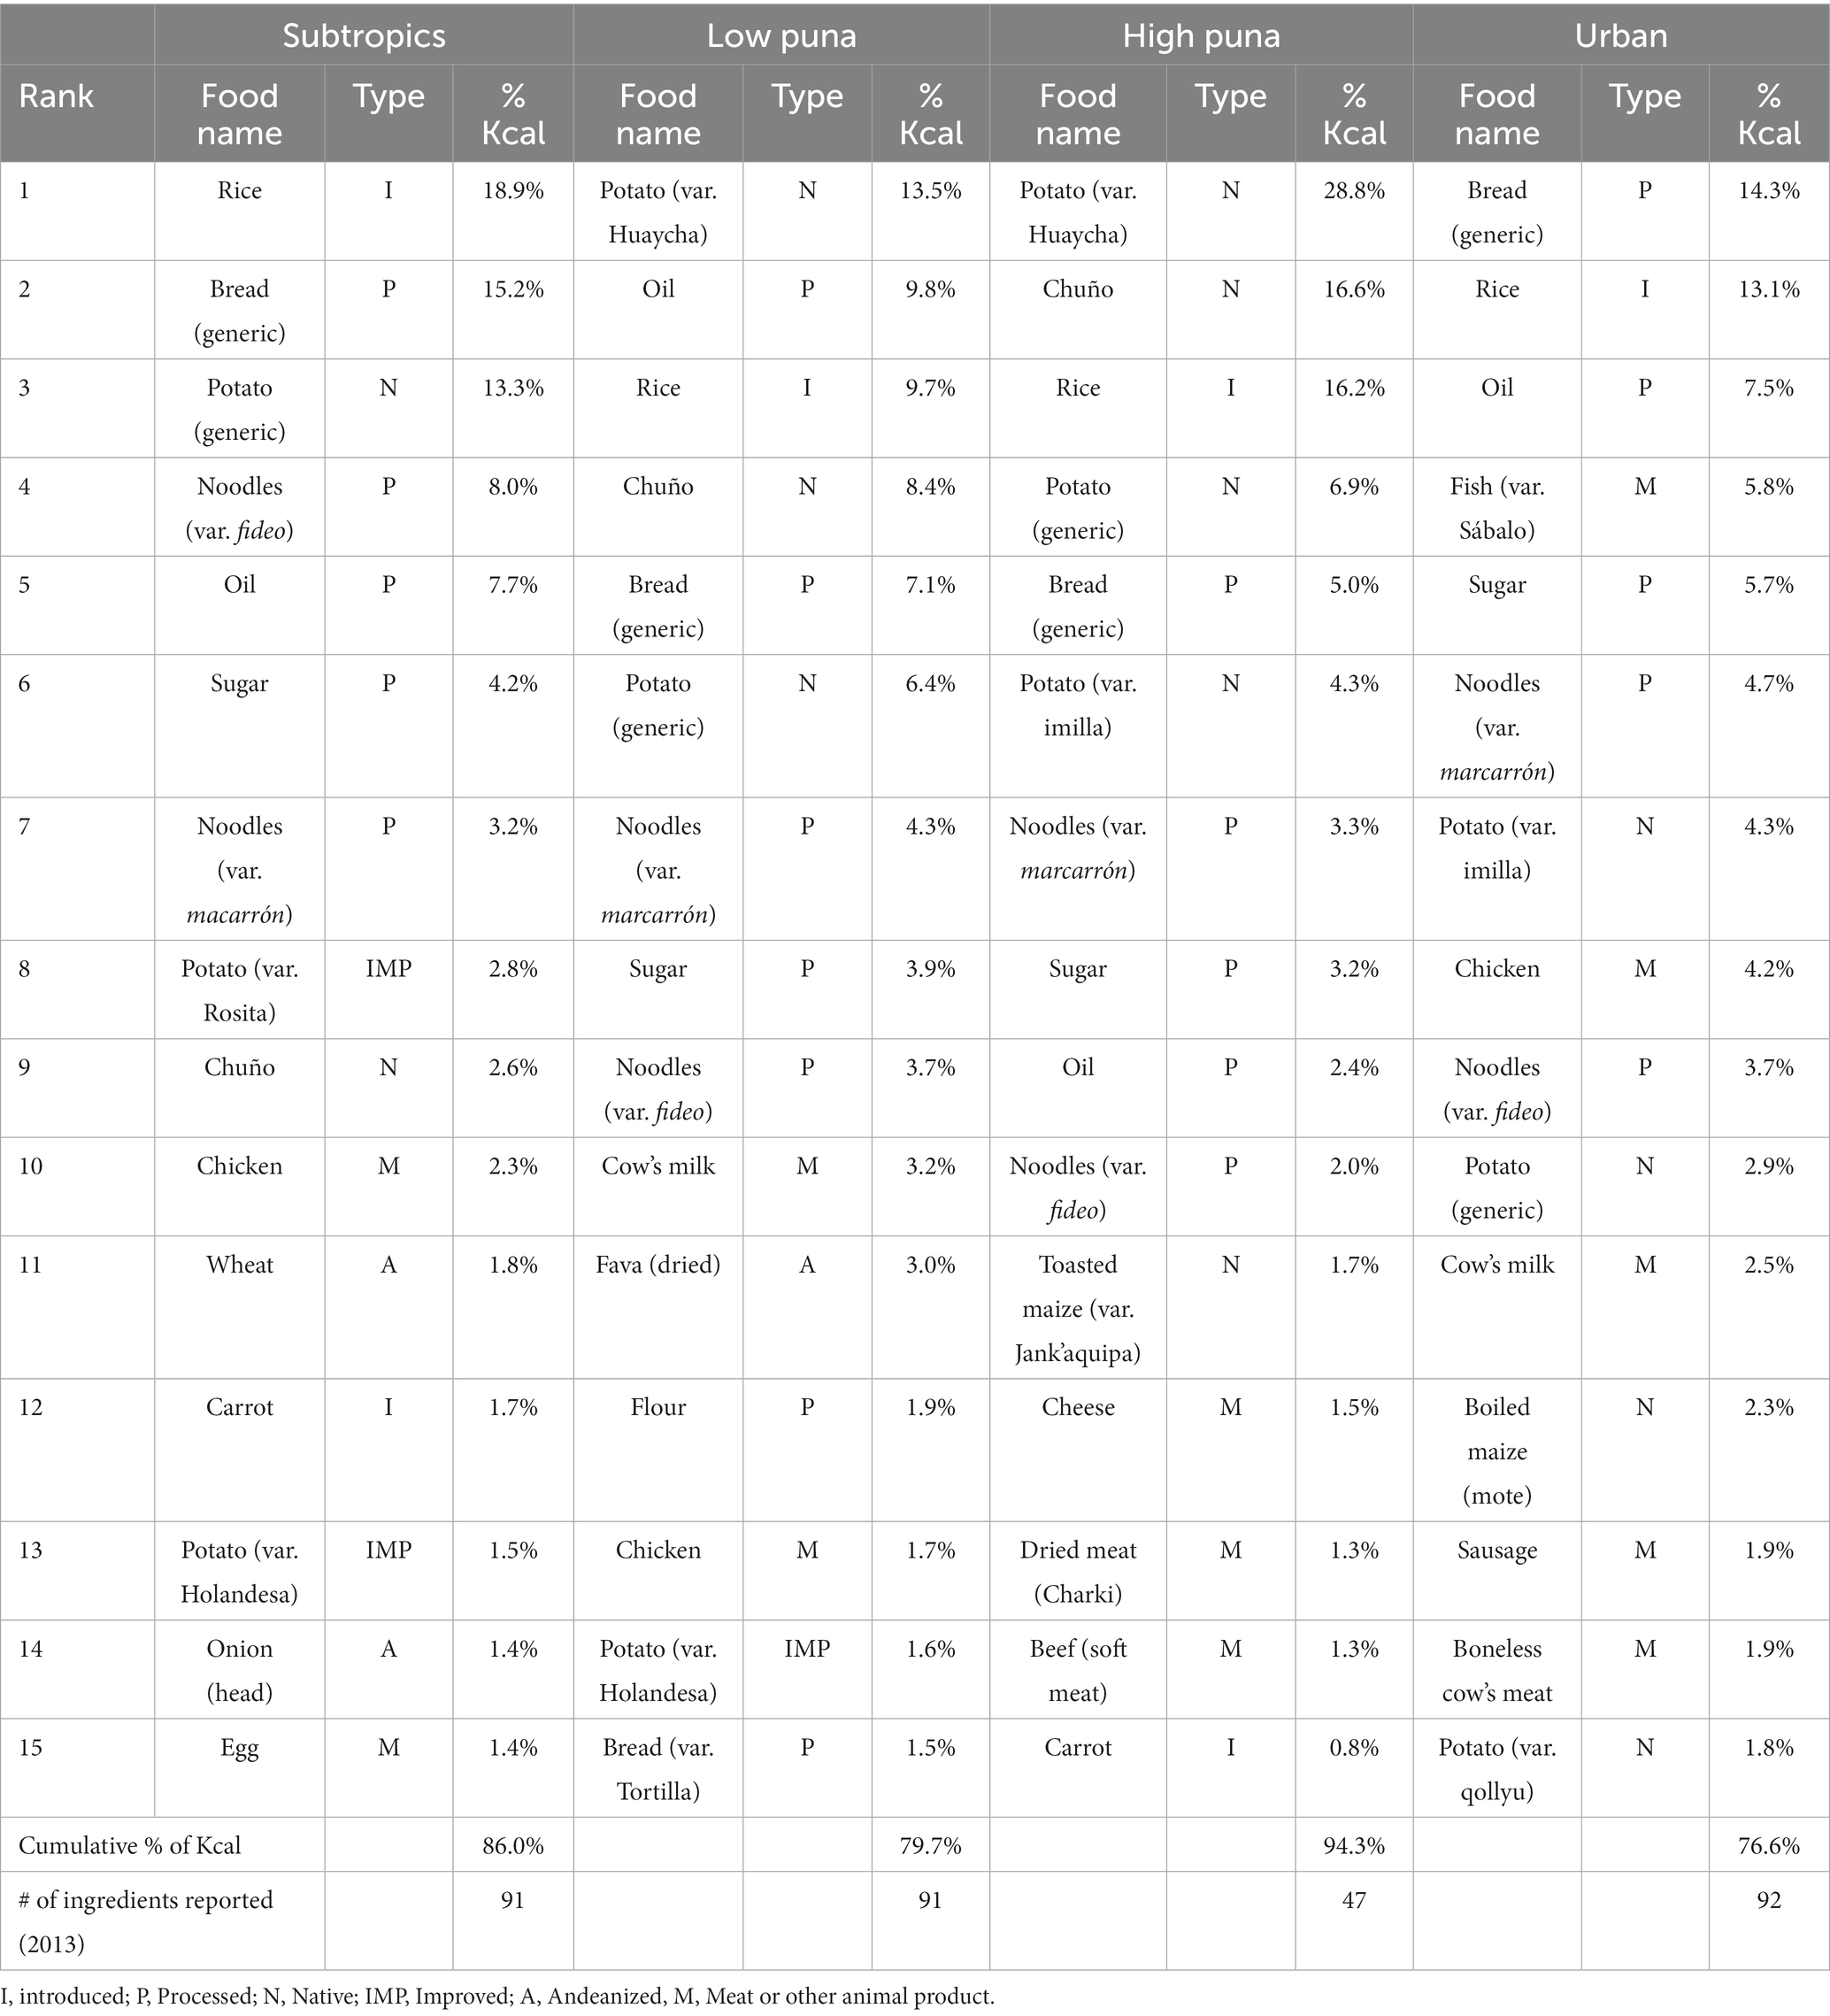
Table 6. Top reported ingredients by ecoregion, 2013.
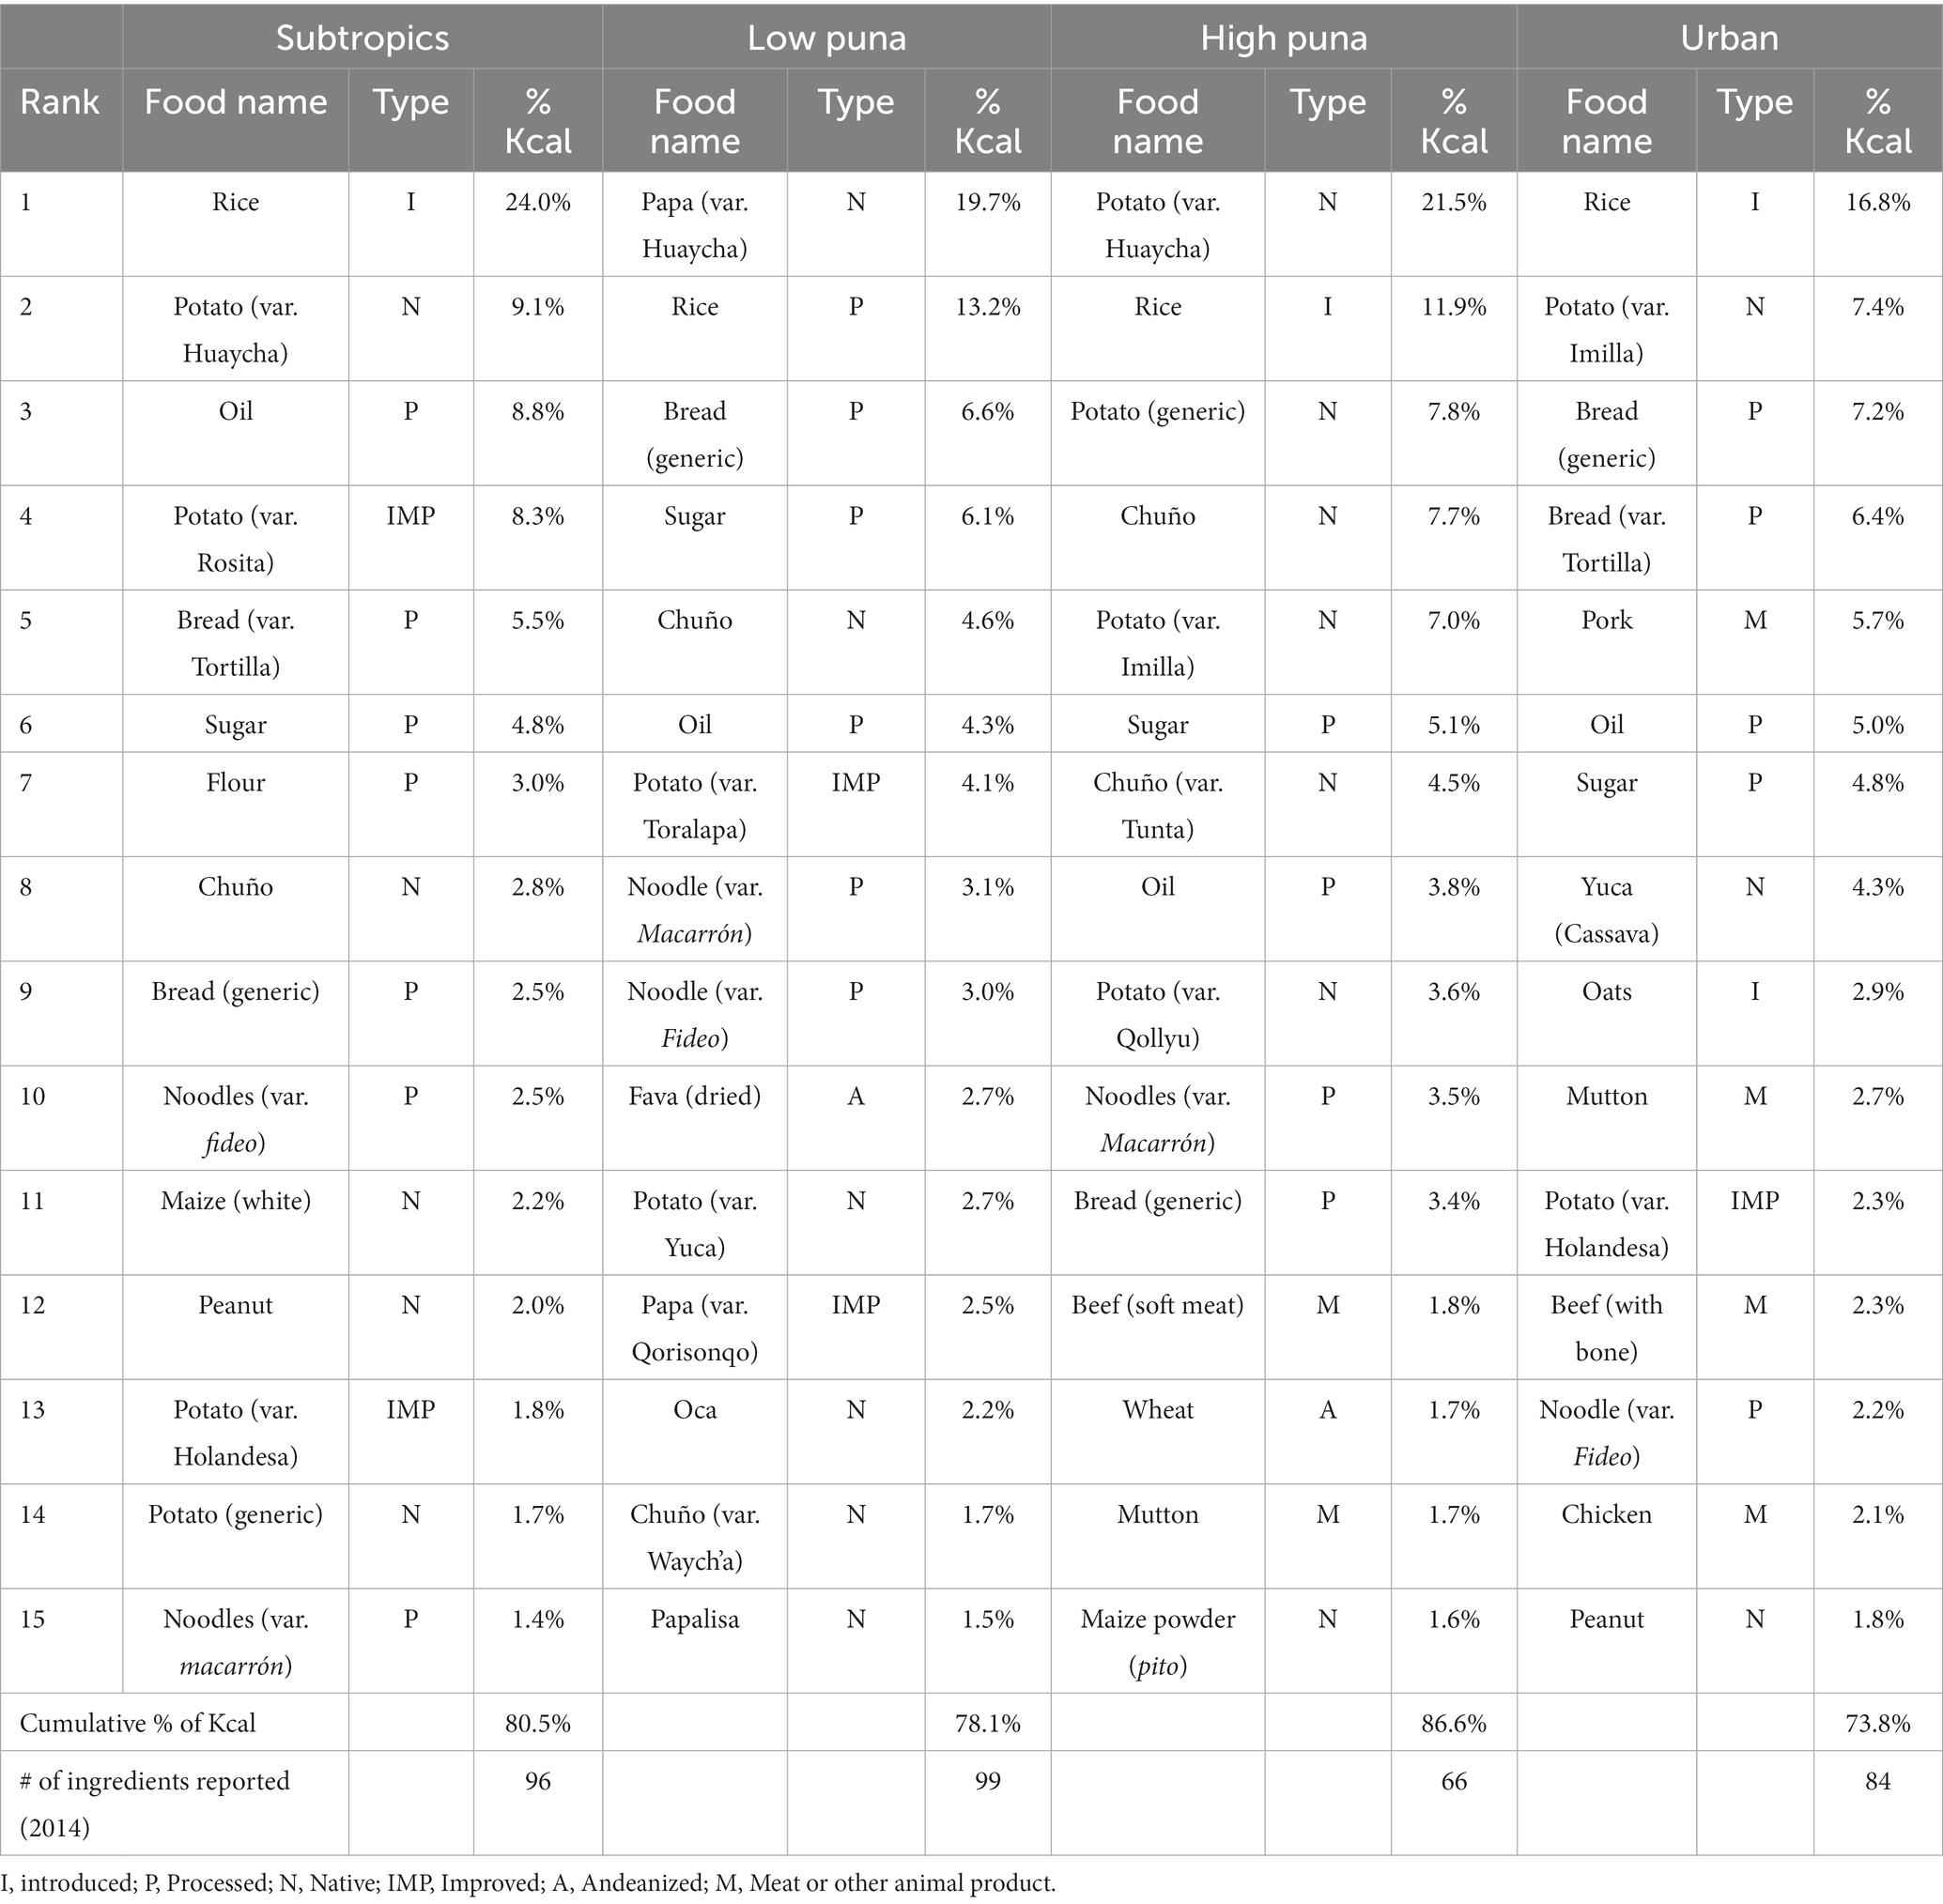
Table 7. Top reported ingredients by ecoregion, 2014.
These data describe the assemblage of foods that underpin household consumption in the two seasons. First, one variety of potato, Huaycha accounts for an important part of caloric intake in the rural sites. This variety accounted for 13.5% of caloric availability in the low-puna in 2013, and 19.7% in 2014. Meanwhile, in the high-puna, papa Huaycha accounted for 28.8% of caloric availability in 2013, and 21.5% in 2014. This variety also accounted for 9.1% of caloric availability in the Yungas in 2013. If potato is a key food security crop for this region, then papa Huaycha might be considered a “food security variety.” As we elaborate in the ethnographic research results below, it is substantially more cultivated compared to other varieties, and also the most consumed.
Beyond this reliance on papa Huaycha, a large proportion of the diet, in all sites and in both seasons, is made up of a few key processed foods: oil, noodles (both fideo and macarrón), sugar, rice, and bread (generic and tortilla). These foods are carbohydrate-heavy, and limited in protein. They may also be relatively micronutrient-limited, although these limitations may be ameliorated when products are fortified, which is mandatory for wheat flour in Bolivia, but not for maize or rice (Food Fortification Initiative, n.d.).
Although these data do identify a few calorie-dense, starch heavy-crops which are central to households’ diets, they also show that in the 2014 post-harvest survey, households were relying on a greater diversity of native and improved foods than in the 2013 post-planting survey. This includes a greater number of potato varieties (natives belonging to Solanum tuberosum Andigenum group, and also improved ones; e.g., different qollyus, Yuca papa, and Qorisonqo, in addition to Huaycha) as well as other minor tubers, like oca (Oxalis tuberosa) and papalisa (Ullucus tuberosus). The 2014 post-harvest list also includes crops like peanut (Arachis hypogaea) and cassava (Manihot esculenta), which are not directly cultivated in low puna, high puna, and urban sites, although they are grown within the subtropical Yungas. This suggests that both local production and regional markets are important in providing diversity to households in the post-harvest season.
In 2013, the percentage of total caloric availability accounted for by the top 15 crops is, across the board, greater than in 2014. This is especially notable for the high puna, where the top 15 foods account for 94.3% of calories in 2013, whereas the same number of foods accounts for only 86.6% of calories in 2014. This is consistent with a greater diversity of foods/ingredients in the diet in the post-harvest period.
Finally, the number of individual ingredients named in the 24-h culinary recall varies by site. In 2013, in the Yungas, low-puna, and valley (periphery city) sites, culinary recalls generated a list of over 90 ingredients. However, in the high puna, the culinary recall generated a list of only 47 ingredients. This number increased by nearly 50% in the 2014 post-harvest survey, with 66 ingredients named in the high puna. Meanwhile, in other sites, the number of ingredients named increased by fewer than 10 in the post-harvest period. This pattern is consistent with greater diversity in the post-harvest season across the board, but with the greatest effect of seasonality observed in the most remote (highland puna) site.
If the combination of a few potato varieties, processed foods, and some meats provides three quarters or more of the calories in the surveyed sites, to what extent are a wider diversity of native crops important to local diets? This question is explored in Table 8, which reports the caloric contributions of Native, Improved, and Andeanized crops reported in dietary recalls for the full sample of households surveyed. This table reports all categories of crop that are significant for agrobiodiversity conservation (but leaves out herbs, wild and gathered crops, or teas).
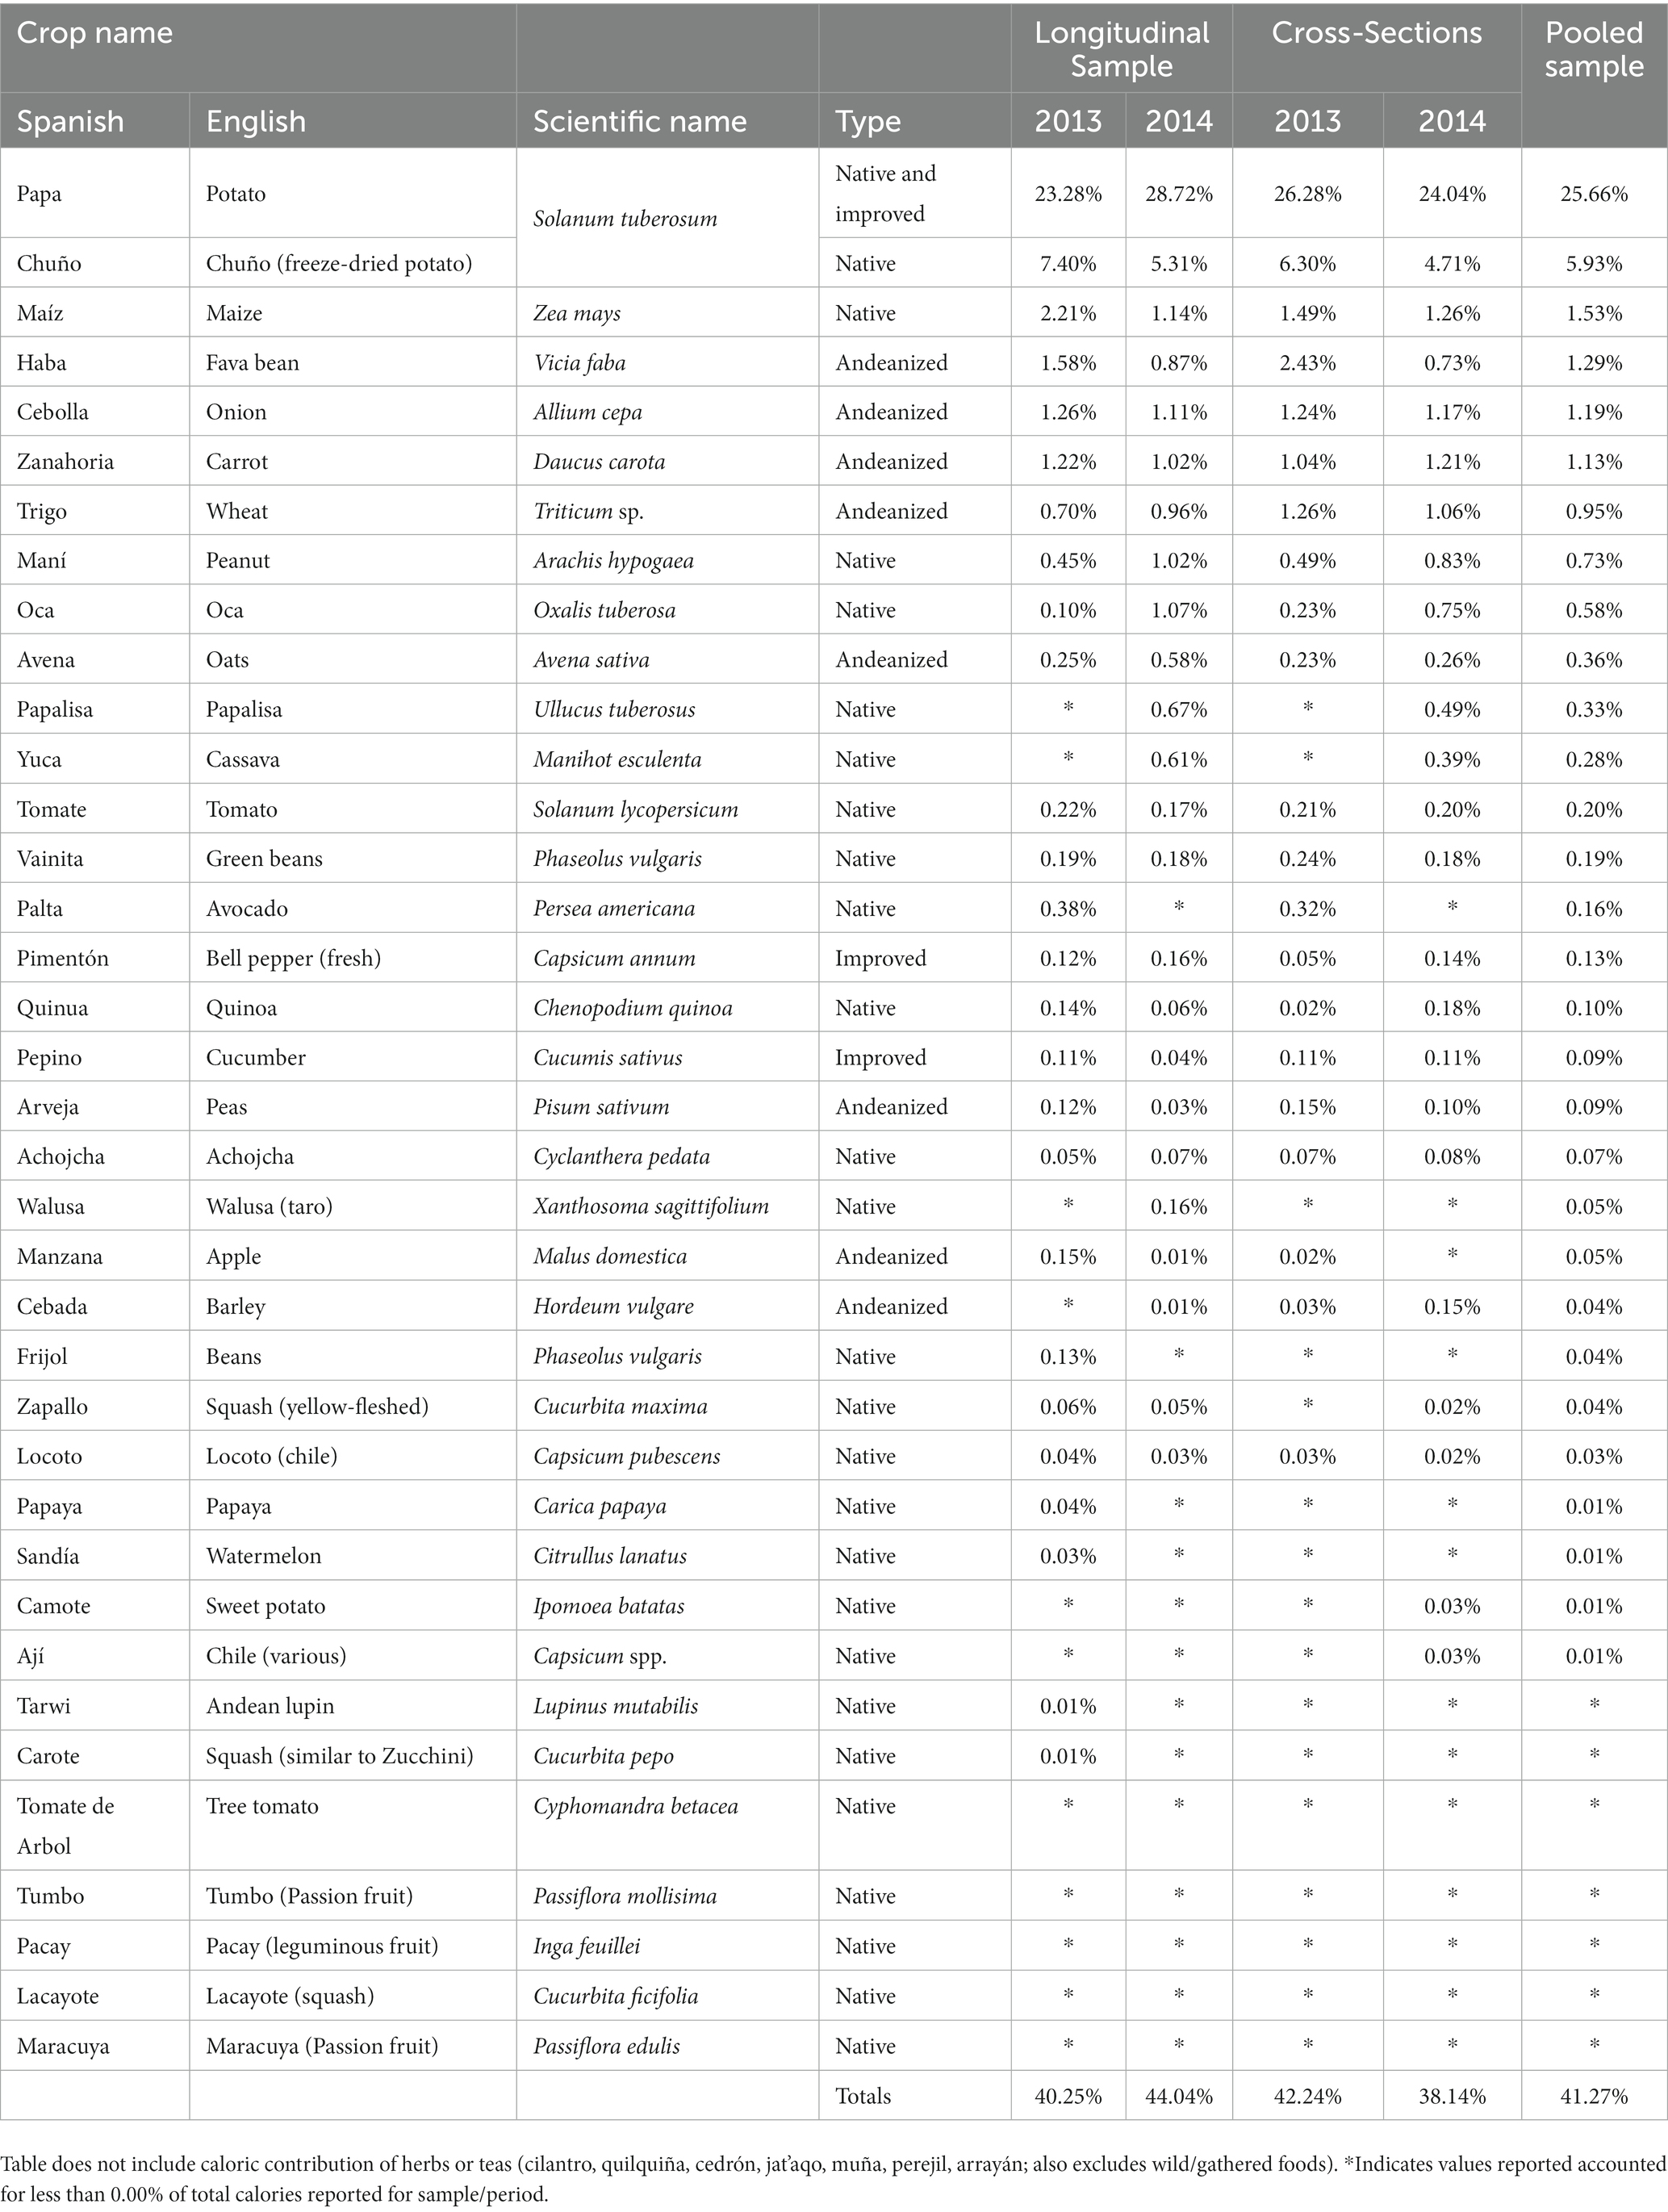
Table 8. Native, improved, and Andeanized crop contributions to reported caloric availability, and ranked by contribution to full sample of dietary recalls.
Following the patterns described above, potato (all varieties) and chuño (a form of freeze-dried potato, which can be made from multiple fresh potato varieties) account for more than 30% of caloric availability reported at the household level. This pattern holds across all sub-sets of the survey sample, and both survey seasons. However, only a handful of other native or Andeanized crops contribute any more than 1% of the caloric availability reported in either period. Maize (Zea mays) and maize-derived products accounted for 1.53% of caloric availability; green or dried fava beans (Vicia faba) accounted for 1.29%; and onion (Allium cepa) and carrots (Daucus carota) (both Andeanized crops) accounted for 1.19 and 1.13%, respectively.
These tables underscore the relatively limited household use of some native crops. Tarwi (Lupinus mutabilis) was reported in only one culinary recall in the full survey period. Quinoa (Chenopodium quinoa), an iconic crop of the Andes which is, nonetheless, not typically grown in the survey sites, accounted for only 0.10% of calories reported in the entire sample of households.
These data also indicate seasonality in the consumption of some crops. For example, in the post-planting survey (2013) oca (Oxalis tuberosa; a native tuber) accounted for only 0.10% of caloric availability in households in the longitudinal sample, and 0.23% in the cross-sectional sample. Meanwhile, in the 2014 post-harvest survey, it accounted for a greater percentage of caloric availability in both the longitudinal (1.07%) and cross-sectional (0.75%) household samples. Likewise, the native tuber papalisa (Ullucus tuberosus) was absent from the 2013 dietary recalls, but accounted for 0.67 and 0.49% of calories reported in the longitudinal and cross-sectional sub-samples of the post-harvest survey.
A similarly pronounced seasonality is evidenced in the consumption of avocado (Persea americana) and cassava (Manihot esculenta). Both of these crops would likely only be grown in the lower-altitude sub-tropical site—but upon examination, the households reporting having consumed these crops were distributed across the ecoregions of the study, underscoring the importance of inter-regional trade for crops not grown locally during seasons of high availability.
The results described above could be taken to suggest that, apart from potatoes, this region’s agrobiodiversity is of relatively limited importance for household diets. However, it is important to contrast these data with ethnographically-derived understanding of how and when “minor” NTCs are available. This section describes patterns of consumption of a selected set of native and Andeanized crops as they are influenced by seasonal and spatial considerations, drawing from ethnographic data. It focuses on native and Andeanized crops that are cultivated locally in the study region (vs. those which are consumed locally, but sourced primarily through markets, like high-altitude wheat or quinoa). This section reports general patterns which are relevant across all ecoregions surveyed. Key results are summarized in Table 9.
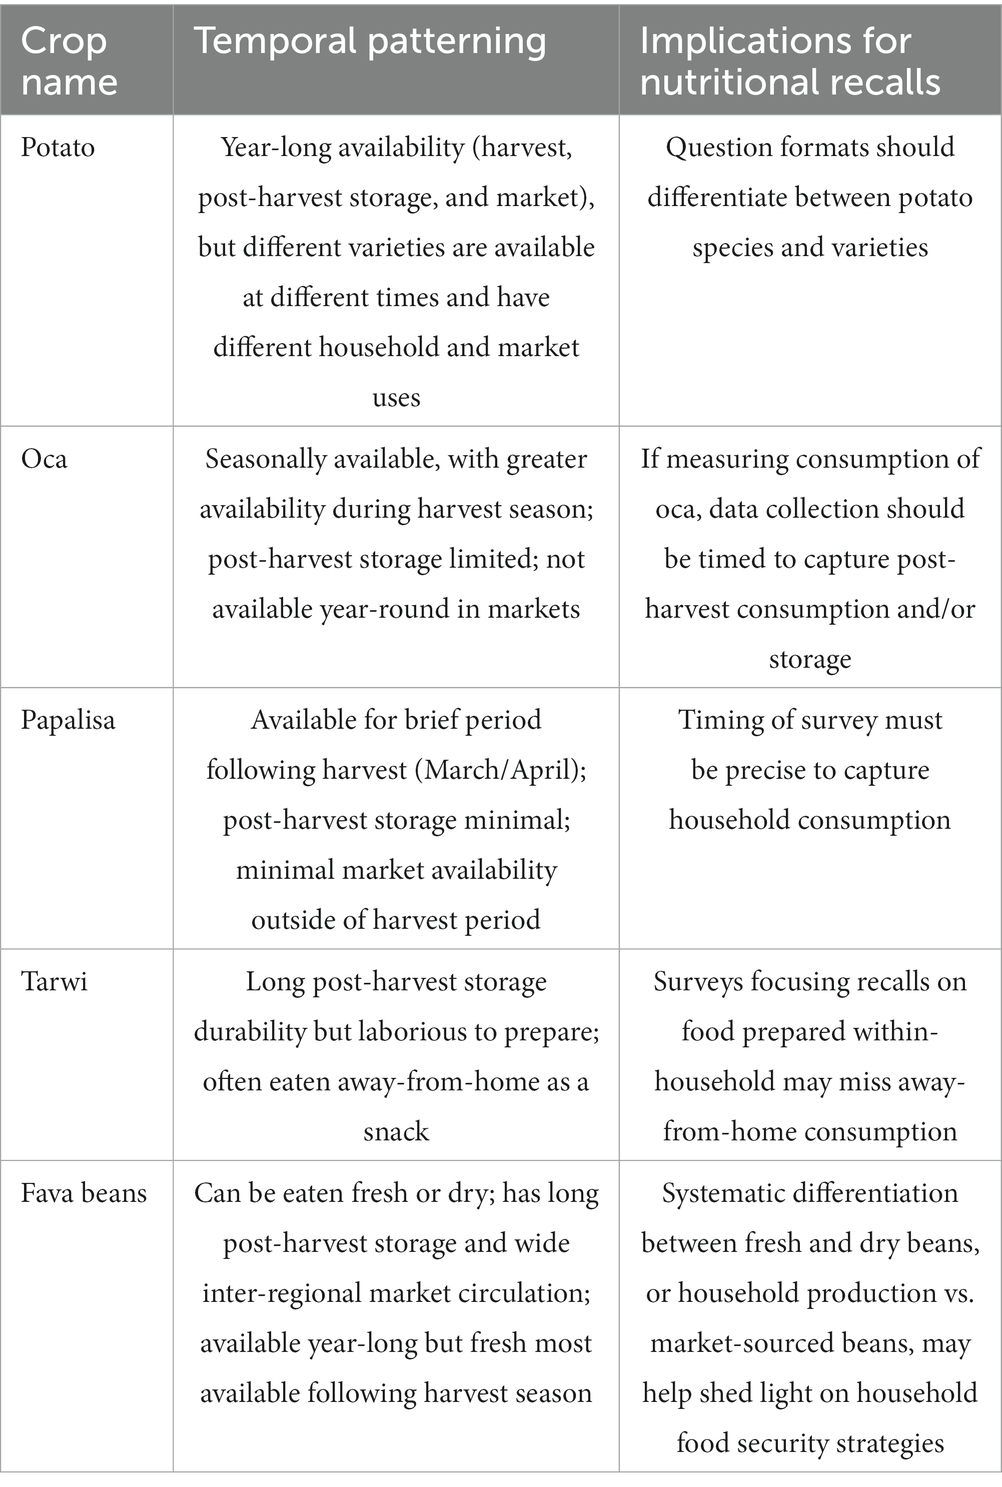
Table 9. Summary of ethnographic findings and implications for survey research.
Potatoes (Solanum spp.) are the main locally produced staple of Andean diets. When local farmers were asked to describe what “food security” meant to them, they referenced the length of time that own-produced potatoes lasted over the course of a given year. Potatoes and chuño (a derivative of potato) account for more than 30% of calories reported in the full survey sample. Further, a single native variety of potato, papa Huaycha, accounted for a major proportion of caloric availability in three of the surveyed sites. This variety can be classified as native (i.e., not formally improved), and is widely planted because it is suitable for both commercial and household purposes; because it has reliable productivity across a wide altitudinal range; because it has at least moderate resistance to diseases; and because seed is widely available.
But despite the predominance of papa Huaycha, “potato” is far from a monolithic category; there are two species and many different varieties of potatoes (at least 60) cultivated in the study region, and these are cultivated for differing culinary, cultural and market purposes. For consumption, potato-producing households generally divide potato into two categories: harinosa (floury varieties) and aguachenta (watery varieties). Harinosa varieties are usually preferred for home consumption, and are used in soups, or boiled to be eaten as an accompaniment to other meals. Aguachenta varieties are considered best for frying (e.g., making French fries), and are usually produced primarily for the market. Papa Huaycha and Papa Imilla (see Tables 6, 7) are harinosa varieties, whereas Papa Holandesa is an aguachenta variety.
Harinosa varieties can include potatoes from the species Solanum tuberosum Andigenum group, tetraploid cultivars (4x; usually round tubers) and diploid cultivars (2x; long or oblong tubers; often somewhat wavy). While round-shaped potato varieties, especially larger-sized tubers (e.g., papa Huaycha), are often peeled and cut to eat in soups, or cooked to prepare in other dishes, non-commercial native varieties (e.g., papa qoyllu) are often prepared by boiling with the skin on, and can be served alongside other dishes, or carried as a self-contained meal for fieldwork (sometimes eaten with cheese or a chile-based sauce, llajua). Many of the non-commercial native varieties have brightly colored (blue, red, or yellow) flesh. Some varieties (e.g., papa Pintaboca, papa Candelero) have recently experienced increased market demand, both for home and restaurant consumption, and for industry (e.g., the production of purple potato chips).
Households also produce (and eat) varieties of other potato species, including S. juzepczukii (in the puna ecoregions) and, less commonly diploid cultivars of S. tuberosum Andigenum group (formerly S. phureja; usually in the Yungas ecoregion). These are produced in lesser quantities and are typically for home consumption (not market). S. juzepczukii varieties often produce small, bitter potatoes, which have historically been used to make chuño, a freeze-dried potato of long storage duration. The varieties formerly known as S. phureja (papa pureja) are distinctive in that they do not have a period of dormancy, and tubers must be replanted soon after they are harvested, enabling multiple cycles of planting and harvest per year (but also increasing labor requirements).
Potatoes may be available in markets throughout the year, due to differing timings of planting and harvest in different parts of the country. With the exception of pureja variety, the factors most affecting how long households can live from their potato crops are post-harvest storage conditions and how much they choose to produce. Potatoes do not last long in storage. In high areas where low temperatures predominate, they can be stored for about 4 months, but usually due to the diffuse light of traditional warehouses, after 3 months the potatoes already have sprouts and are slightly dehydrated.
Because some crops are considered “minor” crops for food security (like S. juzepczukii varieties in the puna ecoregion), and may be more susceptible to pests and diseases due to climate change (Gregory et al., 2009; Castillo and Plata, 2016; Keleman Saxena et al., 2016a), farmers may choose to produce less of them, dedicating more of their agricultural land and labor to producing varieties that have reliable market and food security uses.
Oca (Oxalis tuberosa) is a tuber crop native to the Andes, which has a sweet flavor, similar to sweet potato, and is rich in Vitamin A (Cadima Fuentes, 2006). In Colomi, it is planted at the beginning of the rainy season in September–October, and is generally harvested in the main harvest season (March–June), alongside varieties of potato. There are no formally improved varieties of oca in Bolivia; all are farmer-saved and vegetatively propagated.
Freshly harvested oca can be cooked similarly to potato or vegetables, and it is often used as a component of dishes that include many ingredients (like soup or samay). Oca can also be boiled or roasted and be served as an accompaniment or side-dish to a meat-based meal. However, in these forms it is usually added for texture and flavor, but not as the meal’s basic starch.
Oca has a shelf-life of several weeks to several months, when stored in cool dry conditions. If these conditions are not available, oca tubers can rot, or exit dormancy and begin to sprout. To combat short shelf-lives, oca can also be freeze-dried as chuño (like potatoes). However, while the first author (Keleman Saxena) did observe households preparing oca chuño during fieldwork for this project, she never observed people consuming it. This conforms to the experiences of the second author (Cadima Fuentes), who observes that local farmers seldom mention crops which are consumed only occasionally, at home, or species that are grown, for example, on the edges of the plots or between the rows of major crops.
Households usually consume farm-produced oca within a few months of harvest, and they may sell excess production as a cash-crop. The seasonal concentration of oca consumption is evidenced in Table 8. In the 2013 (post-planting) survey, only 0.15% of all calories reported across all households came from oca, whereas 0.93% of calories reported in the post-harvest survey of 2014 came from this crop. This more-than-five-fold increase likely reflects the greater seasonal availability of oca in the period of the year immediately following the harvest, vs. declining availability in later parts of the year.
Like oca, papalisa (Ullucus tuberosus) is a tuber native to the Andes, planted at the beginning of the rainy season (September–October). The main harvest period is around March/April, near the time of the Easter holidays (semana santa in Bolivia). Papalisa does not store well for long periods, and is not typically made into chuño. Papalisa has not been formally improved by plant-breeders in Bolivia, and propagative material (seed tubers) are entirely farmer-circulated.
Papalisa is commonly made for dishes served around semana santa, which is a major public holiday in Bolivia, as in much of Latin America. It has a flavor similar to beets and is often used in soup- and stew-type preparations, e.g., sajta de papalisa. Many urban migrants return home for semana santa, and urban residents also take days off to celebrate.
Because of this, the harvest of papalisa usually produces a large amount at a concentrated time-period. Farmers use some of it for home-consumption, and sell some to meet high market demand during this holiday period. Papalisa is less readily available in markets during the rest of the year. This is reflected in Table 8; papalisa was absent from household culinary recalls conducted in 2013, and accounted for only 0.59% of calories reported in 2014. Notably, neither of these surveys fell within the major period of papalisa harvest, having been conducted in Oct-Dec 2013 and May–July 2014.
Tarwi (Lupinus mutabilis) is a protein-rich leguminous crop in the lupin family, native to the Andes. Tarwi is a long-duration crop, both in terms of its growing season and its storage potential. It is planted in the main rainy season, like potatoes, and is not harvested until May–June of the following year. The grain, like a bean, is dry and can be stored for long periods, when protected from pests. Because of its durability, farmers reported waiting to harvest this crop until all other crops were out of their fields. At the time of this research, tarwi had not been formally improved in this region, and the seed system was entirely farmer-circulated.
Preparing tarwi for consumption requires a significant time and water. The grains must first be boiled, like beans. After boiling, they must be rinsed with water for a long period of time in order to remove alkaloids that are toxic. Typically, in rural areas, this rinsing is done by placing a container of boiled tarwi in a clean, cold stream with running water for a period of 3–4 days, to reduce the alkaloid content.
After tarwi has been boiled and rinsed, it can be used for many preparations, but it is most commonly served as a snack (mote). People eat the beans one by one, popping them out of their husks with their fingers. Though it may be consumed at home, tarwi is most often sold in small individual portion-sized plastic bags by vendors at roadside toll booths on the highway, and eaten as a snack while traveling. In 2012–2014 it was much less frequently observed in restaurants or home settings, though chefs were experimenting with including tarwi dishes on their menus (e.g., tarwi pure). However, it was near ubiquitous in public transport, particularly on the hour-long route linking Cochabamba and Colomi.
The low reported level of tarwi consumption in the surveys may reflect these consumption patterns. Survey respondents were asked to complete the culinary recall considering the last day that they cooked at home. While this day sometimes coincided with a day when they also went to the market (and hence some food-away-from-home was recorded), in most cases it did not, and hence consumption of tarwi is likely to have been under-reported using this method.
Fava beans (Vicia faba, or haba in Spanish and Quechua) is a crop originally from the Mediterranean, but considered to be “Andeanized.” In addition to being well adapted to high-altitude cultivation, it is thoroughly integrated in Andean cuisine, and is consumed in soups, stewed preparations, as a side-dish, or as a snack (mote or toasted grain).
Fava bean is planted at the end of winter—beginning of spring in Colomi (July–September) and comes into production in the following year (January–April). Fava bean can be prepared to eat when it is green, or can be dried and saved to eat later in the year. Fava is a high-producing crop and households often plant it both for home consumption and for sale in the market. Like potato, it has a broad market circulation in Bolivia, due to its long storage capacity (when beans are dried), and to differing timings of production and harvest across different regions of the country.
Fava bean is important as a food-security crop, and may be particularly important in the post-planting season when few other agricultural crops are available. This is evidenced by its relatively greater importance in the 2013 (post-planting) round of surveys (accounting for 1.58 and 2.43% of all calories in the longitudinal and cross-sectional samples, respectively; see Table 8), vs. the post-harvest round (when it accounted for 0.87 and 0.73% of calories reported for these two groups). The potential for long-term post-harvest storage as dried beans (haba seca) may underpin this long-duration importance, though culinary recalls did not systematically differentiate between dried and fresh fava as an ingredient.
The survey data reported here paints a picture of household diets which rely heavily—although not exclusively—on Native, improved, and Andeanized crops. This is important because this basic characterization is not emphasized in much of the recent literature on agrobiodiversity and FSN. Many recent studies focus on the question of whether, all else being equal, agrobiodiversity does a better job of producing food security outcomes than other available dietary options. However, studies documenting the extent to which local diets rely on agrobiodiversity to cover basic needs are less frequent. The descriptive data presented here demonstrate that agrobiodiversity makes an important contribution to caloric availability at the household level for houses along a wide rural–urban gradient in Bolivia, which is complemented by other shelf-stable processed food options. As such, agrobiodiversity (and particularly potatoes) can be understood as a bedrock of food availability, and hence of food security and nutrition.
The results reported here are consistent with greater consumption of locally cultivated foods (including native crops, improved, and introduced) during the seasons of greatest abundance. Andeanized crops represent an exception to this pattern, which might be explained by the fact that many of the foods in this category, such as wheat, barley, or dried fava beans, can be stored for long periods post-harvest. Hence it may be that the availability of these foods is greater in the post-planting season, relative to other crops.
The consumption patterns reported here may also reflect a more subtle dynamic between the availability of food and the availability of cash. For farming communities (low and high puna and sub-tropics), the time of greatest availability of locally produced food is also an important time of cash influx from the sale of their harvest. People may then use this cash to buy foods they do not cultivate. This dynamic may account for the increased consumption of improved crops in the post-harvest season in these three regions, given that this category includes a group of crops that are usually produced from formally improved (and often purchased) seed, and which may not be grown by all small-scale farmers. A similar dynamic might be reflected in the small increase in processed food in the high puna in the post-harvest season.
Interestingly, meat and animal-based percentage of caloric availability decreased across the three rural sites in the post-harvest, as compared to the post-planting seasons. Though this may seem counter-intuitive, it is consistent with the findings of researchers in the Peruvian Andes. Scurrah et al. (2013), found that in the lean season a greater proportion of the diet came from animal source foods because the availability of other food sources was limited.
The contrast between rural and urban diets observed in this dataset largely tracks what one might expect from the larger literature. Writing on the “nutrition transition” suggests that with greater concentration in urban areas, diets based on animal-source foods and processed foods with higher fat content become more common (Caballero and Popkin, 2002). Accordingly, in the urban survey sample, between 50 and 68% of total caloric availability came from animal-source and processed foods. However, the large decrease in the percentage of calories from processed foods between the post-planting and post-harvest surveys suggests that price and availability may influence urban residents’ food sourcing choices. This decrease is not countered by a proportionate increase in any other single category of food. Rather, it appears that urban residents shifted their consumption toward all other crop-type categories during the post-harvest period, when there is a greater abundance of produce at lower prices.
These choices may not be a function of price alone, but also of preference. Many of the residents of urban Cochabamba are recent migrants from rural areas, or descendants of relatively recent rural migrants, and continue to place cultural value on dishes made from locally cultivated foods. For some urban consumers, these consumption patterns may reflect what is known locally as a “nostalgia market,” that is a continuation of consumption habits that were developed during childhoods in rural areas, and which they continue as a reinforcement of identity and cultural memory even while living in urban sites.
The survey data reported demonstrate potatoes to be the most important (and most agrobiodiversity-rich) crop in local diets in the study sites, including both the rural sites and the urban survey site. Most other native and traditional crops made only minor dietary contributions, measured in caloric terms, to local diets. However, ethnographic data describing how locally produced foods are used outside of the narrow frame of a 24-h recall demonstrate some important limitations of the dietary recall dataset. Dietary recall methods—even when carried out in repeat visits to the same household—may miss foods that are consumed seasonally or away-from-home. This is evidenced in the current dataset by seasonal differences in reported consumption (e.g., for fava bean and oca); and by limited reporting of consumption of widely available crops whose key period of consumption does not coincide with the period of the survey (e.g., oca, papalisa).
Hence, while dietary recall surveys may be useful to identify which foods are consumed in high quantities in the regions, days, and seasons of the survey, they may not be suitable for capturing locally produced crops that are most essential for food security in different seasons (e.g., plentiful vs. scarce) or under unexpected conditions (e.g., bad harvest years). A follow-on implication is that in regions prone to scarcity, 24-h recalls under “normal” conditions may underreport “emergency” foods, which are available for consumption when more preferred foods are scarce. In this way, dietary recalls may be prone to underestimating the importance of agrobiodiversity as insurance against hard times.
Adjustments to research methods may correct for some (but not all) of these issues. Panel (repeat-visit) surveys increase the range of circumstances that survey respondents report, but they are expensive and time-consuming, and single-visit household surveys are common. Furthermore, while a single survey timed in the post-harvest season may capture agrobiodiversity in the diet to a greater extent than a pre-harvest survey, even this approach may miss the complex patterning of food availability and consumption over many seasons. That is, foods that can be easily stored for a longer period, like dried fava beans, tarwi or chuño, may appear less important in a post-harvest survey precisely because they are being saved for “lean” seasons of the year.
Mixed methods research can compensate for some shortcomings of surveys, especially when qualitative research is undertaken prior to survey design, in order to better understand what will (and will not) be captured if surveys are conducted at specific times of year. For projects and research questions requiring a highly detailed quantitative dataset, more frequent surveys (e.g., quarterly or monthly) with a smaller population size might capture some of the temporal patterning of agrobiodiversity consumption. However, such surveys are time intensive, both for survey-takers and respondents. When undertaking more frequent surveys, it would be necessary to budget adequate time and funds for data management, and it might be appropriate to pay interviewees for their time.
For research questions that do not require highly detailed quantitative data, a lighter-footprint approach might combine ethnographic work with food frequency recalls, querying the timing of consumption of specific locally produced crops which have demonstrated importance for food security, nutrition, or agrobiodiversity conservation. For example, this type of approach might help to capture data about agrobiodiversity consumption that takes place near the times of particular festivities or festivals. Rather than repeating large-scale surveys near all festival periods (which might be difficult due to lack of availability of both interviewers and survey respondents), a sub-sample of a larger survey might be chosen to undertake short food frequency recall immediately following key festive periods (like the Easter holidays), in order to record fluctuations in the consumption of key crops of interest (like papalisa).
Consumption of such crops at occasional festivals (like weddings) might be slightly more difficult to capture, but in many places these types of festivals also cluster seasonally, and may effectively be community-wide events. Hence qualitative work might also identify key moments and points-of-entry (for example, interviewing the preparers of food served at community gathering) to capture the importance of agrobiodiversity during these moments of festival consumption.
Another mixed-methods approach might build on the principles of lot quality assessment sampling (or spot-checking), using a sample of quantitative information as a base for building qualitative information. For example, in another research project on forest-based livelihoods (Fischer et al., 2023), the first author has used surveys to select households for “stratified” semi-structured interviews. This selection takes households that represent the “tails” of a given variable of interest (high and low values), and then approaches these households for follow-up interviews to provide qualitative, contextual data about the conditions that lead to the quantitatively measured outcomes.
Finally, it is also important to consider when and whether surveys (and the quantitative data they provide) are the best approach for understanding the dynamic interactions between agrobiodiversity and food security. Qualitative research can also be designed to approach questions about, for example, the implications of agrobiodiversity loss for households’ nutritional choices. Qualitative inquiry can provide information on, for example, what households do to substitute key native crops with other foods when they are not available. Researching these choices can help to identify likely food security strategies in the event of agrobiodiversity disappearance (e.g., replacing one crop with another, vs. replacing agrobiodiversity with processed food), and who is most likely to implement them. This in turn may help to project the larger implications of food-system change, and can help to inform food and agricultural policy in this arena.
While the temporal patterning of agrobiodiversity availability and consumption presents challenges to survey methods, household-level surveys can nonetheless be valuable for assessing the role of locally cultivated agrobiodiversity in overall dietary patterns. This is especially so when methods differentiate among varieties that might be counted as a single food in a standard nutritional recall (e.g., among the different species and varieties of potato).
The survey data reported here did this by designing survey questions to prompt respondents to report ingredients used to make dishes, rather than prepared foods. This differs from a standard nutritional recall at an individual level, which might ask someone about how many plates of a given dish (e.g., sajta de papalisa) they ate, and would then calculate nutrient content of that dish based on reference values (typical values for that dish). However, the preparation of “typical” dishes can vary widely, as can the presence/absence of specific ingredients in those dishes, depending on cost, availability, and the preparer’s preference. Hence a “culinary recall” (asking about food prepared at an ingredient-by-ingredient level, and adjusting caloric availability for the number of people eating at each meal) may be a better approach for detailed assessments of variety-level agrobiodiversity in the diet.
A culinary recall requires some prior knowledge on the part of the survey designer. The culinary recall format used in the current project is shared in Supplementary material. Notably, we did not ask for variety-level data for all types of food reported—this would not have made sense for foods reported outside of the region. Rather, we asked for variety-level data for crops for which there was significant agrobiodiversity (potato, oca, etc.).
This approach is not immune to error, and relies heavily on the knowledge and training of survey enumerators. For example, in the data reported here, mentions of generic “potato” (vs. specific varieties of potato) were higher in the first-round surveys (N = 180 mentions; data not shown) than in the second (N = 138 mentions; data not shown). Since there is no such thing as a generic potato, this difference likely reflects learning on the part of the survey takers, who became better able to prompt respondents to describe and identify specific potato varieties in the second (2014) round of the survey, as compared to the first.
Training for enumerators introducing them to some of the most commonly named varieties of locally prominent species might help to reduce this error, as might reference materials showing images of varietal types that enumerators and survey respondents could use for clarification. However, given the fact that agrobiodiversity is managed dynamically in-situ (giving the possibility that new varieties might emerge), and that varietal names may have variable relationships with meaningful genetic diversity (Sadiki et al., 2007), surveys of this kind may simply always need to assume some margin of error in measuring varietal diversity.
Survey research in this field has emphasized the use of dietary diversity (developed from food-group scores) as a way to better understand the contribution of agrobiodiversity to nutrition (High Level Panel of Experts (HLPE), 2017). There are major advantages to this approach, including ease of survey design and implementation, and the extent to which dietary diversity helps connect nutrition to biodiversity at the scale of larger managed and non-managed ecological landscapes (Powell et al., 2015; High Level Panel of Experts (HLPE), 2017; Gergel et al., 2020). However, like standard 24-h dietary recalls, the methods used to calculate dietary diversity scores are not likely to provide the degree of fine-grained detail that would allow for differentiation among closely related species of crops, or at the sub-species (e.g., variety or landrace) level. This may be a particularly important lacunae for research in centers of origin and diversity of major staple crops, like potatoes, rice, maize, or wheat.
For this reason, the research reported here used caloric contribution of specific varieties to measure the relative contributions of field crop diversity to household diets. Macronutrient reference values for the majority of crop species are relatively widely available, although a focus on calories may under-value the importance of the micronutrient contributions of agrobiodiversity, especially in low-carbohydrate (e.g., lower calorie) foods. Even so, this approach allows for a rough comparison of the importance of, for example, locally cultivated tubers in households’ overall diets.
Another approach to measuring the dietary contributions of agrobiodiversity would be to compare micronutrient values of reported crops and varieties. However, this approach poses challenges in a comparative framework, because different crop species and varieties are rich in different micronutrients. Finding a positive association between dietary species richness and micronutrient adequacy, Lachat et al. (2018) proposed dietary species richness as a measure of food biodiversity and nutritional quality. However, this measure may still be too broad to capture the importance of within-species diversity, especially for Andean diets, which rely heavily on potatoes.
Compounding this challenge, research demonstrates that within a species or variety there may be important intra-species variability in the availability of specific micronutrients (King and Gershoff, 1987; George et al., 2002; Campos et al., 2006; de Haan et al., 2010, 2012; Gabriel et al., 2014; Suárez et al., 2014). For example, a study comparing Iron (Fe) and Zinc (Zn) content in native Andean potato species found significant differences in Zn content between species and varieties, and found that while inter-species differences in Fe were not statistically significant, the overall range of Fe content of samples varied by a factor of 6 (ranging from 2.3 to 14.5 mg/kg). Critically, the authors point out, the varieties they analyzed all had higher levels of these two important micronutrients than levels reported in the more widely consumed papa Huaycha, suggesting that there is scope for improving micronutrient adequacy in the Andes by promoting the consumption of local potato varieties (Gabriel et al., 2014). Better understanding the extent to which the consumption of micronutrient rich species and varieties of potatoes is already influencing nutritional adequacy in households that consume, for example, purple or yellow-fleshed potatoes vs. white-fleshed potatoes, is an important arena for future research linking agrobiodiversity conservation in staple crops to household diets.
Data gathered via nutritional surveys does have the potential to shed light on the relationships linking agrobiodiversity and FSN, but such data does not automatically identify how or whether the surrounding food system supports agrobiodiversity conservation. To answer such questions, it is important to have additional information about, for example, the history of plant breeding in the region; major subsistence and market uses of key food crops; and how these crops move from farm to market to table. For such analysis, differentiation at the sub-species (varietal level) may be critical, especially in systems where different varieties have different nutritional and economic values, differing market outlets, and differing culinary uses.
The data on potato varieties presented here offer an example. To understand diet as a driver of agrobiodiversity conservation in this region of Bolivia, it is significant that formal improvement of potato varieties has not led to a differentiation between “commodified” and “non-commodified” seed in the same way as in other crops. Potato is a vegetatively propagated crop, and farmers typically save their seed tubers from year to year, although they may periodically refresh propagative material (especially if viruses have been introduced). The most widely cultivated variety in Colomi, Papa Huaycha, has not undergone formal improvement, and while many other widely cultivated varieties in the region have had some formal improvement, and the line between “native” and “improved” varieties is not stark.
This contrasts with a crop like maize, where the choice to use hybrid seed typically implies a commitment to re-purchasing seed every year. For potatoes, the line between farmer-improved varieties and varieties formally improved by crop breeders is much more fluid, as is the line between own-produced seed tubers and “refreshed” seed tubers. (Notably, a similar trend holds for maize in this high-altitude region, where seed is primarily farmer-saved; in Bolivia, hybrid maize is available only for lowland tropical cultivation conditions.)
Hence, for the more commonly consumed species of potato (S. tuberosum Andigenum group, diploid and tetraploid cultivars, in this site), small-scale agriculture for a combination of home and market purposes integrates agrobiodiversity conservation with nutrition, relying on annual seed selection by farmers and periodic refreshment of seed. In contrast, for a crop like hybrid maize, high reliance on formally improved varieties for food security may indicate that farmer-derived varieties are being pushed out of the system due to larger political-economic pressures. However, in the food system described here, the reliance on a mixture of “native” and “native improved” varieties can be interpreted to indicate a food system that robustly supports agrobiodiversity conservation for the major potato species (S. tuberosum Andigenum group, diploid and tetraploid cultivars).
However, for less widely planted potato varieties and species (e.g., S. juzepczukii in puna ecoregions, papa pureja in the Yungas, and some other less pest-resistant varieties of S. tuberosum Andigenum group, diploid and tetraploid cultivars), biodiversity conservation is more precarious. These varieties are, to some extent, being out-competed for space in farmers’ fields by other potato varieties, or other crops. This competition is attributable in some part to changing climatic and market factors which make yields of these varieties less reliable for farmers (cf. Keleman Saxena et al., 2016a,b), thereby curtailing their utility as food security crops for households. Even so, biodiversity conservation is dynamic, and it may not be necessary for species or varietal diversity to be distributed evenly across households for diversity to remain in the system. A few farmers who are “custodians” of rare varieties may effectively maintain and re-introduce seed to other farmers (even other “custodians”), supporting the conservation of varieties which are “minor” for day-to-day food security, but remain valued for their cultural meanings or uses.
For these less widely planted crops, research and development interventions may also be possible to help maintain agrobiodiversity in the food system. For example, in the time since the research reported here was conducted, Fundación PROINPA (the local project partner) has undertaken significant efforts to bolster the presence of tarwi in the food system. Formal crop improvement work by PROINPA has resulted in 4 new varieties of tarwi, now registered in Bolivia’s National Registry of Varieties (though their diffusion is still limited due to the lack of a formal seed production system). In parallel, PROINPA has also promoted the development of a small company, PANASERI4 which processes tarwi under high-standard sanitary conditions. This results in a commercial tarwi product (mote de tarwi) which can be consumed with the husk on. This is recommended because of the calcium and fiber content of the husk. In the long-run, such developments have the potential to increase both the supply of tarwi seed and market demand for the product within an urbanizing context, bolstering agrobiodiversity-driven food security in the Cochabamba food system.
This article considers the importance of understanding the spatial and temporal patterning of local food availability and consumption in order to better assess the role that agrobiodiversity plays in FSN in high-agrobiodiversity regions. It also shows evidence that this temporal patterning may relate to spatial patterns in consumption, especially in food consumed away from home (e.g., tarwi). Both spatial and temporal patterning of agrobiodiversity consumption, if not accounted for in nutritional surveys, may limit the extent to which important elements of agrobiodiversity are captured by standard dietary recall methods.
These observations coincide with both past and current conversations in the larger literature on agrobiodiversity conservation and smallholder agriculture. In the early 2000s, Karl Zimmerer, a prominent scholar of agrobiodiversity in the Andes, published an article with the title “Just small potatoes (and ulluco)?” which examined the relationship between seed size micro-variation in cultivated lands in the high-altitude Andes. His mixed-methods data called into question the predominant narrative that larger tubers were “better” seed than small tubers, demonstrating that farmers saw advantages and disadvantages to each, and that they preferred to plant large tubers in areas that were more likely to be drought-stressed, reserving smaller tubers for higher-altitude, less stressed agricultural sites (Zimmerer, 2003). These data demonstrated that farmers’ seed-saving practices were difficult to assess by a singular size-based metric (e.g., small vs. large tubers), and rather responded contextually to spatial variations in the agroecological environment.
More recent literature examining the role of non-cultivated biodiversity in FSN (Gergel et al., 2020) makes a similar argument at a larger scale. The authors note that different forest types—that is, not only primary forest, but also disturbed secondary forest, edge habitats, agroforestry, and others—can make important contributions to diets. They argue that understanding land cover complexity, or the distribution of these types in relationship to forest users’ needs, uses, and access, is critical to assessing the role of wild biodiversity in FSN. Such observations suggest that understanding the interlinkages between agrobiodiversity and FSN requires these relationships to be spatially contextualized.
The present article contributes to scholarly conversations about the methodologies needed to measure the nutritional contribution of “small potatoes,” or other native, traditional, and/or locally produced crops, emphasizing the importance of not only spatial context, but also temporal patterning. This is important because farmers conserve, and consume, locally produced, agrobiodiverse foods for reasons which go beyond nutritional input; they are also important esthetically (Weaver et al., 2019), and for reasons of cultural memory and food sovereignty (Nazarea, 2006). Hence, policy recommendations derived from studies whose methods do not to account for temporal and spatial patterning of agrobiodiversity consumption risk downplaying the importance of locally produced crop species and varieties. Researchers can better align their work with intersectionality-based approaches (Hankivsky et al., 2014) by adopting mixed-methods approaches which will allow them to better target the timing of survey-based research, and to assess what can—and cannot—be measured in the time-frames adopted for nutritional recalls.
The datasets presented in this article are not readily available because generalized data re-use statements for human subjects research were only required for data collection starting in 2017. As the IRB approval for this project was solicited and granted in 2012, the data was collected with the assumption that it would be held in confidence by the research team and not used for future purposes not in keeping with the initial research questions. Inquiries about the data should be directed to YWxkZXIua2VsZW1hbi1zYXhlbmFAbmF1LmVkdQ==.
The studies involving human participants were reviewed and approved by the Yale University Human Subjects Committee. Written informed consent for participation was not required for this study in accordance with the national legislation and the institutional requirements.
AKS had primary responsibility for research conceptualization, data collection, data analysis, and writing. XCF advised research design, facilitated data collection, and contributed to interpretation of results. DH advised and oversaw research design, data collection, and data analysis, and contributed to the conceptualization and writing of the manuscript. All authors contributed to the article and approved the submitted version.
This project was supported by the National Science Foundation (DDIG in Geography; #1131153), the Yale-NYBG Cullman Fellowship, the Yale McMillan Center International Dissertation Research Fellowship, the Wilbur G. Downs Fellowship, the Yale Tropical Resources Institute, the Yale Program in Agrarian Studies, the Yale Institute for Biospheric Studies, and the PEO Scholar Award. In Bolivia, institutional support for this research was provided by Fundación PROINPA, World Vision—Colomi Branch, and the Universidad Mayor de San Simón’s Instituto de Investigaciones Biomédicas (IIBISMED).
The authors declare that the research was conducted in the absence of any commercial or financial relationships that could be construed as a potential conflict of interest.
All claims expressed in this article are solely those of the authors and do not necessarily represent those of their affiliated organizations, or those of the publisher, the editors and the reviewers. Any product that may be evaluated in this article, or claim that may be made by its manufacturer, is not guaranteed or endorsed by the publisher.
The Supplementary material for this article can be found online at: https://www.frontiersin.org/articles/10.3389/fsufs.2023.1000735/full#supplementary-material
1. ^Of note, there has been a marked improvement in these conditions since the time that this data was collected. In children under age 5, Bolivia’s 2016 Demographic and Health Survey found a national average prevalence of 20.3% of chronic undernutrition, and a prevalence of 18.5% in Cochabamba (Instituto Nacional de Estadística Bolivia, 2017).
Anderzén, J., Guzmán Luna, A., Luna-González, D. V., Merrill, S. C., Caswell, M., Méndez, V. E., et al. (2020). Effects of on-farm diversification strategies on smallholder coffee farmer food security and income sufficiency in Chiapas, Mexico. J. Rural Stud. 77, 33–46. doi: 10.1016/j.jrurstud.2020.04.001
Barrett, C. B. (2010). Measuring food insecurity. Science 327, 825–828. doi: 10.1126/science.1182768
Berti, P. R. (2015). Relationship between production diversity and dietary diversity depends on how number of foods is counted. Proc. Natl. Acad. Sci. U. S. A. 112:E5656. doi: 10.1073/pnas.1517006112
Berti, P. R., and Jones, A. D. (2013). “Biodiversity’s contribution to dietary diversity: magnitude, meaning, and measurement” in Diversifying food and diets: using agricultural biodiversity to improve nutrition and health. eds. J. Fanzo, D. Hunter, T. Borelli, and F. Mattei (London: Routledge), 186–206.
Caballero, B., and Popkin, B. M. (2002). “Introduction” in The nutrition transition. eds. B. Caballero and B. M. Popkin (New York, NY: Elsevier), 1–6.
Cadima Fuentes, X. (2006). “Tubérculos” in Botánica económica de los Andes Centrales. eds. M. Moraes Ramírez, B. Ollgaard, L. P. Kvist, F. Borchsenius, and H. Balslev (La Paz: Universidad Mayor de San Andrés), 347–369.
Campos, D., Noratto, G., Chirinos, R., Arbizu, C., Roca, W., and Cisneros-Zevallos, L. (2006). Antioxidant capacity and secondary metabolites in four species of Andean tuber crops: native potato (Solanum sp.), mashua (Tropaeolum tuberosum Ruiz & Pavón), Oca (Oxalis tuberosa Molina) and ulluco (Ullucus tuberosus Caldas). J. Sci. Food Agric. 86, 1481–1488. doi: 10.1002/jsfa.2529
Castillo, J. A., and Plata, G. (2016). The expansion of brown rot disease throughout Bolivia: possible role of climate change. Can. J. Microbiol. 62, 442–448. doi: 10.1139/cjm-2015-0665
Coa, R., and Ochoa, L. (2009). Bolivia: Encuesta Nacional de Demografía y Salud. Ministerio de Salud y Deportes y Instituto Nacional de Estadística. La Paz, Bolivia.
de Haan, S., Burgos, G., Arcos, J., Ccanto, R., Scurrah, M., Salas, E., et al. (2010). Traditional processing of black and white Chuño in the Peruvian Andes: regional variants and effect on the mineral content of native potato cultivars. Econ. Bot. 64, 217–234. doi: 10.1007/s12231-010-9128-x
de Haan, S., Burgos, G., Ccanto, R., Arcos, J., Scurrah, M., Salas, E., et al. (2012). Effect of production environment, genotype and process on the mineral content of native bitter potato cultivars converted into white chuño: effect of production environment, genotype and process on mineral content in white chuño. J. Sci. Food Agric. 92, 2098–2105. doi: 10.1002/jsfa.5589
Ekesa, B., Walingo, M., and Abukutsa-Onyango, M. (2009). Influence of agricultural biodiversity on dietary diversity of preschool children in Matungu division, western Kenya. Afr. J. Food Agric. Nutr. Dev. 8, 390–404. doi: 10.4314/ajfand.v8i4.19200
Fischer, H., Saxena, A., Saxena, A. K., Dutta, A., and Jantz, P. (2023). Creating evidence for forest based resilience during Covid-19. SLU.SE. Available at: https://www.slu.se/en/departments/urban-rural-development/research/rural-development/finished-projects/forest-based-resilience/ (Accessed May 20, 2023).
Food and Agriculture Organization of the United Nations. (1999). Sustaining the multiple functions of agricultural biodiversity (background paper no. 1, cultivating our futures). FAO/Netherlands Conference on “The multifunctional character of agriculture and land,” Maastricht.
Food Fortification Initiative. (n.d.). Americas: region profile [WWW Document]. Food fortification initiative enhancing grains healthier lives. Available at: https://www.ffinetwork.org/americas (Accessed July 21, 2022).
Gabriel, J., Botello, R., Casazola, J. L., Vera, R., Rodríguez, F., and Angulo, A. (2014). Revalorización de las papas nativas de Bolivia (Solanum tuberosum L.) como fuente de hierro y zinc. J. Selva Andina Res. Soc. 5, 3–12. doi: 10.36610/j.jsars.2014.050100003
George, M. S., Lu, G., and Zhou, W. (2002). Genotypic variation for potassium uptake and utilization efficiency in sweet potato (Ipomoea batatas L.). Field Crops Res. 77, 7–15. doi: 10.1016/S0378-4290(02)00043-6
Gergel, S. E., Powell, B., Baudron, F., Wood, S. L. R., Rhemtulla, J. M., Kennedy, G., et al. (2020). Conceptual links between landscape diversity and diet diversity: a roadmap for transdisciplinary research. Bioscience 70, 563–575. doi: 10.1093/biosci/biaa048
Gibson, R. S. (2022). Principles of nutritional assessment. 3rd Edn. Oxford, UK: Oxford University Press.
Gitagia, M. W., Ramkat, R. C., Mituki, D. M., Termote, C., Covic, N., and Cheserek, M. J. (2019). Determinants of dietary diversity among women of reproductive age in two different agro-ecological zones of Rongai Sub-County, Nakuru, Kenya. Food Nutr. Res. 63. doi: 10.29219/fnr.v63.1553
Gregory, P. J., Johnson, S. N., Newton, A. C., and Ingram, J. S. I. (2009). Integrating pests and pathogens into the climate change/food security debate. J. Exp. Bot. 60, 2827–2838. doi: 10.1093/jxb/erp080
Hankivsky, O., Grace, D., Hunting, G., Giesbrecht, M., Fridkin, A., Rudrum, S., et al. (2014). An intersectionality-based policy analysis framework: critical reflections on a methodology for advancing equity. Int. J. Equity Health 13:119. doi: 10.1186/s12939-014-0119-x
High Level Panel of Experts (HLPE) (2017). Sustainable Forestry for Food Security and Nutrition. HLPE Report #11. Rome, Italy: FAO Committee on World Food Security (CFS).
Ickowitz, A., Powell, B., Salim, M. A., and Sunderland, T. C. H. (2014). Dietary quality and tree cover in Africa. Glob. Environ. Change 24, 287–294. doi: 10.1016/j.gloenvcha.2013.12.001
Instituto Nacional de Estadística Bolivia (2017). Encuesta de Demografia y Salud EDSA-2016. Instituto Nacional de Estadística Bolivia, La Paz, Bolivia.
Jones, A. D. (2017). Critical review of the emerging research evidence on agricultural biodiversity, diet diversity, and nutritional status in low- and middle-income countries. Nutr. Rev. 75, 769–782. doi: 10.1093/nutrit/nux040
Jones, A. D. (2014). The production diversity of subsistence farms in the Bolivian Andes is associated with the quality of child feeding practices as measured by a validated summary feeding index. Public Health Nutr. 18, 329–342. doi: 10.1017/S1368980014000123
Jones, A. D., Creed-Kanashiro, H., Zimmerer, K. S., de Haan, S., Carrasco, M., Meza, K., et al. (2018). Farm-level agricultural biodiversity in the Peruvian Andes is associated with greater odds of women achieving a minimally diverse and micronutrient adequate diet. J. Nutr. 148, 1625–1637. doi: 10.1093/jn/nxy166
Jones, A. D., Shrinivas, A., and Bezner-Kerr, R. (2014). Farm production diversity is associated with greater household dietary diversity in Malawi: findings from nationally representative data. Food Policy 46, 1–12. doi: 10.1016/j.foodpol.2014.02.001
Keleman Saxena, A. (2017). Out of the field and into the kitchen: agrobiodiversity, food security, and food culture in Cochabamba, Bolivia (doctoral dissertation). Yale University, New Haven, CT.
Keleman Saxena, A., Cadima Fuentes, X., Gonzales Herbas, R., and Humphries, D. L. (2016a). Indigenous food systems and climate change: impacts of climatic shifts on the production and processing of native and traditional crops in the Bolivian Andes. Front. Public Health 4:20. doi: 10.3389/fpubh.2016.00020
Keleman Saxena, A., Cadima Fuentes, X., Illanes Velarde, D., and Humphries, D. (2016b). Consumption of native and traditional crops in Bolivia varies along an ecoregional gradient. FASEB J. 30:891.12. doi: 10.1096/fasebj.30.1_supplement.891.12
Keleman Saxena, A., Sampso, D., Cely Santos, M., Limeberry, V., Luna González, D. V., Montenegro de Wit, M., et al. How Agrobiodiversity Nourishes: Mapping causal webs that generate agrobiodiversity, food security, food sovereignty, and nutrition. Manuscript submitted for publication.
King, S. R., and Gershoff, S. N. (1987). Nutritional evaluation of three underexploited andean tubers: Oxalis tuberosa (Oxalidaceae),Ullucus tuberosus (Basellaceae), Andtropaeolum tuberosum (Tropaeolaceae). Econ. Bot. 41, 503–511. doi: 10.1007/BF02908144
Lachat, C., Raneri, J. E., Smith, K. W., Kolsteren, P., Van Damme, P., Verzelen, K., et al. (2018). Dietary species richness as a measure of food biodiversity and nutritional quality of diets. Proc. Natl. Acad. Sci. U. S. A. 115, 127–132. doi: 10.1073/pnas.1709194115
Larson, B., Harris, O., and Tandeter, E. (Eds.) (1995). Ethnicity, markets, and migration in the Andes: at the crossroads of history and anthropology. Duke University Press, Durham.
Larson, B. (1998). Cochabamba, 1550-1900: Colonialism and agrarian transformation in Bolivia. Durham, NC: Duke University Press.
Lourme-Ruiz, A., Dury, S., and Martin-Prével, Y. (2021). Linkages between dietary diversity and indicators of agricultural biodiversity in Burkina Faso. Food Secur. 13, 329–349. doi: 10.1007/s12571-020-01137-5
Luna-González, D. V., and Sørensen, M. (2018). Higher agrobiodiversity is associated with improved dietary diversity, but not child anthropometric status, of Mayan Achí people of Guatemala. Public Health Nutr. 21, 2128–2141. doi: 10.1017/S1368980018000617
Lynn, L. (n.d.) Fried Bread (Bunuelo) Recipe [WWW Document]. https://www.food.com/recipe/fried-bread-bunuelo-307915 (Accessed May 3, 2023).
Meadows, D. H. (1999). Leverage points: places to intervene in a system. The Sustainability Institute, Hartland, VT.
M’Kaibi, F. K., Steyn, N. P., Ochola, S. A., and Du Plessis, L. (2017). The relationship between agricultural biodiversity, dietary diversity, household food security, and stunting of children in rural Kenya. Food Sci. Nutr. 5, 243–254. doi: 10.1002/fsn3.387
Murra, J. V. (1985). “‘El archipelago vertical’ revisited” in Andean ecology and civilization. eds. S. Masuda, I. Shimada, and C. Morris (Tokyo, Japan: University of Tokyo Press), 3–13.
Nazarea, V. D. (2006). Local knowledge and memory in biodiversity conservation. Annu. Rev. Anthropol. 35, 317–335. doi: 10.1146/annurev.anthro.35.081705.123252
Neito, C. C., and Estrella, E. J. (2011). La Agrobiodiversidad en los Ecosistemas de Páramo: Una primera aproximación a su situación actual. in P. Mena Vásconez, A. Castillo, S. Flores, R. Hofstede, C. Josse, and B. Lasso, S., G. Medina, N. Ochoa, and D. Ortiz (Eds.), Páramo: paisaje estudiado, habitado, manejado e institucionalizado. ECOBONA, Quito, 41–62.
Powell, B., Bezner Kerr, R., Young, S. L., and Johns, T. (2017). The determinants of dietary diversity and nutrition: ethnonutrition knowledge of local people in the east Usambara Mountains, Tanzania. J. Ethnobiol. Ethnomedicine 13:23. doi: 10.1186/s13002-017-0150-2
Powell, B., Hall, J., and Johns, T. (2011). Forest cover, use and dietary intake in the east Usambara Mountains, Tanzania. Int. For. Rev. 13, 305–317. doi: 10.1505/146554811798293944
Powell, B., Thilsted, S. H., Ickowitz, A., Termote, C., Sunderland, T., and Herforth, A. (2015). Improving diets with wild and cultivated biodiversity from across the landscape. Food Secur. 7, 535–554. doi: 10.1007/s12571-015-0466-5
Remans, R., Wood, S. A., Saha, N., Anderman, T. L., and DeFries, R. S. (2014). Measuring nutritional diversity of national food supplies. Glob. Food Secur. 3, 174–182. doi: 10.1016/j.gfs.2014.07.001
Saaka, M., Osman, S. M., and Hoeschle-Zeledon, I. (2017). Relationship between agricultural biodiversity and dietary diversity of children aged 6-36 months in rural areas of northern Ghana. Food Nutr. Res. 61:1391668. doi: 10.1080/16546628.2017.1391668
Sadiki, M., Jarvis, D. I., Rijal, D., Bajracharya, J., Hue, N. N., Camacho Villa, T. C., et al. (2007). “Variety names: an entry point to crop genetic diversity and distribution in agroecosystems?” in Managing biodiversity in agricultural ecosystems. eds. D. I. Jarvis, C. Padoch, and H. D. Cooper (New York, NY: Columbia University Press), 34–76.
Sauer, K. O. (1969). Seeds, spades, hearths, and herds: the domestication of animals and foodstuffs. MIT Press, Cambridge, MA.
Scurrah, M., Creed-Kanashiro, H., de Haan, S., Olivera, E., Ccanto, R., Carrasco, M., et al. (2013). Rich in agrobiodiversity but poor in nutrition: food security in communities of Chopcca, Huancavelica, Perú. Annals of nutrition and metabolism: paralleled Symposia. Presented at the 20th International Congress of Nutrition, Granada.
Scurrah, M., de Haan, S., Olivera, E., Ccanto, R. C., Creed-Kanashiro, H., Carrasco, M., et al. (2011). Ricos en agrobiodiversidad, pero pobres en nutricion: desafios de la mejora de la seguridad alimentaria en comunidades de Chopcca, Huancavelica [Peru]. Peru: El Problema Agrario En Debate SEPIA XIV: Dinamicas Territoriales, Seguridad Alimentaria, Desafios Ambientales, Mesa Regional: Piura. Seminario Permanente de Investigacion Agraria (SEPIA). Lima, 362–407.
Skarbø, K. (2014). The cooked is the kept: factors shaping the maintenance of agro-biodiversity in the Andes. Hum. Ecol. 42, 711–726. doi: 10.1007/s10745-014-9685-1
Suárez, S., Ale, N., Trabucco, J., and Sanabria, O. (2014). Polifenoles, micronutrientes minerales y potencial antioxidante de papas nativas. Rev. Soc. Quím. Perú 80, 108–114. doi: 10.37761/rsqp.v80i2.155
Tejada Campos, T. N. (2008). El cultivo de trigo en la sierra norte del Perú: Triticum aestivum L. y Triticum durum L., Estación Experimental Agraria Baños del Inca, Instituto Nacional de Innovación Agraria. Cajamarca.
Vavilov, N. (1926). Studies on the origin of cultivated plants. Institute of Applied Botany and Plant Improvement, Leningrad.
Weaver, L. J., Tadess, Y., Stevenson, E. G. J., and Hadley, C. (2019). “I want variety!”: dietary variety as aesthetic pursuit, social signal, and nutritional vehicle in Brazil and Ethiopia. Hum. Organ. 78, 122–132. doi: 10.17730/0018-7259.78.2.122
Zhang, W., Gowdy, J., Bassi, A. M., Santamaria, M., deClerck, F., Adegboyega, A., et al. (2018). “Systems thinking: an approach for understanding ‘eco-agri-food systems,’” in TEEB for Agriculture & Food: Scientific and Economic Foundations. ed. The Economics of Ecosystems and Biodiversity (TEEB) (Geneva, Switzerland: UN Environment), 17–55.
Zimmerer, K. S. (2003). Just small potatoes (and ulluco)? The use of seed-size variation in “native commercialized” agriculture and agrobiodiversity conservation among Peruvian farmers. Agric. Hum. Values 20, 107–123. doi: 10.1023/A:1024097008693
Zimmerer, K. S. (1998). The ecogeography of Andean potatoes. Bioscience 48, 445–454. doi: 10.2307/1313242
Zimmerer, K. S. (1996). Changing fortunes: biodiversity and peasant livelihood in the Peruvian Andes, California studies in critical human geography. University of California Press, Berkeley, CA.
Zimmerer, K. S., de Haan, S., Jones, A. D., Creed-Kanashiro, H., Tello, M., Amaya, F. P., et al. (2020). Indigenous smallholder struggles in Peru: nutrition security, Agrobiodiversity, and food sovereignty amid transforming global systems and climate change. J. Lat. Am. Geogr. 19, 74–111. doi: 10.1353/lag.2020.0072
Keywords: agrobiodiversity, Bolivia, food security, nutrition, mixed methods, ethnography, dietary recall surveys
Citation: Keleman Saxena A, Cadima Fuentes X and Humphries DL (2023) On measuring “small potatoes”: spatio-temporal patterning of agrobiodiversity-as-food presents challenges for dietary recall surveys. Front. Sustain. Food Syst. 7:1000735. doi: 10.3389/fsufs.2023.1000735
Edited by:
Rakesh Bhardwaj, Indian Council of Agricultural Research (ICAR), IndiaReviewed by:
Stefania Grando, Consultant, Ascoli Piceno, ItalyCopyright © 2023 Keleman Saxena, Cadima Fuentes and Humphries. This is an open-access article distributed under the terms of the Creative Commons Attribution License (CC BY). The use, distribution or reproduction in other forums is permitted, provided the original author(s) and the copyright owner(s) are credited and that the original publication in this journal is cited, in accordance with accepted academic practice. No use, distribution or reproduction is permitted which does not comply with these terms.
*Correspondence: Alder Keleman Saxena, YWxkZXIua2VsZW1hbi1zYXhlbmFAbmF1LmVkdQ==
Disclaimer: All claims expressed in this article are solely those of the authors and do not necessarily represent those of their affiliated organizations, or those of the publisher, the editors and the reviewers. Any product that may be evaluated in this article or claim that may be made by its manufacturer is not guaranteed or endorsed by the publisher.
Research integrity at Frontiers
Learn more about the work of our research integrity team to safeguard the quality of each article we publish.