
94% of researchers rate our articles as excellent or good
Learn more about the work of our research integrity team to safeguard the quality of each article we publish.
Find out more
ORIGINAL RESEARCH article
Front. Sustain. Food Syst., 09 January 2023
Sec. Crop Biology and Sustainability
Volume 6 - 2022 | https://doi.org/10.3389/fsufs.2022.959681
This article is part of the Research TopicSystem Fertilization and Nutrient CyclingView all 5 articles
 Gustavo Duarte Farias1*
 Carolina Bremm1
 Christian Bredemeier2
 Jeferson de Lima Menezes1
 Lucas Aquino Alves3
 Tales Tiecher4
 Amanda Posselt Martins4
 Gabriela Paiva Fioravanço2Gabriela Petry da Silva2
 Paulo César de Faccio Carvalho1
The system fertilization approach emerged to improve nutrient use efficiency in croplands. This new fertilization concept aims at taking advantage of nutrient cycling within an agroecosystem to obtain maximum production from each nutrient unit. To monitor this effect, methodologies such as the Normalized Difference Vegetation Index (NDVI) are promising to evaluate plant biomass and nutrient content. We evaluated the use of NDVI as a predictor of shoot biomass, P and K uptake, and yield in soybean. Treatments consisted of two production systems [integrated crop-livestock system (ICLS) and cropping system (CS)] and two periods of phosphorus (P) and potassium (K) fertilization (crop fertilization—P and K applied at soybean sowing—and system fertilization—P and K applied in the pasture establishment). NDVI was evaluated weekly from the growth stage V2 up to growth stage R8, using the Greenseeker® canopy sensor. At the growth stages V4, V6, R2, and R4, plants were sampled after NDVI evaluation for chemical analysis. Soybean yield and K uptake were similar between production systems and fertilization strategies (P > 0.05). Soybean shoot biomass and P uptake were, respectively, 25.3% and 29.7% higher in ICLS compared to CS (P < 0.05). For NDVI, an interaction between the production system and days after sowing (P < 0.05) was observed. NDVI increased to 0.95 at 96 days after sowing in CS and to 0.92 at 92 days after sowing in ICLS. A significant relationship between NDVI and shoot biomass, and P and K uptake was observed (P < 0.05). Our results show that the vegetation index NDVI can be used for estimating shoot biomass and P and K uptake in the early growth stages of soybean crops, providing farmers with a new tool for evaluating the spatial variability of soybean growth and nutrition.
Soybean is one of the worldwide essential agricultural commodities for feeding the growing population, and their production requires a large amount of nutrients, mainly phosphorus (P) and potassium (K) (Divito and Sadras, 2014; FAO, 2017). Studies have shown that growing soybean production over time is accompanied by, in part, an increasing use of fertilizers (Tilman et al., 2001; FAO, 2018). In this sense, FAO (2019) estimates an average annual increase of 1.3% in world synthetic fertilizer demand for nitrogen (N), P, and K, and studies have shown that increases in fertilizer use can result in increased amounts of nutrients and toxins levels in ground and surface waters, incurring health and water purification costs and decreasing fishery and recreational values (Tilman et al., 2002; Kondraju and Rajan, 2019).
Food production requires large amounts of nutrients; N, P, and K are the most frequently deficient in soils. Considering that soybean has the capability to fix N from the atmosphere through a symbiotic relationship with rhizobium bacteria, P and K fertilizers are the main nutrients used on soybean crops with a direct influence on their development and productivity (Gonçalves et al., 2010). The deficiency of these nutrients can affect plant physiology due to its central role in many metabolic pathways, resulting in growth reduction, nutrient remobilization, and changes in carbon metabolism (Richardson et al., 2009), as well as decreased chlorophyll concentration in the leaves (Ayala-silva and Beyl, 2005).
Specialized agriculture decreased the diversity of agricultural commodities (Reinsch et al., 2021) and has changed the entire energy system and nutrient flow when compared to nature-mimicking ecosystems (Gates, 2003). Specialized agriculture of high input use disagrees with the principles and natural flow that exist in nature, bringing severe consequences such as loss of heterogeneity (Lemaire et al., 2014) as well as the biodiversity of soil, plants, insects, and birds (Kleijn et al., 2009). Thus, with population growth and greater demand for food sources, conservative attitudes are necessary to reconnect production with nature (Sollenberger et al., 2019).
Recently, sustainable intensification alternatives to specialized systems [i.e., integrated crop-livestock systems (ICLS), Carvalho et al., 2018] associated with the system fertilization approach (Farias et al., 2020) emerged as a modern tool based on the sustainable integration of food production and maintenance of environmental services (Bernardon et al., 2021). System fertilization consists of anticipating fertilizer application usually applied in the establishment of cash crops, to the winter/cover crop phase, to connect the different phases of a rotation system with the optimization of natural resources and minimal losses. In addition, it also facilitates the sowing operation of the cash crop, since this fertilizer is available in the system even before the process of implantation of the grain crop (Bernardon et al., 2021). Using this fertilization approach, the levels of synergy between the elements increase the nutrient use efficiency and influence the characteristics of the system (Martins et al., 2017), making it more robust, biodiverse, and resilient (Franzluebbers, 2007). This management strategy, in addition to generating economic benefits, contributes to raising the level of soil aggregates and to a better structural development of this complex and interconnected environment (Bronick and Lal, 2005).
To monitor food production systems, the use of remote and proximal sensing techniques has attracted attention recently owing to their many advantages, such as speed of measurement, precision, simple application, and the possibility to estimate several parameters related to crops. Spectral vegetation indices (e.g., Normalized Difference Vegetation Index—NDVI) have been widely used to evaluate the vegetation cover (Reinermann et al., 2020) and to monitor crop growth (Atzberger, 2013). NDVI can be used to estimate leaf area index (LAI) in wheat (Tan et al., 2020), and N fertilization and heat stress effect in maize (Elazab et al., 2016) and to monitor disease incidence level in soybean by spectral differences between infected plants when compared to healthy ones (Gazala et al., 2013). In this sense, nondestructive methodologies can be a valuable tool for determining the nutritional status of crops under field conditions, with low costs and labor requirements (Baresel et al., 2017). Therefore, NDVI can present a sensitive response to low LAI and soybean biomass within a specific phenological stage of the crop, providing important information in the detection of the potential yield in soybean crops (Kross, 2015). In fact, NDVI values are related to increases in shoot biomass, LAI, and soil cover fraction (Andrade et al., 2022) and can be used to monitor phenological stages and biomass production of soybean (Sarmiento et al., 2020).
We hypothesized that measurements of the NDVI can be used as a predictor of shoot biomass, P and K uptake, and yield in soybean crops. For this, we investigated these factors in an ICLS comparing the effects of system and conventional (crop) fertilization.
The experiment started in 2017 at the Agronomic Experimental Station of the Federal University of Rio Grande do Sul (EEA-UFRGS), located in Eldorado do Sul, southern Brazil (latitude 30°05'22”S and longitude 51°39'08”W and altitude 46 m). The region is characterized as subtropical humid “Cfa” according to the Köppen classification (Alvares et al., 2013). Annual average air temperatures were 19.8 and 19.2°C, and annual rainfall was 1,510 and 1,214 mm in 2017 and 2018, respectively. The monthly precipitation and the mean daily air temperature during the soybean growing seasons of 2017/2018 and 2018/2019 are shown in Figure 1. Mean air temperature in both seasons was similar to the historical mean air temperature at EEA-UFRGS (climate normal for the period 1970–2009). Furthermore, monthly precipitation in the growing season of 2017/2018 was close to the climate normal (1970–2009), while in the season of 2018/2019, the monthly precipitation between December 2018 and April 2019 was lower when compared to the climate normal, indicating a drier growing season (Figure 1). Soil is classified as an Acrisol, according to FAO (2015). Soil samples were taken at plot level in June 2017, from layer 0 to 10 cm depth, and presented 134, 239, and 627 g kg−1 of clay, silt, and sand, respectively. Besides, it presented organic carbon of 17 g kg−1, pH (H2O) of 3.9, and 94 and 97 mg dm−3 of available P and K by Melich-1, respectively. It also presented 1.1 cmol dm−3 of Ca and 0.5 cmol dm−3 of Mg and 14.9% of base saturation (V%) and 48.5% of Al saturation. Based on these analyses, 7.5 Mg ha−1 of dolomitic limestone [CaMg (CO3)2] with a total neutralization power of 72% was applied to the soil surface in August 2017 to raise soil pH to 6.0 (CQFS-RS/SC., 2016).
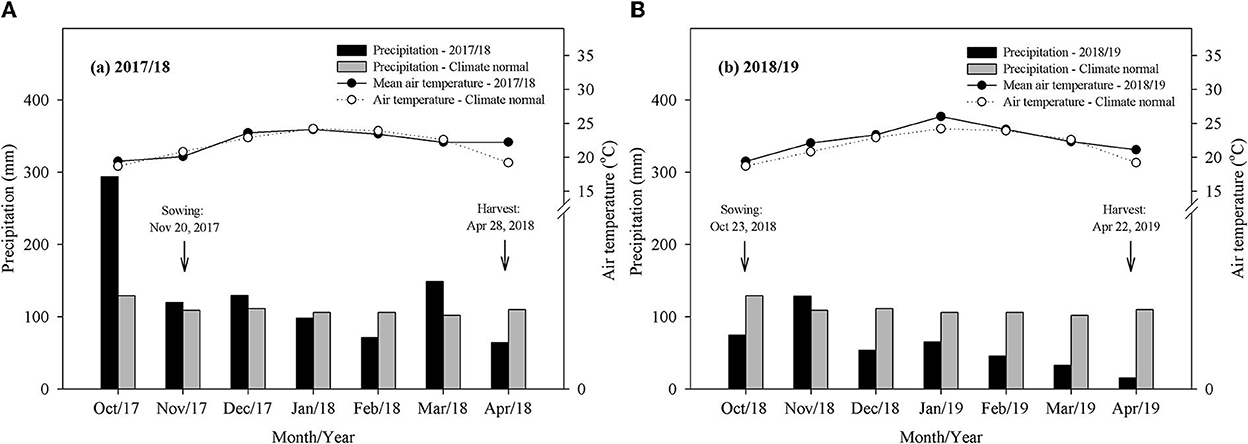
Figure 1. Monthly precipitation and mean daily air temperature at the Agronomy Experimental Station from the Federal University of Rio Grande do Sul during the soybean growing seasons of 2017/2018 (A) and 2018/2019 (B) and climate normal (1970–2009).
In 2017, the experimental area (4.8 ha) was arranged in a factorial model (2 × 2) in a randomized complete block design with four replicates (16 experimental units). The aim was to test the effect of the grazing animal (non-grazed system named “cropping system” (CS) or grazed system characterizing an integrated crop-livestock system named “ICLS”) and fertilization strategies (“crop fertilization”—P and K applied at soybean establishment—or “system fertilization”—P and K applied at the winter/cover crop phase). Thus, treatments were (i) ICLS with system fertilization—ICLS + SysF, (ii) ICLS with crop fertilization—ICLS + CF, (iii) cropping system with system fertilization—CF + SysF, and (iv) cropping system with crop fertilization—CS + CF (for more details, refer to Farias et al., 2020).
In both evaluated years (growing seasons of 2017/2018 and 2018/2019), Italian ryegrass (Lolium multiflorum) was cultivated in the autumn-winter period (pasture phase) and soybean (Glycine max.) was cultivated in the spring-summer period (crop phase). In the ICLS treatment, Italian ryegrass was grazed by sheep at ~10 months of age and an initial body weight of 24.5 ± 0.44 and 29.9 ± 2.9 in 2017 and 2018, respectively. The pasture was managed to keep the average sward height at 15 cm in a continuous stocking with a variable stocking rate according to the “Rotatinuous” grazing management concept (Carvalho, 2013). In the CS, Italian ryegrass was used as a non-grazed cover crop. N fertilization was applied in the pasture phase, regardless of the treatment, in the amount of 150 kg of N ha−1 performed in the form of urea when the plants presented three fully expanded leaves. At the end of the stocking period, glyphosate (3 L ha−1) and saflufenacil (100 g ha−1) were applied. Soybean seeds were treated with insecticide and fungicide, inoculated, and sown on 20 November 2017 and 23 October 2018, in rows spaced 0.45 m apart at a density of 36 seeds m−2, under no-tillage system. Soybean harvest occurred in every season at the end of April. Genotypes used were DM 5958 RSF IPRO (2017/2018) and NA 5909 RG (2018/2019). Fertilization rates for P2O5 and K2O were calculated for a soybean grain production of 4.0 Mg ha−1 and applied in the pasture or crop phase, according to the fertilization strategy.
The soybean phenological growth stage was evaluated weekly according to Fehr and Caviness (1977) over the growing seasons of 2017/2018 and 2018/2019. The soybean growth stage was determined when more than 50% of the plants are in this stage.
The NDVI was evaluated weekly from the phenological stage V2 (second trifoliolate—two sets of unfolded trifoliolate leaves) up to R8 (full maturity-−95% of the pods have reached their full mature color) using the handheld canopy sensor GreenSeeker® (Trimble Navigation Limited, Sunnyvale, CA, USA). This sensor is made up of electroluminescent diodes (LEDs) emitting radiation in the red and near-infrared (NIR) regions of the electromagnetic spectrum and the reflected radiation by the canopy in both regions is then measured by a silicon photodiode positioned in front of the device. The NDVI is determined by the relation: (ρNIR-ρR)/(ρNIR+ρR), where ρNIR and ρR denote the NIR (770 ± 15 nm) and red (660 ± 15 nm) reflectance, respectively. NDVI values can vary numerically from −1 to +1, with positive values indicating the vegetative vigor of the crop, while negative values indicate the presence of bare soil or the absence of vegetation (Liu et al., 2006). The equipment was positioned at ~1.0 m above the canopy, and readings were obtained for ten randomly distributed points (0.45 m2 for each point) in the paddock.
Soybean shoot biomass was determined at the phenological stages V4 (fourth trifoliolate—four unfolded trifoliolate leaves), V6 (sixth trifoliolate—six unfolded trifoliolate leaves), R2 (full flowering—open flower at one of the two uppermost nodes), and R4 (full pod—pods are 2 cm at one of the four uppermost nodes), by sampling plants in an area of 0.45 m2 in four randomly chosen points in each paddock. Shoot dry biomass was determined after drying the samples at 65°C until a constant mass was reached. The amount of accumulated P and K in shoots (P and K uptake) was determined by multiplying shoot dry biomass by the plant P and K concentrations. These analyses were performed according to the methodology proposed by Tedesco et al. (1995). P and K concentrations were determined spectrophotometrically by the addition of ammonium and aminonaphthalenesulfonic acid and by flame photometry, respectively, after acid digestion of the plant tissue (Tedesco et al., 1995).
Soybean grain yield at maturity (phenological stage R8) was evaluated by harvesting six randomly selected areas (0.9 m2 each) in each paddock and weighing the grains. Grain yield was extrapolated to “kg ha−1” and expressed at 130 g kg−1 of moisture.
Data were analyzed by analysis of variance (ANOVA) using a mixed model by the LMER function of package lme4 using the R software (version 4.1.1). The assumptions of normality, variance homogeneity, and independence of residuals were checked by the Shapiro test (P > 0.05), Bartlett test (P > 0.05), and visual residual analysis, respectively. The production system (ICLS vs. CS), fertilization strategy (crop fertilization vs. system fertilization), growth stage (V4, V6, R2, and R4), and their interactions were considered fixed effects in the statistical model. For soybean yield, only the production system, fertilization strategy, and its interaction were considered fixed effects. Random effects included paddock or block and year. Models with the inclusion of different random effects were tested and the best fit model was selected by the AIC criterion (Akaike, 1973). For NDVI, the fixed effects of the production system, fertilization strategy, days after sowing, and their interactions were considered fixed effects. For testing NDVI as a predictor, the model included the fixed effects of the production system, fertilization strategy, NDVI, year, and their interactions. As there was no significant effect of year and its interactions (P > 0.05), the model was simplified. Therefore, block and year were considered random effects. When the NDVI effect or its interaction was significant (P < 0.05), regression analyses (linear, non-linear, and polynomial) were tested, considering NDVI as an explanatory variable. As no relationship was established with NDVI in the R4 stage, the models were generated including only the stages V2, V4, and R2. When significant at 5% (P < 0.05), models were compared by the AIC criterion; the regression model with the smallest AIC value was selected.
Soybean yield was similar (2.886 ± 477 kg DM ha−1) between production systems and fertilization strategies (P > 0.05). Soybean biomass and P and K uptake presented no interaction (P > 0.05) between the production system and fertilization strategy, nor did their interactions with the growth stage (P > 0.05). A significant effect of the production system and soybean growth stage was observed for shoot biomass (P < 0.05, Figure 2A) and P uptake (P < 0.001, Figure 2B). In this sense, ICLS presented 25.3 and 29.7% higher soybean biomass and P uptake compared to CS across growth stages, respectively. K uptake increased significantly over the soybean growth stage (P < 0.001) and ICLS presented an 18.8% higher K uptake compared to CS (P = 0.06, Figure 2C). In contrast, the fertilization strategy presented no effect on soybean shoot biomass and P and K uptake. NDVI values increased during the growing cycle between the phenological stages V2 (second trifoliolate) up to R4 (full pod development) and decreased afterward (Figure 3). No interaction between the production system and the fertilization strategy (P > 0.05) was observed for NDVI, and neither was the effect of the fertilization strategy (P > 0.05). We observed an interaction between the production system and days after sowing (P < 0.05); thus, we tested different regression models for CS and ICLS. NDVI was adjusted to a quadratic regression model (Figure 3) as a function of days after sowing for both production systems (CS and ICLS): CS: y = −0.35 + 0.027x – 0.00014x2; R2adj = 0.7679; SE = 0.09; P < 0.001; ICLS: y = −0.19 + 0.024x-−0.00013x2; R2adj = 0.7160; SE = 0.09; P < 0.001. The quadratic regression models show an increase of NDVI until ~0.90 at 96 days after sowing in CS and until 0.92 at 92 days after sowing in ICLS (Figure 3).
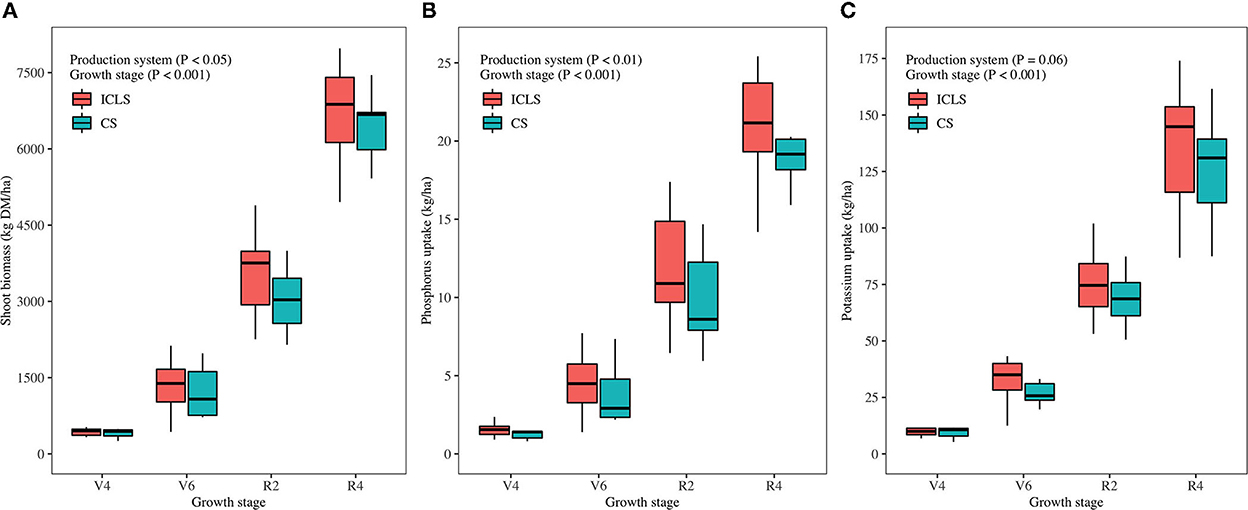
Figure 2. Soybean shoot biomass (A), phosphorus (B), and potassium (C) uptake along growth stages (V4, V6, R2, and R4) under two production systems: ICLS, Integrated crop-livestock system; CS, Cropping System.
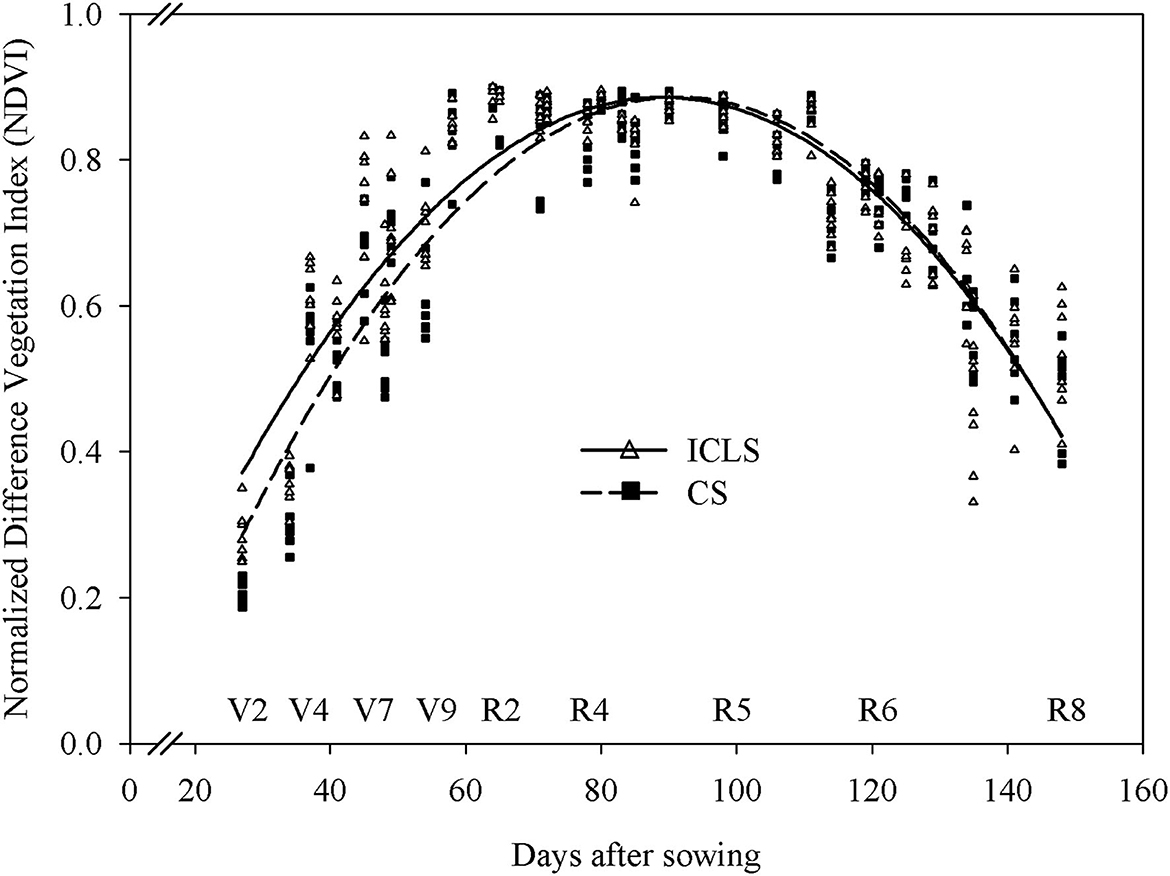
Figure 3. The Normalized Difference Vegetation Index (NDVI) along soybean growth (days after sowing) under two production systems: ICLS, Integrated crop-livestock system; CS, Cropping System.
The NDVI was closely related to shoot biomass of soybean for values of this index between 0.4 and 0.85, and the increase in biomass production within this range was reflected in linear increments in the NDVI values (Figure 4). Furthermore, no interaction was observed between NDVI, production system, and fertilization strategy (P > 0.05). A significant effect of NDVI was observed (P < 0.05), with shoot biomass adjusted to an exponential model (Figure 4), independent of treatment: y = −6194 + 3925.7x; R2adj = 0.8228; SE = 542.8; P < 0.001. Considering the regression model between the NDVI and shoot biomass, no significant interaction between the NDVI and the growing season was observed (P = 0.3735), indicating that the relationship between both variables was similar to the growing seasons of 2017/2018 and 2018/2019 and, therefore, a single model can be used to describe the association between the NDVI and soybean shoot biomass (Figure 4), regardless of growing season and treatments (production system—CS and ICLS, and fertilization strategy—CF and SysF).
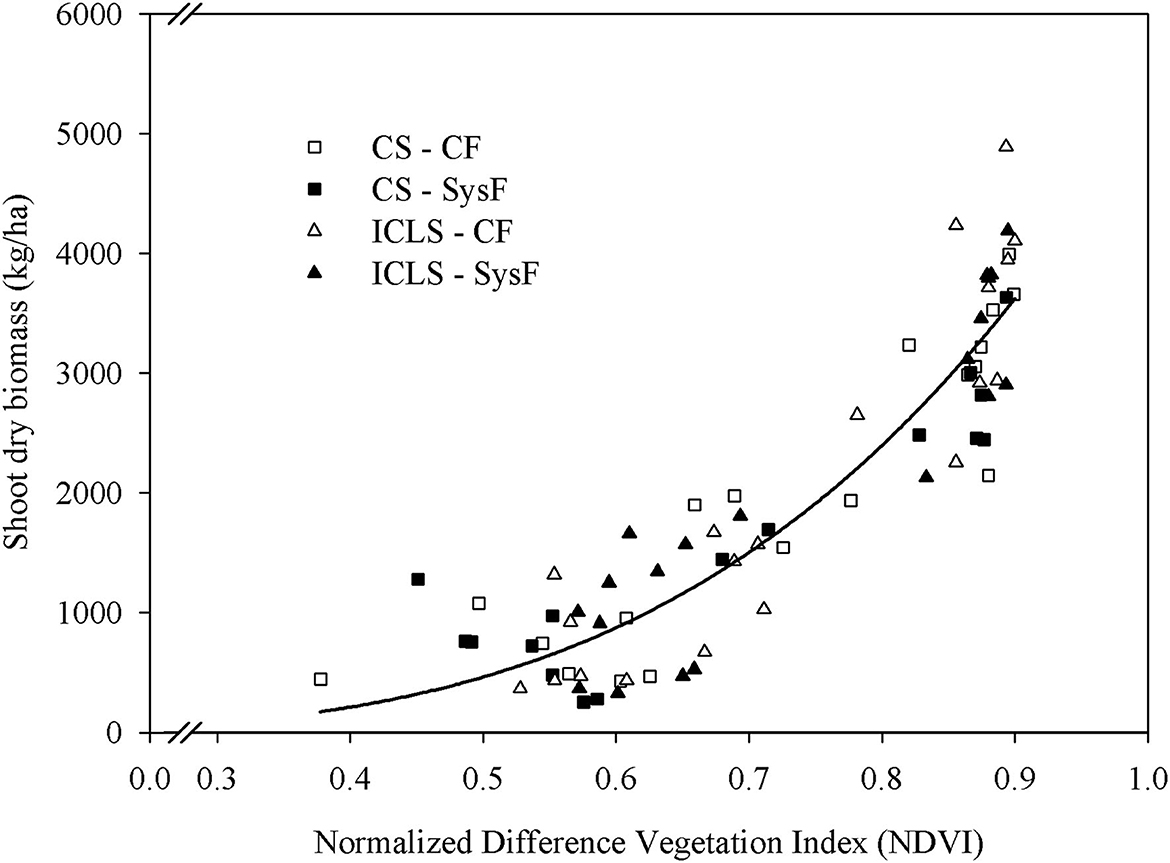
Figure 4. Relationship between soybean shoot biomass and the Normalized Difference Vegetation Index under the cropping system with crop fertilization (CS–CF), cropping system with system fertilization (CS–SysF), the integrated crop-livestock system with crop fertilization (ICLS–CF), or the integrated crop-livestock system with system fertilization (ICLS–SysF).
Similarly, the P and K uptake were related to the NDVI values in the early stages (V2, V4, and R2) (Figures 5, 6). An exponential model was adjusted for P uptake (P < 0.05), independent of treatment (Figure 5): y = −20.1 + 12.7x; R2adj = 0.7448; SE = 2.2; P < 0.001. No significant interaction between the NDVI and the growing season for P uptake was detected (P = 0.2512), indicating that a single regression model depending on the production system (CS and ICLS) can be used to describe the relationship between both variables (Figure 5), regardless of the growing season and the fertilization strategy.
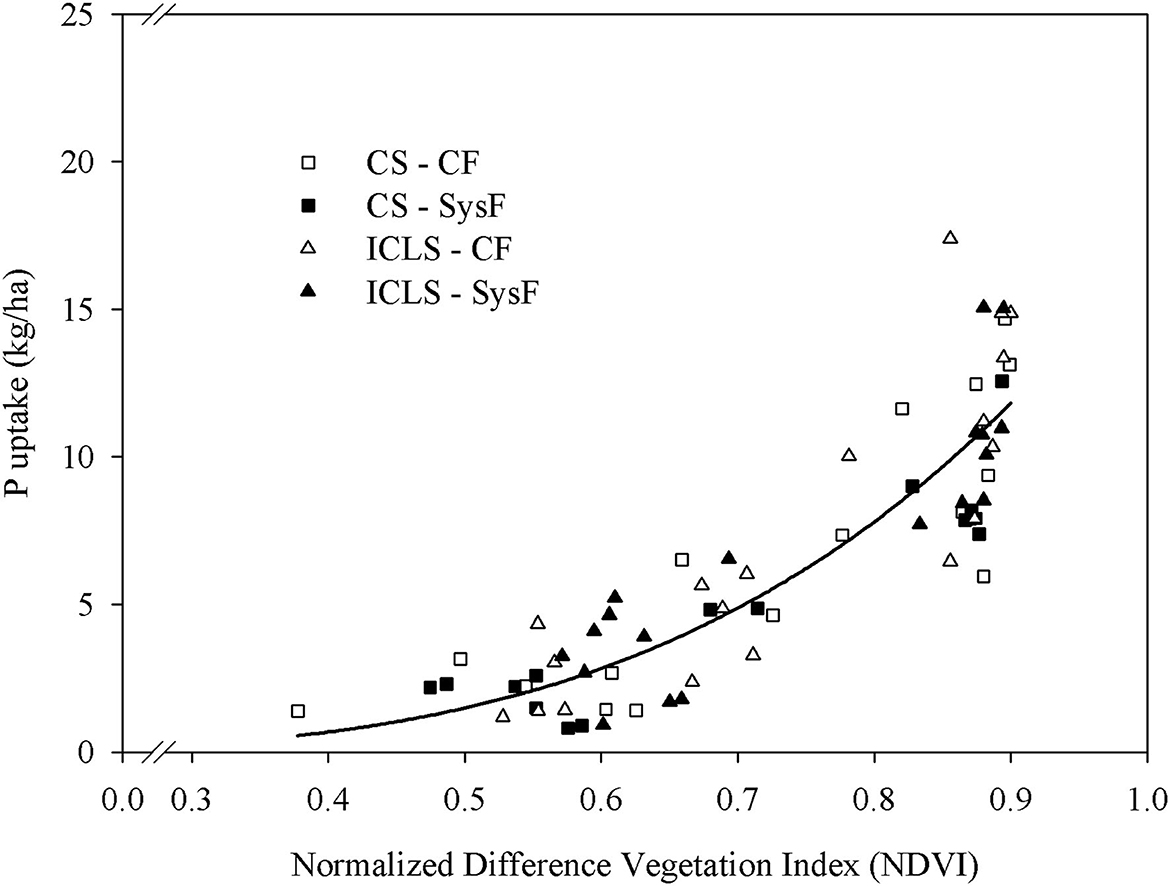
Figure 5. Relationship between phosphorus (P) uptake and the Normalized Difference Vegetation Index under the cropping system with crop fertilization (CS–CF), the cropping system with system fertilization (CS–SysF), the integrated crop-livestock system with crop fertilization (ICLS–CF), or the integrated crop-livestock system with system fertilization (ICLS–SysF).
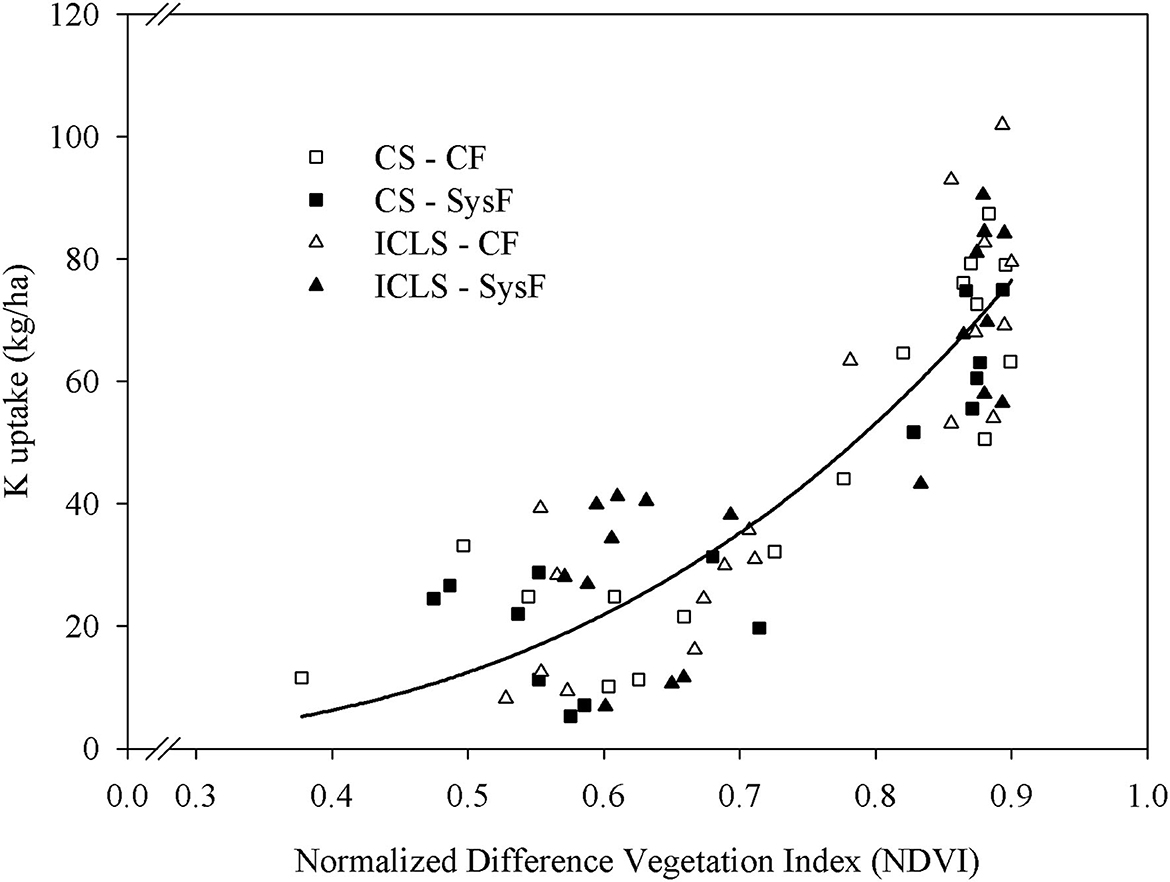
Figure 6. Relationship between potassium (K) uptake and the Normalized Difference Vegetation Index under the cropping system with crop fertilization (CS–CF), the cropping system with system fertilization (CS–SysF), the integrated crop-livestock system with crop fertilization (ICLS–CF), or the integrated crop-livestock system with system fertilization (ICLS–SysF).
Considering the K uptake, no interaction was observed between NDVI, production system, and fertilization strategy (P > 0.05, Figure 6). An effect of NDVI was observed (P < 0.05), with K uptake adjusted to an exponential model (Figure 6), independent of treatment: y = −115.3 + 76.7x; R2adj = 0.7468; SE = 13.4; P < 0.001. Furthermore, no significant interaction between the NDVI and the growing season was observed for K uptake (P = 0.6781), so a single model can be used to describe the association between both variables, regardless of production system and fertilization strategy (Figure 6).
The NDVI values were affected by the progress of the growing cycle of the soybean. In general, the quadratic behavior of NDVI values shown in Figure 3 could be related to the fact that NDVI increased until ~90 days after sowing (phenological stage R4–R5), decreasing afterward up to the harvest maturity (phenological stage R8). NDVI dynamics between growth stages V2 (25 days after sowing) and R4 (full pod) was affected by grazing, being higher for the ICLS. This effect may be related to a higher plant biomass of soybean promoted by the ICLS (Figure 2A), since an interaction effect of the production system and days after sowing (P < 0.05) was observed (Figure 3). Grazing can affect the subsequent crop, and grazing intensity is a key factor. Kunrath et al. (2015) evaluated grazing intensities in a long-term ICLS and found that under moderate or light grazing intensity (20, 30, or 40 cm of sward height), soybean presented a similar growth pattern and yield compared to the non-grazed treatment.
Throughout its growing cycle, soybean tends to accumulate photoassimilates in the vegetative growth stages and has the highest NVDI values in the reproductive stages. The increase in NDVI values from V2 up to R4 is related to an increase in shoot biomass and LAI. The more leaf layers in the canopy, the higher the LAI and, consequently, the lower the visible and the higher the near-infrared reflectance, resulting in higher NDVI values (Figure 3). In the subsequent growth stages, as shown in Figure 3, the values tend to stabilize and then decrease, as the plant begins to mobilize its reserves for the reproductive organs, in addition to the starting of leaf senescence and, consequently, chlorophyll degradation (Duan et al., 2017; Kuiawski et al., 2017).
The NDVI was positively correlated to soybean shoot biomass up to 5,000 kg ha−1 of biomass, corresponding to an NDVI value of approximately 0.90 (Figure 4). This relationship was not affected by the production system and the fertilization approach. Afterward, the absence of a significant relationship from this point on can be explained by the saturation that occurs with the NDVI when the plant reaches its maximum accumulation of biomass. There is an exponential relationship between NDVI and shoot biomass until 5,000 kg ha−1 of dry biomass. After that, no relationship can be found between both variables. According to Werner et al. (2018), in the early growth stages, the reduced shoot biomass results in lower canopy closure, while, in the reproductive growth stages, the interrow spaces close, resulting in the NDVI saturation effect, i.e., even with increasing soybean shoot biomass, the NDVI value remains stable, as shown for shoot biomass and P and K uptake (Figures 4–6).
The saturation effect is especially important when considering the NDVI, which considers for its calculation the crop reflectance in the red and NR regions of the electromagnetic spectrum. The reflectance in the red region is the one that presents the greatest variation throughout the crop development cycle, since the red radiation is mainly absorbed by chlorophylls for the photosynthetic process, resulting in high absorption and low reflectance throughout the development of the crop. Thus, with the increase in LAI, there is an increase in the absorption in the red band by chlorophylls, reducing the reflectance until the moment when, even with a high LAI, the reflectance is not reduced, remaining constant (about 3–4%) and resulting in the saturation effect. This effect occurs in situations of high biomass production, high LAI, and/or high degree of soil cover by the crop. In this condition, even if there is an increase in these parameters, the values of NDVI do not change.
Several studies involving the NDVI have been conducted to identify variability in biomass production, amount of nutrients absorbed, and productivity estimation in wheat (Raun et al., 2005; Vian et al., 2018; Trentin et al., 2021), soybean (Miller et al., 2018; Araújo et al., 2020), and irrigated rice (Ali et al., 2014; Zhang et al., 2019). In our study, soybean yield was not associated with NDVI evaluated in the growth stages V4, V6, R2, and R4. In contrast, Ma et al. (2001) obtained R2 = 0.80 between the spectroradiometer NDVI at R5 and soybean yield, while Araújo et al. (2020) reported an R2 = 0.53 at the R1 growth stage (beginning of flowering) between both variables. This behavior may be related to the lower variability of the NDVI and the saturation of this index with the advance of the soybean growing cycle and to the phenotypic plasticity of the plant. Differences in soybean biomass production can be distinguished in the early growth stages. However, with the advance in crop development, the variability decreases, and the biomass no longer shows a significant difference promoted by different plant populations or nutrient availability. The phenotypic plasticity is promoted by changes in plant height and number of nodes and branches, resulting in wide adaptability of the crop to different management conditions, e.g., changes in plant density or nutrient availability (Rambo et al., 2003).
Soybean yield was not affected by the production systems and fertilization strategies, which demonstrates that P and K nutrients were not limiting in the four evaluated systems. This result shows that ICLS with system fertilization is promising in releasing the fertilizers applied in the pasture phase. Moreover, grazing imposes a continuous recycling of nutrients through animal excreta and low nutrient export in animal liveweight, compared to grain harvesting (Williams, 2007; Alves et al., 2019; Arnuti et al., 2020). In a recent study, Farias et al. (2020) showed a positive impact of system fertilization on the productivity of agroecosystems. They found higher forage production compared to crop fertilization and similar soybean grain production between both approaches, promoting the optimization of land use.
The NDVI is obtained by the following relationship: (NIR-R)/(NIR+R), where NIR and R refer to the near-infrared and red reflectance, respectively. This index presents a numerical variation from −1 to +1, with positive values indicating the vegetative vigor of the crop, while negative values indicate the absence of vegetation or soil exposure (Rouse et al., 1973; Liu et al., 2006). By means of reflectance evaluations, vegetation sensors, such as the Greenseeker®, are able to capture the spectral properties of the canopy, which are related to the nutritional status of the plant (Mulla, 2013). The sensors perform readings in the radiation absorption bands in the visible range (480–680 nm), which are related to the absorption of incident radiation by chlorophyll molecules, and in the NIR range (700–1,300 nm), where there is high reflectance by vegetation.
The increase in NDVI due to greater shoot biomass accumulation (Figure 4) may be explained by the spectral signature of the soybean in the red and NIR regions of the electromagnetic spectrum. The greater the accumulation of photosynthetically active biomass, the higher the reflectance of NIR radiation, and the lower the reflectance of red radiation, resulting in an increase in NDVI value (Smith et al., 2017), which indicates a greater amount of chlorophyll and biomass of the crop. The wavelength in the red spectral range is absorbed by the chlorophylls, making the reflectance values decrease as the chlorophyll contents increase. On the other hand, the reflectance values in the NIR region are an indirect measure of the amount of biomass (Peñuelas and Filella, 1998).
Therefore, NDVI measured by a canopy sensor was suitable to differentiate soybean growing conditions between the V2 and R4 growth stages provided by different production systems (Figure 2) and between shoot biomass variations up to the value of 5,000 kg ha−1 (Figure 4). Remote sensing tools, such as vegetation sensors, can help to estimate the nutritional status of the crop, in real time, throughout the development of the plants. The principle of the functionality of these sensors is, basically, to capture the different lengths of electromagnetic radiation reflected by the plants, generating vegetation indices that can be quantified and, later, used to generate information on the nutritional conditions of the plants in the area under study, such as biomass and chlorophyll content (Khanal et al., 2017). Vegetation indices, such as the NDVI, can be used to detect invasive plants in crop areas (Merotto et al., 2012) and to estimate biomass and grain productivity (Schaefer and Lamb, 2016; Sanodiya et al., 2017).
In this sense, the use of NDVI as an indicator of the nutritional status of the plant in relation to P and K must be preceded by the analysis of its relationship with the traditional variables used to quantify the nutritional status of the plants (Raun et al., 2005), as P and K uptake (Figures 5, 6). According to our results, the estimation of P and K uptake in the early growth stages to identify its deficiency in soybean crops based on the NDVI is feasible, which ensures agility to these evaluations in a nondestructive way, improving the efficiency of P and K fertilization and providing farmers with a new tool for evaluating the spatial variability of soybean growth and nutrition.
Our findings highlight that ICLS presents higher soybean shoot biomass and P uptake compared to CS, without a difference in K uptake. The crop and system fertilization strategies are similar in terms of soybean shoot biomass and P and K uptake. The use of vegetation index NDVI is promising in differentiating an ICLS from CS in terms of soybean growth. Furthermore, NDVI can be used for estimating shoot biomass and P and K uptake in the early growth stages of soybean crops (until stage R2). In contrast, soybean yield cannot be estimated by the NDVI evaluated in the growth stages V4, V6, R2, and R4.
The raw data supporting the conclusions of this article will be made available by the authors, without undue reservation.
Conceptualization: PF, CaB, GF, TT, and AM. Statistical analysis, data curation, and visualization: GF, CBrem, and CBred. Investigation and project administration: GF and LA. Writing: GF, CBrem, JL, CBred, LA, TT, GF, GS, AM, and PF. Supervision: CBrem and PF. All authors contributed to the article and approved the submitted version.
The study was funded by Fundação Agrisus—Project PA2240/17 and Coordenação de Aperfeiçoamento de Pessoal de Nível Superior—Brasil (CAPES)—Finance Code 001.
The authors are grateful to the farm staff at the Agronomy Experimental Station of the Federal University of Rio Grande do Sul, the members of the Grazing Ecology Research Group (GPEP), the Interdisciplinary Research Group on Environmental Biogeochemistry (IRGEB), and the technician of the Laboratory of Soil Chemistry and Fertility of the Federal University of Rio Grande do Sul, Adão Luiz Ramos dos Santos for his assistance in the analysis, Aliança SIPA, and the support of YARA Brasil.
The authors declare that the research was conducted in the absence of any commercial or financial relationships that could be construed as a potential conflict of interest.
All claims expressed in this article are solely those of the authors and do not necessarily represent those of their affiliated organizations, or those of the publisher, the editors and the reviewers. Any product that may be evaluated in this article, or claim that may be made by its manufacturer, is not guaranteed or endorsed by the publisher.
Akaike, H. (1973). “Information theory and the maximum likelihood principle,” in 2nd International Symposium on Information Theory, eds B. N. Petrov and F. Csäki (Budapest: Akademiai Kiàdo).
Ali, A. M., Thinda, H. S., Sharmaa, S., and Varinderpal-Singha. (2014). Prediction of dry direct seeded rice yields using chlorophyll meter, leaf color chart and Green Seeker Optical Sensor in northwestern India. Field Crops Res. 161, 11–15. doi: 10.1016/j.fcr.2014.03.001
Alvares, C. A., Stape, J. L., Sentelhas, C., de Moraes Gonçalves, J. L., and Sparovek, G. (2013). Köppen's climate classification map for Brazil. Meteorologische Zeitschrift. 22, 711–728. doi: 10.1127/0941-2948/2013/0507
Alves, L. A., Denardin, L. G. O., Martins, A. P., Anghinoni, I., Carvalho, P. C. F., Tiecher, T., et al. (2019). Soil acidification and P, K, Ca and Mg Budget as affected by sheep grazing and crop rotation in a long-term integrated crop-livestock system in southern Brazil. Geoderma. 351, 197–208. doi: 10.1016/j.geoderma.2019.04.036
Andrade, T. G., Andrade Junior, A. S., Souza, M. O., Lopes, J. W. B., and Vieira, P. F. M. J. (2022). Soybean yield prediction using remote sensing in southwestern Piauí state, Brazil. Rev. Caatinga. 35, 105–116. doi: 10.1590/1983-21252022v35n111rc
Araújo, J. C., Vettorazzi, C. A., and Molin, J. P. (2020). Estimativa da produtividade e determinação de zonas de manejo, em culturas de grãos, por meio de videografia aérea multiespectral. Acta Sci. Agron. 27, 437–447. doi: 10.4025/actasciagron.v27i3.1406
Arnuti, F., Denardin, L. G., Nunes, P. A. A., Alves, L., Cecagno, D., Assis, J., et al. (2020). Sheep dung composition and phosphorus and potassium releaseaffected by grazing intensity and pasture development stage in an integrated crop-livestock system. Agronomy 11, 126. doi: 10.3390/agronomy11010126
Atzberger, C. (2013). Remote sensing advances in remote sensing of agriculture: context description, existing operational monitoring systems and major information needs. Remote Sens. 5, 949–981. doi: 10.3390/rs5020949
Ayala-silva, T., and Beyl, C. A. (2005). Changes in spectral reflectance of wheat leaves in response to specific macronutrient deficiency. Adv. Space Res. 35, 305–317. doi: 10.1016/j.asr.2004.09.008
Baresel, J. P., Rischbeck, P., Hu, Y., Kipp, S., Hu, Y., Barmeier, G., et al. (2017). Use of a digital camera as alternative method for non-destructive detection of the leaf chlorophyll content and the nitrogen nutrition status in wheat. Comput. Electron. Agricult. 140, 25–33. doi: 10.1016/j.compag.2017.05.032
Bernardon, A., Assmanna, T. S., Soares, A. B., Franzluebber, A., Maccari, M., de Bortolli, M. A., et al. (2021). Carryover of N-fertilization from corn to pasture in an integrated crop-livestock system. Arch. Agron. Soil Sci. 67, 687–702. doi: 10.1080/03650340.2020.1749268
Bronick, C. J., and Lal, R. (2005). Soil structure and management: a review. Geoderma. 124, 3–22. doi: 10.1016/j.geoderma.2004.03.005
Carvalho, C. F. (2013). Can grazing behaviour support innovations in grassland management? Trop. Grasslands Forrajes Tropicales. 1, 137–155. doi: 10.17138/TGFT(1)137-155
Carvalho, P. C. F., Peterson, C. A., Nunes, P. A. A., Martins, A. P., de Souza Filho, W., Bertolazi, V. T., et al. (2018). Animal production and soil characteristics from integrated crop-livestock systems: toward sustainable intensification. J. Anim. Sci. 96, 3513–3525. doi: 10.1093/jas/sky085
CQFS-RS/SC. (2016). Manual de calagem e adubação: para os Estados do Rio Grande do Sul e de Santa Catarina (11a ed). Sociedade Brasileira de Ciência do Solo—Núcleo Regional Sul.
Divito, G. A., and Sadras, V. O. (2014). How do phosphorus, potassium and sulphur affect plant growth and biological nitrogen fixation in crop and pasture legumes? A meta-analysis. Field Crops Res. 156, 161–171. doi: 10.1016/j.fcr.2013.11.004
Duan, T., Chapman, S. C., Guo, Y., and Zheng, B. (2017). Dynamic monitoring of NDVI in wheat agronomy and breeding trials using an unmanned aerial vehicle. Field Crops Res. 210, 71–80. doi: 10.1016/j.fcr.2017.05.025
Elazab, A., Ordóñez, R. A., Savin, R., Slafer, G. A., and Araus, J. L. (2016). Detecting interactive effects of N fertilization and heat stress on maize productivity by remote sensing techniques. Eur J Agron. 73, 11–24. doi: 10.1016/j.eja.2015.11.010
FAO (2015). World Reference Base for Soil Resources 2014, Update 2015 International Soil Classification System for Naming Soils and Creating Legends for Soil Maps. World Soil Resources Reports: Rome.
FAO (2019). The State of Food and Agriculture. Moving Forward on Food Loss and Waste Reduction. Rome.
Farias, G. D., Dubeux, J. C. B., Savian, J. V., Duarte, L. P., Martins, A. P., Tiecher, T., et al. (2020). Integrated crop-livestock system with system fertilization approach improves food production and resource-use efficiency in agricultural lands. Agron. Sustain. Dev. 40, 39. doi: 10.1007/s13593-020-00643-2
Franzluebbers, A. J. (2007). Integrated crop-livestock systems in the southeastern USA. Agron. J. 99, 361–372. doi: 10.2134/agronj2006.0076
Gates, R. N. (2003). “Integration of perennial forages and grazing in sod based crop rotations,” In Proceedings of Sod Based Cropping Systems Conference. Florida: University of Florida.
Gazala, I. F. S., Sahoo, R. N., Pandey, R., Mandal, B., Gupta, V. K., Singh, R., et al. (2013). Spectral reflectance pattern in soybean for assessing yellow mosaic disease. Indian J. Virol. 24, 242–249. doi: 10.1007/s13337-013-0161-0
Gonçalves, A. C. Jr., Nacke, H., Marengoni, N. G., de Carvalho, E. A., and Coelho, G. F. (2010). Yield and production components of soybean fertilized with different doses of phosphorus, potassium and zinc. Ciênc. agropec. Lavras. 34, 660–666.
Khanal, S., Fulton, J., and Shearer, S. (2017). An overview of current and potential applications of thermal remote sensing in precision agriculture. Comput. Electron. Agricult. 139, 22–32. doi: 10.1016/j.compag.2017.05.001
Kleijn, D., Kohler, F., Báldi, A., Batáry, P., Concepción, E. D., Clough, Y., et al. (2009). On the relationship between farmland biodiversity and land-use intensity in Europe. Proc. Royal Soc. B: Biol. Sci. 276, 903–909. doi: 10.1098/rspb.2008.1509
Kondraju, T. T., and Rajan, K. S. (2019). Excessive fertilizer usage drives agriculture growth but depletes water quality. ISPRS Ann. Photogramm. Remote Sens. Spatial Inform. Sci. IV-3/W1, 17–23. doi: 10.5194/isprs-annals-IV-3-W1-17-2019
Kross, A. (2015). Assessment of RapidEye vegetation indices for estimation of leaf area index and biomass in corn and soybean crops. Int. J. Appl. Earth Observ. Geoinform. 1:235–248. doi: 10.1016/j.jag.2014.08.002
Kuiawski, A. C. M. B., Safanelli, J. L., Bottega, E. L., Neto, A. M. O., and Guerra, N. (2017). Vegetation indexes and delineation of management zones for soybean. Pesquisa Agropecuária Tropical. 47, 168–177. doi: 10.1590/1983-40632016v4743904
Kunrath, T. R., Carvalho, C. F., Cadenazzi, M., Bredemeier, C., and Anghinoni, I. (2015). Grazing management in an integrated crop-livestock system: soybean development and grain yield. Revisat Ciência Agronômica 46, 645–653. doi: 10.5935/1806-6690.20150049
Lemaire, G., Franzluebbers, A., Carvalho, C. F, and Dedieu, B (2014). Integrated crop–livestock systems: Strategies to achieve synergy between agricultural production and environmental quality. Agricult. Ecosyst. Environ. 190, 4–8. doi: 10.1016/j.agee.2013.08.009
Liu, Y., Swinton, S. M., and Miller, N. R. (2006). In site-specific yield response consistent over time? Does it pay? Am. J. Agricult. Econ. 88, 471–483. doi: 10.1111/j.1467-8276.2006.00872.x
Ma, B. L., Dwyer, L. M., Costa, C., Cober, E. R., and Morrison, M. J. (2001). Early prediction of soybean yield from canopy reflectance measurements. Agron. J. 93, 1227–1234. doi: 10.2134/agronj2001.1227
Martins, A. P., Denardin, L. G. O., Borin, J. B. M., Carlos, F. S., Barros, T., Ozório, D. B., et al. (2017). Short-term impacts on soil-quality assessment in alternative land uses of traditional paddy fields in Southern Brazil. Land Degrad. Dev. 28, 534–542. doi: 10.1002/ldr.2640
Merotto, A., Bredemeier, C., Vidal, R. A., Goulart, I. C. G. R., Bortoli, E. D., Anderson, N. L., et al. (2012). Reflectance indices as a diagnostic tool for weed control performed by multipurpose equipment in precision agriculture. Planta daninha. 30, 437–447. doi: 10.1590/S0100-83582012000200024
Miller, J. J., Schepers, J. S., Shapiro, C. A., Arneson, N. J., Eskridge, K. M., Oliveira, M. C., et al. (2018). Characterizing soybean vigor and productivity using multiple crop canopy sensor readings. Field Crops Res. 216, 22–31. doi: 10.1016/j.fcr.2017.11.006
Mulla, D. J. (2013). Twenty five years of remote sensing in precision agriculture: Key advances and remaining knowledge gaps. Biosyst. Eng. 114, 358–371. doi: 10.1016/j.biosystemseng.2012.08.009
Peñuelas, J., and Filella, I. (1998). Visible and near-infrared reflectance techniques for diagnosing plant physiological status. Trends Plant Sci. 3, 151–156. doi: 10.1016/S1360-1385(98)01213-8
Rambo, L., Costa, J. A., Pires, J. L. F., Parcianello, G., and Saggin, K. D. (2003). Análise de crescimento e rendimento por estrato do dossel da soja em função do arranjo de plantas. Pesquisa Agropecuária Gaúcha. 8, 111–120.
Raun, W. R., Solie, J. B., Stone, M. L., Martin, K. L., Freeman, K. W., Mullen, R. W., et al. (2005). Optical sensor based algorithm for crop nitrogen fertilization. Commun. Soil Sci. Plant Anal. 36, 2759–2781. doi: 10.1080/00103620500303988
Reinermann, S., Asam, S., and Kuenzer, C. (2020). Remote sensing of grassland production and management-A review. Remote Sens. 12, 1949. doi: 10.3390/rs12121949
Reinsch, T., Loza, C., Malisch, C. S., Vogeler, I., Kluß, C., Loges, R., et al. (2021). Toward specialized or integrated systems in Northwest Europe: On-farm eco-efficiency of dairy farming in Germany. Front. Sustain. Food Syst. 5, 614348. doi: 10.3389/fsufs.2021.614348
Richardson, A. E., Hocking, J., Simpson, R. J., and George, T. S. (2009). Plant mechanisms to optimise access to soil phosphorus. Crop Pasture Sci. 60, 124–143. doi: 10.1071/CP07125
Rouse, J. W., Haas, R. H., Schell, J. A., and Deering, D. W. (1973). Monitoring vegetation systems in the Great Plains with ERTS. NASA ERTS Symp. 3, 309–317.
Sanodiya, R., Singh, M., Bector, V., Patel, B., and Mishra (2017). Yield prediction by integrating NDVI and N-Tester data with yield monitor data. Int. J. Curr. Microbiol. App. Sci. 6, 1296–1307. doi: 10.20546/ijcmas.2017.610.153
Sarmiento, C. M., Coltri, P. P., Alves, M. C., and Carvalho, L. G. (2020). A spectral agrometeorological model for estimating soybean grain productivity in Mato Grosso, Brazil. Engenharia Agrícola. 40, 405–412. doi: 10.1590/1809-4430-eng.agric.v40n3p405-412/2020
Schaefer, M. T., and Lamb, D. W. A. (2016). Combination of Plant NDVI and LiDAR measurements improve the estimation of pasture biomass in tall fescue (Festuca arundinacea var. Fletcher). Rem. Sens. 8, 109. doi: 10.3390/rs8020109
Smith, H. L., McAusland, L., and Murchie, E. (2017). Don't ignore the green light: exploring diverse roles in plant processes. J. Exp. Bot. 68, 2099–2110. erx098. doi: 10.1093/jxb/erx098
Sollenberger, L. E., Kohmann, M. M., Dubeux, J. C. B Jr, and Silveira, M. L. (2019). Grassland management affects delivery of regulating and supporting ecosystem services. Crop Sci. 59, 441–459. doi: 10.2135/cropsci2018.09.0594
Tan, C. W., Zhang, P., Zhou, X. X., Wang, Z. X., Xu, Z. Q., Mao, W., et al. (2020). Quantitative monitoring of leaf area index in wheat of different plant types by integrating NDVI and Beer-Lambert law. Sci. Rep. 10, 929. doi: 10.1038/s41598-020-57750-z
Tedesco, M. J., Gianello, C., Bissani, C. A., Bohnen, H., and Volkweiss, S. J. (1995). Análise de solo, plantas e outros materiais. 2a ed. Porto Alegre: UFRGS, Departamento de solos.
Tilman, D., Cassman, K. G., Matson, A., Naylor, R., and Polasky, S. (2002). Agricultural sustainability and intensive production practices. Nature. 418. doi: 10.1038/nature01014
Tilman, D., Fargione, J., Wolff, B., D'Antonio, C., Dobson, A., Howarth, R., et al. (2001). Forecasting agriculturally driven global environmental change. Science. 292, 281–284. doi: 10.1126/science.1057544
Trentin, C., Bredemeier, C., Vian, A. L., Drum, M. A., and Santos, F. L. (2021). Biomass production and wheat grain yield and its relationship with NDVI as a function of nitrogen availability. Revista Brasileira de Ciências Agrárias. 16:1-7. doi: 10.5039/agraria.v16i4a34
Vian, A. L., Bredemeier, C., Turra, M. A., Giordano, C. P. S., Fochesatto, E., Silva, J. A., et al. (2018). Nitrogen management in wheat based on the normalized difference vegetation index (NDVI). Ciência Rural. 48:1–9, 2018. doi: 10.1590/0103-8478cr20170743
Werner, F., Aguiar e Silva, M. A., Ferreira, A. S., Neumaier, N., and Balbinot, A. A. (2018). Dinâmica da cobertura do solo por plantas e NDVI de cultivares de soja em diferentes arranjos espaciais de plantas. Colloquium Agrariae. 14, 183–190. doi: 10.5747/ca.2018.v14.n2.a220
Williams, P. (2007). Nutritional composition of red meat. Nutr. Diet. 64, 113–119. doi: 10.1111/j.1747-0080.2007.00197.x
Keywords: system fertilization, nutrient cycling, mixed system, fertilization approach, phosphorus uptake, potassium uptake, integrated crop-livestock system
Citation: Farias GD, Bremm C, Bredemeier C, de Lima Menezes J, Alves LA, Tiecher T, Martins AP, Fioravanço GP, da Silva GP and de Faccio Carvalho PC (2023) Normalized Difference Vegetation Index (NDVI) for soybean biomass and nutrient uptake estimation in response to production systems and fertilization strategies. Front. Sustain. Food Syst. 6:959681. doi: 10.3389/fsufs.2022.959681
Received: 02 June 2022; Accepted: 13 December 2022;
Published: 09 January 2023.
Edited by:
Leonardo Deiss, The Ohio State University, United StatesReviewed by:
Bayartungalag Batsaikhan, Mongolian Academy of Sciences (MAS), MongoliaCopyright © 2023 Farias, Bremm, Bredemeier, de Lima Menezes, Alves, Tiecher, Martins, Fioravanço, da Silva and de Faccio Carvalho. This is an open-access article distributed under the terms of the Creative Commons Attribution License (CC BY). The use, distribution or reproduction in other forums is permitted, provided the original author(s) and the copyright owner(s) are credited and that the original publication in this journal is cited, in accordance with accepted academic practice. No use, distribution or reproduction is permitted which does not comply with these terms.
*Correspondence: Gustavo Duarte Farias,  Z3VzdGF2by5kZmFyaWFzQGhvdG1haWwuY29t
Disclaimer: All claims expressed in this article are solely those of the authors and do not necessarily represent those of their affiliated organizations, or those of the publisher, the editors and the reviewers. Any product that may be evaluated in this article or claim that may be made by its manufacturer is not guaranteed or endorsed by the publisher.
Research integrity at Frontiers
Learn more about the work of our research integrity team to safeguard the quality of each article we publish.