 Qinyu Li
 Yulian Zhao1†
 Na Zhang
 Minhui Li
94% of researchers rate our articles as excellent or good
Learn more about the work of our research integrity team to safeguard the quality of each article we publish.
Find out more
ORIGINAL RESEARCH article
Front. Sustain. Food Syst., 04 July 2022
Sec. Nutrition and Sustainable Diets
Volume 6 - 2022 | https://doi.org/10.3389/fsufs.2022.913763
This article is part of the Research TopicNovel and Traditional Food Processing Technologies to Achieve Nutritional Security and Sustainable DietsView all 4 articles
The formation and quality of nutrients before and after fermentation depends on microbial community dynamics. In this study, the nutrients and microflora of mare milk were studied before and after traditional fermentation. To achieve this goal, ultra-performance liquid chromatography-mass spectrometry and Illumina MiSeq sequencing were used to study the changes in the main nutrients and microbial communities, respectively, before and after mare milk traditional fermentation. A total of 81 nutrients were identified before and after the fermentation of mare milk into koumiss; among these, 6 compounds [citraconic acid, 6-hydroxycaproic acid, creatine, adenine, d-(+)-proline, and histamine] were differentially upregulated. Histamine levels increased after traditional fermentation, whereas Lactobacillus, Dekkera, and Acetobacter grew rapidly and became the dominant microorganisms in the fermentation process. These three genera were positively correlated with creatine and proline levels, whereas Lelliottia was negatively correlated with citraconic acid and proline levels. Prediction of the functions of bacteria and fungi in the mare milk before and after fermentation included carbohydrate metabolism, cofactors and nutrition, and plant pathogens. The results of this study provide new insights into the formation of nutrients in koumiss; it is important to study changes in bacteria and fungi before and after traditional fermentation.
Fermentation, defined as a technology that uses the growth and metabolic activities of microorganisms to preserve food, is one of the oldest and most economical methods of food preparation worldwide (Nuraida, 2015; Terefe, 2016; Wilburn and Ryan, 2017). Previously, humans processed and preserved food through fermentation. Therefore, fermentation is an important component of the human diet. An increasing number of people are realizing that, in addition to extending the shelf life and improving the flavor of food, the microbes involved in fermentation are also beneficial for human health. Over time, the health benefits of microbes have attracted widespread scientific attention, and fermented foods have been increasingly used in dietary therapy.
Dietary therapy plays an important role in Mongolian medicine, and koumiss is the first beverage used in dietary therapy (Xia et al., 2021). Koumiss is a mild alcoholic beverage that produces acid and gas through the co-fermentation of bacteria and yeast with mare milk as a raw material (Yu et al., 2021). For several years, grassland herdsmen have drunk fresh mare milk directly or made it into koumiss for medicinal purposes (Yang et al., 2008). Koumiss therapy has not only been used in China, but also nursing homes or medical centers for koumiss have been established in Russia, Kazakhstan, Kyrgyzstan, and Mongolia (Jacobs and Gordon, 2018). In traditional Mongolian medicine, koumiss has rich pharmacological effects, prevents diseases, and improves immunity to such diseases as tuberculosis, digestive system diseases, hepatitis, heart disease, hypertension, and dyslipidemia (Manlai, 2013; Zheng et al., 2019). Koumiss has also been used to improve the immune system and treat weight loss and anemia (Manlai, 2013; Zheng et al., 2019). The nutritional value and health care function of koumiss are closely related to its nutritional composition and bacterial community structure (Xia et al., 2022). Therefore, a comprehensive understanding of the microbial composition and function of koumiss and the changes in nutrient composition before and after fermentation is of great significance to improve koumiss production quality, explore the beneficial microbial resources of koumiss in western China, and develop new products.
In the past, traditional identification and classification methods, such as pure culture technology, have been used to determine microbial diversity, but traditional methods have limitations because most of the microorganisms in nature cannot be cultivated (Wu et al., 2019; Zhao et al., 2019). The second generation of high-throughput sequencing technology, represented by Illumina MiSeq, detects many uncultured and low-abundance microorganisms compared to previous technologies (Liu et al., 2019; Rui et al., 2019). However, there are few studies that have used this technology to identify koumiss microbes. Therefore, in this study, ultra-performance liquid chromatography-mass spectrometry (UPLC-MS) and Illumina MiSeq sequencing were used to study the changes in the structural diversity of the main nutrients and core microbiota, respectively, before and after the traditional fermentation of mare's milk. Additionally, functional prediction was used to analyze the related functional genes of different microbial communities to further standardize koumiss and provide a theoretical basis for industrial production of high-quality, safe koumiss.
Twelve samples were collected from the Xilingol League, Inner Mongolia Autonomous Region, in October 2021. Six samples of mare's milk and six samples of koumiss were collected at three different sampling sites in the Xilingol League, with two parallel samples at each sampling site. After collection, samples were divided into sampling tubes and stored at 4°C before and after transportation (Sha et al., 2018; Li et al., 2022). Samples were sent to the Transformation Center Laboratory of Baotou Medical College, Inner Mongolia University of Science and Technology, and cryopreserved at −80°C for sub-sequent tests.
Koumiss and mare milk samples were freeze-dried into powder using a lyophilizer. The koumiss and mare's milk freeze-dried powder samples weighing ~1 g were placed into a centrifuge tube (1 g koumiss freeze-dried powder corresponded approximately to 20 mL koumiss, and 1 g mare's milk freeze-dried to 20 mL mare's milk). Distilled water (4 mL) was added for dissolution, and the mixture was centrifuged at 3,000 r/min for 5 min. The supernatant was collected; the same amount of acetonitrile was added to precipitate protein, and the mixture was stirred with a vortex oscillator for 30 s. After standing for 5 min, the mixture was stirred again for 30 s and centrifuged at 8,000 r/min for 10 min. This process was repeated three times and the supernatant was injected into the sample bottle through a 0.22 μm microporous membrane for UPLC-MS machine analysis (Li et al., 2022).
Samples were analyzed using a Thermo Scientific Ultimate 3000 RS system (Thermo Fisher Scientific, Waltham, MA, USA) coupled to a Q Exactive High-Resolution Benchtop Quadrupole Orbitrap mass spectrometer (Thermo Fisher Scientific) with a heated electrospray ionization source. The system was controlled using the Xcalibur 3.0 software program (Thermo Fisher Scientific). Chromatographic separation was performed on a Hypersil GOLD C18 column (100 × 2.1 mm, 1.9 μm) with the column temperature maintained at 30°C. The mobile phase consisted of 0.1% formic acid in water (A) and acetonitrile (B) in the positive ion and the negative ion modes. The gradient conditions were as follows: 0–70 min, 5–95% B. The flow rate was maintained at 0.30 mL/min, and the injection volume was 2 μL. A full MS/dd-MS2 mode scan was used in the positive ion and negative ion mode with a scan time of 70 min. See Supplementary Table S1 for details on the MS settings of the positive/negative ionization modes.
DNA was extracted from the microbial community using a HiPure Soil DNA kit (Magen, Guangzhou, China), according to the manufacturer's instructions. The purity of the DNA was tested using a NanoDrop 2000 microspectrophotometer (Thermo Fisher Scientific), and the integrity of the DNA sample was tested using agarose gel electrophoresis (Sha et al., 2018).
Polymerase chain reaction (PCR) amplification conditions were based on previous reports. The upstream primer used for the V3–V4 variable region of the bacterial 16S rRNA gene was 341F 5′-CCTACGGGNGGCWGCAg-3′ and the downstream primer was 806R 5′-GGactachVGGGTATctaat-3′. The upstream primer for the fungal internal transcription spacer (ITS1) was ITS1-F 5′-CTTGGTCATTTAGagGaAGTAA-3′ and the downstream primer (ITS2) was 5′-GCTGCGTTCTTCATCGATGC-3′. PCR reactions were performed in triplicate in a 50 μL mixture containing 10 μL 5 × Q5@ Reaction Buffer, 10 μL 5 × Q5@ High GC Enhancer, 1.5 μL dNTPs (2.5 mM), 1.5 μL of each primer (10 μM), 0.2 μL Q5@ High-Fidelity DNA Polymerase, and 50 ng of template DNA. The related PCR reagents were purchased from New England Biolabs (USA). PCR was performed as follows: 95 °C for 5 min, followed by 30 cycles at 95°C for 1 min, 60°C for 1 min, and 72°C for 1 min, and a final extension at 72°C for 7 min (Gao et al., 2016; Guo et al., 2017; Sha et al., 2017, 2019).
Amplicons were extracted from 2% agarose gels, purified using the AxyPrep DNA Gel Extraction Kit (Axygen Biosciences, Union City, CA, USA), according to the manufacturer's instructions, and quantified using the ABI StepOnePlus Real-Time PCR System (Life Technologies, Foster City, USA). Purified amplicons were pooled in equimolar amounts and paired-end sequenced (PE250) on an Illumina platform, according to standard protocols. Raw reads were deposited in the National Center for Biotechnology Information Sequence Read Archive database.
Raw data containing adapters or low-quality reads may affect subsequent assembly and analysis. Thus, to obtain high quality clean reads, raw reads were further filtered using FASTP (Chen et al., 2018) by removing those containing more than 10% unknown nucleotides (N) and <50% of bases with quality (Q-value) >20. Paired end clean reads were merged as raw tags using FLASH (Magoč and Salzberg, 2011) (version 1.2.11), with a minimum overlap of 10 bp and mismatch error rates of 2%. Noisy sequences of raw tags were filtered under specific conditions (Bokulich et al., 2013) to obtain high-quality clean tags.
The clean tags were clustered into operational taxonomic units (OTUs) of ≥97% similarity using the UPARSE (Edgar, 2013) (version 9.2.64) pipeline. All chimeric tags were removed using the UCHIME algorithm (Edgar et al., 2011) and effective tags were obtained for further analysis. The tag sequence with the highest abundance was selected as the representative sequence for each cluster.
The pH of mare's milk is 6.140 ± 0.13, while the pH after fermentation is 3.625 ± 0.12. An important factor in determining pH is the compounds present in the sample. Therefore, to further investigate the changes in nutrient composition before and after fermentation of mare milk, Q Exactive was used to collect data in positive and negative ion modes for mare's milk (M) and koumiss (K) groups. A total of 81 nutrients were identified in both groups (Supplementary Table 2). Data from the two groups were analyzed for similarities and differences using principal component analysis (PCA) (Supplementary Figure S1). In the positive and negative ion modes, the samples of the two groups were well aggregated and had different aggregation locations, suggesting that there were differences in the compositional basis of the two groups; the differential substances of the two groups might reflect the biological differences between the samples. To clarify the differential compounds in the fermentation process of mare milk, the obtained data were further analyzed using volcano plots (Figure 1). Green and orange represent down- and upregulation, respectively, of the corresponding differential compounds. Six differential compounds were upregulated after fermentation of mare's milk into koumiss, including citraconic acid, 6-hydroxycaproic acid, creatine, adenine, D-(+)-proline, and histamine. The structures of the compounds are shown in Figure 1.
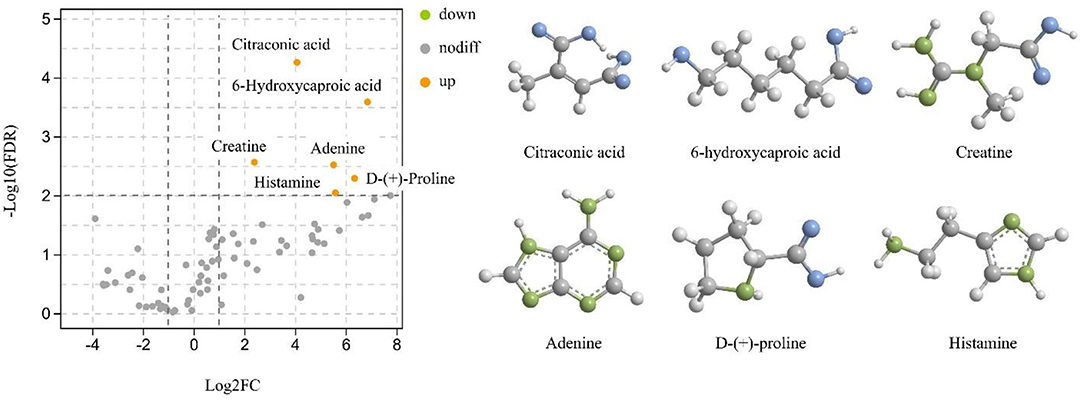
Figure 1. Volcano plots and Structures of differential compounds for the two groups of samples.
Changes in metabolites produced by microorganisms before and after fermentation have important effects on food flavor and nutrition. Hence, high-throughput sequencing technology was used to study the microbial changes before and after the fermentation of mare milk. The mean reads for the koumiss samples were 119,396 [standard deviation (SD) = 2,377] and 123,947 (SD = 3,597), respectively, and the mean reads for the mare's milk samples were 112,731 (SD = 6,751) and 111,816 (SD = 8,771), respectively. The UCHIME algorithm was used to divide the OTUs at ≥97% similarity level, and in each cluster, the sequence with the highest abundance of labels was selected as the representative sequence. Species annotation based on the sequence information of OTU/ASV revealed that all koumiss sample bacterial sequences belonged to 1 domain, 4 phyla, 8 classes, 21 orders, 24 families, 32 genera, and 15 species with an average of 82 OTUs, whereas fungal sequences belonged to 2 domains, 4 phyla, 17 classes, 36 orders, 57 families, 84 genera, and 72 species with an average of 155 OTUs. All bacterial sequences from mare milk samples were attributed to 1 domain, 5 phyla, 14 classes, 29 orders, 36 families, 46 genera, and 29 species, with an average of 111 OTUs, whereas fungal sequences were attributed to 4 domains, 6 phyla, 25 classes, 59 orders, 105 families, 151 genera, and 123 species, with an average of 252 OTUs.
α-diversity is a measure of the richness and evenness of the microbial community in a single sample. According to the α-diversity difference analysis, species diversity differed between the groups (Figures 2A,B). ACE, Chao, Shannon, and Simpson indices were used to evaluate the α-diversity of a single sample (Table 1). After mare's milk is fermented into koumiss, ACE and Chao indices decreased, indicating that the richness of bacteria and fungi decreased after fermentation. The Shannon and Simpson indices also decreased, so the richness and evenness of bacteria and fungi not only decreased after fermentation, but also showed a downward trend. The mean Chao (121.53 ± 10.26) and ACE (127.48 ± 11.14) indices of bacteria from mare's milk samples were higher than the mean Chao (88.46 ± 11.72) and ACE (93.05 ± 11.59) indices of bacteria from koumiss samples, whereas the mean Chao (285.45 ± 77.17) and ACE (287.64 ± 75.74) indices of fungi from mare's milk samples were higher than the mean Chao (175.27 ± 57.13) and ACE (175.19 ± 54.00) indices of fungi from koumiss samples. In addition, the mean Chao and ACE indices of fungi in the samples were higher than those of bacteria. The Simpson and Shannon indices characterize community diversity; the higher the values, the higher the community diversity (Guo et al., 2019). The mean Simpson (0.77 ± 0.03) and Shannon (2.79 ± 0.23) indices of bacteria after fermentation of mare milk were higher than those in koumiss (0.40 ± 0.06 and 1.26 ± 0.27, respectively), with identical results observed for fungi. The mean Simpson and Shannon indices of koumiss bacteria were higher than those of koumiss fungi. Microbial community richness and diversity decreased after the fermentation of mare milk into koumiss. It is noteworthy that in the koumiss samples, although the abundance level of fungi is higher than that of bacteria, the bacterial community diversity is higher.
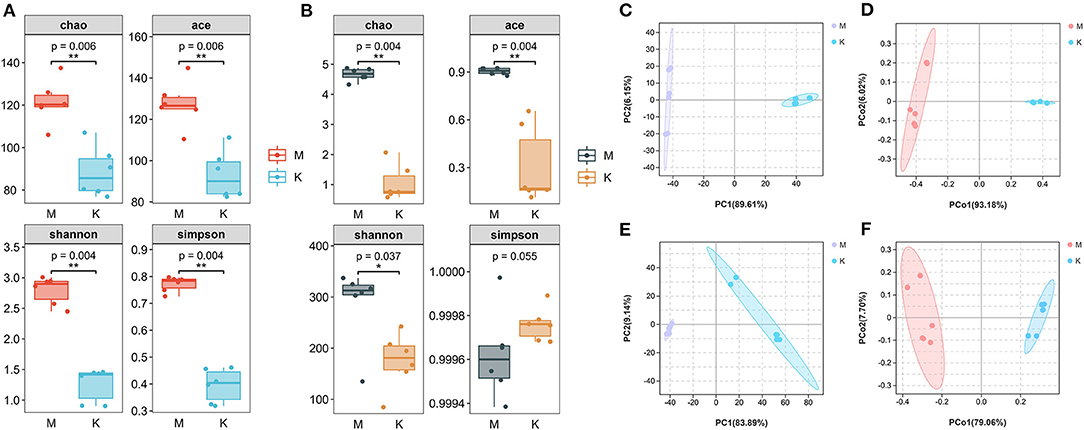
Figure 2. Microbial species abundance and diversity indices of koumiss and mare's milk. (A) According to the difference analysis of bacterial α diversity, there were differences in the species diversity between the two groups (**P < 0.01). (B) According to the difference analysis of fungal α diversity, there were differences in the species diversity between the two groups (*P < 0.05; **P < 0.01). (C,D) PCA analysis of bacteria and PCoA analysis with weighted uniFrac distance algorithm. (E,F) PCA analysis of fungal and PCoA analysis with weighted uniFrac distance algorithm.
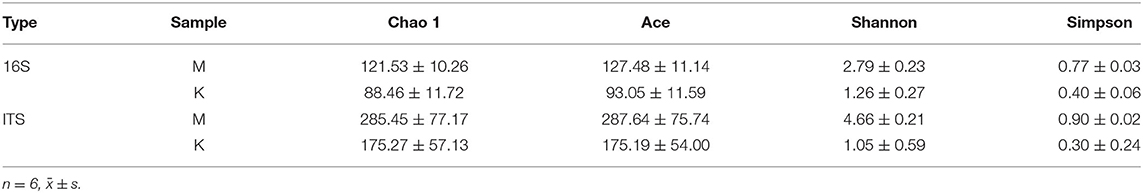
Table 1. Sample bacterial and fungal alpha diversity indices.
To compare the similarity in bacterial and fungal composition between the two groups, the QIIME software was used to calculate β-diversity. PCA based on the abundance information of species (ASV/OTU) in the samples showed that both K and M fungal and bacterial groups clustered separately, with significant differences in microbial communities (Figures 2C,E). The differences in species diversity between the different groups were further verified by principal co-ordinates analysis (PCoA) using the weighted UniFrac distance algorithm (Figures 2D,F). Before and after fermentation of mare milk, significant separation occurred between the M and K groups. The above results indicate changes in both fungi and bacteria in group M before and after fermentation and significant differences in the species composition of microorganisms between groups K and M.
To count the bacterial distribution of mare milk and koumiss samples at each classification level, Krona software was used to perform visual statistics on the abundance of each classification (Ondov et al., 2011), and the changes in species composition and abundance of each sample at each classification level were counted (Figure 3). In the stacking diagram of species distribution, all bacteria in mare's milk samples were classified into five phyla (Figure 3A): Proteobacteria, Firmicutes, Actinobacteria, Bacteroidetes, and Patescibacteria. Proteobacteria was the dominant phylum, with an average abundance of 81.85%, followed by Firmicutes, with an average abundance of 17.56%. The proportion of other bacterial phyla not mentioned was relatively low, all below 1%. All bacteria in koumiss samples were classified into four phyla (Figure 3A): Firmicutes, Proteobacteria, Actinobacteria, and Bacteroidetes, the abundance of which decreased successively. Similar to the results of previous studies (Yu et al., 2021), the dominant bacteria were Firmicutes, with an average abundance of 78.88%. The dominant bacteria changed after fermentation into koumiss.
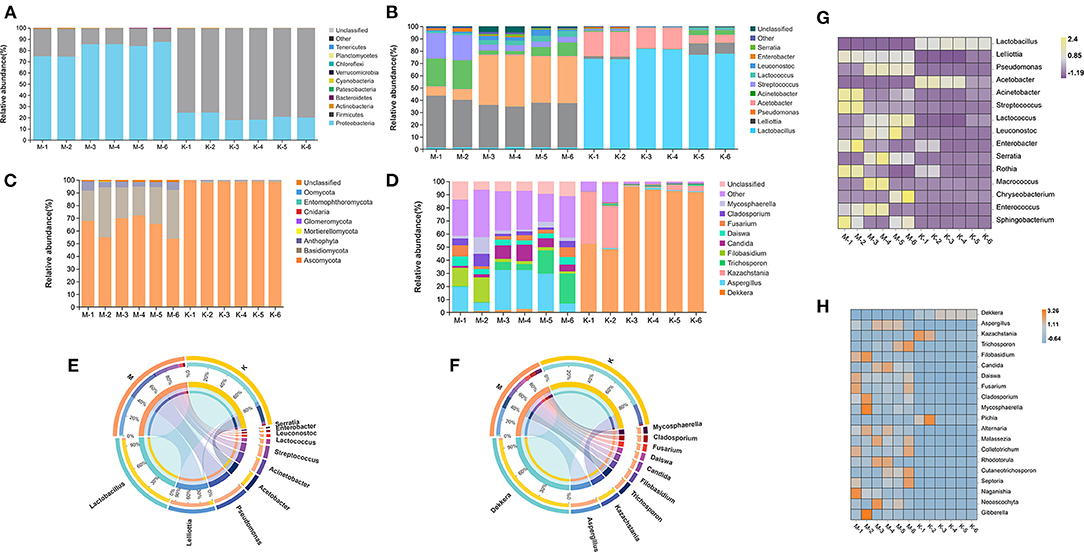
Figure 3. Analysis diagram of species composition of mare's milk before and after fermentation. (A,B) Superimposed maps of species distribution of bacteria at the phylum and genera levels, respectively. (C,D) Superimposed maps of species distribution of fungi at the phylum and genera levels, respectively. (E,F) Species distribution of bacteria and fungi at the genus level respectively. (G,H) Heat maps of bacteria and fungi distribution at the genus level, respectively.
Lelliottia and Pseudomonas were the two genera with the highest bacterial abundance in the mare milk samples (Figures 3B,E). Before and after the fermentation of mare milk into koumiss, 32 bacterial genera were identified at the genus level, and six were found with an abundance of >1%. In order of abundance (Figure 3G), the six genera were Lactobacillus, Acetobacter, Lelliottia, Acinetobacter, Streptococcus, and Lactococcus, which is consistent with previous studies (Yu et al., 2021). As fermentation proceeded, Lactobacillus became the dominant bacteria, with an average abundance of 77.32% (Figure 3E), while other genera, such as Lelliottia and Pseudomonas were inhibited. The differences between mare's milk and koumiss samples at the bacterial phylum and genus levels were significant. According to recent research reports (Zhao et al., 2019), microbes largely determine koumiss quality and harmful microorganisms, including Enterococcus, Escherichia, and Bacillus, are found in mare's milk. Microbes may affect the color, texture, and nutritional composition of koumiss, and even threaten human health. Lactobacillus was the dominant bacterium after mare's milk fermentation. We speculated that Lactobacillus fermentation inhibited the growth of pathogenic bacteria, which might explain the significant decrease in koumiss microbial diversity.
Fungi are also an important community in koumiss; therefore, the distribution of fungi before and after fermentation was investigated. According to the ITS sequences (Figure 3C), the dominant fungal phylum after fermentation of mare's milk was Ascomycota, with an average abundance of 98.60% (Figure 3F). A total of 84 fungal genera were identified in six koumiss samples, the number of which was significantly higher than that identified in bacteria. Two fungal genera with abundance >1% (Dekkera and Kazachstania) were identified and were the most abundant in koumiss (Figure 3H); Dekkera was the dominant genus (Figure 3D). The average abundance was 79.14%.
The different microbial communities before and after mare's milk fermentation were screened using the species distribution of bacteria and fungi, and the association of the different microbial communities at different classification levels was determined using an upset Venn diagram. This results revealed that there were 46 bacterial genera in mare's milk samples at the genus level, including 19 unique genera in M group (Figure 4A). The koumiss sample contained 32 bacterial genera, of which five were endemic. There were 27 species of bacteria in the genera that were common to koumiss and mare milk. In addition, welch's t-test was used to analyze the indicator species at the level of the two groups (Figure 4C). At the 95% confidence interval, there were significant differences in Lactobacillus, Acetobacter, and Lelliottia after mare milk fermentation (P < 0.05). Linear discriminant analysis effect size (LEFSe) multistage species difference analysis was performed to quantitatively identify bacterial genera with significant changes in abundance after mare milk fermentation (Figure 4E), with a linear discriminant analysis >2 as the threshold. Gammaproteobacteria, Proteobacteria, Pseudomonadales, and Enterobacteriaceae were significantly enriched before the fermentation of mare's milk, and their relative abundance was significantly reduced after fermentation. The relative abundance of Lactobacillus, Lelliottia, Lactobacillaceae, Lactobacillales, Bacilli, and Firmicutes significantly increased after fermentation into koumiss. Owing to the high accuracy of the random forest classification results, random forest was also used to identify potential indicator species (Figure 5A). The greater the Gini index of species, the more obvious the effect of the species in distinguishing the two groups, which showed that Lactobacillus, Lelliottia, and Acetobacter were significant genera.
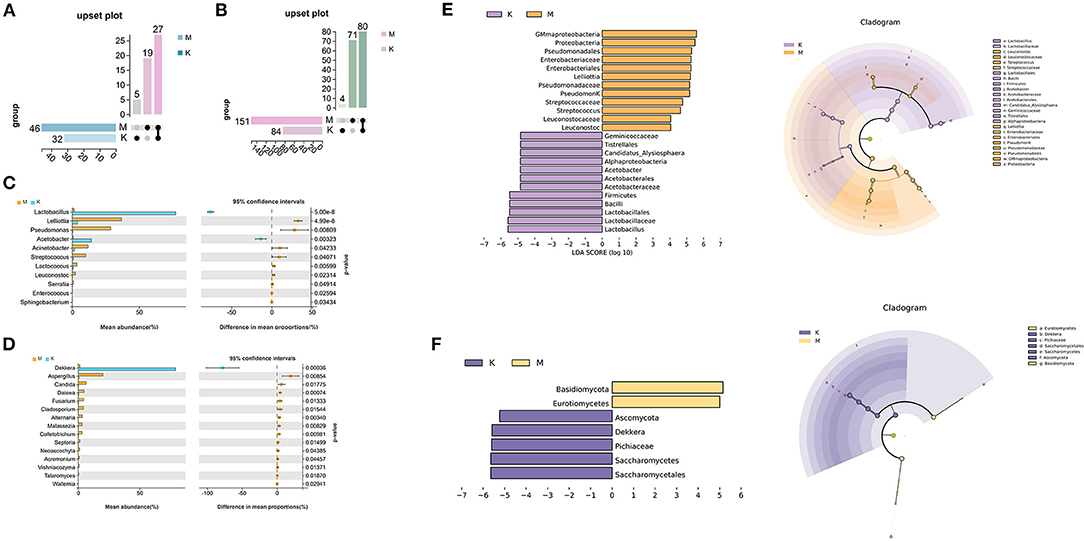
Figure 4. Distribution of indicator species before and after mare's milk fermentation. (A,B) Upset diagrams of bacteria and fungi at the genus level, respectively. (C,D) Welch's t-test of bacteria and fungi at the genus level, respectively. The left half of the ordinate represents the difference species, the abscissa represents the mean species abundance; the right half of the abscissa represents the difference in abundance between groups, the dot color represents the group with higher abundance, and the error bar of the dot represents the difference 95%. The fluctuation range of the confidence interval, and the ordinate represents the significance of the difference between the corresponding species groups, that is, the size of the p-value. (E,F) LEFSe analyses of bacteria and fungi, respectively. The LDA score plot shows the biomarkers of different groups, and the length of the histogram represents the impact size of the different species. In the clade diagram, each small circle at a different taxonomic level represents a species at that taxonomic level, and the diameter of the small circle is proportional to the relative abundance.
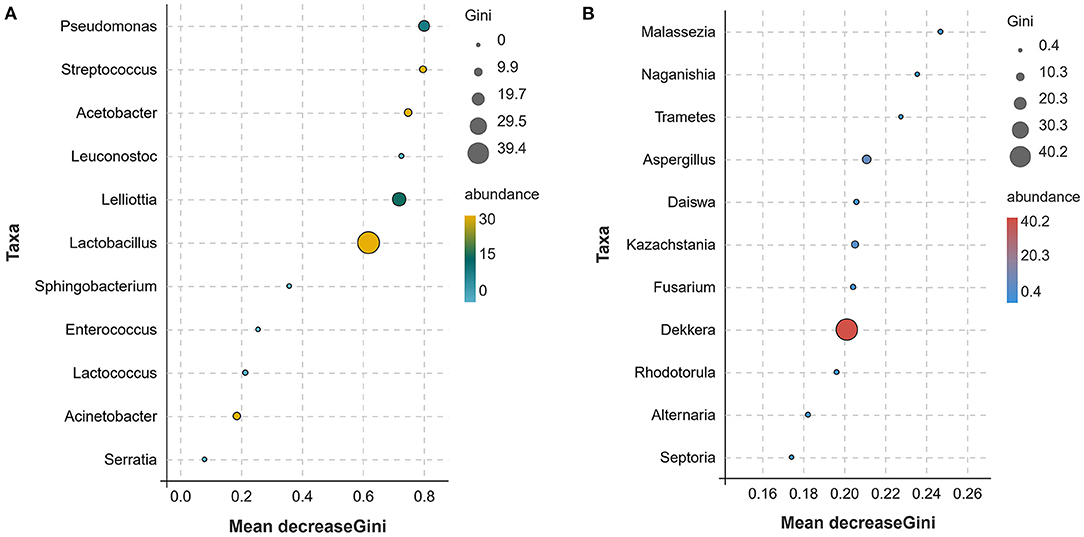
Figure 5. Random forest analysis of bacteria and fungi [(A) for bacteria, (B) for fungi]. The Gini index represents the purity of the nodes of the decision tree. The larger the Gini index, the lower the purity. The larger the species Gini index, the more obvious the effect of the species in distinguishing the two groups. Mean Decrease Accuracy is the mean square error, which is used to measure the degree to which the accuracy of the prediction results decreases when the variables are assigned randomly. The larger the value, the stronger the indicating effect of the species between the two groups. The size and color of the bubbles in the figure indicate the abundance of the corresponding species, and the position of the bubbles indicates the size of the index.
The Upset Venn diagram showed that there were 151 fungal genera in mare milk samples at the genus level, and 71 were endemic. There were 84 fungal genera in the koumiss samples, of which four were endemic. Eighty fungal genera were common to koumiss and mare's milk (Figure 4B). There were significant differences in Dekkera, Aspergillus, and Candida counts before and after mare milk fermentation (P < 0.05; Figure 4D). Subsequently, LEFSe difference species analysis was conducted (Figure 4F). The differential species were identified as Dekkera, Kazachstania, and Aspergillus (Figure 5B).
To further analyze the microorganisms in the microbial community before and after mare milk fermentation, functional prediction of bacteria was performed using PICRUSt (Figure 6A). By comparison with the Kyoto Encyclopedia of Genes and Genomes (KEGG) database, a total of six categories of primary metabolic pathways were annotated, among which metabolism, genetic information processing, and cellular processes were the main metabolic pathways. A total of 27 sub-functional components were annotated in secondary metabolic pathways. The main groups involved in metabolism were carbohydrate metabolism, metabolism of cofactors and vitamins, and amino acid metabolism. Replication and repair, folding, cell motility, and cell growth and death were the main sub-functions of the cellular process pathway. Carbohydrate metabolism, cofactor and vitamin metabolism, and amino acid metabolism were the most prominent before and after fermentation of mare milk (Figure 6A).
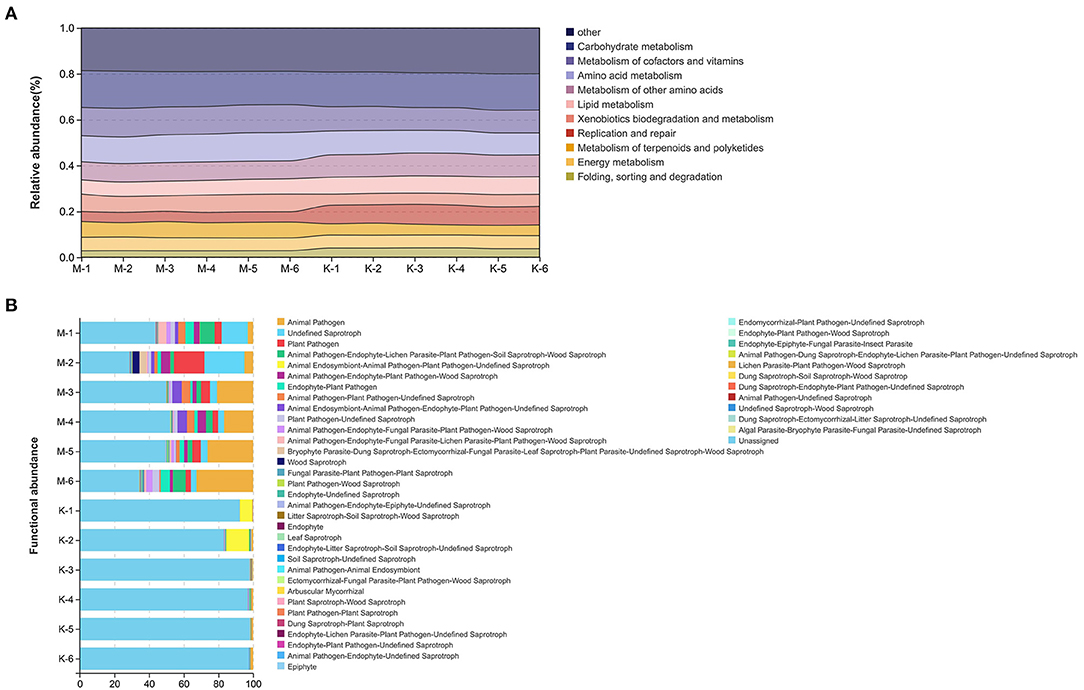
Figure 6. Functional predictive analysis of bacteria and fungi. (A) Based on PICRUSt functional prediction, the obtained KEGG functional abundance of sample bacteria was displayed using a river map. (B) Based on the information in the OTU abundance table, further functional annotation of fungi was performed using FUNGuild.
Based on the information in the OTU abundance table, further functional annotation of fungi was performed using FUNGuild (Figure 6B). Animal pathogens, plant pathogens, animal endosymbionts, and endophytes were the main fungal functional groups. Among them, animal pathogens and plant pathogens were significantly higher in group M than those in group K. Unassigned saprotrophs were the most abundant in group M, followed by undefined saprotrophs and animal pathogens. Undefined saprotrophs were the most abundant in group K, followed by animal endosymbiont, animal pathogen, plant pathogen, and pathogen-undefined saprotroph.
To better study the association between bacterial and fungal species before and after mare milk fermentation, principal components were extracted by dimensionality reduction of high-dimensional data, and correlation analysis of samples was conducted at the family and genus levels using the sparse partial least squares (sPLS) model. The distribution characteristics of the samples were consistent with expectations. At the family and genus levels (Figures 7B,C), the bacterial community structure of mare milk before and after fermentation was different, and the results were similar to those of PCA. The species composition of the koumiss and mare milk groups was not similar, and there was obvious separation between the two groups. However, the distribution of the two groups showed aggregation. Because the traditional method is directly based on the relative abundance calculation, the negative correlation is often excessive; that is, the positive correlation is suppressed. However, the SPARCC method optimizes the problem of limited positive correlation. Therefore, species with an average abundance >0.1% at the genus level were identified for SPARCC analysis (Figure 7D). As observed from Figure 7A, Lactobacillus, Acetobacter, Enterobacter, and Rothia are significantly positively correlated with Dekkera, Kazachstania, and Pichia (P < 0.01) and negatively correlated with Malassezia, Aspergillus, Neoascochyta, and Candida (P < 0.01).
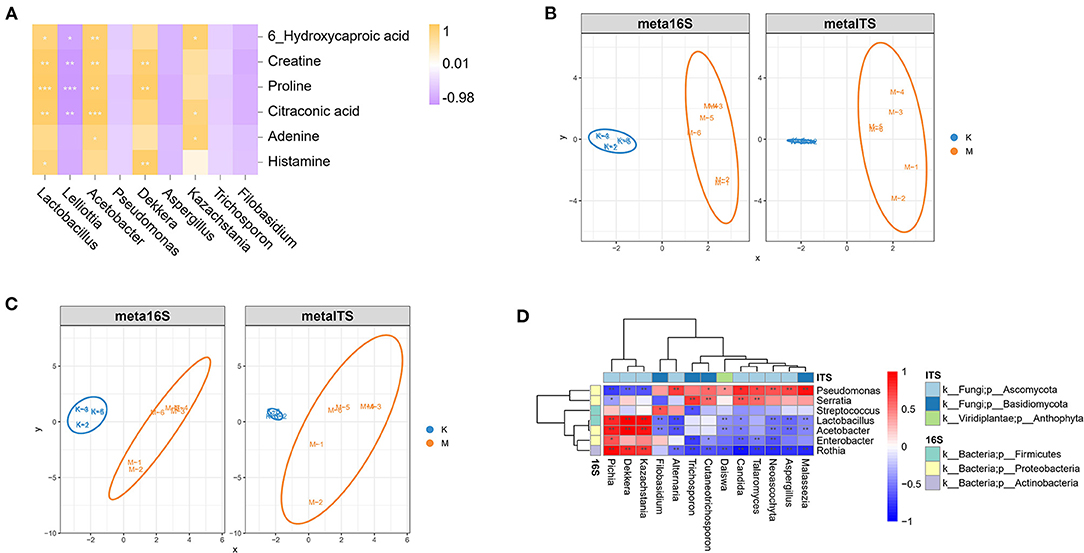
Figure 7. Sparse partial least squares (SPLS) and SPARCC analysis among species. (A) Correlation analysis of different bacteria and different compounds before and after mare's milk fermentation. (B,C) sPLS analyses at the family and genus levels, respectively. (D) Heat map of the SPARCC correlation coefficient at the bacterial and fungal genus levels.
There were also numerous relationships between bacteria and compounds. Spearman's correlation analysis revealed that Lactobacillus and Acetobacter were positively correlated with creatine (Figure 7A), proline, and citraconic acid (P < 0.05). Dekkera was positively correlated with creatine and proline levels (P < 0.05). Kazachstania was positively correlated with citraconic acid and adenine levels (P < 0.05), whereas Lelliottia was negatively correlated with citraconic acid, proline, and creatine levels (P < 0.05).
In this study, UPLC-MS and high-throughput sequencing technology (a culture-independent method) were used to investigate the changes in the main nutrient components and the structural diversity of core microbial communities before and after koumiss fermentation. A total of 81 nutrients were identified after mare milk fermentation, and six different compounds were upregulated. Lactobacillus and Dekkera were the dominant genera in the microbial communities, as determined by high-throughput (or “next-generation”) sequencing technology. PICRUSt and FUNGuild were used to annotate bacteria and fungi, and the communities were analyzed.
Koumiss was rich in chemical composition. Citraconic acid, 6-hydroxycaproic acid, creatine, adenine, D-(+)-proline, and histamine were differential compounds. Some studies have shown that creatine supplementation reduces the consumption of methionine in patients with diabetes, as well as the production of homocysteine in the liver, and prevents the accumulation of fat, which is effective in the treatment of fatty liver and non-alcoholic liver diseases (Barcelos et al., 2016). In addition to its protect liver function, creatine ameliorates oxidative stress damage; researchers have induced oxidative stress injury using H2O2 to reduce the myogenic ability of C1C12 cells, and creatine supplementation in vitro restored the myogenic ability of C1C12 cells (Barbieri et al., 2016). In addition to creatine, adenine has anti-inflammatory effects by activating adenine receptor signaling in mouse macrophages (Fukuda et al., 2017) and citraconic acid is formed by the carboxylation of acetyl-CoA and oxaloacetic acid in the tricarboxylic acid cycle of the body, which is involved in the metabolism of sugar, fat, and protein. Citraconic acid supplementation elicits low levels of initial plasma TCA circulating metabolites in patients with chronic fatigue syndrome, and dietary citraconic acid ameliorates fatigue (Hara et al., 2021).
After mare milk fermentation, although the nutritional composition is more effective, the microflora produced has a beneficial role in human health. In previous reports using high sugar and high fat feed chain urea combined with the use of cephalosporins (sulfathiazole) as a method to establish a diabetic mouse model, total cholesterol and triacylglycerol content increased; when intestinal Lactobacillus increases, the gut microbiota composition in high sugar and high fat diabetic mice and the differences in the normal group decrease, blood sugar levels drop, and the flora structure is adjusted and obviously improved, indicating that Lactobacillus improve and regulate lipid reduction (Gao, 2018). It has been reported that Lactobacillus inhibits α-glucosidase by 95% (Koh et al., 2018). In addition to its lipid- and sugar-lowering effects, Lactobacillus show good anti-inflammatory and antioxidant activities. Lactobacillus promotes interleukin-10 production in lipopolysaccharide (LPS)-induced macrophage supernatants after LPS treatment (Liao et al., 2017), indicating that Lactobacillus promotes the anti-inflammatory effect of macrophages and regulates the body's immune system. Among them, the antioxidant activities of Lactobacillus acidophilus and Lactobacillus casei have been experimentally confirmed; L. acidophilus and L. casei significantly improve glucose tolerance caused by a high-fructose diet and effectively reduce blood glucose levels and oxidative stress in diabetic rats (Liu, 2015). There are many studies related to the antioxidant capacity of yeast, and all show good antioxidant capacity (Mi et al., 2021).
At present, the sequence information of microbial genomes can be obtained using high-throughput sequencing, and the microbial populations among different strains within a species and the diversity among a specific genus can be observed through sequence alignment (Gao et al., 2016; Sha et al., 2018, 2019). Lactobacillus, Lelliottia, and Acetobacter were the main bacterial genera involved in mare milk fermentation. Dekkera, Kazachstania, and Aspergillus were the main fungal genera. Different bacteria and nutrients were inextricably related. Bacteria in fermented dairy products play an important role in the formation of flavor, especially Lactobacillus, which metabolize galactose, glucose, and citric acid to produce the intermediate product pyruvate; pyruvate is completely converted into lactic acid under homolactic fermentation, whereas in heterozygous fermentation (Liu et al., 2010; Mcauliffe et al., 2018). In addition to lactic acid fermentation, these bacteria also produce flavor substances such as diacetyl, acetaldehyde, and acetic acid. At the same time, Lactobacillus can metabolize proteins and lipids, thereby producing flavor substances. Dekkera not only participate in the catabolism of proteins, lipids, and lactose in fermented milk, but also metabolize citric and lactic acids, which have an important impact on the formation of flavor (Mcsweeney, 2004). In our study, Lactobacillus, Acetobacter, and Enterobacter were significantly positively correlated with Dekkera and Kazachstania (P < 0.01) and negatively correlated with Malassezia, Aspergillus, Neoascochyta, and Candida (P < 0.01). Dekkera, Lactobacillus, and Acetobacter played a leading role in the fermentation of mare milk into koumiss. At the growth level, Dekkera provides nutritional factors, such as vitamins and amino acids, for Lactobacillus, and these provide energy sources, such as glucose and other monosaccharides (Roostita and Fleet, 1996). Therefore, Lactobacillus and Dekkera are mutually beneficial and promoting.
Koumiss is a traditional fermented dairy product produced in pastoral areas. The life practice of making koumiss by herdsmen and previous research have proven its efficacy (Lu and Liu, 2018). This study unveils the microbes that contribute to the beneficial properties of mare milk and koumiss before and after traditional fermentation. However, several aspects need to be addressed to obtain more comprehensive and reliable results. First, there is no national standard for koumiss, and the quality of the produced koumiss is also uneven. Therefore, it is necessary to combine phenotypic and biochemical characterization analyses to elucidate the key microorganisms in the traditional fermentation process of koumiss. For example, yeasts have been phenotypically characterized using colony and cell morphology, sugar fermentation, and sugar assimilation assays (Sha et al., 2018). Using these indicators can optimize the fermentation of koumiss, improve production quality, and develop new products with high nutritional value that meet food safety standards. Second, the shape, color, taste, and smell of fermented foods are often the most intuitive sensory indicators to describe and judge product quality. Sensory indicators not only reflect the requirements for food enjoyment and edibility, but also comprehensively reflect the requirements for food safety. Therefore, it is necessary to combine sensory indicators to evaluate product quality and establish quality requirements of food in the future.
In summary, the dynamic changes in nutrient composition and microbial communities before and after fermentation of mare milk into koumiss in the Xilingol pastoral area were measured and analyzed. A total of 81 nutrients were detected in natural starter cultures, and differential compounds included citraconic acid, 6-hydroxycaproic acid, creatine, adenine, D-(+)-proline, and histamine. Microbial diversity analysis showed that the bacterial community mainly included Lactobacillus, Lelliottia, Lactobacillaceae, Lactobacillales, Bacilli, and Firmicutes. The dominant bacterium was Lactobacillus with an average abundance of 77.32%. The fungal community included Dekkera, Saccharomycetes, Saccharomycetales, Pichiaceae, and Kazachstania, among which the dominant genera was Dekkera, with an average abundance of 79.14%. After mare's milk was fermented into koumiss, although the richness level of fungi was higher than that of bacteria, the bacterial community diversity was higher than that of fungi. Concerning function prediction, carbohydrate metabolism, cofactors, nutrition, and amino acid metabolism were the most prominent, contributing to the flavoring substances in mare milk fermentation.
The datasets presented in this study can be found in online repositories. The names of the repository/repositories and accession number(s) can be found below: NCBI (accession: PRJNA807839 and PRJNA807831).
ML conceived the research ideas. NZ and ML advised on data collection. QL and NZ designed the experiments in detail and provided valuable guidance on data analysis. TX and BS provided important insights and suggestions for this research. YZ aided in data consolidation. QY and YZ performed majority of the data processing and wrote the manuscript. All authors significantly contributed to the manuscript and have read and approved the final manuscript.
This work was supported by National Key Research and Development Program of China (2021YFE0190100) and the Science and Technology Program in Inner Mongolia (No. 201802097).
The authors declare that the research was conducted in the absence of any commercial or financial relationships that could be construed as a potential conflict of interest.
All claims expressed in this article are solely those of the authors and do not necessarily represent those of their affiliated organizations, or those of the publisher, the editors and the reviewers. Any product that may be evaluated in this article, or claim that may be made by its manufacturer, is not guaranteed or endorsed by the publisher.
We would like to thank Editage for their modification suggestions during this period.
The Supplementary Material for this article can be found online at: https://www.frontiersin.org/articles/10.3389/fsufs.2022.913763/full#supplementary-material
Barbieri, E., Guescini, M., Calcabrini, C., Vallorani, L., Diaz, A. R., Fimognari, C., et al. (2016). Creatine prevents the structural and functional damage to mitochondria in myogenic, oxidatively stressed C2C12 cells and restores their differentiation capacity. Oxid. Med. Cell Longev. 2016, 5152029. doi: 10.1155/2016/5152029
Barcelos, R. P., Stefanello, S. T., Mauriz, J. L., Gonzalez, G. J., and Soares, F. A. C. (2016). Creatine and the liver: metabolism and possible interactions. Mini Rev. Med. Chem. 16, 12–18. doi: 10.2174/1389557515666150722102613
Bokulich, N. A., Sathish, S., Jeremiah, J. F., Dirk, G., Jeffrey, I. G. R., Rob, K., et al. (2013). Quality-filtering vastly improves diversity estimates from Illumina amplicon sequencing. Nat. Methods. 10, 57–59. doi: 10.1038/nmeth.2276
Chen, S. F., Zhou, Y. Q., Chen, Y., and Gu, J. (2018). fastp: an ultra-fast all-in-one FASTQ preprocessor. Bioinformatics. 34, i884–i890. doi: 10.1093/bioinformatics/bty560
Edgar, R. C. (2013). UPARSE: highly accurate OTU sequences from microbial amplicon reads. Nat. Methods. 10, 996–998. doi: 10.1038/nmeth.2604
Edgar, R. C., Haas, J. B., Clemente, C. J., Quince, C., and Knight, R. (2011). UCHIME improves sensitivity and speed of chimera detection. Bioinformatics. 27, 2194–2200. doi: 10.1093/bioinformatics/btr381
Fukuda, T., Majumder, K., Zhang, H., Matsui, T., and Mine, Y. (2017). Adenine has an anti-inflammatory effect through the acti-vation of adenine receptor signaling in mouse macrophage. J. Funct. Foods. 28, 235–239. doi: 10.1016/j.jff.2016.11.013
Gao, K., Xu, J. S., Sun, J., Xu, Y. H., Wei, J. H., and Sui, C. (2016). Molecular cloning and expression of squalene epoxi-dase from a medicinal plant, bupleurum Chinense. Chin. Herbal Med. 8, 67–74. doi: 10.1016/S1674-6384(16)60010-2
Gao, W. H. (2018). Effects of Lactobacillus on Glucolipids Metabolism and Intestinal Flora in Type 2 Diabetic Mice Fed with High-Glucose and High-fat Diet. Shanxi: Shanxi Normal University.
Guo, L., Ya, M., Guo, Y. S., Xu, W. L., Li, C. D., Sun, J. P., et al. (2019). Study of bacterial and fungal community structures in traditional koumiss from Inner Mongolia. J. Dairy Sci. 102, 1972–1984. doi: 10.3168/jds.2018-15155
Guo, M. J., Wu, F. H., Hao, G., Qin, Q., Li, R., Li, N., et al. (2017). Bacillus subtilis improves immunity and disease resistance in rabbits. Front. Immunol. 8, 354. doi: 10.3389/fimmu.2017.00354
Hara, Y., Kume, S., Kataoka, Y., and Watanabe, N. (2021). Changes in TCA cycle and TCA cycle-related metabolites in plasma upon citric acid administration in rats. Heliyon. 7, e08501. doi: 10.1016/j.heliyon.2021.e08501
Jacobs, M., and Gordon, R. (2018). Evaluation of the microbiome of mares' milk through lactation. J. Anim. Sci. 96, 255–256. doi: 10.1093/jas/sky404.559
Koh, W. Y., Uthumporn, U., Rosma, A., Irfan, R., and Park, Y. H. (2018). Optimization of a fermented pumpkin-based beverage to improve Lactobacillus mali survival and α-glucosidase inhibitory activity: a response surface methodology approach. Food Sci. Hum. Well. 7, 57–70. doi: 10.1016/j.fshw.2017.11.001
Li, Q. Y., Zhang, C. J., Xilin, T. Y., Ji, M. Y., Meng, X. X., Zhao, Y. L., et al. (2022). Effects of Koumiss on intestinal immune modulation in immunosuppressed rats. Front. Nutr. 9, 765499. doi: 10.3389/fnut.2022.765499
Liao, J. L., Xiong, Y., Liu, Z. H., Zhang, W. W., Zhu, F., Zhan, H., et al. (2017). The protective effect of chronic Clonorchis sinensis infected polarized M2 macrophages on lung of septic rats. Chin. J. Emerg. Medi. 26, 533–537. doi: 10.3760/cma.j.issn.1671-0282.2017.05.010
Liu, M. J., Bayjanov, J. R., and Renckens, B. (2010). The proteolytic system of lactic acid bacteria revisited: a genomic comparisonz. BMC Genomics. 11, 1–15. doi: 10.1186/1471-2164-11-36
Liu, S. M. (2015). Research on the Antioxidant Ability and Mechanism of Different Lactic Acid Bacteria. Harbin: Northeast Agricultural University.
Liu, W. J., Duo, L. N., Liu, Y. H., Ren, D. Y., Zhang, H. P., and Meng, H. (2019). The diversity of lactic acid bacteria in Mongolian traditional sour horse milk was studied by pure culture method and PacBio sequencing technology. J. Chin. Food Sci. Technol. 19, 27–37.
Lu, D. L., and Liu, P. L. (2018). Nutritional value and health care function of koumiss. Xinjiang Anim. Husband. 33, 4–10.
Magoč, T., and Salzberg, S. L. (2011). FLASH fast length adjustment of short reads to improve genome assemblies. Bioinformatics. 27, 2957–2963. doi: 10.1093/bioinformatics/btr507
Mcauliffe, O., Kilcawley, K., and Stefanovic, E. (2018). Symposium review: genomic investigations of flavor formation by dairy microbiota. J. Dairy Sci. 102, 909–922. doi: 10.3168/jds.2018-15385
Mcsweeney, P. L. H. (2004). Biochemistry of cheese ripening. Int. J. Dairy Technol. 57, 127–144. doi: 10.1111/j.1471-0307.2004.00147.x
Mi, R., Chen, X., Xiong, S., Qi, B., Li, J., Qiao, X., et al. (2021). Predominant yeasts in Chinese Dong fermented pork (Nanx Wudl) and their aroma-producing properties in fermented sausage condition. Food Sci. Hum. Well. 10, 231–240. doi: 10.1016/j.fshw.2021.02.013
Nuraida, L. (2015). A review: health promoting lactic acid bacteria in traditional Indonesian fermented foods. Food Sci. Hum. Well. 4, 47–55. doi: 10.1016/j.fshw.2015.06.001
Ondov, B. D., Bergman, N. H., and Phillippy, A. M. (2011). Interactive metagenomic visualization in a Web browser. BMC Bioinform. 12, 385. doi: 10.1186/1471-2105-12-385
Roostita, R., and Fleet, G. H. (1996). Growth of yeasts in milk and associated changes to milk composition. Int. J. Food Microbiol. 31, 205–19. doi: 10.1016/0168-1605(96)00999-3
Rui, Y., Wan, P., Chen, G. J., Xie, M. H., Sun, Y., Zeng, X. X., et al. (2019). Analysis of bacterial and fungal communities by Illumina MiSeq platforms and characterization of Aspergillus cristatus in Fuzhuan brick tea. LWT. 110, 168–174. doi: 10.1016/j.lwt.2019.04.092
Sha, S. P., Jani, K., Sharma, A., Anupma, A., Pradhan, P., and Shouche, Y. (2017). Analysis of bacterial and fungal communities in Marcha and Thiat, traditionally prepared amylolytic starters of India. Sci. Rep. 7, 10967. doi: 10.1038/s41598-017-11609-y
Sha, S. P., Suryavanshi, M. V., Jani, K., Sharma, A., Shouche, Y. S., and Tamang, J. P. (2018). Diversity of yeasts and molds by culture-dependent and culture-independent methods for mycobiome surveillance of traditionally prepared dried starters for the production of Indian alcoholic beverages. Front. Microbiol. 9, 2237. doi: 10.3389/fmicb.2018.02237
Sha, S. P., Suryavanshi, M. V., and Tamang, J. P. (2019). Mycobiome diversity in traditionally prepared starters for alcoholic beverages in india by high-throughput sequencing method. Front. Microbiol. 10, 348. doi: 10.3389/fmicb.2019.00348
Terefe, N. S. (2016). Food Fermentation Reference Module in Food Science. Elsevier. doi: 10.1016/b978-0-08-100596-5.03420-x
Wilburn, J. R., and Ryan, E. P. (2017). “Chapter 1 - fermented foods in health promotion and disease prevention: an overview A2 - Frias, Juana,” in Fermented Foods in Health and Disease Prevention, eds C. Martinez-Villaluenga and E. Peñas (Boston: Academic Press), 3–19.
Wu, R. H., Bao, L. S., Bao, X. P., Li, S., Wang, X. Y., and Jia, S. R. (2019). Analysis of chemical components and bacterial diversity of fermentation starter for dietotherapeutic Koumiss in Kerqin, Inner Mongolia. Sci. Tech. Food Industry. 40, 179–185. doi: 10.7506/spkx1002-6630-20180621-419
Xia, Y., Erdenebat, O., Yang, Y., and Quan, S. (2022). Comparative metabolomics and microbial communities associated network analysis of black and white horse- sourced koumiss. Food Chem. 370, 130996. doi: 10.1016/j.foodchem.2021.130996
Xia, Y., Yu, J., Liu, H., Feng, C., and Shuang, Q. (2021). Novel insight into physicochemical and flavor formation in koumiss based on microbial metabolic network. Food Res. Int. 149, 110659. doi: 10.1016/j.foodres.2021.110659
Yang, W., De, H., and Zhang, M. (2008). Horse milk and milk product application. J. Inner. Mongolia Uni Nationalities. 2, 89–90. doi: 10.3969/j.issn.1008-5149.2008.02.043
Yu, J., Xia, Y., Qiao, X., Jin, Z., Li, P., Wang, R., et al. (2021). Analysis of flavor substances and microbial diversity in nautral starter of koumiss in xilin gol pastoral area. Sci. Tech. Food Industry. 42, 112–121. doi: 10.13386/j.issn1002-0306.2020090110
Zhao, F. H., Liu, Y. H., Li, Z., Li, W. C., Xu, H. Y., Sun, Z. H., et al. (2019). Bacterial diversity of fresh mare's milk in Xilingol. Microbiolo. Chin. 46, 3295–3304. doi: 10.1007/s12666-019-01799-6
Zheng, W. J., Yoo, K. H., Abd El-Aty, A. M., Park, D. H., Choi, J. M., Kim, S. K., et al. (2019). Quantitative determination of carbasalate calcium derived metabolites, acetylsalicylic acid and salicylic acid, in six animal foods using liquid-liquid extraction method coupled with liquid chromatography-tandem mass spectrometry. Food Chem. 278, 744–750. doi: 10.1016/j.foodchem.2018.11.118
Keywords: mare milk, koumiss, nutrient content, microbial communities, diet
Citation: Li Q, Zhao Y, Siqin B, Xilin T, Zhang N and Li M (2022) Changes in Microbial Diversity and Nutritional Components of Mare Milk Before and After Traditional Fermentation. Front. Sustain. Food Syst. 6:913763. doi: 10.3389/fsufs.2022.913763
Received: 06 April 2022; Accepted: 31 May 2022;
Published: 04 July 2022.
Edited by:
Rakesh Bhardwaj, National Bureau of Plant Genetic Resources (ICAR), IndiaReviewed by:
Shankar Prasad Sha, Kurseong College, IndiaCopyright © 2022 Li, Zhao, Siqin, Xilin, Zhang and Li. This is an open-access article distributed under the terms of the Creative Commons Attribution License (CC BY). The use, distribution or reproduction in other forums is permitted, provided the original author(s) and the copyright owner(s) are credited and that the original publication in this journal is cited, in accordance with accepted academic practice. No use, distribution or reproduction is permitted which does not comply with these terms.
*Correspondence: Na Zhang, emhhbmduYTU2NzdAMTYzLmNvbQ==; Minhui Li, cHJvZl9saW1pbmh1aUB5ZWFoLm5ldA==
†These authors have contributed equally to this work
Disclaimer: All claims expressed in this article are solely those of the authors and do not necessarily represent those of their affiliated organizations, or those of the publisher, the editors and the reviewers. Any product that may be evaluated in this article or claim that may be made by its manufacturer is not guaranteed or endorsed by the publisher.
Research integrity at Frontiers
Learn more about the work of our research integrity team to safeguard the quality of each article we publish.