 Seyi Olalekan Olawuyi
 Tosin Dolapo Olawuyi3
 Olusegun Jeremiah Ijila
95% of researchers rate our articles as excellent or good
Learn more about the work of our research integrity team to safeguard the quality of each article we publish.
Find out more
ORIGINAL RESEARCH article
Front. Sustain. Food Syst. , 15 June 2022
Sec. Land, Livelihoods and Food Security
Volume 6 - 2022 | https://doi.org/10.3389/fsufs.2022.902289
This article is part of the Research Topic Enhancing Food Production System Resilience for Food Security Facing a Changing Environment View all 15 articles
This study investigated the effect of resilience components and indicators on households' welfare distribution in the study area, using the data collected from households' surveys. Respondents were drawn from the study area through the multistage random sampling technique; while the data obtained from 363 sampled respondents were analyzed and described through the use of descriptive statistics (frequency distribution, percentages, and cross tabulation technique). The resilience tool of the Food and Agriculture Organization of the United Nations (UN-FAO) was adopted to measure the resilience pillars through their corresponding components/indicators. Similarly, a quantile regression econometric model was used to estimate the effect of the resilience pillars vis-à-vis the indicators on welfare distribution in the study area. The results indicated that the majority of the respondents fall within the low quintiles of households' welfare, while women were found to be disproportionately vulnerable to shocks, as many of them fall within the low welfare class. The resilience pillars/components were found to have varying degrees of significance and direction of movement with quintiles of households' welfare status. This was observed across all the quintiles (0.1, 0.25, 0.50, 0.75, and 0.90; that is, 10, 25, 50, 75, and 90th quintiles), respectively. The study recommended proper and transparent implementation of functional social protection programs to reduce households' vulnerability to shock and stressors. There is also the need for investments to be made across all pillars and indicators of resilience to build sustained households' resilience capacity and welfare status.
The concept of resilience has attracted attention from many experts to address the challenges facing all sectors of the economy, including the agri-food system. Food and Agriculture Organization (FAO) and other notable development experts have also been advocating for building resilient systems (both agri-food and non-agri-food) from many perspectives (Food Agriculture Organization (FAO), 2013; Choptiany et al., 2014). In fact, the International Food and Policy Research Institute (IFPRI) had once organized a conference with the theme “building resilience for food and nutrition security” (Fan et al., 2014). All these moves evidently mirror the importance of developing adaptive capacity for resilience building against stresses, shocks and emergencies facing our society, especially the agri-food system. Importantly, resilience study and analysis evaluate the individual or household capacity to manage the effect of shocks from a multi-faceted approach (d'Errico and Di Giuseppe, 2018).
Food Agriculture Organization (FAO) (2019) also noted that the conceptualization of farmers' or farming households' food security status vis-à-vis food insecurity status and other welfare outcomes must incorporate a measure of resilience to a shortfall in well-being status owing to various exigencies such as insufficient and/or lack of productive resources, risks and shocks constituents, including droughts, wars, and economic instability. This also includes unprecedented emergencies such as the current COVID-19 health pandemic and other risks and challenges. Meanwhile, it is important to emphasize that inadequate or lack of access to productive resources (required to build adaptive capacity and overall resilience against shocks) by the less developed countries that are resource-poor poses a big problem to step up to the challenges facing the world, which by extension also has consequential impact and shock on the food systems (Issahaku and Abdulai, 2019; Jones et al., 2022). Further, the global situation on the COVID-19 pandemic is a great shock suffered by the entire sector of the Nigerian economy, including the food sector and sub-sectors; this evidently threatens sustained food availability, accessibility, and affordability due to its significant impact on welfare and other aspects of human development.
Apparently, from the foregoing, building farmers' resilience and adaptive capacity against shocks in an unprecedented health-related pandemic period through access to the required and sufficient productive resources, social investment, and social protection programs are necessary. These are potential game changers for the people, including the smallholder farmers to improve productivity, food availability, farmers' income, and general households' welfare across all the sectors in Nigeria. Therefore, this research interrogated the effect of resilience indicators and components on households' welfare distribution in Oyo State, Nigeria.
Following the study by Barrett and Constas (2014), this study adopted a theory of resilience as it applies to the challenges of international development. This theory presents a sound theoretical argument to promote a more focused measure of resilience for international development applications; and, resilience development is the ability of individuals or households to avoid myriads of shocks and stressors that can propel transition into poverty traps over time.
This conceptualization of the theory of resilience development emphasizes the non-linear and uncertain time path of standards of living, and people's welfare conditions, which could express themselves as vulnerable or non-vulnerable, poor or non-poor, food secure or food insecure, as well as other forms of welfare representations. This theory also underscores the adverse effects of various forms of risk, shocks, or stressors that can be appalling, and capable of transforming people's conditions from good to bad, and bad to worse. Suffice it to say that the theory of developing resilience is concerned about the “stochastic dynamics of human well-being and/or stochastic poverty trap” because it is inversely related to the probability of being vulnerable and remaining vulnerable (Barrett and Carter, 2013; Barrett and Constas, 2014). It is important to emphasize that multiple stable states are not necessary for the existence of poverty traps in the theory of development resilience (Barrett and Carter, 2013).
In line with Barrett and Constas (2014), the variable of interest emphasized in the theory of developing resilience is an individual's or households' of many people's well-being, which can be denoted by “W”, and a person or household's unfavorable or chronic state mirrors the sustained deprivation of capabilities, as also explained by the concept of Amartya Sen's “capabilities” (Sen, 1999). Therefore, the capabilities framework is a nested special case defined by welfare and/or well-being indicators such as “income, expenditures, assets, health, food and nutritional status, subjective life satisfaction or security” and, it could also be conceptualized from a multidimensional perspective of welfare measures (Alkire and Foster, 2011).
Given that well-being may increasingly be stochastic, which can also be influenced by myriads of both endogenous and exogenous events, simply put as a disturbance term, et so that the progression of well-being over time, from Wt in period t to Wt+s in period t+s, is dependent on random stressors and/or shocks. In line with Barrett and Constas (2014), an appropriate representation of stochastic welfare dynamics is through conditional welfare expressed by the moment function, mk (Wt+s|Wt , et), where: mk represents the kth moment; that is, the mean (k = 1), variance (k = 2), or skewness (k = 3). Now, based on the theory of resilience development, these moments perfectly describe the conditional dynamics of the full distribution of possible welfare outcomes that may be functionally related to resilience capacity.
The study area is Oyo State (Figure 1), which is an inland area located in the southern part of Nigeria, and bounded by many states from the south, north, west, and eastern parts. The climate is equatorial characterized by “wet and dry seasons.” The people in the state are predominantly farmers, while most women engage in on-farm and off-farm livelihood activities such as food processing, trading, and artisanship. The relatively high humidity in the area favors the cultivation of arable and tree crops such as like maize, yam, cassava, millet, rice, plantains, cocoa, palm produce, cashew, etc. The State has 33 Local Government Areas (LGAs); of which 28 LGAs are considered rural and semi-rural. The State is divided into 4 Agricultural Development Program (ADP) Zones (Ibadan, Ibarapa, Ogbomoso, and Oyo) in the State (www.oyostate.com).
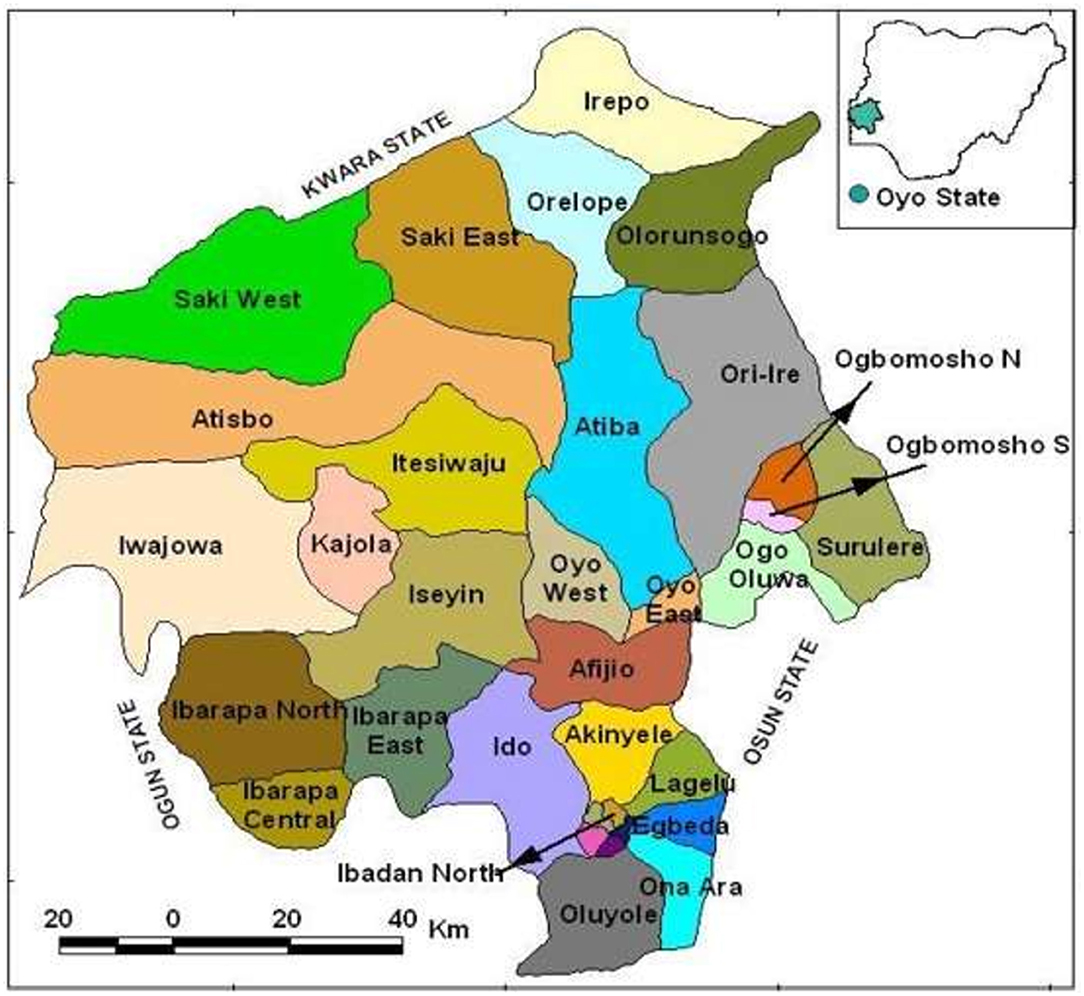
Figure 1. Map of Oyo State, Nigeria.
A multistage sampling technique was used to select the sample size for this study. Oyo State is made up of 4 Agricultural Development Program (ADP) zones which are structured into different blocks namely: Ibadan/Ibarapa zone with nine blocks, Ogbomoso zone with five blocks, Oyo zone with five blocks, and Saki zone with nine blocks. So, in the first stage, one-third of the blocks in each zone were selected resulting in 10 blocks in total. Because of the homogeneous nature of the villages in the study area, three villages were randomly selected from each of the blocks in the second stage, making 30 selected villages. In the third stage, the study applied a random proportionate to size sampling technique in the selection of the sample size (384 respondents) for this research; this technique was deemed appropriate because of the variations that exist in the population of people across the selected villages.
According to Miaoulis and Michener (1976), the three main criteria which are usually considered in the determination of a suitable sample size for any study are the level of precision, confidence level, and the degree of variability. Therefore, this research selected the representative sample for this study through the validated method for sample size determination for an unknown population, using the confidence level technique of Z-score (Shete et al., 2020). This is expressed as follows:
The followings are also defined as:
n0 = Sample size to be estimated
z2 = Selected critical value of desired level of confidence or risk
p = Estimated proportion of an attribute that is present in the population or maximum variability of the population
q = 1 − p
e = error margin
At a 0.05 error margin (95% confidence interval), the sample size is calculated as:
It is important to stress that data from 363 respondents were used in the final analyses, owing to incomplete responses observed from few data collection instruments.
The study used descriptive statistics such as frequency distribution, percentages, and cross-tabulation techniques to describe the respondents' personal and demographic attributes, as well as to profile the distribution of respondents based on the welfare quintiles they fall into. Borrowing from Atkinson (1989) as well as Baiyegunhi and Fraser (2011), realized welfare, as against potential welfare was constructed through per capita consumption-expenditure approach to measure the welfare indicator used in this study. This was considered an
where:
Wi = index of households' welfare status.
appropriate indicator of welfare expression owing to the fact that it is an absolute welfare measure. In the same vein, FAO's RIMA-II model (resilience tool) (Food Agriculture Organization (FAO), 2016) was used to elicit resilience information from the respondents and applied to measure different dimensions and components/indicators of resilience (physical and capacity dimensions, as well as information on natural environment addressing both exogenous and endogenous factors). More so, the quantile regression model was employed as an inferential statistical technique to estimate the influence of resilience components and indicators on households' welfare distribution in the study area.
The household economic behavior under constrained utility maximization was applied to model the level of households' expenditure based on the money-metric indicator of welfare. Households' consumption expenditure is assumed to describe the social and economic environments in which production decisions are made. The preference for the consumption expenditure approach over the income-based household's welfare measure as noted by Baiyegunhi and Fraser (2011) citing Atkinson (1989) is driven by the fact that welfare opportunity is a function of income, or suffice it to say that income is assumed to measure potential welfare. On the other hand, consumption-expenditure suggests a “realized welfare or a measure of welfare achievement” (Atkinson, 1989) as cited in Baiyegunhi and Fraser (2011). However, this study is interested in farmers' present achieved welfare (realized welfare) as against future expected welfare gains (potential welfare); apparently, the consumption-expenditure welfare expression concept is an appropriate indicator. Baiyegunhi and Fraser (2011) further buttressed that, poor individuals are assumed to have a relatively constant expenditure pattern on some basic bundles of goods, all things being equal, compared to the income-stream which in most cases is assumed to be erratic and unpredictable.
Therefore, the welfare indicator and expression were constructed by using per capita values of consumption-expenditure on food and non-food items. The use of this welfare expression is deemed appropriate for this kind of study because the variable is in continuous form, compared to other similar approaches for constructing welfare indicators (for instance, poverty status and food security status). This approach used per capita expenditure approach to construct the poverty or food security line, and it is further rescaled to binary forms, through the use Foster et al. (1984) technique. The technique apparently is not suitable for distributional impact research (Olagunju et al., 2019). Therefore, this study constructed the welfare indicator using the following:
According to Boukary et al. (2016), the application of the concept of resilience has been proposed by scholars and development experts across many international development corporations for the conceptualization of food insecurity issues (for instance, Alinovi et al., 2010a,b; Food Agriculture Organization (FAO), 2016). The usefulness of the resilience methodological approach as a solid basis for the analysis of individuals' and households' vulnerability to food insecurity cannot be over emphasized (Alinovi et al., 2010a). Resilience, according to Food Agriculture Organization (FAO) (2016) is an important framework applied to gain proper knowledge of the strategies (both short and long terms) needed to build and strengthen the adaptive capacity of individuals and households against shocks and stresses induced by hunger and poverty. Based on theoretical understanding and statistical evidence of relationships, this survey captured the indicators and components of resilience fundamental pillars, as highlighted in Food Agriculture Organization (FAO) (2016). A notable and appealing feature of the resilience framework is that it identifies and describes how shocks and stressors, economic forces, and social conditions of the system, as well as its combined effect, have raised the incidence and severity of vulnerability of a given population [Food Agriculture Organization (FAO), 2016]. Explicitly, the fundamental pillars of resilience and corresponding indicators, according to Food Agriculture Organization (FAO) (2016) and Boukary et al. (2016) are explained as follows:
a. Asset (AST): Possession of capital assets is noted to be useful as a coping mechanism to mitigate shocks induced emergencies. In this study, assets could be held as landed properties, crop and livestock units, jewelry, television, car, bike, dwelling, telephone, etc. Suffice to say that, possession of any of these assets by an individual equals 1 and 0 otherwise.
b. Adaptive capacity (ACS): Adaptive capacity as an indicator mirrors an individual's ability or capability to cope and adapt to shocks in a way that will not disrupt the proper functioning of that individual. For instance, wealth, technology, economies of large scale, access to information and training/skills, access to infrastructure, and institutions are parts of many dynamics that influence an individual's adaptive capacity.
The following variables are appropriate components of this indicator:
Perception: This has to do with the opinion of one's capability to withstand shocks.
Income source: This has to do with livelihood diversification through the count of the individual's source of income. All else equal, it is assumed that individuals with highly diversified sources of income can potentially adapt to any episode of shocks and emergencies.
Migration: This component addresses if an individual has cause to deal with shocks or food scarcity through migration to another location. It is usually captured as a dummy variable.
Credit: This mirrors individual's access to formal and informal credit facilities over the observation period, as well as the nature- of such credit, be it kind or cash; measured as a dummy variable.
c. Social safety nets (SSN): This component interrogates individual's access to social investment and social protection programs, as these are regarded as important means of mitigating crises and emergencies. In the crisis and emergency situations, farmers often resort to getting help and assistance from friends, colleagues, relatives, government and non-governmental organizations, as well as development corporations and charity organizations. Hence, assistance received by individuals as per access to free food distribution, food sale at a moderate price, cash transfers, grain bank, and donations from friends, colleagues, and relatives are good and promising proxies. Thus, reported access to any of these components equals 1 and 0 otherwise.
d. Climate change (CC): In agrarian settings, climate-induced extreme events can highly affect the capacity of the individual to make a living. The conceptualization of climate change in the context of the Intergovernmental Panel on Climate Change implies any alteration or variation in the climatic components over a period of time; such variation could be a result of natural erraticism or human activities. Examples of promising components are evidence of soil-water erosion and soil degradation. Based on this, any reported event equals 1 and 0 otherwise.
e. Access to basic services and quality of the access (ABSQ): Access to basic services can be conceptualized from two perspectives: access to basic services and the quality of access and services. In terms of access, the following are considered good components: access to school, hospital, and other health services, markets, stores, paved roads, safe houses, and water as well as waste disposal systems, etc. Conversely, a good proxy for the quality of access can be the monetary cost of access to services; alternatively, subjective indicators can also be applied, which could capture general opinion about the quality of services and disposition to the security situation in the community or village where the individual is domiciled (Boukary et al., 2016; Food Agriculture Organization (FAO), 2016).
f. Enabling Institutional Environment (EIE) (Institutional functionality): Institutional functionality can impact an individual's capacity to deal with and respond to shocks and stresses. The overall idea is to use observable variables and individual perception as proxies for the latent-enabling institutional environment as a variable. For example, access to basic and important information, perceptions of the presence of services (for instance, extension services), and perception of the quality of such services; such that any reported access to services equals 1 and 0 otherwise. Meanwhile, perceptions of the presence of services, and perception of the quality of such services are usually conceptualized through ordinal ranking.
g. Sensitivity (SVTY): Incidence, Frequency, and the Intensity of shocks and stresses - (that is, single or repeated shocks occurring over a given period of time: for instance, illness).
h. Social Capital and Neighborhood Effect (SCNE)
– Social group membership/social-networks accumulation (dummy).
– Participation in collective action initiatives (Reciprocity and Trust) (dummy).
The classical quantile regression represents an extended version of multiple regression (Debebe and Zekarias, 2020), and the model predicts that “explanatory variables relate at different points of the dependent variable(s) and has a comparative advantage when errors are highly non-normal and hence automatically adjusted the non-normal errors and outliers data sets.” The feature described here is common to welfare differential analysis. More importantly, this technique permits to properly mirror the exact “stochastic relationship between random variables.” The quantile regression model had also been previously applied by previous related welfare analysis studies such as, for instance, Fentaw and Appa (2016), Samuel (2017), Teka et al. (2018). Therefore, according to Samuel (2017), the quantile regression model is specified as:
where: depicts the estimation of the model τth quantile Qτ of the distribution of the dependent variable (Y), conditional on the value of explanatory variables (X).
where: Yi is the welfare status (in quintiles) of ith household, represents a column vector of realizations on k explanatory variables, and β is the column vector corresponding to unknown parameters 0 ≤ q ≥ 1 is the quantile of interest.
As noted by Buchinsky (1998), the use of very few cross-sectional observations may present an issue toward model identification in the quantile regression analysis across predefined quantiles. For instance, the computed estimates will be spurious, and very imprecise, as well explained in Barnes and Hughes (2002); but this study used relatively large cross-sectional observations. Importantly, if the quantile regression is performed by using an aggregate welfare index (without delineating it into welfare quintiles), this may provide misleading inferences in terms of diversifying away from the contributions of each of the resilience pillars at varying levels of welfare quintiles, and may possibly dilute the impact of the quantile regression estimates.
In addition, the study is focused on the relative values of the resilience components parameters along the quintile categories, therefore, the absolute amount of bias should be of secondary concern, as emphasized in Barnes and Hughes (2002).
This section describes the results and findings from the data generating process and its subsequent analyses. These are discussed as follows.
The results in Table 1 revealed the distribution of respondents across the welfare quintiles estimated. The findings indicated that more than half (25% and 32.50%) of the respondents fall within the lowest (10th) and the second lowest (25th) welfare quintiles. Then, only 9.4% dcrease in the median quintile (50th). Meanwhile, 20.1% and 12.94% of the sampled respondents constitute the proportion of people who fall within the fourth (75th) and the fifth (90th) quintile classes. This evidently shows that most people in the study area are vulnerable to shocks.
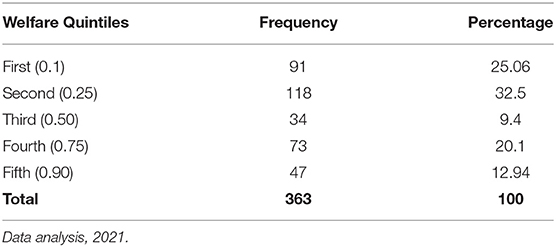
Table 1. Distribution of respondents by welfare quintiles.
The cross-tabulation of the distribution of welfare quintiles by respondents' gender is shown in Table 2. The findings revealed that the majority of the respondents on both counts (male and female) constitute the bulk of the population of individuals who fall within the lowest (10th) and the second lowest (25th) welfare quintiles. However, very few of the male and female populations were found in the fourth (75th) and the fifth (90th) quintile continuum. This result agrees entirely with the findings discussed earlier in the previous table; a clear indication of the respondents' exposure, and perhaps vulnerability to shocks, stressors, and emergencies.
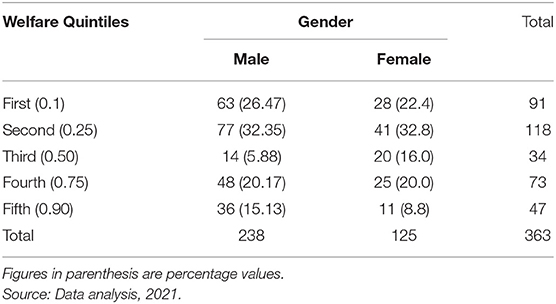
Table 2. Cross-tabulation of Gender and Welfare Quintiles.
The estimation of the quantile regression model as shown in Table 3 revealed the magnitude and direction of movement of resilience pillars (driven by their respective indicators) on farming households' welfare status in the study area. The estimation also revealed that the model fit is good, and has pseudo R2 ranging from 0.3216 to 0.5798 across all the quintiles (0.1, 0.25, 0.50, 0.75, and 0.90) (that is, 10th, 25th, 50th, 75th, and 90th) considered. Many of the resilience pillars were shown to have different directions of movement, and varying degrees of statistically significant effect across quintiles of households' welfare status.

Table 3. Quantile regression: effect of resilience indicators on households' welfare distribution.
Specifically, the findings indicated that quadratic age has a direct and significant effect on households' welfare status at 10th (p < 0.05), 25th (p < 0.01), median-50th (p < 0.01), and 75th (p < 0.01) quintiles, respectively. This result has a strong link with the life cycle hypothesis in that, every increase in age induces higher households' welfare status, which is consistent along the welfare status continuums. All else equal, this result agrees with a-priori expectation and the findings of Muntaha and Matz (2015); because people in the “aged category” are likely to receive remittances and gifts from children, family members, and friends, as a gesture of societal and cultural values and responsibilities. Similarly, in line with Quisumbing et al. (2011), the gender of the respondent was found to have an inverse and significant effect on households' welfare status at 10th (p < 0.01) and 25th (p < 0.1), respectively. However, gender also has a direct and significant effect on households' welfare status at a slightly higher quintile (median-50th); a tenable explanation for this is that women are disproportionately poor compared to their male counterparts, hence the reason for the observed low welfare status among them; meanwhile, the positive and significant effect of the variable-gender at the median (50th) quintile pointed to the fact that there is a hope of transition from their present state to a better welfare status if they are equitably exposed to gender-just policies, and especially the social protection programs.
The estimation also indicated an indirect and significant impact of family size on households' welfare status at 10th (p < 0.01), 25th (p < 0.05), median-50th (p < 0.1) quintiles, respectively. Expectedly, this suggests that an increase in family size impacts negatively on households' welfare status, considering the lack of buffers and adaptive capacity, as well as the vulnerability of most people in the rural settlements of Nigeria. This finding is consistent with documented evidence in many extant studies.
The results in Table 3 also indicated the dynamics of resilience pillars and indicators in building sustained households' welfare. For instance, possession of assets (AST) has a direct and significant impact on households' welfare at the same probability level (p < 0.1) but this significant effect was observed for median-50th, and higher (75th and 90th) quintiles only. This is expected, and further affirms the submission from notable literature (Quisumbing et al., 2011; Lokonon, 2017) that the more assets a household owns, the higher the likelihood of using the assets as buffers against any emergencies, shocks, and stresses.
More so, adaptive capacity and stability (ACS) were found to have a direct and significant impact on households' welfare status, only at higher quintiles [75th (p < 0.05) and 90th (p < 0.01)] respectively. This suggests that people who are in the higher quintiles of welfare status are the only ones who have the capacity to adapt and withstand shocks and stressors. More so, it is assumed that a household with high adaptive capacity will have a great level of resilience and higher welfare, but rural areas are characterized by low access to credit and a limited number of income sources, which push many households to lean toward friends, family members and networks to get assistance in-kind and cash, which obviously serve as buffers to respond to any shocks, stressors, and emergencies (Muntaha and Matz, 2015).
As far as the social safety nets (SSN) resilience pillar is concerned, with the exception of the median quintile, the study found both direct and inverse effects of social safety nets on households' welfare status across all quintiles: 10th (p < 0.1), 25th (p < 0.1), 75th (p < 0.01), and 90th (p < 0.01). This result is expected and agrees with the findings of Dillon and Quinones (2011) as well as Muntaha and Matz (2015) because benefitting from all kinds of social safety nets (for instance, receiving help from friends and relatives in the form of cash transfer and remittances, as well as government's social intervention and/or social protection programs) provides support for individuals, and cushion the effect of any episodes of shocks and stressors; and vice-versa.
Similarly, the findings also revealed an indirect and significant impact of climate change (CC) induced components or indicators on households' welfare status in the 10th 25, and 50th quintiles, respectively, all at (p < 0.05). The implication of this is that stable climatic condition enhances crop production, and sustained food availability, and by extension improves households' income and welfare. Apparently, any disturbance or shock in the climatic elements (especially rainfall) will negatively affect food production because agriculture in this part of the country is largely rain-fed dependent. The unfavorable situation (which also includes incidence of drought, soil erosion, and soil degradation) could weaken food availability and sufficiency, and equally puts households at a welfare risk. All of these can affect the capacity of a household to make a living, and respond to any shocks appropriately; hence, there is a need for social protection programs to reduce households' vulnerability to climate change induced episodes because of its consequential impact on households' welfare, irrespective of social class (Davis and Ali, 2014). It is important to stress that climate extreme events impact disproportionately on the people who are in the lower quintiles compared to those in the higher quintiles of households' welfare.
In a similar manner, access to basic needs/services and quality of services (ABSQ) as a resilience pillar and components revealed both a direct and inverse association with households' welfare at all levels of welfare quintiles, though with varying degrees of probability levels [(10th (p < 0.01), 25th (p < 0.01), 50th (p < 0.1), 75th (p < 0.05), and 90th (p < 0.01)]. Judging from the estimates, access to basic needs/services and quality of services has a direct impact on households' welfare status at the lowest welfare quintile (10th) only, while it has an inverse relationship with households' welfare status at other welfare quintiles. Basically, access to basic services has been touted as a fundamental aspect of resilience building; such as good roads, schools, health care centers, water, electricity, and nearby markets. For instance, access to markets, and the efficacy of aid distribution in response to emergency situations are directly and indirectly influenced by the density of the road network. Notable evidence supports the relationship between access to basic services before emergencies and the recovery rate after an emergency situation (Khan, 2014).
Similarly, access to basic services is pivotal to determining an individual's risk of exposure; for instance, the risk of illness is often associated with inadequate waste disposal, poor water supplies, and sanitation issues (Dercon et al., 2004). Likewise, poor institutional performance often leads to the total neglect of the important areas like housing, healthcare, and sanitation; which consequently lead to inefficient responses to emergencies and shocks. All in all, poor access to basic and quality services can be detrimental to households' livelihood and income generating activities, and also block the pathway to building improved households' welfare and prosperity.
With respect to enabling institutional environment (EIE), the findings also indicated a negative and significant (p < 0.01) relationship with households' welfare, but this relationship only expressed itself at a low welfare quintile (25th). This is to say that institutional functionality in the study area (in terms of (seamless access to information, and good and quality service delivery) is absent or very poor to the extent of having a spill-over effect on households' welfare. In the same vein, sensitivity components have an inverse and significant relationship with households' welfare status at 10th (p < 0.1), 75th (p < 0.1), and 90th (p < 0.01), suggesting that increase in the incidence, frequency and the intensity of shocks and stressors induces negative impact on households' welfare status. Suffice it to say that repeated episodes of shocks (for instance, illness, drought, pandemic, etc.) occurring over a given period of time diminishes people's ability to cope and adapt to shocks, disproportionately (Dercon, 2010).
In terms of social capital and neighborhood effect (SCNE) as a resilience pillar/component, the results indicated a significant and inverse relationship with households' welfare at low (25th) and medium (50th) quintiles, respectively, both at p < 0.01 significant level; while this same component also has a direct and significant impact on households' welfare at 75th (p < 0.01) and 90th (p < 0.1) welfare quintiles. The implication is that most people who fall within the lowest to the medium quintiles do not appropriately use their social networks; perhaps their local level institutions are largely for social gatherings/events. Conversely, the people who fall to the higher welfare quintiles (75 and 90th) appear to judiciously utilize their stock of social networks, connections, and neighborhood effects, in benefitting each other; although this can equally be attributed to the comparative advantage of social class these people enjoy.
From the aforementioned, the findings revealed the importance of resilience pillars in achieving sustained households welfare. Meanwhile, the effectiveness of these important resilience pillars (capital assets, adaptive capacity, social safety nets, climate change adaptation, access to basic services and quality of service, sensitivity as well as social capital and neighborhood effect) in building buffers against shocks is dependent on enabling institutional environment which clearly mirrors institutional functionality in terms of adequate extension delivery systems, sound and viable policy implementation for rural economic development. In essence, extension and advisory services in rural areas are challenging even under normal circumstances, let alone under unfavorable situations and obvious challenges. If these challenges are to be adequately addressed, extension service delivery should be able to aid in enhancing the resilience of farmers in several ways, such as coordinating bodies for multiple support organizations as well as providing more relevant services at various stages of a shock because of its linkages with the local environment, and as a result of its potential access to timely information, extension system is able to identify relevant actors with whom to work to ensure those intervention strategies are harmonized, relevant, effective, and timely.
Another important path through which extension delivery service could enhance resilience building is by providing information and knowledge on climate extreme events, market prices, regulatory structures, and consumer demands so that farmers can make timely informed decisions. Such functional extension delivery systems could also assist in identifying the most vulnerable households that can be easily impacted by shocks, so as to develop a proper register of the vulnerable population to be targeted for interventions. In fact, this will go a long way to assist Nigeria with a credible register and database of the vulnerable population. It is important to stress that the effectiveness of the highlighted areas where extension services could be useful is critically dependent on the funding, organization, and implementation of the extension system and policies in Nigeria. In formulating policies, caution must be taken to avoid a situation where policies designed to achieve a positive goal unintentionally cause deterioration of individual or community resilience.
The resilience assessment of a given food system can only be achieved through a synthetic indicator conceptualized through the resilience tools. Understanding system dynamics, highlighting strategic issues, and identifying and understanding the strength and weaknesses of the system may require both qualitative and quantitative knowledge. Therefore, this study explored the synergies between the components/indicators of resilience and households' welfare distribution in the study area. This study has shown that the majority of the people in the study area are vulnerable to an episode of shocks and stressors without any sustainable buffer options which can be attributed to their limited capacity across all the pillars and indicators of resilience.
The study also revealed that households are at a welfare risk, and find it difficult to build sustained resilience against shocks and stresses; any disturbance and shock in terms of climate-induced extreme events will obviously have untold hardship on households. Apparently, stable climatic condition enhances crop production, builds sustained food availability, and by extension improves households' resilience and welfare status. Then, all kinds of social safety nets (for instance, receiving help from friends and relatives in the form of cash transfers and remittances, as well as government's social intervention/investment programs, etc.) provide support for individuals and cushion the effect of any episodes of shocks and stressors.
Conclusively, the majority of the sampled respondents are lacking across all the major pillars and components of resilience, which renders them vulnerable to shocks and stressors. There is a need for social protection programs to reduce households' vulnerability to shock and stressors. There is a need for investments to be made across all pillars and indicators of resilience to build an improved and sustained households' resilience capacity, and welfare status across all social strata.
This study has contributed to several existing literature on resilience building against shocks and stressors in Nigeria by addressing the gaps identified in the previous related studies in Nigeria. While there is a paucity of studies in Nigeria addressing resilience as a concept through its fundamental pillars and corresponding indicators, many of the available related studies did not give a clear conceptualization of resilience as outlined by FAO. More so, given that welfare appears increasingly stochastic, and can be influenced by various exogenous factors, this study delineated aggregate welfare index into welfare quintiles to be able to show the contributions of each of the resilience pillars at varying degrees of welfare quintile, which to the best of our knowledge is not absolutely considered in any of the previous related studies in the study area.
The raw data supporting the conclusions of this article will be made available by the authors, without undue reservation.
The studies involving human participants were reviewed and approved by the Ethics Committee, Department of Agricultural Economics, Ladoke Akintola University of Technology, Ogbomoso, Nigeria. The patients/participants provided their written informed consent to participate in this study.
SO conceptualized and designed the study. He developed the introduction, research design and methodology. He was involved in the collection, coding and cleaning of the data, and also carried out the data analyses, and he read, reviewed and approved the draft manuscript. TO developed the literature review, and assisted in the data collection activities. She was also involved in the data analysis, and she read, reviewed and approved the draft manuscript. OI also developed part of the literature review, and assisted in the data collection activities. He was involved in the data analysis, and he read, reviewed and approved the draft manuscript. OO assisted in the collection of data, coding and cleaning of the data and data analysis. He also read and approved the draft manuscript. All authors contributed to the article and approved the submitted version.
The authors declare that the research was conducted in the absence of any commercial or financial relationships that could be construed as a potential conflict of interest.
All claims expressed in this article are solely those of the authors and do not necessarily represent those of their affiliated organizations, or those of the publisher, the editors and the reviewers. Any product that may be evaluated in this article, or claim that may be made by its manufacturer, is not guaranteed or endorsed by the publisher.
Alinovi, L., D'Errico, M., Mane, E., and Romano, D. (2010b). Livelihoods Strategies and Household Resilience to Food Insecurity: An Empirical Analysis to Kenya. Rome, Italy: Food and Agriculture Organization of the United Nations (FAO).
Alinovi, L., Mane, E., and Romano, D. (2010a). Measuring Household Resilience to Food Insecurity: Application to Palestinian Households. Chichester, UK: John Wiley & Sons, Ltd.
Alkire, S., and Foster, J. (2011). Counting and multidimensional poverty measurement. J. Public Econ., 95, 476–487. doi: 10.1016/j.jpubeco.2010.11.006
Atkinson, A. B. (1989). “Poverty,” in Social Economics. Eatwell, J., M. Millgate and P. Newman (eds.) (New York: Norton: The New Palgrave), 77–89.
Baiyegunhi, L. J. S., and Fraser, G. C. G. (2011). Vulnerability and poverty dynamics in rural areas of Eastern Cape Province, South Africa. Ghana J. Develop. Stud. (GJDS). 8, 84–100. doi: 10.4314/gjds.v8i2.6
Barnes, M., and Hughes, A. (2002). A Quantile Regression Analysis of the Cross Section of Stock Market Returns. SSRN Electron. J. doi: 10.2139/ssrn.458522
Barrett, C. B., and Carter, M. R. (2013). The economics of poverty traps and persistent poverty: policy and empirical implications. J. Dev. Stud. 49, 976–990. doi: 10.1080/00220388.2013.785527
Barrett, C. B., and Constas, M. A. (2014). Toward a theory of resilience for international development applications. Proc. Natl. Acad. Sci. U.S.A. 111, 14625–30. doi: 10.1073/pnas.1320880111
Boukary, A. G., Diaw, A., and Wünscher, T. (2016). Factors affecting rural households' resilience to food insecurity in Niger. Sustainability. 8, 181. doi: 10.3390/su8030181
Buchinsky, M. (1998). Recent advances in quantile regression models: a practical guideline for empirical research. J. Human Resour. 33, 88–126. doi: 10.2307/146316
Choptiany, J., Graub, B., Dixon, J., and Phillips, S. (2014). Self-Evaluation and Holistic Assessment of Climate Resilience of Farmers and Pastoralists (SHARP). Rome, Italy: FAO. p. 155.
Davis, P., and Ali, S. (2014). Exploring Local Perceptions of Climate-Change Impact and Adaptation in Rural Bangladesh (IFPRI Discussion Paper 01322). Washington, DC: International Food Policy Research Institute.
Debebe, S., and Zekarias, E. (2020). Analysis of poverty, income inequality and their effects on food insecurity in Southern Ethiopia. Agricult. Food Secur. 9, 1–12. doi: 10.1186/s40066-020-00269-3
Dercon, S. (2010). “Risk, poverty and human development: What do we know, what do we need to know?,” in Risk, Shocks and Human Development on the Brink, eds. R. Fuentes-Nieva, and P. A. Seck. (Basingstoke, UK: Palgrave Macmillan), 15–39
Dercon, S., Bold, T., and Calvo, C. (2004). Insurance for the poor? QEH Working Paper. 125 (Oxford, UK: University of Oxford). Available online at: www3.qeh.ox.ac.uk/pdf/qehwp/qehwps125.pdf
d'Errico, M., and Di Giuseppe, S. (2018). Resilience mobility in Uganda: a dynamic analysis. World Develop. 104, 78–96. doi: 10.1016/j.worlddev.2017.11.020
Dillon, A., and Quinones, E. (2011). Gender Differentiated Asset Dynamics in Northern Nigeria. Rome: Food and Agriculture Organization of the United Nations ESA Working Paper, 11–06.
Fan, S., Pandya-Lorch, R., and Yosef, S. (Eds.). (2014). Resilience for Food and Nutrition Security. Washington DC, USA: IFPRI.
Fentaw, A., and Appa, R. (2016). Determinants of income inequality in urban Ethiopia: a study of South Wollo Administrative Zone, Amhara National Regional State. Int. J. Appl. Res. 2, 550–563.
Food and Agriculture Organization (FAO). (2013). Resilient Livelihoods-Disaster Risk Reduction for Food and Nutrition Security Framework Programme. Rome, Italy.
Food and Agriculture Organization (FAO). (2016). Analyzing Resilience for Better Targeting ad Action”. Resilience Index Measurement and Analysis II (RIMA)-II. Rome, Italy: Food and Agriculture Organization of the United Nations.
Food and Agriculture Organization (FAO). (2019). State of Food Insecurity and Nutrition in the World. Rome: FAO.
Foster, J. E., Greer, J., and Thorbecke, E. (1984). A class of decomposable poverty indices. Econometrica. 52, 761–766. doi: 10.2307/1913475
Issahaku, G., and Abdulai, A. (2019). Can farm households improve food and nutrition security through adoption of climate-smart practices? Empirical evidence from Northern Ghana. Appl. Econ. Perspect. Policy. 1–22. doi: 10.1093/aepp/ppz002
Jones, N., Bellamy, J., Belloti, B., Ross, H., Bommel, S., and Liu, Y. (2022). A shock to the system: What the COVID-19 pandemic reveals about Australia's food systems and their resilience. Front. Sustain. Food Syst. doi: 10.3389/fsufs.2021.790694
Khan, F. (2014). Adaptation Vs. Development: basic services for building resilience. Develop. Pract. 24, 1–19. doi: 10.1080/09614524.2014.908823
Lokonon, B. (2017). Farmers' Vulnerability to Climate Shocks: Insights from the Niger Basin of Benin, Working Paper Series No 248, African Development Bank. Abidjan, Côte d'Ivoire.
Miaoulis, G., and Michener, R. D. (1976). An Introduction to Sampling. Dubuque, Iowa: Kendall/Hunt Publishing Company.
Muntaha, R., and Matz, J. (2015). The impact of shocks on gender differentiated asset dynamics in Bangladesh. J. Develop. Stud. 52, 377–395. doi: 10.1080/00220388.2015.1093117
Olagunju, K. O., Ogunniyi, A. I., Awotide, B. A., Adenuga, A. H., and Ashagidigbi, W. M. (2019). Evaluating the distributional impacts of drought-tolerant maize varieties on productivity and welfare outcomes: an instrumental variable quantile treatment effects approach. Clim. Develop. 12, 865–875. doi: 10.1080/17565529.2019.1701401
Quisumbing, A., Kumar, N., and Behrman, J. (2011). Do Shocks Affect Men's and Women's Assets Differently? A Review Literature and New Evidence from Bangladesh and Uganda (IFPRI Discussion Paper 01113). Washington, DC: International Food Policy Research Institute.
Samuel, T. (2017). The determinants of inequality and income gap between urban and rural areas in Cameroon: evidence from the ECAM3 household survey. Adv. Econ. Bus. 5, 394–410. doi: 10.13189/aeb.2017.050703
Shete, A., Dube, S., and Dubewar, A. (2020). Sample size calculation in bio-statistics with special reference to unknown population. Int. J. Innov. Res. Multidiscip. Field, 6, 236–238. Available online at: https://www.ijirmf.com
Keywords: shocks, resilience, welfare, quantile regression, Oyo State, Nigeria
Citation: Olawuyi SO, Olawuyi TD, Ijila OJ and Oyeleye OA (2022) Sustainable Food Systems and Farmers' Welfare Status Distribution in Oyo State, Nigeria: Building Buffers Against Shocks and Stressors Through Resilience Pillars. Front. Sustain. Food Syst. 6:902289. doi: 10.3389/fsufs.2022.902289
Received: 23 March 2022; Accepted: 17 May 2022;
Published: 15 June 2022.
Edited by:
Liming Ye, Ghent University, BelgiumReviewed by:
Jane Mbolle Chah, University of Nigeria, Nsukka, NigeriaCopyright © 2022 Olawuyi, Olawuyi, Ijila and Oyeleye. This is an open-access article distributed under the terms of the Creative Commons Attribution License (CC BY). The use, distribution or reproduction in other forums is permitted, provided the original author(s) and the copyright owner(s) are credited and that the original publication in this journal is cited, in accordance with accepted academic practice. No use, distribution or reproduction is permitted which does not comply with these terms.
*Correspondence: Seyi Olalekan Olawuyi, c2V5aWRvbGFwbzE3MDRAZ21haWwuY29t; orcid.org/0000-0002-7405-2802
Disclaimer: All claims expressed in this article are solely those of the authors and do not necessarily represent those of their affiliated organizations, or those of the publisher, the editors and the reviewers. Any product that may be evaluated in this article or claim that may be made by its manufacturer is not guaranteed or endorsed by the publisher.
Research integrity at Frontiers
Learn more about the work of our research integrity team to safeguard the quality of each article we publish.