
94% of researchers rate our articles as excellent or good
Learn more about the work of our research integrity team to safeguard the quality of each article we publish.
Find out more
ORIGINAL RESEARCH article
Front. Sustain. Food Syst., 07 July 2022
Sec. Climate-Smart Food Systems
Volume 6 - 2022 | https://doi.org/10.3389/fsufs.2022.879161
 Ashleigh N. Price1
 Ruchie Pathak1
 Gregory M. Guthrie2
 Mukesh Kumar3
 Hamed Moftakhari3
 Hamid Moradkhani3
 Denis Nadolnyak4
 Nicholas R. Magliocca1*
Rates of poverty and economic inequality in rural Alabama are among the nation's highest and increasing agricultural productivity can provide a needed boost to these communities. The transition from rain-fed to irrigation-fed (RFtoIF) agriculture has significantly increased farm productivity and profitability elsewhere in the United States. Despite this potential to enhance stability and resilience in rural economies, irrigated cropland accounts for only 5% of Alabama's total cropland as numerous barriers remain to irrigation adoption. To encourage RFtoIF transition, it is imperative to identify the challenges faced by individual farmers at farm, community, and state levels. This study presents a multi-level mixed effects survival analysis to identify the physiographic, socioecological, and economic factors that influence the location and timing of irrigation adoption. We integrate spatiotemporal cropland and climatological data with field-verified locations of center-pivot irrigation systems, local physiographic characteristics, and parcel-level surface water access and average well depth. Access to surface water, costs to access groundwater, and soil characteristics were generally important influences in all regions, but regions were differentiated by the extent to which new irrigation was more responsive to social influences vs. precipitation and price trends. Our findings also highlighted the diversity of farming conditions across the state, which suggested that diverse policy tools are needed that acknowledge the varying motivations and constraints faced by Alabama's farmers.
Rain-fed agriculture supports nearly two-thirds of the global food demand (Mbuli et al., 2021) and is considered among the most vulnerable sectors to the impacts of global climate change (Allouche, 2011; Van Duinen et al., 2015; Patle et al., 2019). Any climate-induced reductions in agricultural production will also challenge the resilience and livelihoods of agricultural-dependent communities (Calzadilla et al., 2013; Shiferaw et al., 2014). One potential climate change adaption strategy is to augment rain-fed production with irrigation (Tack et al., 2017). Irrigation has been instrumental in reducing the risk of climate variability (Calzadilla et al., 2013), even in regions with sufficient seasonal rainfall, as average irrigated crop yields are generally over twice that of rain-fed agriculture (Grassini et al., 2009; Patle et al., 2019). Yet, despite its apparent advantages, adoption of irrigation is uneven and persistently low in some areas (van Duinen et al., 2016; Zaveri and Lobell, 2019; Sydnor and Molnar, 2020).
Technology adoption is a complex sociotechnical process (Koech et al., 2021) that involves a large number of factors affecting the decision, and thus, is seldom rapid (Mottaleb, 2018). In addition, irrigation is not a marginal adaptation (Graveline and Grémont, 2021). Significant (financial) investments and structural transformations in farming practices and water resources management are required (Zagaria et al., 2021), but incentives for making the rain-fed to irrigation-fed (RFtoIF) transition are often comparatively weak (Levidow et al., 2014). Farmers may also lack knowledge about varying efficiencies of irrigation technologies, and which are best suited for their particular conditions (Levidow et al., 2014). Furthermore, depending on the place, laws governing access to water or a shortage of available water might also play a role in influencing irrigation adoption (McDonald and Girvetz, 2013). Consequently, the RFtoIF transition often entails numerous risks and uncertainties about its application and suitability with the existing environment (Mottaleb, 2018), which may or may not be accurately reflected in farmers' pre-existing perceptions and attitudes (Koech et al., 2021).
Most empirical studies of the irrigation adoption process tend to emphasize individual-level factors, in part due to challenges of accounting for both individual adoption decisions and the larger institutional and social contexts in which they are embedded (Hunecke et al., 2017). In-depth interviews or household surveys are used to assess farmers' physical, social, and human capitals linked to decision-making. However, these are time-, trust-, and financially intensive methods limited to relatively small study areas, and reliably extrapolating findings from these studies to the level at which policy is made (e.g., state) is problematic. Agricultural census data is a frequent alternative to overcome small sample size issues (e.g., contiguous U.S. from NASS), and farm-level variables relevant to irrigation decisions are available at county or census block levels to protect potentially identifying information. However, such aggregation makes it difficult to connect specific farm or farmer attributes to irrigation outcomes. Furthermore, when the benefits of irrigation are not obvious, such as in the humid southeastern United States, facilitating or constraining factors can come from either the farm-level or broader social, economic, or institutional contexts. Therefore, irrigation decisions must be analyzed at the level at which the decision is being made (i.e., farmer and farm levels) to reduce the risk of spurious correlations among aggregate decision factors and outcomes across a large spatial extent (Magliocca et al., 2018). We address this gap by using a multi-level statistical modeling approach to assess spatial and temporal influences on agricultural parcel-level irrigation adoption across the state of Alabama.
Substantial empirical and theoretical literature exists around the complexity of factors influencing irrigation adoption decisions (McDonald and Girvetz, 2013), including economics and farm size, locational and/or biophysical conditions, demographics, and socio-psychological and institutional factors (United States Government Accountability Office, 2019). Empirical studies of irrigation adoption from around the world cite costs of irrigation technologies as the most common barrier to adoption (de Witt et al., 2021; Tesfaye et al., 2021), and related factors like farm size, credit restrictions, and computer literacy influence intentions of irrigation adoption (de Witt et al., 2021). Biophysical factors, such as soil, crop type, and weather, are also established influences on irrigation adoption decisions (Gibson et al., 2018). Additional socio-psychological factors include producer behavior and skills (Gibson et al., 2018), information overload, lack of follow-up (extension) services, and age of farmers (Koech et al., 2021).
Recently, social capital has received more attention as an important factor affecting the adoption of irrigation technology (Chen et al., 2014; Hunecke et al., 2017). Although different social science disciplines emphasize different aspects of social capital, they agree that social networks improve access to various resources and there are significant associations between social capital variables and adoption processes (Wang et al., 2015). Social capital can promote the adoption of new technologies, because externalities associated with new technologies can be internalized through cooperation among farmers within the same social group or network (Chen et al., 2014). However, there is little agreement on how to measure social capital, leading to a proliferation of different proxies in use (Parthasarathy and Chopde, 2013). Ethnolinguistic or religious group membership has been associated with social capital through shared interests and values (Hunecke et al., 2017). Membership in a farmers' association has also been cited as indicator of social capital (Hunecke et al., 2017), because participation in such groups increases information exchange and understanding of the benefits of a particular technology (Wang et al., 2015). Contact with extension personnel, which include private, under fee, or public agencies (Genius et al., 2013), and other local producers can inform farmers about the existence and effective use of any new technology (Sydnor and Molnar, 2020). Having neighbors who irrigate may also create a social pressure that encourages other farmers to irrigate (Sydnor and Molnar, 2020). Depending on the definition or measurement implemented, social capital can be conceptualized at varying spatial scales and levels of social organization (i.e., individual to institutional).
Agriculture plays a prominent role in the history and current economic growth of the southeastern United States. Despite relatively abundant water resources in the states of Alabama, Florida, Georgia, and Mississippi, the region is at a comparative disadvantage with Midwestern and Western agriculture. Historical declines in cultivated acres (1 acre = 0.405 hectare) in the Southeast have been attributed to concurrent investments in major irrigation water projects in the western U.S., which limit the competitiveness of Southeastern, rain-fed production of corn and cotton (McNider et al., 2005). Agriculture in the Southeast is also experiencing increasing competition for land and water resources from other land uses due to a growing regional population. For example, parts of Alabama and Georgia are included in the Piedmont “megaregion,” which is projected to experience a 38% population increase between 2000 and 2025 (Dewar and Epstein, 2007). The on-going “Water Wars” among Alabama, Georgia, and Florida were sparked by the increasing water demands of the growing Atlanta metropolitan area and impacts to Alabama's and Florida's agriculture and aquaculture water users relying on surface water flows from the Apalachicola-Chattahoochee-Flint River Basin (Gonzalez-Alvarez et al., 2006; Moore et al., 2021).
Within the context of these challenges, irrigated acreage in the broader Southeast increased by roughly 11% from 1997 to 2017 (Combs, 2019), but irrigation growth and productivity vary substantially within the region. Alabama particularly lags regional trends. For instance, annual growth rates in total factor productivity from 1960 to 2004 in the region are highest for Georgia at 2.18% and lowest for Alabama at 1.63%, which rank 9th and 18th nationally, respectively (USDA Economic Research Service (ERS), 2021). Irrigated acreage in Alabama (189,000 ac; 76,486 ha) is also well behind neighboring states of Mississippi (1,650,000 ac; 667,731 ha) and Georgia (1,450,000 ac; 586,794 ha) according to the 2015 USGS report (Chaney et al., 2020). Low rates of irrigation adoption persist in Alabama despite 3 of the 5 worst droughts on record occurring in the last decade (Shange et al., 2014). Various state-wide initiatives to increase irrigation have been implemented, including tax incentives (Chaney et al., 2020), private-public partnerships to leverage USDA funds (Asare-Baah et al., 2018), and federally-funded pilot programs [Natural Resources Conservation Service (NRCS), 2017a,b], but irrigation adoption is still limited.
Most agricultural land in Alabama contains livestock or poultry farms, with the remaining 20% (1,716,188 ac; 694,517 ha) devoted to cultivated crops, pasture, and woodland operations. The primary commodity crops are cotton (431,089 ac; 174,456 ha), soy (347,037 ac; 140,441 ha), corn (243,820 ac; 98,670 ha), and peanuts (193,098 ac; 78,144 ha). However, agricultural regions across Alabama are heterogeneous in biophysical, social, and economic characteristics and cultivated croplands are unevenly distributed across the state (Figure 1). Agricultural regions are defined by USDA Agricultural Statistics Districts (ASDs) as groups of contiguous counties with similar climatological and physiographic conditions (USDA, 2007). Farms within an ASDs share similar soil type and annual precipitation, which in turn influences both the types of crop produced and the prevalence of irrigation in the region (Table 1). Agriculture in northern Alabama regions of the Mountains and Northern Valley is a mix of corn, soybean, and cotton cultivation, and the regions are characterized by relatively shallow aquifers, abundant surface water, and varied topography associated with the Cumberland Plateau and southern end of the Appalachian Mountains. The Plains Piedmont region has sandy soils and is used primarily for pasture, poultry farming, and forestry. The Black Belt region has rich soils, major sources of surface water, and the deepest average aquifer depths in the state. Agricultural land uses range from forestry, larger cattle pastures, aquaculture, and cotton. The Wiregrass region is an established agricultural region with the highest number of center pivot irrigated parcels at the start of the study period and a prevalence of cotton cultivation. The Coastal region has abundant rainfall, relatively shallow aquifers, and contains a variety of agricultural production including cotton, peanuts, tree crops (e.g., pecans), sod farms, and forestry.
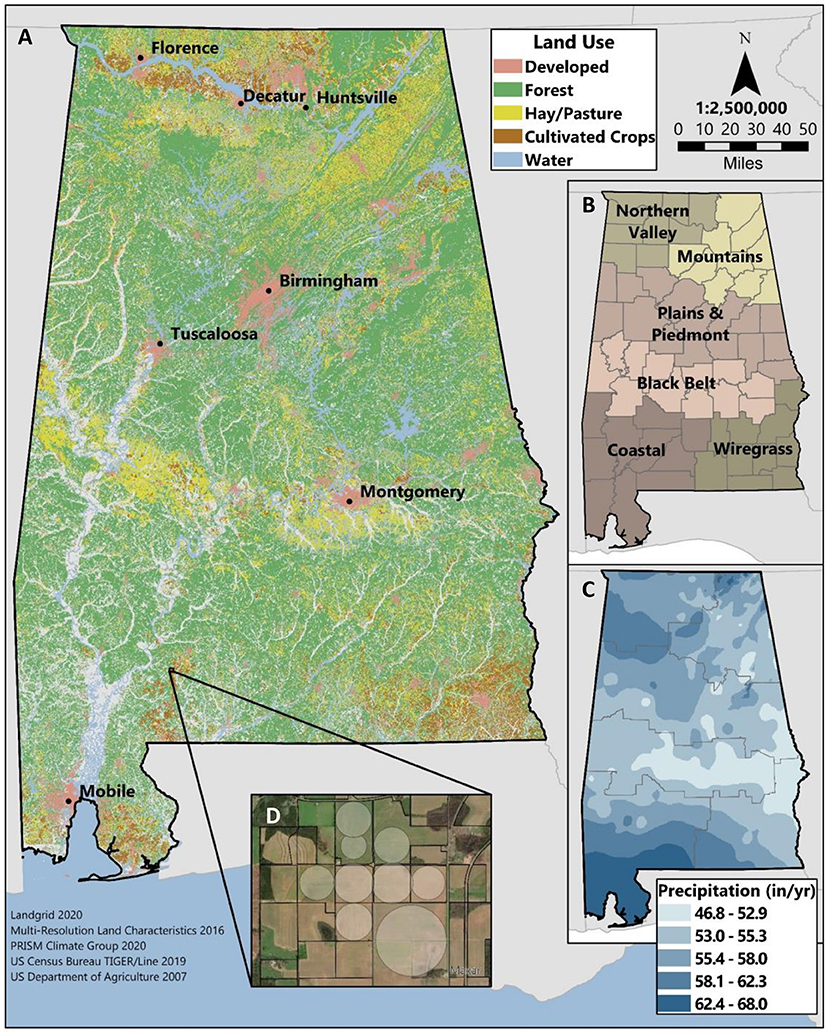
Figure 1. (A) Classified map of land use in Alabama (MRLC, 2014); (B) agricultural regions considered in this study (USDA, 2007); (C) annual mean precipitation (PRISM Climate Group, 2020); and (D) example of parcel boundaries (Loveland Technologies, 2020) overlaid with center pivot irrigation polygons used in the analysis.

Table 1. Descriptive statistics of each region's parcel characteristics, total cropland, and extent of irrigation at the start of the study period in 2006.
The growing season ranges from 200 days in the northern part of the state to more than 250 days in the southern part. Alabama receives an annual average 58 inches (1,473.2 mm) of rainfall, although the majority of precipitation is concentrated in the winter and spring and there is regional variation (Table 1). The sandy soils throughout the Southeast have limited soil water capacity in comparison to those in the U.S. Midwest, and are consequently susceptible to seasonal drought during the late growing season (July, August, and September) (Kern, 1995; PRISM Climate Group, 2020). In addition, accessibility to surface water and groundwater sources varies throughout the state. Common law rulings in Alabama have established riparian rights as the legal surface water access regime, which allows only riparian owners access to the surface water flowing across their property (Marcus and Kiebzak, 2008). This has created conditions of social water scarcity in which precipitation, surface water retention ponds, and groundwater are the only options available to non-riparian farmers. Groundwater access is particularly challenging in the central part of the state where average aquifer depths increase substantially (Hutson et al., 2004; Marcus and Kiebzak, 2008). In the Black Belt, for example, average depth to water is twice that of rest of the state (Table 1), increasing the necessary investment needed for drilling or deepening a well.
Multi-level survival analysis was used to analyze the causal effects of farm-level and regional factors on the timing and location of irrigation adoption throughout the state of Alabama. Specifically, we tested the following hypotheses:
• Hypothesis 1: Due to relatively abundant water access, social influences are the dominant influence on the timing and location of irrigation expansion in northern Alabama (i.e., Mountains and Northern Valley regions).
• Hypothesis 2: Due to relative socio-economic disadvantage, initial investment costs related to water access are the dominant influence on the timing and location of irrigation expansion in the Black Belt region of Alabama.
• Hypothesis 3: Due to competing land uses, water availability and crop prices are the dominant influences on the timing and location of irrigation expansion in the piedmont and coastal areas (i.e., Piedmont Plains, Wiregrass, and Coastal regions) of Alabama.
We estimated the influences of a set of parcel- and social neighborhood-level independent variables on the time to irrigation adoption (dependent variable), identified using the locations of 1,014 center pivot polygons installed after 2006 but prior to 2015 (Handyside, 2014, 2016). Our analysis was based at the parcel level with georeferenced boundaries acquired from the 2020 Alabama real estate parcels geospatial dataset from Landgrid (Loveland Technologies, 2020). We were restricted to the parcel level – even though irrigation decisions are made at the farm level – due to data limitations. Ownership data was not available in the Landgrid dataset for all counties, which prevented the identification of farms as contiguous parcels under one or multiple joint owners and restricted the analysis to individual parcels. Thus, it was possible for individual farms and center pivot polygons to span multiple parcels, and consequently the resulting dataset could contain more irrigation adoption events at the parcel level compared to the number of actual farm-level irrigation decisions. To minimize the inflation of irrigation and non-irrigation observations, three eligibility criteria were applied to limit the number of parcels considered: irrigation status in 2006, minimum parcel size, and sufficient agricultural land use within the parcel.
First, parcels overlapping with a center-pivot irrigation polygon at the start of the analysis period (2006) were excluded, since the time of irrigation establishment could not be observed. Next, a minimum parcel size threshold was determined using the observed minimum areal coverage of a center-pivot irrigation polygon (3.6 ac; 1.46 ha). This minimum size threshold was then used to restrict the sample of eligible parcels using zonal statistics (ArcGIS Pro 2.4) to those with at least 3.6 ac (1.46 ha) of cultivated crops as classified in the 2013 National Land Cover Dataset (NLCD) (MRLC, 2014). Sample parcels were further restricted by the choice not to consider parcels with pasture as an eligible land use for irrigation. Although conversion from pasture to irrigated agriculture was observed, this choice substantially reduced the number of eligible parcels and only excluded 30 events of new irrigation on majority pasture parcels. Because parcels categorized as majority pasture were a relatively minor contribution to overall increases in irrigation, excluding pasture parcels from the analysis avoided inflating the number of ‘surviving' parcels with many false negatives (i.e., no irrigation expansion event). Further, NLCD is known to have a comparatively high rate of confusion and classification inaccuracy among grassland, pasture, and cropland (especially fallow land) categories (Wickham et al., 2013, 2017), and excluding pasture parcels avoided uncertainty introduced from this particular land use classification error and substantially reduced the number of eligible parcels. Overall, 466 agricultural parcels had existing center-pivot irrigation in 2006, and 1,102 parcels were identified as parcels eligible for irrigation adoption. Larger parcels (i.e., larger farms) were generally more likely to have existing irrigation, regardless of access to surface water (Table 2).
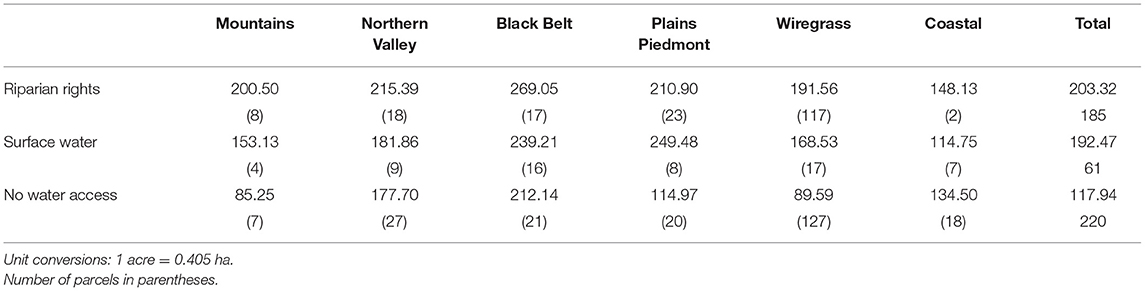
Table 2. Average acreage of parcels with existing center-pivot irrigation (2006) by region and water access.
Parcel-level attributes were determined for both static and time-varying independent variables (Table 3). Five static variables were used, including riparian access, surface water availability, soil suitability, groundwater costs, and access to information. Riparian access and surface water were assigned by intersecting parcel boundaries with perennial streams and lake/pond features, respectively, from the Alabama National Hydrography Dataset statewide database (USGS, 2020). Soil suitability was quantified following the methods outlined in the Alabama State Resource Assessment [Natural Resources Conservation Service (NRCS), 2018] using the fraction of parcel area in favorable agricultural soils (USDA, 2020). Point locations for agricultural well depths were provided by the Geological Survey of Alabama [GSA, (USGS, 2020)] and average well depth at the parcel level was estimated with natural neighbor interpolation and zonal statistics.
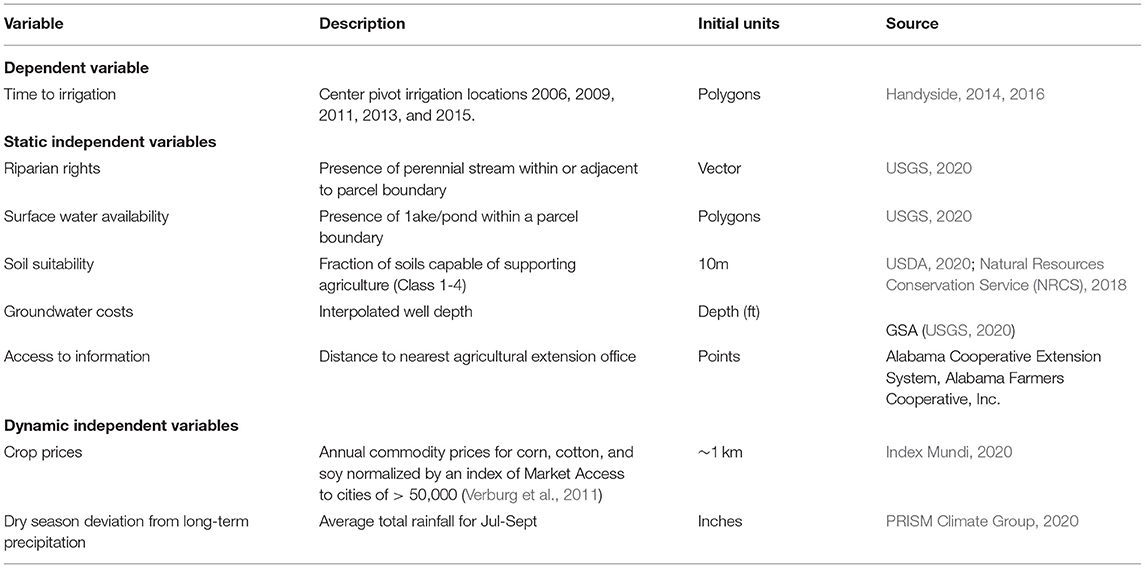
Table 3. Description and metadata of dependent and independent variables used in the survival analysis.
Social influences on irrigation adoption were modeled using a multi-level structure with the creation of social neighborhoods. Without the empirical data available on a statewide level that would be necessary to explicitly measure the effects of farmer's informal and formal networks (i.e., social networks), social influences on farmer learning and decision-making were inferred using each parcel's proximity to agricultural extension centers and farmers' cooperatives. Social influences on farmer decision-making include improved communication, access to information, and social learning (Lu and Kwasi, 2019), even in communities where irrigation adoption is scarce (Genius et al., 2013). Extension centers not only make information and technology available to the community through their technical advisors and extension agents, but combined with farmers' cooperative they also provide opportunities for farmers of a same neighborhood to interact. The spatial boundaries of social neighborhoods were generated using Thiessen polygons around the locations of each Alabama Cooperative Extension System office1 and nearest Alabama Farmers' Cooperative2. Membership in and location within a social neighborhood influenced farmer decision-making in three ways: (1) unobservable social interactions, such as trust and information sharing, among spatially proximate farmers; (2) spatial accessibility to extension services related to parcel distance to a social neighborhood's centroid; and (3) social learning through imitation, which was proxied by the time-varying number of irrigated acres present in each social neighborhood at each time period of analysis.
In addition to time-varying irrigated acres at the social neighborhood level, two parcel-level time-varying independent variables allow us to test for the influence of the cumulative effects of spatiotemporal trends in crop prices and dry season precipitation (Thériault et al., 2020). Farmgate crop prices were approximated with a crop price index for each parcel by modifying and spatially discounting the average annual commodity market prices for corn and cotton (Index Mundi, 2020) by a market access index, which provided a normalized value between 0 and 1 based on travel time to the nearest city of 50,000 as of the year 2000 (Verburg et al., 2011). This approach provided a consistent, wall-to-wall measure of the dynamic influence of extra-local commodity prices and spatially varying differences in production costs due to location. For each time period of the analysis, we separately considered the crop price index averaged over the previous 2, 4, and 6 years to test influence of different time horizons for price signals. This enabled a parcel-level, spatially explicit measure of the cumulative effects of price trends without requiring knowledge of the specific crops cultivated in each parcel. We similarly modeled the influence of precipitation trends over multiple consecutive growing seasons using the deviation of dry season precipitation from the long-term annual average. Precipitation trends were calculated for the years 2000–2015 as the deviations of each location's annual dry season (July, August, September) average from the long-term (1990–2010) dry season average (PRISM Climate Group, 2020). Similar to crop price trends, we considered different time horizons for precipitation averages over 2-, 4-, and 6-year time spans.
Survival analysis was used to analyze the contextual and dynamic factors that shaped spatiotemporal patterns of center pivot irrigation adoption throughout the state of Alabama. Survival analysis is a set of time-to-event regression models that accommodate right-censored data to reveal the degree to which specific effects of covariates positively or negatively influence the duration. The analytic strategy employed here is a hierarchal, mixed-effects Cox proportional hazard model, which estimates the probability that a change in state (e.g., a patient dying or infrastructure failing) will be observed at a specific time during the study period (Austin, 2017). In this case, survival probabilities indicated the probability of any given parcel changing its state (i.e. from non-irrigated to center pivot irrigated) in a specified year relative to the number of state changes observed to that point among all eligible parcels. Furthermore, the exact time of irrigation adoption was not observed (i.e., established before or after the study period, respectively left- or right-censored, or between observation times, or interval censored), because data for the locations of center-pivot irrigation were available for 5 points in time at 2- or 3-year intervals from 2006 to 2015. Survival analysis considers that the exact time of the state change event of interest may not observed. In such situations, methods such as linear regression overestimate the duration of unaffected parcels (An and Brown, 2008).
Specifically, in equation (1) hi(t) is the hazard rate of parcel i at time t. The baseline hazard function, h0(t) (unobserved and implicitly estimated) (An and Brown, 2008), is similar to an intercept in traditional linear regression and describes the cumulative “risk” of irrigation adoption at time t. The log-hazard of parcel i is a linear function of both static and time-varying covariates Xijk, where each parcel i is a member of social neighborhood j and “water group” k that varied by type of surface water access (none, surface water on the parcel, and riparian access). The hazard ratio is represented by the first exponential expression and estimates fixed effects on survival time. To test for the influence of spatial accessibility to information and social learning on time to irrigation, we introduced an interaction term of the form AijDik, where Aij is the total number of irrigated acres within the social neighborhood j containing parcel i and Djik is the distance from parcel i, belonging to water group k, to the center of social neighborhood j. The interaction term and the associated coefficient in Equation 1 is denoted with αijkZijk. The second exponential expression in Equation 1 estimates the random effects of water group membership (Wk), social neighborhood membership, and proximity to social neighborhood center (JjDi). Finally, the error term εijk is an error term combining fixed and random effects.
Equation 2 shows the Kaplan-Meier estimation of the Survival Function Ŝik where nik is the number of parcels at risk of irrigation adoption at time t, and dij is the number of adoption decisions at time t. Plots of the Kaplan-Meier estimates for each agricultural region are shown in Figure 2. Survival probability curves for each water group (i.e., surface water access) for the a) Mountains, b) Northern Valley, c) Black Belt, d) Plains Piedmont, e) Wiregrass, and f) Coastal regions of Alabama. were estimated as the likelihood that parcel i remained unirrigated through each time period. To understand the influence of water access on survival times, conditional Kaplan-Meier estimates were generated separately for each water group j.
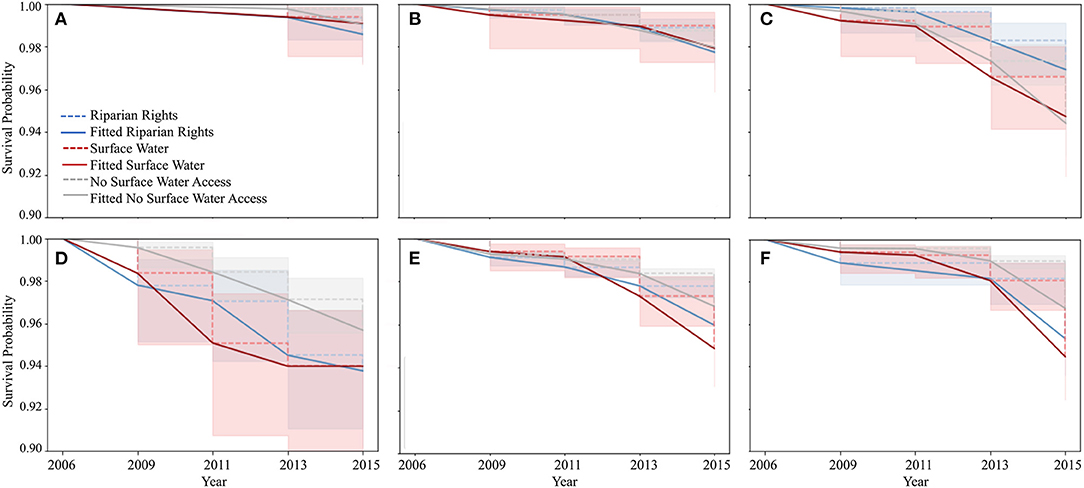
Figure 2. Survival probability curves for each water group (i.e., surface water access) for the (A) Mountains, (B) Northern Valley, (C) Black Belt, (D) Plains Piedmont, (E) Wiregrass, and (F) Coastal regions of Alabama.
To estimate the influence of all static and dynamic variables in Table 3, we implemented a series of survival regression models. The null model (1) estimated the static influence of group membership differentiated by type of parcel-level surface water access. As additional variables and model levels were added, pairwise likelihood ratio tests were performed between successive model versions to avoid over-specification and aid model selection. For all regions, we found statistically significant changes in survival probabilities with the use of nested models. Static, parcel-level fraction of suitable soils and average well depth variables were introduced in model 2. Model 3 introduced a multi-level structure with a random effects term for static social neighborhood membership. Model versions 4–6 additionally introduced time-dependentvariables averaged over the previous two, four, and 6 years, respectively. Models 7–9 additionally considered an interaction term between a given parcel's distance to its social neighborhood centroid (i.e., location of agricultural extension and farmer co-op facilities) with total irrigated acres in the social neighborhood at each observation time.
At the start of the analysis period, 466 agricultural parcels had existing center-pivot irrigation. Of those, the majority (220) did not have riparian or to surface water access. A total of 1,102 out of 31,990 eligible agricultural parcels, or 3.44%, were newly irrigated during the study period (Table 4). The largest absolute increase in irrigated parcels was observed on parcels without riparian access nor surface water on the property. However, parcels with available surface water had the highest proportional increase of new irrigation, followed by parcels with riparian access. Nearly half of new irrigation events were observed in the Wiregrass region, which has the largest number of cultivated acres in the state and where center pivot irrigation was already well established before the start of the study period. The largest proportional increase was observed in the Plains Piedmont region at a rate of 6.49%. The northern Mountains and Northern Valley regions of the state showed the slowest rate of new irrigation and were below the statewide rate.
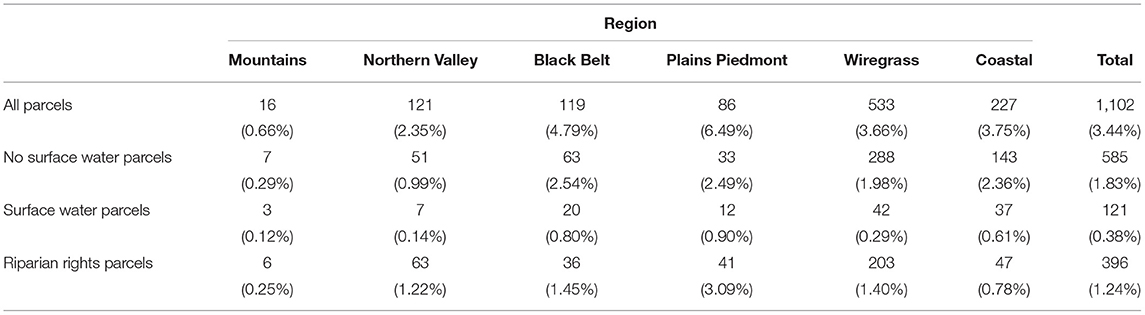
Table 4. Number and percent of eligible parcels with new irrigation (i.e., adoption or expansion events) per water group (i.e., type of surface water access) and region.
Grouping parcels by their type of surface water access isolated the effects of current riparian access water law throughout the state, which is a major determinant of the irrigation options available to farmers. Survival probabilities per water group and region (Figure 2) indicated that parcels with riparian access generally adopted irrigation earlier than parcels without riparian rights. Parcels without riparian rights also experienced the lowest overall rates of irrigation, except for those in the Black Belt, where such parcels had higher number and proportion of irrigation events than parcels with surface water access. The Plains Piedmont region demonstrated the earliest expansion of irrigation, while the northern regions (i.e., Mountains and Northern Valley) lagged.
Model selection for each region was based on maximum log-likelihood estimates and pairwise likelihood ratio tests among all model versions (Table 5). When alternative model versions had the same log-likelihood estimates, the simplest model beyond which no statistically significant improvements in log-likelihood estimates were found was chosen. The best performing models for all regions were multi-level and included an interaction term between parcel-level distance to social neighborhood center (i.e., location of agricultural extension and farmer co-op facilities) and number of irrigated acres per social neighborhood. Northern Valley, Black Belt, and Plains Piedmont regions showed statistically significant improvements in model versions with 6-year averaged time-varying factors relative to other model versions with shorter time horizons. Improvement in model estimation between versions with increasing time horizons was strongest in the Plains Piedmont region (p < < 0.01) and weakest in the Black Belt region (p < 0.10). The best performing models for the Mountain, Coastal, and Wiregrass regions had progressively shorter time horizons of 4, 4, and 2 years, respectively. However, it should be noted that although model selection was based on maximum log-likelihood and statistically significant likelihood ratio tests, absolute improvements among model versions with different time horizons was not large and likely not meaningful. The implications of this are revisited in the Discussion section.
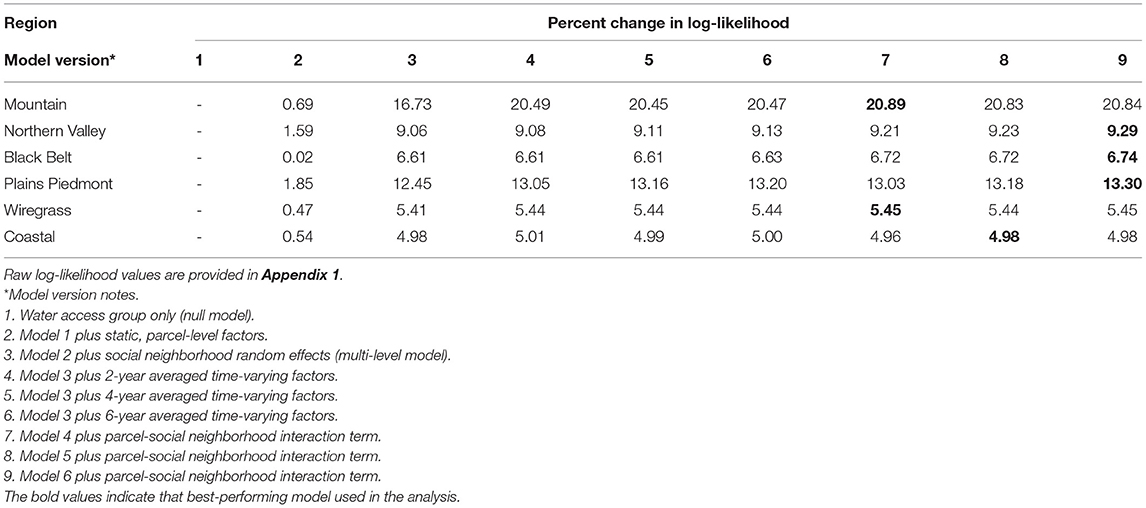
Table 5. Percent change in log-likelihood estimates relative to the null model for each region.
Since the variable of interest was survival duration, exponentiated coefficients <1 indicated a covariate's ‘protective' effect and longer time to irrigation adoption, whereas exponentiated coefficients >1 indicated increased risk and shorter survival times. One or both of average well depth and fraction of soils capable of supporting agriculture had statistically significant influences on irrigation events for all regions (Table 6). Higher parcel-level fraction of capable soils increased the likelihood of an irrigation event (i.e., shortened the average duration until an event) in the Northern Valley, Plains Piedmont, Wiregrass, and Coastal regions. Parcels with a higher fraction than average ranged from nearly 3.4 (Wiregrass) to 36 (Plains Piedmont) times more likely to experience an irrigation adoption event. In contrast, parcels with higher than average fractions of suitable soil in the Mountains region were 0.71 times less likely to experience an irrigation event. This was attributable to a limited number of irrigation events and eligible parcels in this region, and parcels with irrigation established prior to 2006 being excluded from the analysis.
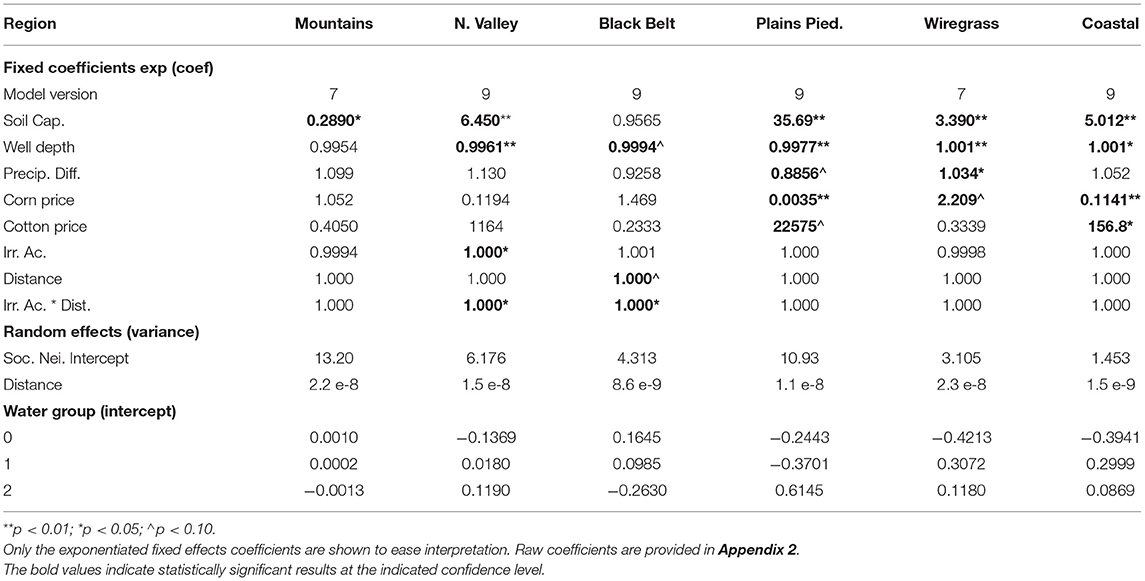
Table 6. Estimates of group intercepts and fixed and random effects by agricultural region.
Similarly, average well depth was statistically significant in all but one region and the effects were mixed (Table 6). In the Northern Valley, Black Belt, and Plains Piedmont regions, increased average well depth had a deterrent effect on irrigation events. As a proxy for the cost of groundwater access, relatively deep wells in these regions presented a barrier to irrigation adoption. Increased well depth had the opposite effect in the Wiregrass and Coastal regions, with deeper wells associated with greater likelihood of irrigation adoption. This is likely associated with the prevalence of deeper aquifers capable of sustaining wells with larger capacities in this region, which do not present the same marginal investment barrier as deeper wells in the other regions. In other words, large volume water users in these regions are likely associated with large-scale producers with sufficient capital such that increasing well depth is not a prohibitive cost.
Dry season departures from long-term average annual precipitation influenced irrigation adoption in only two regions and in divergent ways (Table 6). An average increase in dry season precipitation during preceding 2-year periods (i.e., Model 7; see Table 5 for model descriptions) in the Plains Piedmont region provided a slight (about 11%) protective effect against irrigation, because higher rain-fed yields presumably discouraged irrigation investment. The opposite effect was observed in the Wiregrass region. Increased average dry season precipitation during preceding 6-year periods had a slight positive effect (3.4%) on the likelihood of irrigation expansion. This may be similarly related to investment decisions where increased rain-fed productivity supports the investment needed to transition to irrigated agriculture. Proximity to widespread irrigation in nearby Georgia may also exert a social influence.
Price trends were a significant influence on irrigation events in the Plains Piedmont, Wiregrass, and Coastal regions (Table 6). Corn and cotton prices show inverse influences, i.e., prices for one crop encouraged irrigation while prices for the other had the opposite effect. Irrigation was roughly two times more likely in the Wiregrass region with increases in corn prices while cotton prices had a non-significant effect. The opposite was observed in the Plains Piedmont and Coastal regions, which showed strong, positive responses to increased cotton prices and similarly strong, negative responses to corn prices. These differences likely reflected varying crop rotations among the farms in each region. Notably, price trends were not significant influences on irrigation adoption in the Mountains, Northern Valley, and Black Belt regions.
Social influences on irrigation adoption were evident in four of the six regions (Table 6). This was indicated by either 1) large intra-region variance in social neighborhood intercept (i.e., random effect), or 2) statistically significant interaction between irrigated acres within the social neighborhood and distance to the social neighborhood center (i.e., location of extension and farm co-op facilities). Although the interaction term was not statistically significant for the Mountain or Plains Piedmont regions, these regions had the two largest variances in social neighborhood intercepts. This indicated that parcels within a subset of social neighborhoods in each region were more likely to become irrigated than those in other social neighborhoods (all else equal) in the same regions. Parcels in the Northern Valley and Black Belt regions that were members of social neighborhoods with increasing irrigated acres over time were more likely to become irrigated. However, this influence varied depending on the specific social neighborhood and the parcel's distance away from the social neighborhood's center.
Parcel-level likelihood of transition to irrigation was also mediated by surface water access – all else equal – as indicated by intercepts estimate for each surface water access group (Figure 3). For the exception of the Mountains region, where surface water access effects were negligible, irrigation was generally more likely to be adopted on parcels with riparian access or surface water bodies present on the parcel. The effect was greater for parcels with riparian access in Northern Valley and Plains Piedmont regions, through which the state's two major river systems flow. The presence of surface water bodies had a larger effect on irrigation adoption in the Wiregrass and Coastal regions. These positive trends may contribute to explaining why irrigation in these regions was also more responsive to crop price and/or precipitation trends (Section Influential Irrigation Decision Factors and Table 6). Further, the lack of surface water access had a consistently deterrent effect on irrigation adoption in these regions.
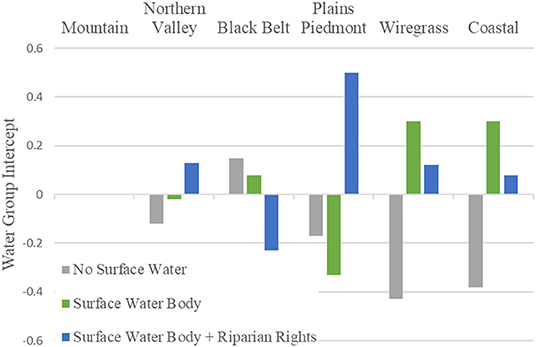
Figure 3. Estimated intercepts for each surface water access group by region. Positive/Negative intercepts are interpreted as favoring/discouraging irrigation adoption all else equal.
The Black Belt region was an exception to this trend. Irrigation adoption was more likely to be observed on parcels without riparian access (Figure 3). Two contextual conditions possibly explain this trend. This region had the highest number of eligible parcels without surface water or riparian rights, which is attributed to competition from pasture, aquaculture, and forestry land uses situated on parcels with riparian access. Additionally, land prices are relatively low in the Black Belt which makes the investment in well drilling more feasible for larger farms. Thus, the negative intercept for parcels with riparian access in this region reflects the dominance of groundwater-based irrigation.
While the random effects from independent variables associated with social influence (i.e., irrigated acres in social neighborhood and distance to social neighborhood center) were not consistently statistically significant across regions, all regions had substantial variability in social neighborhood intercept estimates indicating the importance of localized social interactions (Figure 4). Large variances were observed for each region indicating intra-region heterogeneity in parcel-level irrigation events based on social neighborhood membership. Inter-region heterogeneity was also pronounced. For example, the highest social neighborhood intercept (7.79) in the Mountains region was roughly three times greater than that of the lowest social neighborhood intercept (-3.89) in the Northern Valley. Mapping social neighborhood intercept estimates (Figure 4) also showed two spatial patterns of note. First, there was some intra-region spatial clustering among social neighborhoods that were more or less likely to experience new irrigation events, which offered some circumstantial evidence that there is a spatial component to social neighborhood influence on irrigation decisions. Second, social neighborhood intercept estimates were heterogeneous within the same county, which suggested that social influences on irrigation decisions are localized and county-level data may misrepresent such effects.
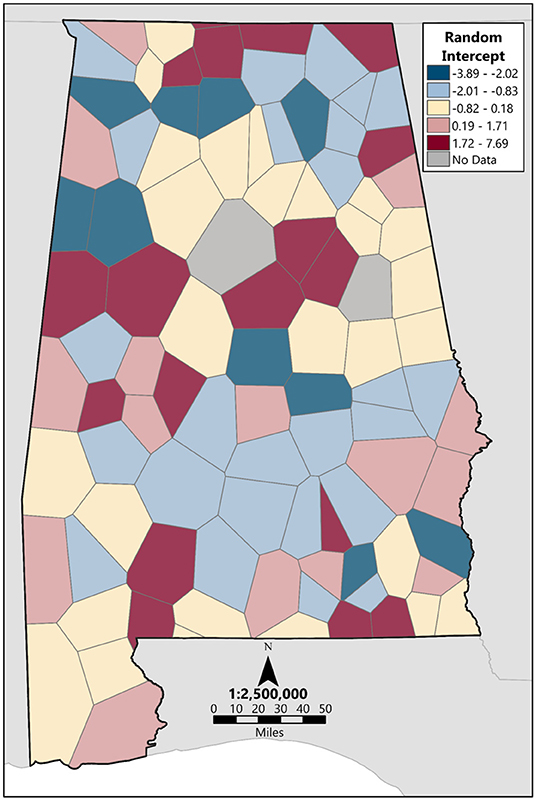
Figure 4. Map of social neighborhood intercept estimates. Warm colors indicate increased likelihoods (positive intercept values) of irrigation adoption, and cool colors represent decrease likelihoods (negative intercept values) of irrigation adoption. Social neighborhoods with no data (gray) were excluded due to a lack of eligible agricultural parcels.
In the northern Alabama regions, our hypothesis-1 that social influences would be the dominant influence on the timing of irrigation expansion found mixed support. The number of irrigated acres within the social neighborhood was a statistically significant factor in the Northern Valley, which directly supported our hypothesis. Additionally, both the Mountain and Northern Valley regions had higher than average variance in social neighborhood effects. Parcels in one social neighborhood in the Mountains region, for example, were nearly eight times more likely to be newly irrigated than parcels in the same region in other social neighborhoods. This suggests that highly localized social interactions may be particularly important in regions with limited cropland (see also Plains Piedmont below). On the other hand, biophysical constraints were assumed to present relatively little constraints on irrigation adoption due to the relative abundance of surface water and ease of groundwater access (i.e., relatively shallow well depths). Although precipitation trends were not a significant influence on irrigation expansion in the Mountain and Northern Valley regions (as predicted), soil characteristics and well depth were significant influences. Better soil water capacity in parcels with higher fractions of suitable soils likely contributed to better rain-fed crop yields and realized higher profits, which may have increased motivations to increase yields long-term and invest in irrigation. Such a transition was likely facilitated regionally and at the parcel-level by relatively shallower wells needed to access sufficient groundwater. Groundwater accessibility can vary substantially within this region due to heterogeneous geological strata associated with the southern end of the Appalachian Mountains, and useable groundwater is often stored in fractured bedrock relatively close to the surface. Due to these geological characteristics, groundwater can be difficult to find but is easily exploited once found. These regional features likely account for the significant, deterrent effects of increased average well depth, and the increased likelihood of irrigation expansion with surface water present and/or riparian access, respectively, at the parcel-level.
Our hypothesis-2 surmised that due to relative socio-economic disadvantages in the Black Belt initial investment costs would dominantly influence irrigation adoption. This hypothesis was supported by a weak but statistically significant deterrent effect of increased well depth. However, estimated intercepts for water access groups in this region indicated that parcels lacking surface water or riparian access were more likely to be newly irrigated. This was unexpected given that the average well depth in the Black Belt region was almost twice as deep as any other region, which would require substantial investment. There are two contextual factors that explain this outcome. First, large farms, which can achieve the economy of scale necessary to justify the investment in groundwater-based irrigation, are likely driving this irrigation trend. The Black Belt had the largest parcel sizes of irrigated parcels prior to the study period (by 2006) regardless of water access category (Table 2). Additionally, parcels in the Black Belt without access to surface water were equally as likely to have existing center-pivot irrigation.
Second, there are clear discrepancies among producers in the Black Belt that influence the probability of a transition to irrigation. According the USDA Agricultural Census statistics (USDA, 2020), the Black Belt has the highest proportion (0.37) of African American (2,114) to White (5,745) producers of any of the agricultural regions in the state. However, the Black Belt also has the largest inequity in average farm sizes between African American (85.31 ac; 34.52 ha) and White (308.31 ac; 124.77 ha) producers of any agricultural region in the state. Combined with limited return on irrigation investments for small farms, lack of access to credit and insufficient capital for initial investment have been noted as specific barriers to irrigation for African-American farmers in the Black Belt (Grim, 2002; Shange et al., 2014). Many farmers in this region are characterized as socially and historically disadvantaged farmers (SHDFs), for whom the capital required for accessing groundwater for irrigation is often prohibitive, which prevents them from building on other on-farm investments (Shange et al., 2014). In addition, an admitted history of negligence of African American farmers by USDA as accounted for in the Pigford cases and CRAT Report (Furman et al., 2014; Asare-Baah et al., 2018) has perpetuated these conditions. Consequently, there is generally high awareness of, but limited participation in, USDA loan programs among African American Back Belt farmers (Asare-Baah et al., 2018). Thus, it is mostly White, large-scale producers that are driving irrigation trends in the Black Belt. The unintended consequences of the state's riparian rights policy are particularly evident in this region where the discrepancies among producers are most pronounced and irrigation options are limited for producers without riparian or surface water access.
Finally, hypothesis-3 proposes that, water availability and crop prices are the dominant factors influencing irrigation in the remaining regions due primarily to competition for land from non-agricultural land uses. In addition to the fraction of suitable soil, water availability and access and crop prices were indeed statistically significant factors, whereas social influences were not. In all three remaining regions, parcels with riparian access were more likely to adopt irrigation than those without. Furthermore, in the Plains Piedmont and Coastal regions, irrigation expansion was more likely with increasing trends in cotton prices, but less likely with trends of above average dry season precipitation. All else being equal in the Plains Piedmont and Coastal regions, farmers' irrigation decisions appear more closely tied to dynamic climatic and market conditions, and farms with riparian water access can be more responsive to favorable conditions than those without access. Irrigation decisions in the Wiregrass region also appear responsive to climate and market conditions, but in contrast with the Plains Piedmont and Coastal regions, precipitation and price trends may interact synergistically. Above average dry season precipitation and corn prices both increase the likelihood of new irrigation investment. Similar to the northern regions, better rain-fed crop yields likely lead to higher profits, which may increase motivations to increase yields long-term and invest in irrigation.
Balancing the data demands of parcel-level analysis for the entire state required several simplifications to compensate for data limitations. First, only center pivot irrigation was considered primarily because it was detectable via remote sensing analysis for the entire state (Handyside, 2014, 2016). This excluded other forms of irrigation, such as drip or micro-irrigation, that are more feasible for smaller and/or disadvantaged farms, such as those that dominate the Black Belt region, which biases our results. Similarly, due to the focus on center pivot irrigation, these results are most applicable to commodity crop producing farms and may not be fully transferable to all farm types likely to irrigate, such as peri-urban farms producing high value produce for direct sale (e.g., farmers' markets).
Second, the use of social neighborhoods defined by Theisen polygons centered on agricultural extension and farm co-op locations was a crude approximation of potential social influences on irrigation decision-making. We chose Theisen polygons as proxies for farms and communities with access to similar information and resources and increased likelihood of interaction due to spatial proximity. While such social interactions and their effects on potential psychological barriers to irrigation adoption have been observed in many different contexts, our results showed mixed and weak influences from social neighborhoods. This suggested that further research is needed to identify alternative representations of both spatial and non-spatial social interactions. For example, social interactions may be better represented by a network structure, rather than a spatial neighborhood or proximity to the neighborhood center. It is unclear how and to what degree supportive organizations like agricultural extensions and farmers co-ops engage with the full diversity of individual farmers, and whether the influence of these interactions is spatially dependent. Yet, addressing the spatial accessibility to resources and information, particularly in extremely rural agricultural communities, is notably absent from policy and practice. There is a need to more closely examine the causal mechanisms linking social interactions among farmers and support services to individual irrigation adoption decisions.
Finally, we assumed that influences on farmer risk perception and irrigation investment decision-making would be better captured by operationalizing climatological conditions and commodity price trends over multiple consecutive growing seasons. However, the differences between model versions with different time horizons for dynamic variables were negligible. This was surprising since there is considerable debate in the literature of climate adaptation in agriculture about the time scale most relevant to meaningful climate signals that influence adaptation decision-making (e.g., Negri et al., 2005; Mertz et al., 2009; Rejesus et al., 2013; Troy et al., 2015). In addition, crop prices were quite volatile during the study period, particularly following the food price spikes of 2008–2009 and 2010–2011. Neither annual extremes nor moderate-term departures from long-term trends seemed to influence irrigation adoption or expansion decisions. Further inquiry is needed at the farm and farmer levels to understand the role short-term extremes or cumulative effects play in influencing irrigation decisions in this region.
Combining large-scale datasets, such as statewide, county-level socioeconomic data (e.g., average farm income), with finer resolution datasets, such as biophysical factors (e.g., parcel-level soil capacity), presents epistemological challenges that may confuse correlations with causal mechanisms at the level of farmer decision-making (Meyfroidt, 2016; Magliocca et al., 2018). Yet, the knowledge necessary to inform policy requires some level of generalization and aggregation beyond the farmer decision-making level (Manson et al., 2016). Policy cannot be tailored to every local context and is necessarily made and implemented at the state and/or county levels. The challenge is thus to measure the causal effects of various factors influencing irrigation adoption or expansion at the scale as close as possible to that at which irrigation decisions are made (Magliocca et al., 2018), while balancing the need to consider variation in that decision-making process across the full spatial extent at which policy will be made. The multi-level model structure used here was an attempt to balance these competing objectives, and meaningful differences across regions were detected in the influences of both parcel- and social neighborhood-level decision factors. However, a trade-off was the exclusion of several farm- and farmer-level factors known to influence irrigation adoption decisions, such as land ownership, household income, and educational attainment level, which were only available aggregated per county. In addition, we can only proxy the effects of farmer-level interactions via spatial proximity to other farmers or service locations such as agricultural extension and farmer co-op facilities.
In particular, large variations among social neighborhood effects suggest that further investigation of localized, social-psychological factors is needed. The spatial differentiation of irrigation adoption among social neighborhoods highlights the disparate and varying degrees of exposure to resources across Alabama's farms and communities. Recent research has demonstrated that bottom-up interactions among farmers and other agricultural community members can drive system-level shifts in production methods, such as irrigation adoption (van Duinen et al., 2016; Zagaria et al., 2021) and multifunctional agriculture (Manson et al., 2009; Fernandez-Mena et al., 2020). Important localized interactions include sharing information about irrigation technologies, benefits, and best practices (e.g., Van Duinen et al., 2015); observing successful strategies for acquiring bank loans or taking advantage of government subsidies (Shange et al., 2014); and social norms for water management techniques (Liu et al., 2018). However, it remains an open question whether such social-psychological factors become important only after more tangible barriers to irrigation adoption, such as water availability and financing, are overcome. Unfortunately, large-scale statistical analyses, even at the parcel-level, do not adequately capture the contingency of such social-psychological influences, and more in-depth, qualitative approaches are needed to supplement the statewide findings presented here.
This study applied a multi-level, mixed effects survival analysis to investigate the factors influencing the timing and location of irrigation adoption throughout the state of Alabama between 2006 and 2015. Our findings illustrated the heterogeneity of farmers and farming practices across the state. Access to surface water, costs to access groundwater, and soil characteristics were generally important influences in all regions, but certain regions were more responsive to particular factors, such as social influences in the Northern Valley and Black Belt regions and crop price trends in the Plains Piedmont, Wiregrass, and Coastal regions. Furthermore, irrigation decisions within regions varied widely among social neighborhoods. Although the specific social influences proxied by the social neighborhoods were difficult to measure, our results highlighted their importance for interpreting differences in new irrigation events among regions and as a future topic for more in-depth, qualitative study.
Regional heterogeneity in the relative influence of each decision factor illustrated the importance of local context and limitations of the single leverage point approach of current state-level policy to increase irrigation through tax incentives. Given the variability in explanatory factors across regions, such narrow policy interventions are likely to appeal to only a limited segment of the farmers in the state. A diverse policy toolbox is needed (i.e., tax incentives for large farmers, targeted subsidies and grants to overcome credit constraints in underserved regions, community-based efforts for cost sharing among small farms) that acknowledges the varying motivations and constraints faced by farmers. For example, under current policy a riparian owner cannot transport water across their property to a non-riparian owner. The ability to do so through a ‘modified riparian rights' policy would enhance potential for irrigation. This approach can be further supported by research that integrates biophysical, socio-economic, and legal factors with high resolution spatial data analysis and modeling to identify the relative importance and mix of barriers to irrigation adoption. For example, mapping of which factors are most restrictive at the parcel level would identify specific policy leverage points that vary geographically, and target regional messaging through agricultural extension and/or community engagement about the most relevant opportunities (e.g., water access options) or incentives (e.g., USDA grants or tax incentives) for farmers to overcome specific barriers.
More broadly, our findings and lessons learned from this work have significance beyond this regional context. Survival analysis performed at the parcel level is a novel approach that targets the factors that influence the timing of decisions. Typical methods focus on static (e.g., demographics) and/or contextual (e.g., farm size and biophysical characteristics) variables, but farming decision-making is a dynamic process and factors often converge to motivate or discourage changes in practice. For example, our findings suggested that good rain-fed yields could potentially interact with higher prices to encourage irrigation adoption, particularly in the presence of social influences to do so. The dynamic, time-series nature of survival analysis can provide causal insights into changing farming practices that cross-sectional methods may not detect.
All input data used in this analysis is available at https://heima.ua.edu/data.html.
All authors listed have made a substantial, direct, and intellectual contribution to the work and approved it for publication.
The authors (AP, RP, MK, HMof, HMor, DN, and NM) were supported by a National Science Foundation award INFEWS #1856054.
The authors declare that the research was conducted in the absence of any commercial or financial relationships that could be construed as a potential conflict of interest.
All claims expressed in this article are solely those of the authors and do not necessarily represent those of their affiliated organizations, or those of the publisher, the editors and the reviewers. Any product that may be evaluated in this article, or claim that may be made by its manufacturer, is not guaranteed or endorsed by the publisher.
The authors would like to acknowledge the valuable conversations and feedback from Brian Hardin, Dr. Eve Brantley, and Dr. Lee Ellenburg.
The Supplementary Material for this article can be found online at: https://www.frontiersin.org/articles/10.3389/fsufs.2022.879161/full#supplementary-material
Allouche, J. (2011). The sustainability and resilience of global water and food systems: Political analysis of the interplay between security, resource scarcity, political systems and global trade. Food Policy, 36 (Suppl 1), S3. doi: 10.1016/j.foodpol.2010.11.013
An, L., and Brown, D. G. (2008). Survival analysis in land change science: integrating with GIScience to address temporal complexities. Ann. Assoc. Am. Geograph. 98, 323–344. doi: 10.1080/00045600701879045
Asare-Baah, L., Zabawa, R., and Findlay, H. J. (2018). Participation in selected USDA programs by socially disadvantaged farmers in selected black belt counties of Georgia. J. Rural Soc. Sci. 33, 32–55. Available online at: https://egrove.olemiss.edu/jrss/vol33/iss1/2
Austin, P. C. (2017). A tutorial on multilevel survival analysis: methods, models and applications. Int. Stat. Rev. 85, 185–203. doi: 10.1111/insr.12214
Calzadilla, A., Rehdanz, K., Betts, R., Falloon, P., Wiltshire, A., and Tol, R. S. (2013). Climate change impacts on global agriculture. Clim. Chang. 120, 357–374. doi: 10.1007/s10584-013-0822-4
Chaney, P. L., Roland, J., Moore, M., and Burton, C. G. (2020). Water use monitoring for irrigation in the United States: A case study in alabama and lessons learned for achieving sustainability. Profession. Geograph. 72, 433–447. doi: 10.1080/00330124.2020.1730194
Chen, H., Wang, J., and Huang, J. (2014). Policy support, social capital, and farmers' adaptation to drought in China. Glob. Environ. Change 24, 193–202. doi: 10.1016/j.gloenvcha.2013.11.010
Combs, P. (2019). Evaluation of Factors Influencing Irrigation Adoption Among Farmers in the Southeast. All Theses.
de Witt, M., de Clercq, W. P., Velazquez, F. J. B., Altobelli, F., and Marta, A. D. (2021). An in-depth evaluation of personal barriers to technology adoption in irrigated agriculture in South Africa. Outlook Agricult. 50, 259–268. doi: 10.1177/0030727020986941
Dewar, M., and Epstein, D. (2007). Planning for “Megaregions” in the United States. J. Plan. Lit. 22, 108–124. doi: 10.1177/0885412207306615
Fernandez-Mena, H., Gaudou, B., Pellerin, S., MacDonald, G. K., and Nesme, T. (2020). Flows in Agro-food Networks (FAN): An agent-based model to simulate local agricultural material flows. Agric. Syst. 180, 102718. doi: 10.1016/j.agsy.2019.102718
Furman, C., Roncoli, C., Bartels, W., Boudreau, M., Crockett, H., Gray, H., and Hoogenboom, G. (2014). Social justice in climate services: engaging african american farmers in the american south. Clim. Risk Manag. 2, 11–25. doi: 10.1016/j.crm.2014.02.002
Genius, M., Koundouri, P., Nauges, C., and Tzouvelekas, V. (2013). Information transmission in irrigation technology adoption and diffusion: Social learning, extension services, and spatial effects. Am. J. Agric. Econ. 96, 328–344. doi: 10.1093/ajae/aat054
Gibson, K. E., Yang, H. S., Franz, T., Eisenhauer, D., Gates, J. B., Nasta, P., et al. (2018). Assessing explanatory factors for variation in on-farm irrigation in US maize-soybean systems. Agric.Water Manag. 197, 34–40. doi: 10.1016/j.agwat.2017.11.008
Gonzalez-Alvarez, Y., Keeler, A. G., and Mullen, J. D. (2006). Farm-level irrigation and the marginal cost of water use: evidence from Georgia. J. Environ. Manag. 80, 311–7. doi: 10.1016/j.jenvman.2005.09.012
Grassini, P., Yang, H., and Cassman, K. G. (2009). Limits to maize productivity in Western Corn-Belt: A simulation analysis for fully irrigated and rainfed conditions. Agric. For. Meteorol. 149, 1254–1265. doi: 10.1016/j.agrformet.2009.02.012
Graveline, N., and Grémont, M. (2021). The role of perceptions, goals and characteristics of wine growers on irrigation adoption in the context of climate change. Agric. Water Manag. 250, 106837. doi: 10.1016/j.agwat.2021.106837
Grim, V. (2002). The high cost of water : African American farmers and the politics of irrigation in the Rural South, 1980-2000. Agric. Hist. 76, 338–353. doi: 10.1215/00021482-76.2.338
Handyside, C. T. (2014). Development of Agricultural and Irrigation Water Demand. Final report. Montgomery, AL.
Handyside, C. T. (2016). Development of Agricultural and Irrigation Water Demand (Report No. ADECA_745696_2A146). Montgomery, AL: Alabama Department of Economic and Community Affairs.
Hunecke, C., Engler, A., Jara-Rojas, R., and Poortvliet, P. M. (2017). Understanding the role of social capital in adoption decisions: An application to irrigation technology. Agric. Syst. 153, 221–231. doi: 10.1016/j.agsy.2017.02.002
Hutson, S. S., Barber, N. L., Kenny, J. F., Linsey, K. S., Lumia, D. S., and Maupin, M. A. (2004). Estimated use of water in the United States in 2000. United States Geological Survey Circular. 1268, 1–44. Available online at: https://pubs.usgs.gov/circ/2004/circ1268/
Index Mundi (2020). Commodity Price Indices. Available online at: https://www.indexmundi.com/commodities/ (accessed 11 November 2020).
Kern, J. S. (1995). Geographic patterns of soil water-holding capacity in the contiguous United States. Soil Sci. Soc. Am. J. 59, 1126–1133. doi: 10.2136/sssaj1995.03615995005900040026x
Koech, R., Haase, M., Grima, B., and andTaylor, B. (2021). Barriers and measures to improve adoption of irrigation technologies: A case study from the Bundaberg region in Queensland, Australia. Irrigat. Drain. 70, 909–923. doi: 10.1002/ird.2583
Levidow, L., Zaccaria, D., Maia, R., Vivas, E., Todorovic, M., and Scardigno, A. (2014). Improving water-efficient irrigation: Prospects and difficulties of innovative practices. Agric. Water Manag. 146, 84–94. doi: 10.1016/j.agwat.2014.07.012
Liu, T., Bruins, R., and Heberling, M. (2018). Factors Influencing Farmers' adoption of best management practices: a review and synthesis. Sustainability 10, 432. doi: 10.3390/su10020432
Loveland Technologies (2020). Alabama Parcel Data, Landgrid Data Store. Available online at: https://www.landgrid.com/store/us/al (accessed December 1, 2021).
Lu, W., and Kwasi, H. G. S. A. (2019). Transition of small farms in Ghana: perspectives of farm heritage, employment and networks. Land Use Policy, 81, 434–452. doi: 10.1016/j.landusepol.2018.10.048
Magliocca, N. R., Ellis, E. C., Allington, G. R. H., de Bremond, A., Dell'Angelo, J., Mertz, O., et al. (2018). Closing global knowledge gaps: Producing generalized knowledge from case studies of social-ecological systems. Glob. Environ. Chang. 50, 1–14. doi: 10.1016/j.gloenvcha.2018.03.003
Manson, S. M., Jordan, N. R., Nelson, K. C., and Brummel, R. F. (2016). Modeling the effect of social networks on adoption of multifunctional agriculture. Environ. Model. Softw. 75, 388–401. doi: 10.1016/J.ENVSOFT.2014.09.015
Manson, S. M., Sander, H. A., Ghosh, D., Oakes, J. M., Orfield, Jr, M. W., Craig, W. J., et al. (2009). Parcel data for research and policy. Geogr. Compass 3, 698–726. doi: 10.1111/j.1749-8198.2008.00209.x
Marcus, R. R., and Kiebzak, S. (2008). R. R. Marcus - The role of water doctrines in enhancing opportunities for sustainable agriculture in Alabama1. J. Am. Water Resour. Assoc. 44, 1578–1590. doi: 10.1111/j.1752-1688.2008.00261.x
Mbuli, C. S., Fonjong, L. N., and Fletcher, A. J. (2021). Climate change and small farmers' vulnerability to food insecurity in Cameroon. Sustainability 13, 1523. doi: 10.3390/su13031523
McDonald, R. I., and Girvetz, E. H. (2013). Two Challenges for U.S. irrigation due to climate change: increasing irrigated area in wet states and increasing irrigation rates in dry states. PLoS ONE 8, e65589. doi: 10.1371/journal.pone.0065589
McNider, R., Christy, J., and Hairston, J. E. (2005). Bringing agriculture back to water - a solution for the 21st century (2005 - Annual2005_h20supply). in American Meteorological Society Forum: Living with a Limited Water Supply. American Meteorological Society. Available online at: https://ams.confex.com/ams/Annual2005/techprogram/paper_85724.htm (accessed March 1, 2021).
Mertz, O., Mbow, C., Reenberg, A., and Diouf, A. (2009). Farmers' perceptions of climate change and agricultural adaptation strategies in rural sahel. Environ. Manage. 43, 804–816. doi: 10.1007/s00267-008-9197-0
Meyfroidt, P. (2016). Approaches and terminology for causal analysis in land systems science. J. Land Use Sci, 11, 501–522. doi: 10.1080/1747423X.2015.1117530
Moore, M., Chaney, P. L., Brantley, E., and Burton, C. G. (2021). Drought management plans of major cities in alabama v. California. Southeast. Geogr. 61, 31–48. doi: 10.1353/sgo.2021.0003
Mottaleb, K. A. (2018). Perception and adoption of a new agricultural technology: evidence from a developing country. Technol. Soc. 55, 126–135. doi: 10.1016/j.techsoc.2018.07.007
MRLC (2014). National Land Cover Dataset, Multi-Resolution Land Characteristics Consortium. Available online at: https://www.mrlc.gov/ (accessed December 1, 2021).
Natural Resources Conservation Service (NRCS) (2017a). NRCS Announces Irrigation Pilot in Alabama's Black Belt Counties | NRCS Alabama. 17 February. Available online at: https://www.nrcs.usda.gov/wps/portal/nrcs/detail/al/newsroom/releases/?cid=NRCSEPRD1315858 (accessed March 1, 2021).
Natural Resources Conservation Service (NRCS) (2017b). NRCS Invests in 48 Projects in Local Watersheds to Protect Communities and Vital Infrastructure | NRCS Alabama. 6 October. Available online at: https://www.nrcs.usda.gov/wps/portal/nrcs/detail/al/newsroom/releases/?cid=NRCSEPRD1356821 (accessed March 1, 2021).
Natural Resources Conservation Service (NRCS) (2018). Alabama State Resource Assessment. Auburn, AL: Natural Resources Conservation Service.
Negri, D. H., Gollehon, N. R., and Aillery, M. P. (2005). The effects of climatic variability on US irrigation adoption. Clim. Change 69, 299–323. doi: 10.1007/s10584-005-1817-6
Parthasarathy, D., and Chopde, V. K. (2013). Building Social Capital: Collective Action, Adoption of Agricultural Innovations, and Poverty Reduction in the Indian Semi-Arid Tropics Paper for the Research Theme Escaping Poverty. International Crops Research Institute for the Semi-Arid Tropics. p. 11–13.
Patle, G. T., Kumar, M., and Khanna, M. (2019). Climate-smart water technologies for sustainable agriculture: a review. J. Water Clim. Change 11, 1455–1466. doi: 10.2166/wcc.2019.257
PRISM Climate Group (2020). PRISM Climate Group'. Corvallis, OR: Oregon State University. Available online at: https://prism.oregonstate.edu/ (accessed December 1, 2021).
Rejesus, R. M. (2013). U.S. agricultural producer perceptions of climate change. J. Agric. Appl. Econ. 45, 701–718. doi: 10.1017/S1074070800005216
Shange, R., Martin, R., Khan, V., Daniels, K., Hunter, G. X., Johnson, G. J., et al. (2014). Extending sustainable irrigation opportunities to socially and historically disadvantaged farmers in the alabama black belt to support commercial-level production. Prof. Agric. Work. J. 1, 3–8. Available online at: https://tuspubs.tuskegee.edu/cgi/viewcontent.cgi?article=1014&context=pawj
Shiferaw, B., Tesfaye, K., Kassie, M., Abate, T., Prasanna, B. M., and Menkir, A. (2014). Managing vulnerability to drought and enhancing livelihood resilience in sub-Saharan Africa: Technological, institutional and policy options. Weather Clim. Extrem. 3, 67–79. doi: 10.1016/j.wace.2014.04.004
Sydnor, E. T., and Molnar, J. J. (2020). Using and Improving Irrigation Systems: Producer Perceptions and Possibilities. Int. J. Res. Agric. For. 7, 21.
Tack, J., Barkley, A., and Hendricks, N. (2017). To cite this article: Jesse Tack et al. Environ. Res. Lett 12, 114027. doi: 10.1088/1748-9326/aa8d27
Tesfaye, M. Z., Balana, B. B., and Bizimana, J. C. (2021). Assessment of smallholder farmers' demand for and adoption constraints to small-scale irrigation technologies: Evidence from Ethiopia. Agric. Water Manag. 250, 106855. doi: 10.1016/j.agwat.2021.106855
Thériault, M., Le Berre, I., Dubé, J., Maulpoix, A., and Vandersmissen, M. H. (2020). The effects of land use planning on housing spread: A case study in the region of Brest, France. Land Use Policy 92, 104428. doi: 10.1016/j.landusepol.2019.104428
Troy, T. J., Kipgen, C., and Pal, I. (2015). The impact of climate extremes and irrigation on US crop yields. Environ. Res. Lett. 10, 54013. doi: 10.1088/1748-9326/10/5/054013
United States Government Accountability Office (GAO) (2019). Report to Congressional Requesters: Irrigated Agriculture Technologies, Practices, and Implications for Water Scarcity. GAO-20-128SP. Available online at: https://www.gao.gov/assets/gao-20-128sp.pdf
USDA (2007). Listing of Counties and Districts used by USDA-NASS. Available online at: https://www.nass.usda.gov/Data_and_Statistics/County_Data_Files/Frequently_Asked_Questions/county_list.txt (accessed December 1, 2021).
USDA Economic Research Service (ERS) (2021). Agricultural Productivity in the U.S. Available online at: https://www.ers.usda.gov/data-products/agricultural-productivity-in-the-us/ (accessed March 1, 2021).
USGS (2020). NHD 20200615 for Alabama State or Territory FileGDB 10.1 Model Version 2.2.1'. The United States Geological Survey. Available online at: https://www.usgs.gov/core-science-systems/ngp/national-hydrography/access-national-hydrography-products (accessed December 1, 2021).
van Duinen, R., Filatova, T., Jager, W., van der Veen, A., and Nl, A. V. (2016). Going beyond perfect rationality: drought risk, economic choices and the influence of social networks. Annu. Rev. Reg. Sci. 57, 335–369. doi: 10.1007/s00168-015-0699-4
Van Duinen, R. van, Filatova, T., Geurts, P., and Veen, A. van der (2015). Empirical analysis of farmers' drought risk perception: Objective factors, personal circumstances, and social influence. Risk Anal. 35, 741–755. doi: 10.1111/risa.12299
Verburg, P. H., Ellis, E. C., and Letourneau, A. (2011). A global assessment of market accessibility and market influence for global environmental change studies. Environ. Res. Lett. 6, 034019. doi: 10.1088/1748-9326/6/3/034019
Wang, J., Klein, K. K., Bjornlund, H., Zhang, L., and Zhang, W. (2015). Adoption of improved irrigation scheduling methods in Alberta: An empirical analysis. Canad. Water Resour. J. 40. doi: 10.1080/07011784.2014.975748
Wickham, J., Stehman, S. V., Gass, L., Dewitz, J. A., Sorenson, D. G., Granneman, B. J., et al. (2017). Thematic accuracy assessment of the 2011 National Land Cover Database (NLCD). Remote Sens. Environ. 191, 328–341. doi: 10.1016/j.rse.2016.12.026
Wickham, J. D., Stehman, S. V., Gass, L., Dewitz, J., Fry, J. A., and Wade, T. G. (2013). Accuracy assessment of NLCD 2006 land cover and impervious surface. Remote Sens. Environ. 130, 294–304. doi: 10.1016/j.rse.2012.12.001
Zagaria, C., Schulp, C. J. E., Zavalloni, M., Viaggi, D., and Verburg, P. H. (2021). Modelling transformational adaptation to climate change among crop farming systems in Romagna, Italy. Agric. Syst. 188, 103024. doi: 10.1016/j.agsy.2020.103024
Keywords: climate change adaptation, technology adoption, water resources policy, Southeastern United States, survival analysis
Citation: Price AN, Pathak R, Guthrie GM, Kumar M, Moftakhari H, Moradkhani H, Nadolnyak D and Magliocca NR (2022) Multi-Level Influences on Center-Pivot Irrigation Adoption in Alabama. Front. Sustain. Food Syst. 6:879161. doi: 10.3389/fsufs.2022.879161
Received: 18 February 2022; Accepted: 01 June 2022;
Published: 07 July 2022.
Edited by:
Yanjun Shen, University of Chinese Academy of Sciences, ChinaReviewed by:
Henry Jordaan, University of the Free State, South AfricaCopyright © 2022 Price, Pathak, Guthrie, Kumar, Moftakhari, Moradkhani, Nadolnyak and Magliocca. This is an open-access article distributed under the terms of the Creative Commons Attribution License (CC BY). The use, distribution or reproduction in other forums is permitted, provided the original author(s) and the copyright owner(s) are credited and that the original publication in this journal is cited, in accordance with accepted academic practice. No use, distribution or reproduction is permitted which does not comply with these terms.
*Correspondence: Nicholas R. Magliocca, bnJtYWdsaW9jY2FAdWEuZWR1
Disclaimer: All claims expressed in this article are solely those of the authors and do not necessarily represent those of their affiliated organizations, or those of the publisher, the editors and the reviewers. Any product that may be evaluated in this article or claim that may be made by its manufacturer is not guaranteed or endorsed by the publisher.
Research integrity at Frontiers
Learn more about the work of our research integrity team to safeguard the quality of each article we publish.