 Chinglembi Laishram1*
 Rohit Kumar Vashishat1
 Subhash Sharma1Bhavna Rajkumari2Neha Mishra3Parul Barwal1Manoj Kumar Vaidya1Ravinder Sharma4Rajeshwar Singh Chandel5Ashu Chandel3Rakesh Kumar Gupta3Neha Sharma6
- 1Department of Social Sciences, Dr. YS Parmar University of Horticulture and Forestry, Solan, India
- 2Department of Seed Science and Technology, Dr. YS Parmar University of Horticulture and Forestry, Solan, India
- 3Department of Basic Sciences, Dr. YS Parmar University of Horticulture and Forestry, Solan, India
- 4Directorate of Research, Dr. YS Parmar University of Horticulture and Forestry, Nauni, India
- 5State Project Implementation Unit (SPIU), Shimla, India
- 6Department of Biotechnology, Amity University, Noida, India
Natural farming, popularly known as zero budget natural farming, is an innovative farming approach. It is low input based, climate resilient, and low cost farming system because all the inputs (insect repellents, fungicides, and pesticides) are made up of natural herbs and locally available inputs, thereby reducing the use of artificial fertilizers and industrial pesticides. It is becoming increasingly popular among the smallholder farmers of Himachal Pradesh. Under the natural farming system, 3 to 12 crops are cultivated together on the same area, along with leguminous crops as intercrop in order to ensure that no piece of land is wasted and utilized properly. This article focuses mainly on the different cropping systems of natural farming and comparing the economics of natural farming (NF) with conventional farming (CF) systems. Study shows that farmers adopted five major crop combinations under natural farming system, i.e., vegetables-based cropping system (e.g., tomato + beans + cucumber and cauliflower + pea + radish), vegetables-cereals-based cropping system, and other three more cropping systems discussed in this article. The results indicated that a vegetable-based cropping system has 19.68% more net return in Kharif season and 24.64% more net return in Rabi season as compared to conventional farming vegetable-based monocropping system. NF maximizes land use and reduces the chance of crop yield loss. NF has resulted in increased returns especially in the vegetable cropping system where reduction in cost was 30.73 per cent (kharif) and 11.88 per cent (rabi) across all crop combinations in comparison to CF. It is found in study that NF was cost savings from not using chemical fertilizers and pesticides, as well as higher benefit from intercrops.
Introduction
For around 58% of India's population, agriculture is their major source of income. Agriculture, forestry, and fishery had a gross value added of Rs 19.48 lac crore (US$ 276.37 billion) in fiscal year 2020. In fiscal year (FY) 2020, agricultural and allied industries accounted for 17.8% of India's gross value added (GVA) at current prices. Consumer expenditure in India would increase by as much as 6.6% in 2021. India's share in world agricultural exports increased to 2.1% in 2019 from 1.71% in 2010 (Ministry of Commerce, 2021).
The country achieved its remarkable agricultural growth in the 1960s, after the emergence of the Green Revolution. India marked a new era in Indian agricultural history. The Green Revolution technology aimed to increase agricultural production mainly by substituting typically hardy plant varieties with high-response varieties and hybrids, the use of fertilizers and plant protection chemicals, irrigating more cultivated land by investing heavily on large irrigation systems, and consolidation of agricultural holdings (Sebby, 2010). India has gained its outstanding position in food production, but it is also facing a poor ranking in the hunger index (Menon et al., 2008). The Green Revolution left its harmful footprints on Indian agriculture. The monocropping system, increased and frequent use of fertilizers and pesticides caused considerable damage to the soil's biological operation, crop diversity, increased cost of cultivation, deterioration of groundwater, loss of flora-fauna, increased human diseases, malnutrition, and decreased soil fertility, which have almost left it barren in large areas. As a consequence, farmers with small farms invest in these costly inputs, which are exposed to high monetary risks and push them in the debt cycle (Eliazer et al., 2019). With pesticides' obvious environmental and ecological effects, it is no surprise that government laws have been strengthened (Carrington, 2019). Furthermore, the possible health implications of pesticide residue have terrified many of us into choosing pesticide-free items. Even though rules exist to assure legal maximum residual levels that have been considered scientifically acceptable for food, the campaign to eliminate pesticides has gained traction. Restoring soil health by reverting to non-chemical agriculture has assumed great importance in achieving sustainability in production.
In India, a chemical-free and climate-resilient method of farming given by a scientist Subhash Palekar, during 2006 in Maharashtra to end the problems arising after the Green Revolution by introducing natural farming. His methods popularized when farmers started adopting his methods. After that, many researchers and scientists claimed that natural farming is a good alternative to chemical farming that directly or indirectly impacts sustainable development positively (Tripathi and Tauseef, 2018). The aim of natural farming is to reduce the cost of production to almost zero and to come back to the “pre-Green Revolution” style of agriculture (Khadse et al., 2017). This would seem to lead growers out of loans by putting a stop to agricultural chemicals practices. The central government has implemented a policy to encourage farming methods throughout India. The state governments of Andhra Pradesh, Chhattisgarh, Himachal Pradesh, Uttarakhand, Kerala, and Karnataka asked Subhash Palekar to educate their farmers for natural farming (Khadse and Rosset, 2019a,b).
In order to promote natural farming in Himachal Pradesh, a scheme “Prakritik Kheti Khushhal Kisan” was initiated with a budget allocation of Rs 35 crore (2019–2020). Under this scheme, peasants will be supported with training, the required machinery, to achieve the objective of sustainable farming doubling farmers' incomes, improved soil fertility, and low input costs (Vashishat et al., 2021). Though the search for a better alternative shall always remain, right now natural farming is a credible alternative itself (Mishra, 2018).
Natural farming is a special form of agriculture that does not requires any financial expenditure to purchase the essential inputs such as seeds, fertilizers, and plant protection chemicals from the market. Natural farming, though in its preliminary stages, is showing increased positive results and is being adopted by farmers in good faith. It is even cited by farmers that labor and production costs have drastically reduced 14–45% (Chandel et al., 2021).
The cropping system of natural farming focuses mainly on traditional Indian practices based on agroecology; natural farming absolutely requires no monetary investment for purchase of key inputs at all (Palekar, 2005). Due to its simplicity, adaptiveness, and huge reduction in cost of cultivation to know the impact of the cropping system of natural farming on the small and marginal farmers, this study was conducted.
The objectives of this study will be:
i) To study the socioeconomic status of the farmers.
ii) To study the comparative economics of natural farming vis-à-vis conventional farming.
iii) To identify the constraints of natural farming.
Methodology
Selection of the Study Area and Respondents
Solan district of Himachal Pradesh was purposely selected for this study. The district comprises five development blocks, i.e., Dharampur, Kandaghat, Nalagarh, Solan, and Kunihar. Out of these, three blocks were selected randomly and a list of farmers practicing both the Subhash Palekar Natural Farming (SPNF) and conventional farming were procured from the Project Director ATMA, Solan. From the list, 20 farmers each from the three selected blocks were selected randomly. Thus, total samples of 60 farmers were selected for this study. The primary data were collected from the farmers practicing both the natural farming and conventional farming systems by survey method using a well-structured and pre-tested schedule (questionnaire).
Distribution of Sampled Farmers Practicing Natural Farming According to Their Size of Landholding
For the analysis of data, the total respondents were divided according to the size of their landholdings into three classes, viz., marginal (<1 ha), small (1–2 ha), and medium (2–4 ha). The distribution of the sampled farmers is given in Table 1.
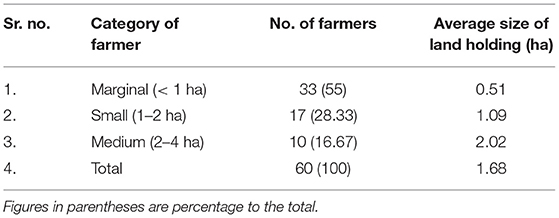
Table 1. Distribution of sampled households according to their landholdings.
Analytical Framework
To fulfill the above specified objectives of this study, based on the nature and extent of availability of data, the following analytical tools and techniques have been employed for the analysis of the data.
Tabular Analysis
Simple tabular analysis was used to examine socioeconomic status, resource structure, income and expenditure pattern, and farmers' opinions about the production and marketing problems under natural farming. Simple statistical tools such as averages and percentages were used to compare, contrast, and interpret the results. The sex ratio, literacy rate, and index were calculated using the following formulae:
Where,
Wi = Weights (0, 1, 2, 3, 4, and 5) for illiterate, primary, middle, metric, secondary, and graduate and above, respectively.
Xi = Number of persons in respective category.
Costs and Returns Analysis
Commission for Agricultural Costs and Prices Cost Concepts
Cost A1 includes:
i) Cost of planting material cost
ii) Cost of manures, fertilizers, and plant protections
iii) Cost of hired human labor
iv) Cost of owned and hired machinery
v) Irrigation charges
vi) Depreciation on implements, farm buildings, and irrigation structures
vii) Land revenue
viii) Interest on owned working capital
ix) Other miscellaneous charges.
• Cost A2: Cost A1 + rent paid for leased-in land
• Cost B1: Cost A1 + interest on the fixed capital assets excluding land
• Cost B2: Cost B1 + rental value of owned land
• Cost C1: Cost B1 + imputed value of family labor
• Cost C2: Cost B2 + imputed value of family labor
• Cost C3: Cost C2 + 10% of cost C2 on account of managerial function performed by the farmer.
Crop Equivalent Yield
In natural farming system, many types of crops were cultivated in a multiple or mixed cropping. So, it was very difficult to compare the economics of multiple crops with a single crop. Francis (1986) described crop equivalent yield (CEY) to the sum of equivalent principal and intercrop yields. The differing yield intercrops were transformed into the equivalent yield of any crop depending on the commodity price. So, a comparison was made based on economic returns and crop equivalent yield (CEY) of multiple cropping sequences was calculated by converting the yield of different intercrops/crops into equivalent yield of any one crop based on price of the produce. Mathematically, the CEY is represented as:
Where,
CY = Yields of the main crop
P0 = Price of the main crop
(Cy1, Cy2, Cy3…..Cyn) = Yields of intercrop, which are to be converted to equivalent of main crop yield
(P1, P2, P3… Pn) = Price of the respective intercrops.
Relative Economic Efficiency
Farrell (1957) distinguished three types of efficiency, namely, technical efficiency, price or allocative efficiency, and economic efficiency (which is a combination of the first two). Economic efficiency is distinct from the other two efficiencies, even though it is the product of technical and allocative efficiencies. Relative economic efficiency, which is a comparative measure of economic gains, can be calculated by:
Statistical Analysis
The comparative economics was statistically analyzed as per the procedure given by Gomez and Gomez (1984). The ANOVA was carried out based on the model in Table 2.
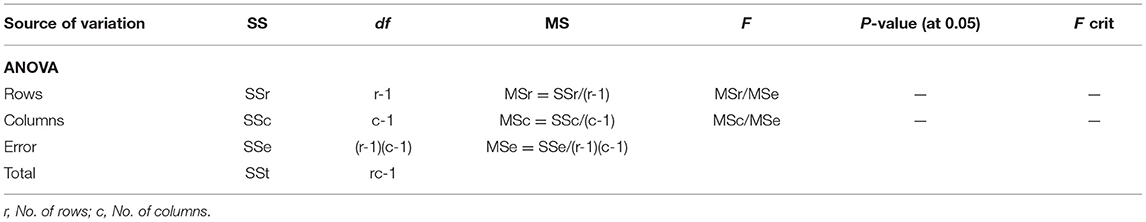
Table 2. ANOVA (two-rowed without replication) layout.
Production and Marketing Problems
To study the various problems associated with the production and marketing of natural farming, it was assumed that the extent of a particular problem varies from place to place and farmer to farmer. The multiple responses of producers reporting various problems were taken into consideration for analysis.
Garrett's Ranking Technique
The Garrett's ranking technique (Garrett and Woodworth, 1969) was used for examination of constraints. It is important to note here that these constraints were focused on the response of all the sample farmers. The respondents were asked to rank the problems in turmeric and cotton production, processing, and marketing. In the Garrett's ranking technique, these ranks were converted into percent position by using the formula:
Where,
Rij = Ranking given to the ith attribute by the jth individual
Nj = Number of attributes ranked by the jth individual.
By referring to the Garrett's table, the percentage positions estimated were converted into scores. Thus, for each factor, the scores of the various respondents were added and the mean values were estimated. The mean values, thus, obtained for each of the attributes were arranged in descending order. The attributes with the highest mean value were considered as the most important one and the others followed in that order.
Chi-Squared Test
To test whether there was any significant difference among marginal, small and medium farms of Solan for the problems faced by them, chi-square test (Pearson, 1900) in (m × n) contingency table was applied where m and n are the number of marketing problems faced by the farmers of natural farming in Solan district. The detail of approximate chi-squared test is given as under:
Where,
O = Observed values
E = Expected values
K = Number of problems
L = Number of the farm size groups.
Results and Discussion: Socio-Economic Characteristics of Sampled Households
Size and Structure of the Sampled Households in the Study Area
The size and structure of the family play an important part in influencing crop production. The size and structure of the sampled households in the study area are given in Table 3. At an overall level, the average family size was 5.28 out of which 51.64% were males, 39.66% were females, and 8.70% were children. The average family size ranged from 5.21 to 5.35 and was observed highest in the small farmers (5.35) followed by medium farmers (5.30) and marginal farmers (5.21). The results indicated that the dominant family structure in the area under study was the nuclear family (66.67%). It was highest in small farms (47.06%) followed by marginal (30.30%) and medium farm categories (20%).
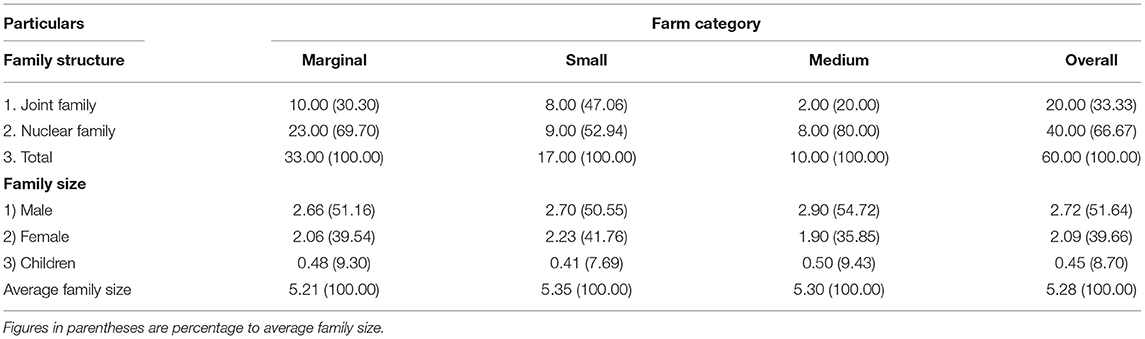
Table 3. Demographic profile of sampled households in the study area (No.).
Literacy Status of the Sampled Households
Literacy is an indicator of an individual's educational status and level of education enabling him/her to engage and participate in enhancing and improving the social and economic well-being of the surroundings. Good literacy skills open up doors for education and jobs, so people can avoid poverty and underemployment. The rate of literacy is a reflection of good human capital. Higher literacy leads to a higher level of awareness, interaction with new inventions and technologies, etc. The literacy status of the sampled households is given in Table 4. It is revealed from Table 4 that the overall literacy rate was 89.70% in males and 77.52% in females and the highest literacy rate was observed in the small farm category with 91.30% in males and 78.05% in females. Table 4 shows that 23.55% males and 7.35% females had education level upto graduation and above. The literacy index varied from 1.58 to 2.30 in males among different farm categories, while the literacy index varied from 1.73 to 2.26 in females among different farm categories, which clearly show the poor quality of education. As the level of education increases, nowadays people understand the importance of better healthcare and due to that many farmers have started to focus more on natural farming and have no adverse impact on human health.
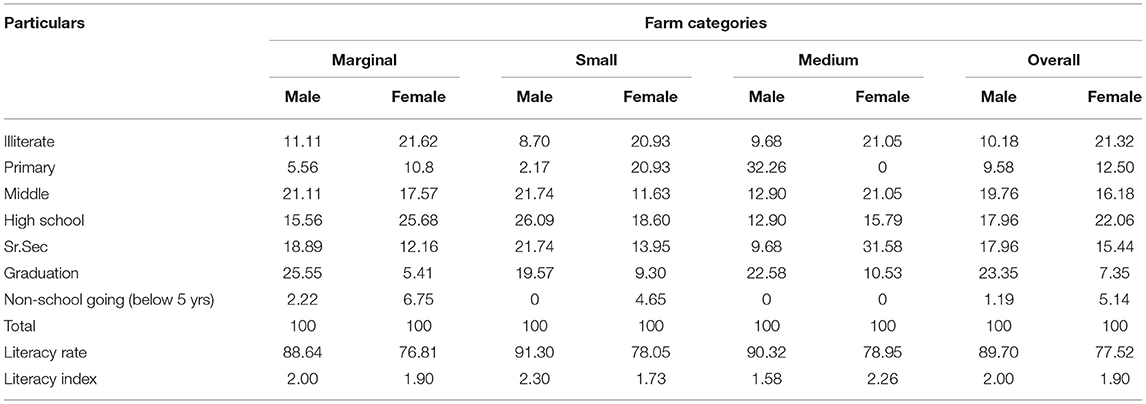
Table 4. Farm category-wise literacy status of sampled households (%).
Occupational Distribution of the Sampled Households
The occupational patterns play a very significant role in ascertaining the economic status of the family. In this way, we know about the households engaged in various activities such as agriculture, business, and government or private services. In developing countries, the majority of the population are still engaged in agricultural activities and other primary activities. When the area is more developed, the employment patterns will be more diversified and household incomes will also increase. Development and progress of employment are very much linked to economic development. The occupational structure, allocation of workers, and number of dependents are shown in Table 5.
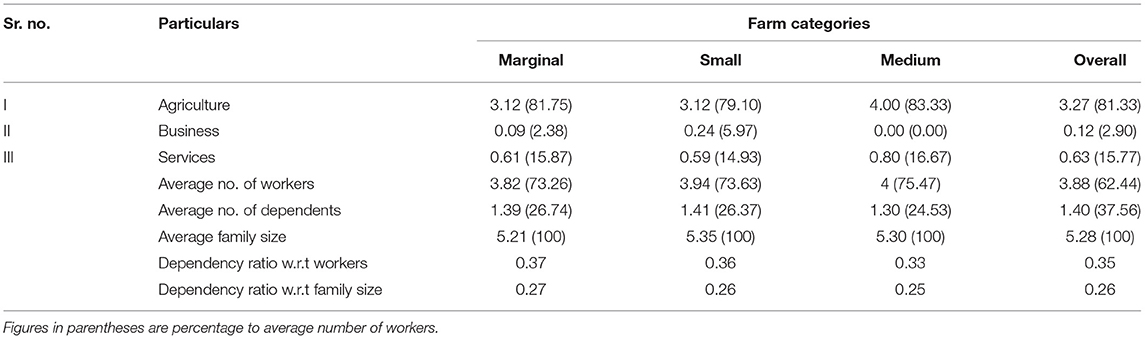
Table 5. Farm category-wise occupational distribution of the sampled households (No.).
The workforce reflects the distribution of members of the household making a contribution to the household economy. A family with more working people will be much more precise in terms of their livelihood strategies. Table 5 concludes that 81.33% of the households are engaged in agriculture, which means that agriculture being the main occupation in the study area. With the growing importance of natural farming, farmers have become more aware of the importance of health benefits and, hence, the percentage of farmers engaged in this sector is coming out highest as compared to business and services. On an average, 2.90 per worker were engaged in business and public/private sector (15.77%), respectively.
The largest proportion of productive agricultural workers was observed in the medium farm category with 83.33% followed by the marginal (81.75%) and small farm categories (70.10%). So, as far as the average number of dependents is concerned, the highest percentage was observed in the marginal farm (26.74%) followed by the small farm (26.37%) and lowest in the medium farm category (24.53%). At the overall level, productive workers were 3.88 and varied from 3.82 to 4.00 in the marginal to medium farm categories. The overall dependency ratio with respect to workers was (1:0.35) and among the different categories, the highest was observed in marginal category (1:0.37), followed by small (1:0.36) and medium farm categories (1:0.33). Dependency result illustrates that on average, one worker has to support less than one member of the family in the sampled household.
Table 6 reveals that the majority of the workforce were the males (53.81 %), while the female workers constituted 46.19%. The percentage of the male workers was the highest in medium farm category (62.50%) followed by marginal (52.94%) and small farm categories (49.09%). The proportion of female workers was considered to be the highest (50.91%) in the small farm category followed closely by the marginal (47.06%) and medium-farm categories (37.50%).
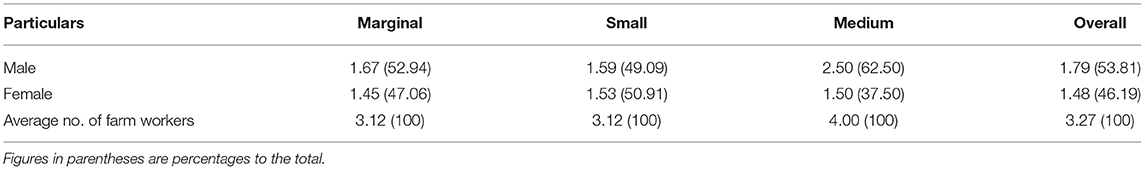
Table 6. Gender-wise distribution of the farm workers in the sampled households (No.).
Season-Wise Major Crop Combinations Under Natural Farming System
Under natural farming system, three to four crops are cultivated or grown together on the same area, along with leguminous crops as intercrop in order to ensure that no piece of land is wasted and utilized properly. These combinations during the growing season were established to encourage interaction between them and are based on the idea that complementarities exist between the plants. Intercropping with leguminous crops is considered as one of the most important components of natural farming as it increases crop productivity and soil fertility through the atmospheric nitrogen fixation. These complementarities between crops increase soil and its nutrients. It also involves diversification and improves profits by growing and selling various types of cereals, vegetables, legumes, fruit, and even medicinal plants. The multiple cropping systems substantially enhance income. This system maximizes land use and reduces the chance of crop yield loss. This study found that farmers grow different crops under different crop combinations in the study area. The major crop combinations adopted by the selected farmers were categorized as: (i) vegetables, (ii) vegetables-cereals, (iii) vegetables-pulses, (iv) cereals-pulses, and (v) vegetables-oilseeds crops. From Table 7, it was observed that in Kharif season, the major vegetable being grown in the study area was tomato and the other crops included were capsicum, cucumber, bottle gourd, chili, okra, brinjal, etc. The main intercrops (leguminous) in the study area include French bean and soybean. The major cereals and pulses include maize, beans, soybean, etc. While in Rabi season, cauliflower is the major vegetable followed by wheat, pea, and chickpea as the major cereals and pulses grown in the study area. The other crop includes radish, fenugreek, coriander, spinach, potato, onion, garlic, etc. Mustard was being grouped under as major oilseeds crops. The main leguminous crops (intercrops) in Rabi season were pea, chickpea, and kidney beans.
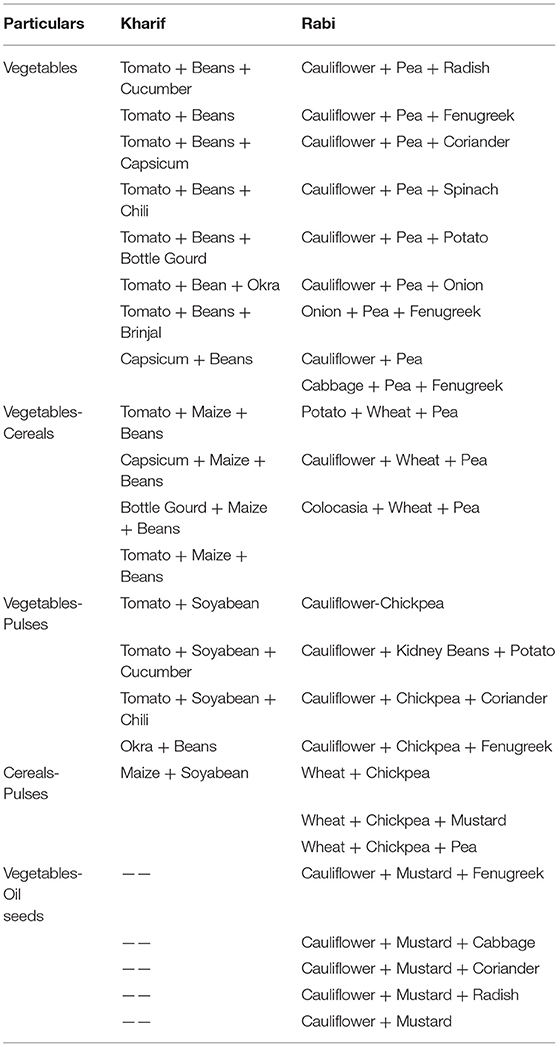
Table 7. Season-wise major crop combinations under natural farming (NF) system.
Now, in conventional farming, as opposed to natural farming, solo cropping is practiced. From Table 8, it was observed that the main crops grown by the farmers were tomato and maize in the Kharif season and in Rabi season, the main crops grown were cauliflower, wheat, chickpea, and mustard.
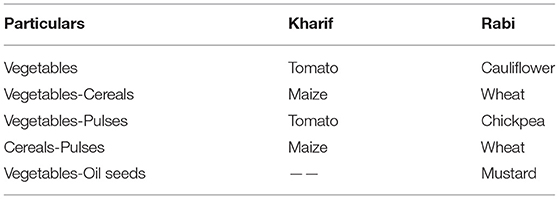
Table 8. Season-wise major crop combinations under conventional farming (CF) system.
So, in order to compare within these two systems, one main crop is kept common between the two systems. For example, from Table 1, in the Kharif season, in natural farming, in vegetables crop combination, it was observed that tomato is the main crop and it was being planted along with several crops. Similarly, in Table 8, under conventional farming, it was seen under the vegetables section (Kharif season) that the main crop is tomato. So, in order to compare these two systems, a comparison was made based on economic returns and, henceforth, crop equivalent yield (CEY) of multiple cropping sequences was calculated by converting the differing yields of intercrops into the equivalent yield of the main crop, i.e., tomato (in case of vegetables crop combination for both the systems) depending on price of the produce. Similarly, CEY of other crop combinations was also calculated by using this same method mentioned above.
Comparative Analysis of Natural Farming System and Conventional Farming System
Yield
Under natural farming system, two or three crops are cultivated on the same farmland. Because different crop types were grown in a multiple or mixed crop system, it was hard to equate NFs economic produce with CF. So, to compare the yield, the crop equivalent yield (CEY) concept was used for a mixed cropping system. In the statistical analysis shown in Tables 9, 10, we can observe that, along the rows, all the crop combinations have significantly higher yields under NF as compared to CF in both the seasons. Now, from Table 11, it was observed that, for all the crop combinations, the yield in the NF system was found to be higher than the CF system and it varied from 49.20 to 208.45 q/ha. The maximum yield was observed in vegetables 208.45 q/ha for the Kharif season. In the case of the Rabi season, it ranged from 48.33 to 58.12 q/ha. Same results were found like Kharif season, i.e., yield in all the crop combinations under NF was more than of CF. The maximum yield was observed in vegetables crop combination (58.12 q/ha). From Table 11, it was observed that CEY of the NF system was found to be greater than that of those of the CF system. All the NF crop combinations show an average increase in yield over the CF system. In the Kharif season, the increase in the yield under NF system over CF system varied from 3.08 to 5.10%, while in Rabi season, it ranged from 2.83 to 7.98% in all the crop combinations. In Kharif season, the maximum increase in yield under NF was observed in vegetables and cereals-pulses in Rabi season. The above results were supported by Tripathi and Tauseef (2018), which stated that the average of zero budget natural farming (ZBNF) groundnut farmers was 23% higher than their counterparts outside the ZBNF. On average ZBNF, paddy farmers had a 6% higher yield. These increments are the result of sustainable farming practices, which also improve farmers' capacity to adapt to climate change. Also, another study observed an increase in CEY under cereals-pulses combination (17.22%). This higher increase can be attributed to the comparative remunerative prices of pulses and symbiotic effect of pulses on cereal crop yield (Chandel et al., 2021).
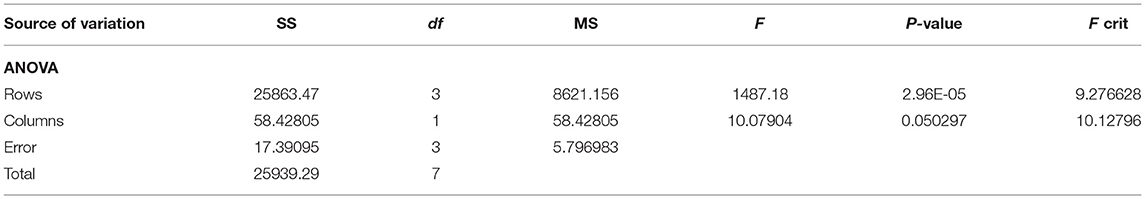
Table 9. Statistical analysis of Kharif season from Table 11.
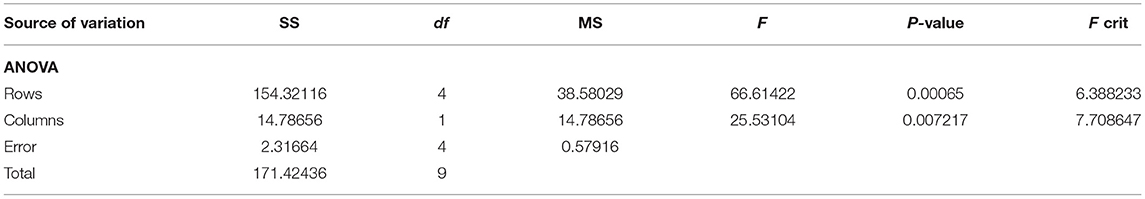
Table 10. Statistical analysis of Rabi season from Table 11.
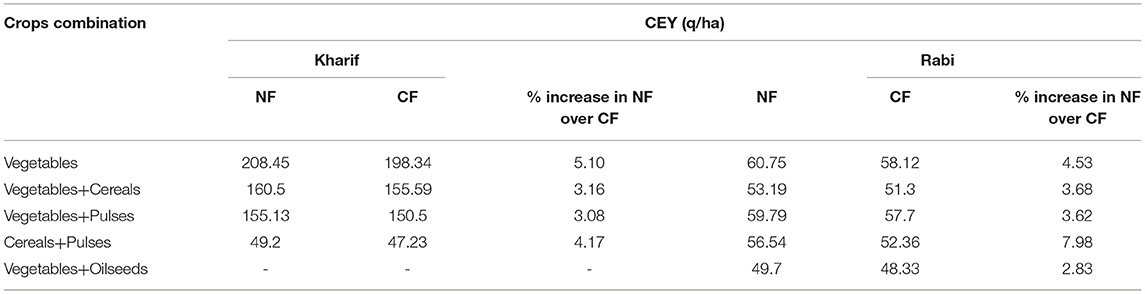
Table 11. Crop equivalent yield (CEY) of various crop combinations under NF and conventional farming (CF) systems.
Cost of Cultivation
One of the key cost components for the production of cash crops such as fruits and vegetables under the CF system in the state is chemical inputs. This continuous farming activity has contributed to higher costs and eventually reduced incomes for farmers. A substantial decrease in the cost of growing these crops has occurred with the use of NF technology. Tables 12, 13 indicate the statistical analysis of the cost of cultivation where we can observe that, along the rows, all the crop combinations have significantly lower costs under NF as compared to CF in both the seasons. Table 14 presents a comparison of cost of cultivation between NF and CF systems. It has been observed that the total cost of all the crop combinations in NF systems during the cultivation process was substantially reduced. In the Kharif season, the percentage reduction in NF cultivation costs over the CF system ranged from 12.56 to 30.73%, while in the Rabi season it ranged from 6.86 to 12.34%. In Kharif season, maximum reduction in cost was observed in vegetables crop combination, whereas in case of Rabi season, the maximum reduction was observed in cereal-pulses crop combination. This indicates that the NF method lowers the costs of farmers as it uses non-synthetic inputs locally in contrast to CF capital intensive inputs. Similar findings have been published, which revealed that, after converting into ZBNF, farmers had a decreased cost of cultivation for all the crops and, most significantly, farmers were able to increase their income from natural agricultural practices by increasing the number of crops (Mishra, 2018). In another study, it was observed that the total cost of cultivation was reduced across all the crop combinations. The total expenditure in fruit-based cropping sequences showed a marked decline from Rs. 2,40,638 to Rs. 1,31,023 per ha., which indicate that the SPNF system reduces farmers' direct costs, boosting yields, and promotes the use of locally sourced non-synthetic inputs, compared to capital intensive CF (Chandel et al., 2021).
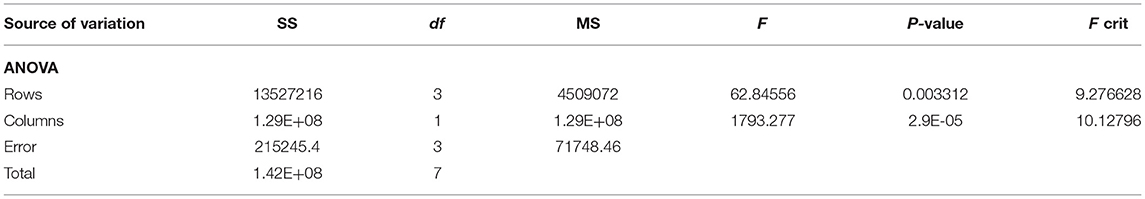
Table 12. Statistical analysis of Kharif season from Table 14.
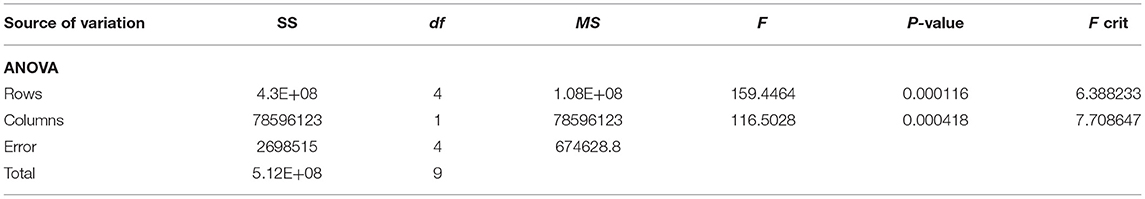
Table 13. Statistical analysis of Rabi season from Table 14.
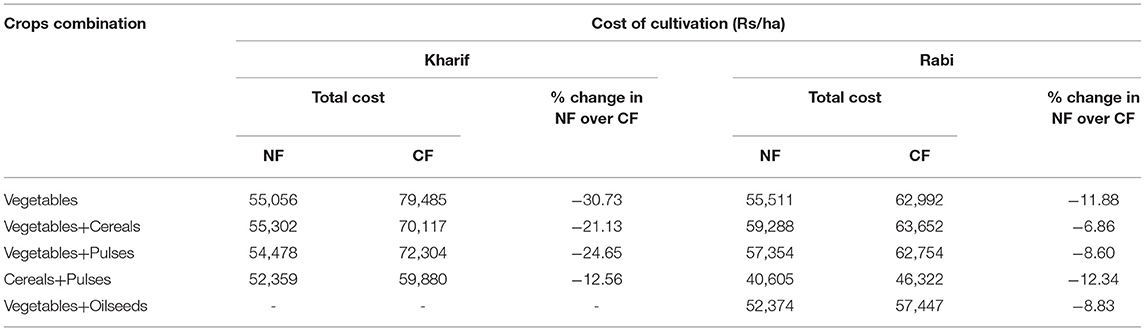
Table 14. Cost of cultivation of various crop combinations under NF and CF systems.
Conventional farming currently faces numerous challenges such as decreasing factor productivity, inappropriate and imbalanced use of nutrients, poor water and nutrient quality, depletion of natural resources, and increased input costs. Different crop combinations have clearly demonstrated that chemical-based farming technologies are highly capital intensive.
Net Returns
The profits and losses of a farm are reflected through its net income. It constitutes gross returns from the business after deduction of total cost incurred. In NF, input costs are highly diminished due to the abstinence from pesticides, insecticides, and adoption of natural inputs such as jivamrit, bijamrit, ghanjivamrit, and neemastra. NF inputs and other natural preparations have a major impact due to reduced expenditure on chemical fertilizers and pesticides. The statistical analysis for net returns under NF and CF is shown in Tables 15, 16. Here, it is very apparent that, along the rows, all the crop combinations have significantly higher net returns under NF as compared to CF in both the seasons. Furthermore, Table 17 reveals that net returns in NF were higher than CF across all the crop combinations. The relative economic efficiency (REE), the comparative measure of economic gain in NF over the CF in all the crop combinations in the Kharif season, was 13.20 to 23.05% higher, while in the Rabi season, it was 24.16 to 31.30% higher in all the crop combinations. Maximum relative economic efficiency was observed in the cereals-pulses crop combination in the Kharif season and in Rabi season, the maximum relative economic efficiency was observed in the vegetables-pulses crop combination. Increased NF returns can be attributed to expenditure savings due to local inputs and additional revenue from intercrops. Mixed cropping helped to make more efficient use of the farm area than solo crop cultivation to further increase the net profit, in addition to increasing the variety of available crops at different times during the growing season. The results were supported by the same study undertaken by Chandel et al. (2021) which stated that the REE was 11.80 to 21.55% higher in all the crop combination under the SPNF as compared to the CF system.

Table 15. Statistical analysis of Kharif season from Table 17.
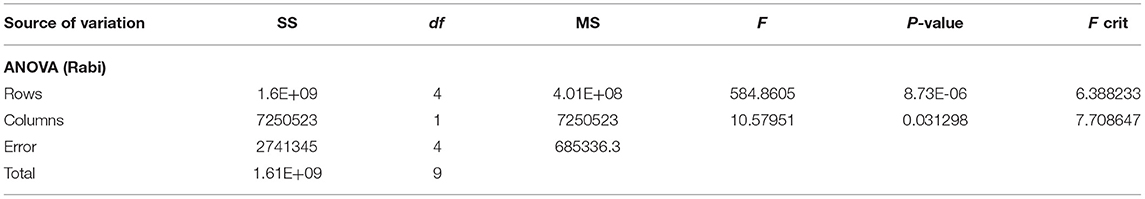
Table 16. Statistical analysis of Rabi season from Table 17.
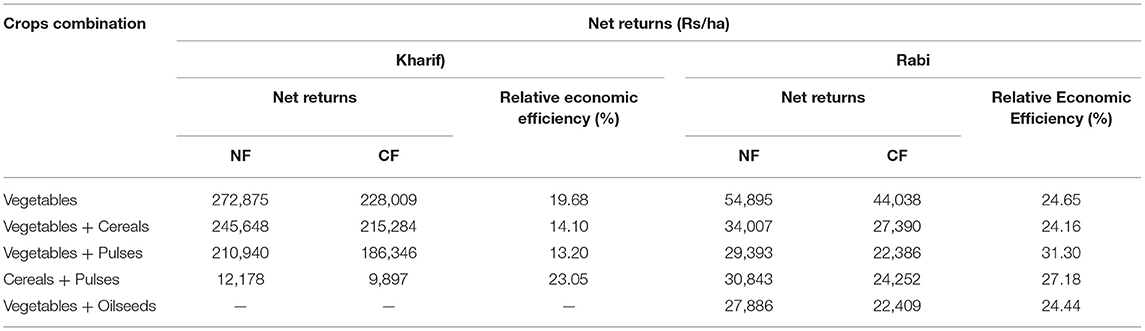
Table 17. Crop combination-wise net returns under NF and CF systems.
Problems Faced by the Natural Farmers
There are constraints when it comes to any development process. Likewise, there are several constraints regarding natural farming, which were faced by the concerned natural farmers of Solan district. Some of the main constraints include unfair price in the market, irrigation facilities, lack of specialized markets for the produce, high wage rates, lack of training facilities, etc. For examination of constraints, the Garrett's ranking technique was used. It must also be noted that these limitations have been aimed at the response of all the sample farmers. Table 18 shows the constraints faced by various farm categories.
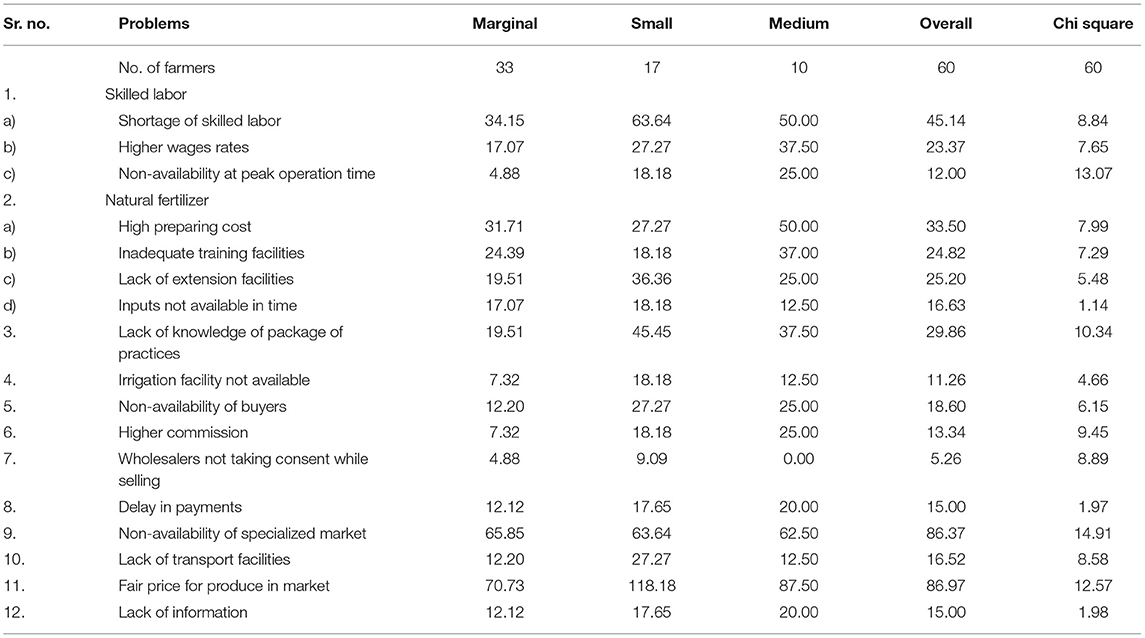
Table 18. Farm category-wise problem faced by natural farming producer in study area (Multiple response, %).
Chi-Squared Test
An effort was made to examine the problems between different farm categories in the field of production and marketing. The chi-squared tests have been performed to check if the problems are specified by farm category or are independent of the farm category. As prices differ greatly, producers have had problems with production and marketing due to high wage levels, lack of technical awareness, lack of safe plant material, and lack of irrigation and storage facilities. These concerns were categorized in two subgroups: production issues and marketing issues.
It was observed from Table 18 that among the production problems, shortage of skilled labor, higher wage rate, non-availability at peak operation time, and inadequate training facilities were found statistically significant. It showed significant differences between the different farm categories. In case of marketing problems, non-availability of specialized markets, lack of transport facility, and fair price in the market were found statistically significant. It showed that these problems were faced by all the farm categories.
Garrett's Ranking Technique
The various problems faced by the farmers are shown in Table 19.
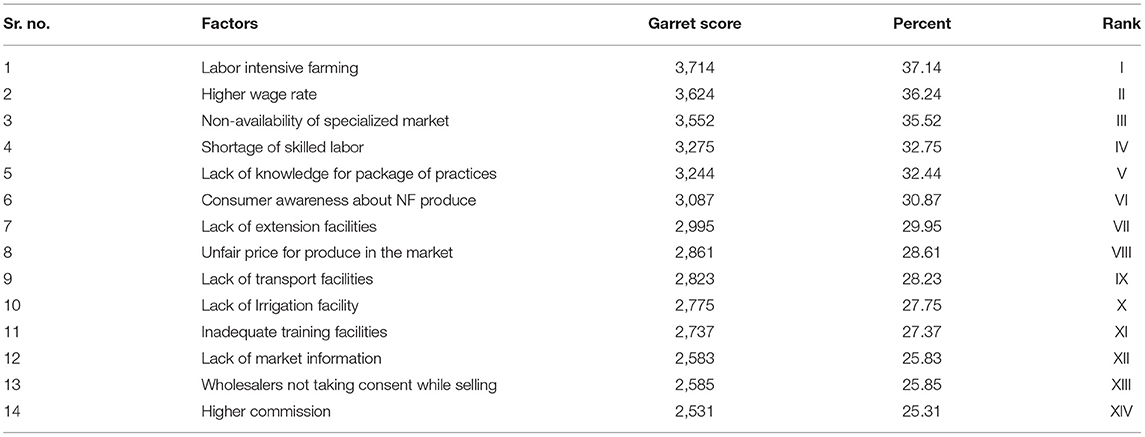
Table 19. Farmers' perceptions and problems faced by NF growers in the study area.
The Garrett's ranking system was used in this analysis, using the ranks attained by each problem to assess the most serious and the least serious problems. The major problems faced by the farmers were labor intensive (I) followed by higher wage rate (II), non-availability of specialized market (III), shortage of skilled labor (IV), knowledge of package of practices (V), consumer awareness about NF produce (VI), lack of extension facilities (VII), unfair price for produce in the market (VIII), etc. Other common problems include lack of transport facilities, lack of irrigation facilities, etc.
Conclusion
Intercropping with leguminous crops is considered as one of the most important components of natural farming as it increases crop productivity and soil fertility through the atmospheric nitrogen fixation. The results revealed that farmers witnessed a drop in per hectare cost of production and profitable yield for their crops as well. The farmers were pleased that natural farming is both environmentally friendly and extremely cost-effective. The crop equivalent yield (CEY) under natural farming was highest in all the crop combinations as compared to conventional farming and ranged from 3.08 to 5.10% in Kharif season and 2.83 to 7.98% in all the crop combinations in Rabi season. In Kharif season, the percentage reduction in cost of cultivation under NF over the CF system ranged from 12.56 to 30.73, while in Rabi season, it ranged from 6.86 to 12.34. The gross returns under NF systems were highest in all the crop combinations as compared to CF systems. The maximum increase in gross returns was in vegetables crop combination in both the seasons. The relative economic efficiency (REE) was highest in all the crop combinations under NF over CF system. Among the problems studied, shortage of skilled labor, higher wage rate, non-availability at peak operation time, inadequate training facilities, non-availability of specialized markets, lack of transport facility, and fair price in the market were found statistically significant. It showed significant differences between the different farm categories. The analysis showed that the natural farming system provides relatively higher returns per hectare than the conventional farming system. Also, it was observed that the major problems faced by the farmers were labor intensive (I) followed by higher wage rate (II), non-availability of specialized market (III), shortage of skilled labor (IV), knowledge of package of practices (V), consumer awareness about NF produce (VI), lack of extension facilities (VII), unfair price for produce in the market (VIII), etc. Other common problems include lack of transport facilities, lack of irrigation facilities, etc. So, there is a need for the Department of Agriculture to take up effective measures to encourage natural farming through campaigns by educating the farmers about its importance. The government should also encourage higher premium prices and channels of green marketing for the boosting of natural crops. The farmers should focus more on the full application of the NF model on their farm fields and should know the best way to use these products, i.e., proper mulching techniques (acchadan), application of jivamrit, ghanjivamrit, bijamrit, astras, etc., in order to enhance productivity.
Data Availability Statement
The original contributions presented in the study are included in the article/supplementary material, further inquiries can be directed to the corresponding author/s.
Author Contributions
All authors listed have made a substantial, direct, and intellectual contribution to the work and approved it for publication.
Conflict of Interest
The authors declare that the research was conducted in the absence of any commercial or financial relationships that could be construed as a potential conflict of interest.
Publisher's Note
All claims expressed in this article are solely those of the authors and do not necessarily represent those of their affiliated organizations, or those of the publisher, the editors and the reviewers. Any product that may be evaluated in this article, or claim that may be made by its manufacturer, is not guaranteed or endorsed by the publisher.
References
Carrington, D.. (2019). EU Bans UK's Most-Used Pesticide Over Health and Environment Fears. London: The Guardian.
Chandel, R. S., Gupta, M., Sharma, S., Sharma, P. L., Verma, S., and Chandel, A. (2021). Impact of Palekar's natural farming on farmers' economy in Himachal Pradesh. Indian J. Ecol. 48, 873–878.
Eliazer, N. A. R. L., Ravichandran, K., and Antony, U. (2019). The impact of the Green Revolution on indigenous crops of India. J. Ethn. Food 6, 1–11 doi: 10.1186/s42779-019-0011-9
Farrell, M. J.. (1957). The measurement of productivity efficiency. J. R. Stat. Soc. Ser. 120, 153–290. doi: 10.2307/2343100
Francis, C. A.. (1986). Distribution and importance of multiple cropping. Agric. Syst. 25, 238–240. doi: 10.1016/0308-521X(87)90024-2
Garrett, E. H., and Woodworth, R. S. (1969). Statistics in Psychology and Education. Vakils, Feffer and Simons Pvt. Ltd., Bombay.
Gomez, K. A., and Gomez, A. A. (1984). Statistical Procedures for Agricultural Research, 2nd Edn. New York, NY: John Wlley and Sons.
Khadse, A., and Rosset, P. M. (2019a). Zero Budget Natural Farming in India-from inception to institutionalization. Agroecol. Sustain. Food Syst. 8, 21–35. doi: 10.1080/21683565.2019.1608349
Khadse, A., and Rosset, P. M. (2019b). Zero budget natural farming in India from inception to institutionalization. Agroecol. Sustain. Food Syst. 4, 5–6.
Khadse, A., Rosset, P. M., Morales, H., and Ferguson, B. G. (2017). Taking agroecology to scale: the zero budget natural farming peasant movement in Karnataka, India. J. Peasant Stud. 45, 9–12. doi: 10.1080/03066150.2016.1276450
Menon, P., Deolalikar, A., and Bhaskar, A. (2008). Comparisons of Hunger across States: India State Hunger Index. International Food Policy Research Institute.
Ministry of Commerce (2021). Agriculture in India: Information about Indian Agriculture and Its Importance. Available online at: https://www.ibef.org/industry/agriculture-india.
Mishra, S.. (2018). Zero Budget Natural Farming: Are This and Similar Practices The Answers. Nabakrushna Choudhury Centre for Development Studies, Bhubaneswar.
Palekar (2005). The Philosophy of Spiritual Farming Amravati: Zero Budget Natural Farming Research, Development and Extension Movement. Amravati.
Pearson, K.. (1900). On the Criterion that a given system of deviation from the probable in the case of a co-related system of variables is such that it can be reasonably suppose to have arisen from random sampling. Philos. Mag. Ser. 50, 157–175. doi: 10.1080/14786440009463897
Sebby, K.. (2010). The Green Revolution of the (1960)'s and Its Impact on Small Farmers in India. Environmental Studies Undergraduate Student Thesis. Available online at: https://digitalcommons.unl.edu/envstudtheses/10
Tripathi, S., and Tauseef, S. (2018). Zero Budget Natural Farming, for the Sustainable Development Goals. Andhra Pradesh.
Keywords: natural farming, sustainability, crop combinations, intercropping, Himachal Pradesh
Citation: Laishram C, Vashishat RK, Sharma S, Rajkumari B, Mishra N, Barwal P, Vaidya MK, Sharma R, Chandel RS, Chandel A, Gupta RK and Sharma N (2022) Impact of Natural Farming Cropping System on Rural Households—Evidence From Solan District of Himachal Pradesh, India. Front. Sustain. Food Syst. 6:878015. doi: 10.3389/fsufs.2022.878015
Received: 17 February 2022; Accepted: 08 April 2022;
Published: 31 May 2022.
Edited by:
Sendhil R., Pondicherry University, IndiaReviewed by:
Subhash Chandra Tripathi, Indian Institute of Wheat and Barley Research (ICAR), IndiaR. Jayakumara Varadan, Central Island Agricultural Research Institute (ICAR), India
Geretharan Thangavelautham, Eastern University, Sri Lanka
Sreenath Dixit, International Crops Research Institute for the Semi-Arid Tropics (ICRISAT), India
Kiran Kumar T. M., National Institute for Agricultural Economics and Policy Research (NIAP), India
Copyright © 2022 Laishram, Vashishat, Sharma, Rajkumari, Mishra, Barwal, Vaidya, Sharma, Chandel, Chandel, Gupta and Sharma. This is an open-access article distributed under the terms of the Creative Commons Attribution License (CC BY). The use, distribution or reproduction in other forums is permitted, provided the original author(s) and the copyright owner(s) are credited and that the original publication in this journal is cited, in accordance with accepted academic practice. No use, distribution or reproduction is permitted which does not comply with these terms.
*Correspondence: Chinglembi Laishram, Y2hpbmdsYWlzaEBnbWFpbC5jb20=