- 1Department of Sustainable Agriculture Sciences, Rothamsted Research, Harpenden, United Kingdom
- 2International Institute of Tropical Agriculture, Ibadan, Nigeria
- 3International Institute of Tropical Agriculture, Nairobi, Kenya
- 4International Institute of Tropical Agriculture, Arusha, Tanzania
- 5Department of Computational and Analytical Sciences, Rothamsted Research, Harpenden, United Kingdom
Food security and livelihoods among smallholder farmers in sub-Saharan Africa are often constrained by limited farm resource endowment. It can be difficult to improve resource endowment given barriers such as low land availability and the unaffordability of agricultural inputs, so here we ask whether farmers can gain a better return on their resources through optimizing their farm strategy in terms of the composition and/or diversity of crop and livestock species raised. Our survey of 1,133 smallholder farmers in western Kenya and northern Nigeria, using a modified version of RHoMIS, indicated that different farm strategies were related to differences in food security and farm incomes. In particular, we found that it was possible for farms with a high species richness but low resource endowment to achieve similar or better food security and income outcomes than farms with low species richness and high resource endowment. This indicates strong potential for diversification to improve food security and livelihoods among smallholder farmers. However, further research will be required to prove a causal relationship. We also noted some exceptions to this trend that require investigation: increasing species richness was not beneficial for low-resourced, livestock-focused farmers in western Kenya, and increasing species richness was associated with a decline in dietary diversity in northern Nigeria (due to declines in purchased dietary diversity that outweighed increases in on-farm and other sources of dietary diversity). Similar analyses could be applied to a wider RHoMIS dataset covering a greater diversity of countries and agro-ecological zones to help identify where, and why, different farm strategies result in better or worse outcomes for smallholder farmers.
Introduction
Achieving food and nutrition security in Africa remains a critical and complex challenge (Van Ittersum et al., 2016; Giller, 2020). In 2019, 19.1% of the population were unable to meet their calorific needs, and this is predicted to rise to 25.7% (or 443 million people) by 2030 if current trends continue. Meanwhile, nearly a billion people in Africa are currently unable to afford a healthy diet, and the effects of the ongoing COVID-19 pandemic are expected to further worsen the situation (FAO, 2020). Resolving food security and nutrition will not be easy, and will require a combination of multiple global and local interdisciplinary actions to address challenges including international and domestic policy barriers, unequal food distribution, low soil fertility, and limited access to farm resources (Foley et al., 2011; Springmann et al., 2018; Giller, 2020).
At the farm scale, interventions to improve food security can target both the resources available to farmers, and how farmers make use of those resources to meet their nutritional needs and generate a livelihood. Previous studies indicate that farm resource endowment, in terms of land and livestock assets and inputs of labor and nutrients to manage these, impose a strong limitation on farm production and consequently food security (Tittonell et al., 2005, 2010). However, access to assets and inputs can be challenging to improve, particularly given intractable factors such as limited land availability (Giller, 2020) and the costs of fertilizers and crop protection products (Pingali, 2012). This raises the question of whether, given a certain level of resource endowment, farmers can achieve better outcomes through different strategies to make use of those resources.
One possibility to improve food security may lie in optimizing the composition and diversity of crop and livestock species raised. In particular, there is substantial agronomic and ecological evidence that increased diversification can positively affect farm productivity, food security, and livelihoods. More diverse on-farm production is often linked to more diverse diets (Jones, 2017; Sibhatu and Qaim, 2018) and increased food security (Waha et al., 2018). Farmed species diversity can also benefit productivity, as different plant species occupy different niches in the agroecosystem, leading to complementarity in space and time. This can increase productivity from a given land area and resource input (Isbell et al., 2017). In particular, legumes can increase the nitrogen and phosphorous availability to cereals, with cereal-legume rotations found to increase cereal yields in sub-Saharan Africa by 41% on average (Franke et al., 2018), while a global meta-analysis by Li et al. (2020) indicated that intercropping could save 16–29% of land and 19–36% of fertilizer compared with monocultures.
Farm species diversity can also suppress weed, pest and disease populations (Storkey et al., 2019). For example, rotating soybean and maize reduced Striga damage by 12–15% and increased maize grain yield by 16% in Nigeria (Kamara et al., 2020). Crop diversity has also been found to improve yield stability in warmer, drier climates (Steward et al., 2018), and many minor crops, cultivars and livestock breeds are more resilient to extreme weather than dominant, mainstream commodity crops and livestock (Massawe et al., 2016). Manda et al. (2021) found that participation in both single– and multiple–commodity markets was positively and significantly associated with household income and food security, but the greatest benefits were obtained when farmers participated in multiple-commodity markets by diversifying their crops (mainly maize-legume combinations). Crop diversity at the national scale may also increase employment opportunities (Garibaldi and Pérez-Méndez, 2019).
We hypothesize, therefore, that different farm strategies, in terms of the compositions and diversities of crop and livestock species farmed, may lead to different food security outcomes. However, it is important to consider that farm strategy may also be constrained by economic and environmental pressures. For example, livestock may be prioritized over crops where they confer cultural status, or as a more reliable food source in marginal climates, while mixed farming systems may be preferred where livestock enhance crop production through manure and traction for tillage (Moll, 2005). Resources allocated to crop rather than livestock production can increase where environmental conditions (e.g., length of growing season) are more favorable (Cecchi et al., 2010), or where livestock production is hindered by parasites such as the tsetse fly.
Resource endowment has also been shown to influence farm strategy, both negatively and positively; on one hand, greater resources may facilitate specialization, whilst on the other hand, too few resources may limit farmers to relying on just a few crops. For example, Mellisse et al. (2018) describe an increased preference for annual cash crops on small farms in Ethiopia, where selling higher-value cash crops and purchasing lower-value staples is a more viable route to food sufficiency than producing for on-farm consumption. Wiggins et al. (2011) noted that it was common for farmers across Africa to focus on securing sufficient production of a staple crop before expanding into cash cropping, and Snapp and Fisher (2015) observed that this need to first “fill the maize basket” meant that farmers were more likely to diversify their crops only after achieving a certain level of maize production. In contrast, some poorer farming households retain diversity to meet needs they cannot meet through markets. For example, poorer households in western Kenya retained a higher diversity of tree crops, apparently to meet their own medicinal, nutritional and construction needs, whilst wealthier farmers found it easier to meet these needs through purchased goods (Kindt et al., 2004).
In this study, we explored the relationships between resource endowment, farm strategy and food security outcomes among smallholder farmers in western Kenya and northern Nigeria. Little previous comprehensive research on farm composition and diversity has taken place in these regions. The Atlas of African Agriculture Research and Development describes the selected counties in western Kenya as a combination of “maize mixed” and “highland perennial”, and Kano and Kaduna states in Nigeria as “agropastoral,” “irrigated,” and “cereal-root crop mixed” (Auricht et al., 2014)—useful classifications, but describing broad groups of farms at a coarse resolution. Cecchi et al. (2010) classified all of the study area in Kenya as “mixed farming” (albeit their study had a wider geographic scope and a focus on livestock), again leaving a knowledge gap with regard to a more specific characterization of farm composition and diversity within the region.
A handful of previous studies have explored the relationships between the diversity of farmed species and dietary diversity in western Kenya, but with inconsistent findings. Ng'endo et al. (2016) found no link between food plant diversity and food security or dietary diversity, while Muthini et al. (2020) found that farmed species diversity did increase dietary diversity, although the number of livestock species was the strongest predictor of dietary diversity. Boedecker et al. (2019) also found in a participatory project that increasing homegardens, poultry-raising and nutrition education did increase dietary diversity in women and children. As noted above, Kindt et al. (2004) suggested tree crop diversity was higher on poorer farms, but as a response to, rather than a cause of, food insecurity and low incomes. To our knowledge, no previous studies explored farmed species diversity and dietary diversity in either Kano or Kaduna in Nigeria.
Given this rather sparse state of knowledge in the current literature, the aim of this study was to characterize different farm strategies in western Kenya and northern Nigeria, and understand whether farm strategy is associated with different food security outcomes within the constraints of the resources available to a farm household (Figure 1). Specifically, we ask (i) is farm resource endowment related to farm strategy in terms of the composition and/or species richness of crops and livestock within a farm, and (ii) within the constraints of resource endowment, is farm composition and/or species richness associated with different food security, dietary diversity, and farm incomes? To investigate these relationships, we used the Rural Household Multi-Indicator Survey (RHoMIS) to characterize 1,133 smallholder farms across both countries. RHoMIS allows the acquisition of a set of standardized indicators across diverse agricultural contexts, making it a useful tool to compare results between countries and in the context of the wider literature (Hammond et al., 2017). It is also readily modifiable to address additional study-specific questions.
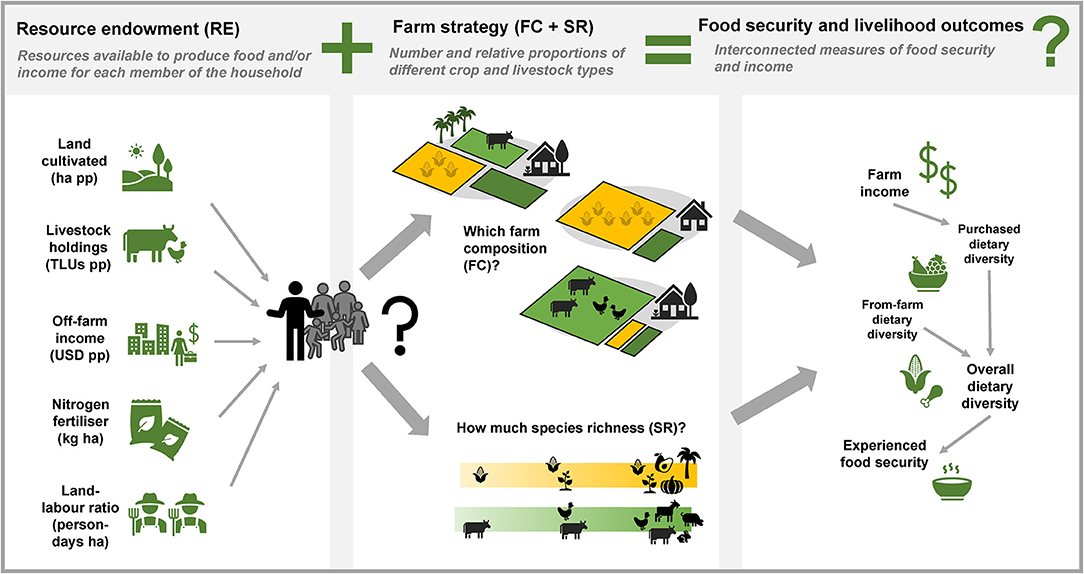
Figure 1. A conceptual framework showing how the different variables considered in this study are related.
Methods
Data Collection
Survey Regions and Household Selection
Household surveys were undertaken in eight counties across two provinces (Western Kenya and Nyanza) of Kenya, and in 14 local government areas (LGA) across two states (Kano and Kaduna) of Nigeria (Figure 2). These regions were selected for comparison because of their similarities including the widespread presence of maize as a staple crop (Dixon et al., 2001), and comparable ranges of human population densities (Linard et al., 2012) and livestock densities (Robinson et al., 2014). The exact selection of LGAs in Nigeria was modified in response to logistical and security concerns for the enumerator teams.
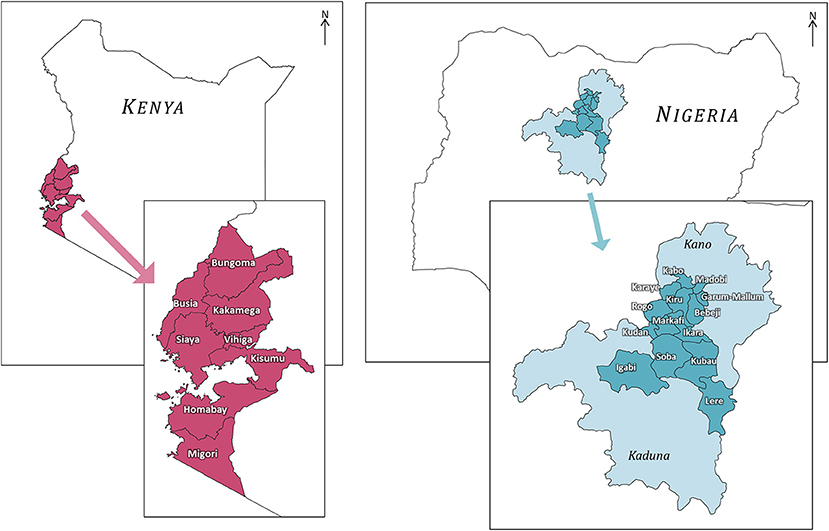
Figure 2. The locations of the counties in Kenya and LGAs in Nigeria in which surveys were undertaken. Different map images are not to scale.
Households were selected from a hierarchical sampling frame by first randomly selecting eight electoral wards within each county or five electoral wards within each LGA, and then randomly selecting three villages within each selected ward (where wards contained fewer than three villages, they were omitted from the sampling pool in Kenya, or combined with a neighboring ward in Nigeria). Lists of villages within wards were acquired from local government sources and/or Open Street Map Contributors (2015), and the existence of villages confirmed via local contacts. Wards were randomly allocated to enumerator teams following incomplete block designs, with each county (Kenya) surveyed by three different enumerator teams and each LGA (Nigeria) being surveyed by two different enumerator teams, so that each team surveyed three villages within one ward in each day.
When enumerators arrived in the village they asked to be directed toward one “small farm”, one “medium farm” and one “large farm” to interview. This stratification strategy ensured a breadth of resource endowment was included in the sampled households, given that farm size is a key indicator of resource endowment, and also avoided biasing the selection toward any notions of diversity or lack thereof. Enumerators rotated small/medium/large farms amongst themselves in each village so that each enumerator visited one farm of each size in each ward, to avoid any biases associated with differences between the enumerators.
Surveys
Surveys were undertaken in the main cropping season in each region in 2019, i.e., in June during the long rains in Kenya and in November during the harvest season in northern Nigeria. Five hundred and seventy-four surveys were completed in Kenya and 559 in Nigeria. We used the Rural Household Multiple Indicator Survey (RHoMIS) tool installed on handheld electronic tablets (Hammond et al., 2017). RHoMIS is a modular, standardized survey designed to collect information on agricultural production, nutrition and poverty among rural households and was chosen for this study due to the possibility to collect data specific to our research questions within the context of internationally recognized and comparable indicators. Careful consideration was made as to the inclusion of questions in the survey in order to collect the evidence required to challenge our hypothesis while ensuring the survey could be completed in a reasonable time with each farmer. The modularity of RHoMIS allowed us to expand the crop section in order to have enough information to fully characterize farm composition and farmed species richness, while retaining other sections to allow us to obtain standardized indicators of a wide range of livelihood indicators to embed our results within the wider literature, such as the Food Insecurity Experience Scale, FIES, and the Household Dietary Diversity Score, HDDS. We did however shorten or exclude some other modules in order to keep the survey duration under 1 h to avoid respondent fatigue. Information on additions and deletions to the standard RHoMIS variables can be found in Section 1 Modifications to RHoMIS for the Purposes of This Study, of the Supplementary Material.
Data Analysis
Overview
In this study, we took a typology approach to cluster farms into groups with similar resource endowment (RE) and farm composition (FC). Creating typologies is useful to partition out variation in multiple variables to gain better insight into relationships of interest, and typologies have been widely used in research on smallholder farms, with the specific method of typology generation chosen according to each study's distinct aims (Alvarez et al., 2018; Hammond et al., 2020). Typologies allow multiple potentially correlated variables to be represented as a single variable; for example, wealthier farms are likely to have multiple markers of wealth (more land area, greater livestock holdings, and higher input use), so grouping farms together based on these multiple variables provides an informative indicator of a farm's overall resource endowment. Similarly, a farm that grows a greater proportion of one type of crop is likely to grow smaller proportions of other types of crops, so a typology approach is also useful to classify different farm compositions.
To classify households into different resource endowment typologies we used a hierarchical cluster analysis of variables relevant to resource endowment within our RHoMIS datasets. The resulting RE classes provided a categorical variable to partition out the variance relating to resource endowment rather than farm strategy in subsequent analyses. Next, we described households' farm strategy according to their farm composition (FC) and farmed species richness (SR). We classified farms into different FC groups using another independent hierarchical cluster analysis of the proportions of different types of crops cultivated and livestock raised on each farm. RE and FC are distinct, independent variables: RE describes total resources available to the household, while FC describes how resources are proportionally distributed among different crop and livestock types. SR is the total number of crop, livestock, and fruit and vegetable species grown on a farm (and is also independent from both RE and FC). We used regression models to explore the effects of RE, FC and SR on outcome variables measuring food security, nutrition, and income (Figure 1). All analyses were undertaken in R, version 4.0.3 (R Core Team, 2020).
Resource Endowment Classification
The variables chosen to define resource endowment were land area cultivated (hectares per person), livestock holdings (tropical livestock units, TLUs, per person), off-farm income (Purchasing Power Parity Dollars, USD PPP, per person), N fertilizer (kg ha−1 year−1) and labor (person-days ha−1 year−1, including both household labor and hired labor). These variables represent the land and animals available to produce food and income for the household, and the fertilizer, labor, and additional income available to improve their per unit productivity (Figure 1). Including the productive assets (land and animals) as well as the means for intensification (fertilizer, labor, off-farm income) is important given that previous studies have identified differences between farms that are constrained by either land or by labor (Tittonell et al., 2010). Our RE variables are similar to variables used in previous research to identify resource endowment groups (e.g., Tittonell et al., 2005, 2010), but are not identical—we excluded variables considered to be food security outcomes for the purpose of this study (see below) and variables for which we did not have suitable data from our survey. Distributions of each variable included are shown in Supplementary Figure S1.
Improbable outliers were detected using a combination of the quantile method (where values that are more than two standard deviations away from the mean are identified) and visually inspecting plots of the data (scatter plots and histograms of the data). We identified that many farms in Nigeria had reported unusually high incomes, which was concluded to be a result of the low value of the naira and enumerators accidentally adding extra zeroes (e.g., entering the income from the sale of a cow at 2,000,000 naira rather than 200,000 naira). To address this, incomes were adjusted if the income per unit (head of livestock for each type of animal, liter of milk per animal per day, kilogram of each type of crop yield or annual income per hectare of each type of crop) was unusually high: if over five times the median value for that unit, the income per unit was divided by 10, if over fifty times it was divided by 100 and if over 500 times it was divided by 1,000. This means the value was never reduced to below half the median, but values nearing an order of magnitude (or more) higher than the median were reduced to the same order of magnitude as the median. For example, if the median price for a chicken is 1,000 naira, then entries of 8,000, 80,000, or 800,000 naira were all reduced to 800 naira, while anything up to 5,000 naira was not modified. This adjustment affected the total income estimate for 174 (31%) farms in Nigeria, i.e., the income reported for at least one crop or livestock product on each of these farms was adjusted.
Inexplicable outliers (e.g., a farm reporting 600,000 kg nitrogen fertilizer ha−1) were replaced with “NA” (missing values), and farms were excluded from the cluster analysis if they contained more than one missing value for the resource endowment variables. Thirty-one farms across both countries were excluded for lacking sufficient information.
Farms were classified into different resource endowment (RE) groups according to their relative values of each resource endowment variable using hierarchical cluster analysis, with the Bray-Curtis dissimilarity measure and Ward's clustering method, using R functions vegan::vegdist with method = “bray” (Oksanen et al., 2020) and stats::hclust with method = “ward.d2” (R Core Team, 2020). Resource endowment variables were scaled prior to the analysis to give them equal weighting in the clustering: each value of the variable was divided by the variable's standard deviation, so that all scaled variables had the same variance (equal to 1). The number of clusters were selected by visually inspecting the dendrogram and assessing the distinctions in crop/livestock proportions at various levels of cluster similarity. This cluster analysis was performed for the farms for each country separately.
Farm Composition Classification and Farmed Species Richness
The survey collected data on the area of land cultivated with each crop and the number of TLUs for different livestock species. Respondents also listed all fruit and vegetables grown, although areas for these were not requested, as fruits and vegetables tend to be grown in homegardens rather than taking up substantial areas of the farm. Participants who grew large areas of a fruit or vegetable, such as bananas or tomatoes, generally reported these as crops. We characterized “farm composition” (FC) by the area dedicated to different types of crops and by the numbers of different livestock species held, while “farmed species richness” (SR) consisted of the total number of all fruit and vegetable, crop, and livestock species grown for home use or sale on the farm. We also considered the number of species in each category on different farms, i.e., the species richness of crops, of livestock, and of fruit and vegetables.
To assign farms to different FC categories, crops were first classified according to their product type or functional group, defined here as: starches (grains and tubers), pulses (legumes), seeds/oils, fruits/vegetables, forage crops (for livestock) and value crops (low in useful calories but higher in income potential: tea, coffee, cotton, sugarcane, chillies etc.). In both Kenya and Nigeria, the occurrence of seeds/oil crops was very low (<3% farmers) and these crops were primarily sesame, so this category was combined into “value crops” for the purpose of the cluster analysis. Livestock were classified into large animals (ruminants, pigs, equines) and small animals (poultry, rabbits).
To classify farms on the basis of crop and livestock composition, we calculated the proportions of the cultivated land on which each crop was grown, and the proportions of TLUs belonging to either small or large animal species. In order to compare the relative importance of crops and livestock on each farm, the crop and livestock proportions were weighted so that 2 TLUs were equivalent to 1 hectare of cultivated land. 2 TLUs/ha is within the range of the ratios of livestock to cultivated land in the surveyed regions of both countries, lower than the Kenyan median of 2.9 TLUs/ha but higher than the Nigeria median of 0.5 TLUs/ha. This weighting provided an appropriate balance between the contributions of the four crop types and two livestock types in this study; if TLUs/ha was increased (making more animals equivalent to less cropland) then livestock had very little influence on the clustering, and if TLUs/ha was decreased then livestock had an over-large influence on the clustering. Assuming a balanced ratio of crops and livestock was appropriate in this study for testing the hypothesis that overall farm diversity is related to food security and livelihoods. However, the effect of adjusting these ratios could be explored in future analyses focused specifically on the role of livestock or incorporating additional data on their value. The formula for the weighted proportion of a given crop X was thus the proportion of cultivated land planted to the crop (left-hand part of the formula) multiplied by the proportional contribution of cultivated land to the sum of the cultivated land and livestock production asset (right-hand part of the formula):
And similarly the formula for the weighted proportion of either small or large TLUs was:
The same hierarchical clustering procedure, as described above for resource endowment groups, was used to classify farms into different farm composition (FC) types. Some clusters were manually combined where the clustering algorithm split two groups that were conceptually very similar. For example, if two groups were produced that were distinguished by different amounts of one crop type, yet both groups had more of that crop type than any other group, these two groups would be combined.
Chi-square tests were used to investigate whether there was an association between RE group and FC group within each country, in particular whether farms classified to a particular RE group were more or less likely to be allocated to a particular FC group. ANOVA with type III F-tests were used to investigate whether mean SR differed in response to the combination of RE and FC groups to which a farm belonged.
Food Security and Livelihoods
Food security and livelihoods for each household were characterized using the Food Insecurity Experience Scale (FIES) (Cafiero et al., 2018), the number of months that a household was food insecure, the household dietary diversity score (HDDS) (WFP, 2009) in the worst season, and farm income per person per year (Figure 1). Distributions of each variable are shown in Supplementary Figure S2. For each, a regression model was created for the effects of RE and FC groups, and richness of species farmed (SR). Generalized linear models with a binomial distribution and logit link function were used for bounded outcome variables (i.e., FIES from 0 to 8, HDDS from 0 to 10, and number of food insecure months from 0 to 12) with the response variable specified as counts of “successes” and “failures” (e.g., for HDDS, the number of dietary groups consumed, and the number of dietary groups not consumed). For farm income per person, a linear model with a Normal distribution was used, although income was log transformed to meet assumptions regarding homoscedasticity and Normality in the model residuals (a constant of 1 was added to all income values before transformation to allow inclusion of farms with zero values in the analysis).
For each outcome variable, the full model (all main effects and interactions of RE, FC and SR) was initially fitted. A backward stepwise selection procedure with an AIC selection criterion was then applied to identify an adequate reduced model, with terms dropped from the full model, following the principle of marginality, that most improved the AIC criterion at each step. The statistical significance of all terms remaining in the reduced models, as well as all terms in the full models, were tested using Type III F- or chi-squared tests, as appropriate. Results from both the reduced and full models are presented, as the reduced model enables the correct visual interpretation of the combined effects of the statistically significant terms, while the full models provide an assessment of the relative importance of non-significant terms.
The source of each household's dietary diversity was also explored in terms of the number of food groups produced on farm (farm-based), purchased, and from “free” sources (gathered, exchanged, or gifted). These separate HDDS scores were investigated using the same generalized linear model and variable selection approach as described above.
To assess the robustness of our models, we performed some additional tests. First, we assessed whether there were any correlations between SR and the variables used to create the RE groups, to assess whether any apparent effects of SR could have been driven by intra-cluster correlation between, e.g., land area per person and SR. These correlations are addressed in the results. We also visually assessed plots of model residuals to ensure the models adhered to assumptions of homoscedasticity and Normally-distributed residuals, and Cook's Distance was used to check for outliers exerting undue leverage on the regression (values >1 indicate a problematic point). No issues were detected for either residuals or outliers.
Results
Resource Endowment
Farms were classified into three resource endowment (RE) groups in each country: “low,” “med,” and “high” (Supplementary Figure S3). Average resource levels and distributions differed between countries (Table 1), with Nigerian farms typically larger, receiving more off-farm income, and using more fertilizer, while Kenyan farms had higher labor availability (particularly in the “low” group) and more livestock. In Kenya, more farms belonged to the “med” group, while in Nigeria farms were more likely to be in either the “low” or “high” groups (Figure 3).
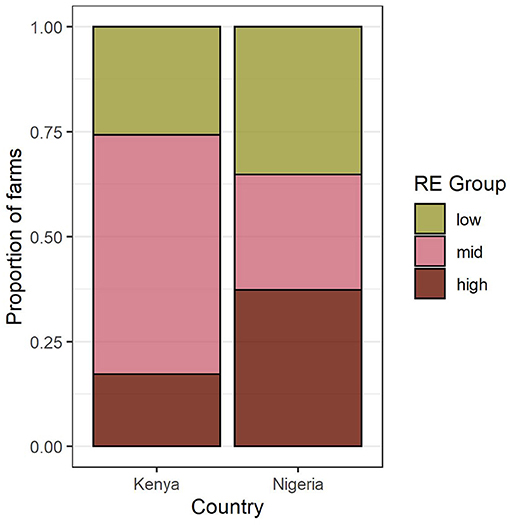
Figure 3. Proportion of farms in each country belonging to each resource endowment (RE) group identified by the cluster analysis.
Farm Composition
Four farm composition groups (FC) were identified for each of Kenya and Nigeria independently using hierarchical cluster analysis (Supplementary Figure S4). Groups were named according to the dominant product types. The two countries shared three similar FC groups, described as “cash cropping,” “diverse cropping,” and “mixed farming”, although the median composition in each of these groups did differ somewhat between countries: farms in Nigeria tended to have a greater focus on fewer crop types than in Kenya (Figure 5). In Kenya, an additional “livestock dominated” group was identified, and in Nigeria, where maize was dominant in all systems, an additional “starch-cropping” group was identified. In Kenya, the most common FC group was “mixed farming,” while in Nigeria it was “starch cropping” (Figure 4).
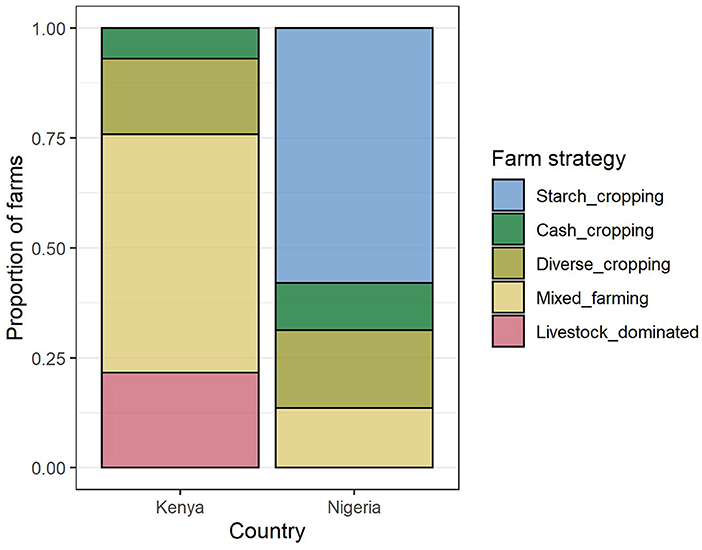
Figure 4. Proportion of farms in each country belonging to each farm FC group, as identified by the hierarchical cluster analysis.
Farms in the livestock dominated group were characterized by a much greater number of livestock compared to the area cultivated than other strategies, while farms in the starch cropping group had a large amount of land dedicated to grains and tubers, with few other crops grown and relatively few livestock raised (Figure 5). The cash cropping group comprised farms with a larger than usual proportion of “value” crops, while the diverse cropping and mixed farming strategies were distinguished by relatively lower and higher numbers of livestock, respectively.
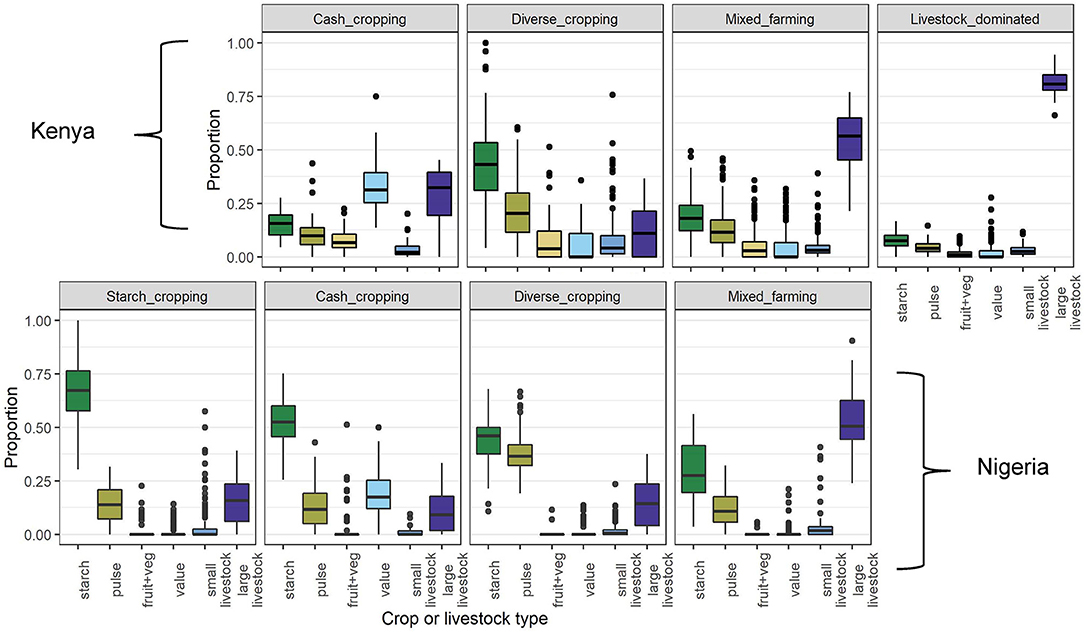
Figure 5. Crop and livestock compositions of each FC group identified in the hierarchical cluster analysis. The y axis shows the weighted proportion of each crop and livestock type, the variables that were used in the cluster analysis, defined such that two TLUs are equivalent to one hectare of cropped land (see Section Methods). Thick bars indicate medians, boxes show interquartile ranges, whiskers show points up to 1.5 times the interquartile range (above and below the quartiles) and points indicate individual observations outside of this range.
The RE group to which a farm belonged did not strongly influence which FC they were allocated to Table 2. A chi-square test for Nigeria indicated that similar proportions of each FC group were found in each RE group (x2 = 9.15, d.f. = 6, P-value = 0.165). For Kenya, a chi-square test suggest farming strategies were not evenly distributed among RE groups (x2 = 38.01, d.f. = 6, P-value ≤ 0.001), but Table 2 indicates that this is largely driven by the “med” RE group having relatively fewer livestock dominated farms and more mixed farming farms compared to both the “low” and “high” RE groups.

Table 2. The proportion of farms within each FC (rows) for each RE group (columns), in each country.
Farmed Species Richness
Total species richness (SR) tended to vary more between countries than between FC and RE groups within each country, with a higher mean SR (and greater variance in SR) in Kenya than in Nigeria (Figure 6). Supplementary Figure S5 indicates that the main difference between the two countries was in fruit and vegetable richness, with only small contributions from differences in crop and livestock richness. Median fruit/vegetable richness was 9 in Kenya and 2 in Nigeria, while median crop richness was 6 and 4, respectively. Median livestock richness was 3 in Kenya and 2 in Nigeria.
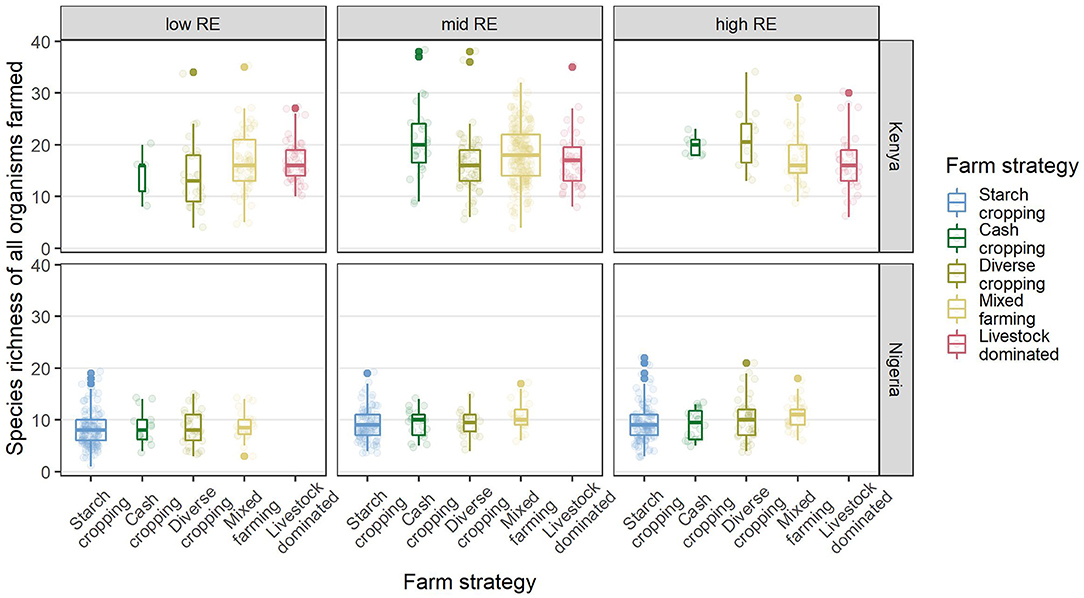
Figure 6. Total farm species richness in different FC (x axis) and RE (panel columns) groups in Kenya and Nigeria (panel rows). Solid lines indicate medians, boxes indicate interquartile ranges, whiskers indicate points up to 1.5× the interquartile range while dots indicate outliers beyond that. Pale dots show the raw data (each point represents a farm).
Small differences in the mean farm species richness were observed between RE and FC groups in Kenya (Table 3), with typically higher diversity in the mid and high RE groups and in the cash-cropping and diverse cropping FC groups (Table 4). This pattern in Kenya was driven more by differences in fruit and vegetable species richness, and in crop richness, than by livestock richness (Supplementary Figure S5). In Nigeria, mean farm species richness only differed significantly among RE groups (Table 3), with the lowest richness in the low RE group. There was also substantial overlap in range among all groups in each country, indicating some equivalence in the opportunity space for system diversification across RE groups (Figure 6). In Kenya, the mixed farming and livestock dominated groups were, on average, more diverse than the cash cropping and diverse cropping groups in the low RE group, with the reverse pattern in the high RE group.
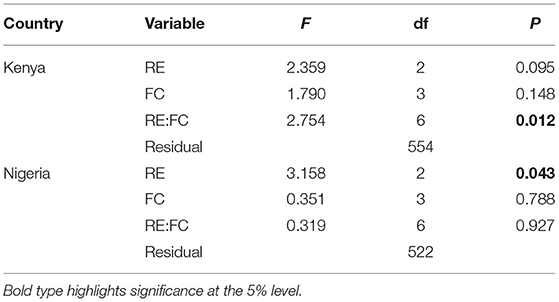
Table 3. Analysis of the impacts of the RE and FC classifications on SR in each country, with F-test statistics for Type III tests from ANOVA for marginal contributions respecting the marginality of model terms.

Table 4. Mean total farmed species richness (and standard errors in parentheses) of farms in each RE × FC combination in each country.
Food Security and Farm Income
The fitted models for each of the four food security and livelihood variables, modeled separately for the data for Kenya and Nigeria, are summarized in Table 5 (for the reduced models) and Supplementary Table S2 (for the full models). Model terms only involving RE and FC are concerned with how the mean response changes between the groups of farms defined by these characteristics, the combined (interaction) term indicating that the impact of FC on the mean response varied between the levels of RE (and vice versa). The main effect of SR indicates whether there was a consistent response to changes in this variable, with combined terms involving SR indicating that the effect of SR changes between the levels of RE or FC, or both, and the three-factor term indicating that the effect of SR changes in an inconsistent way across the combinations of RE and FC.
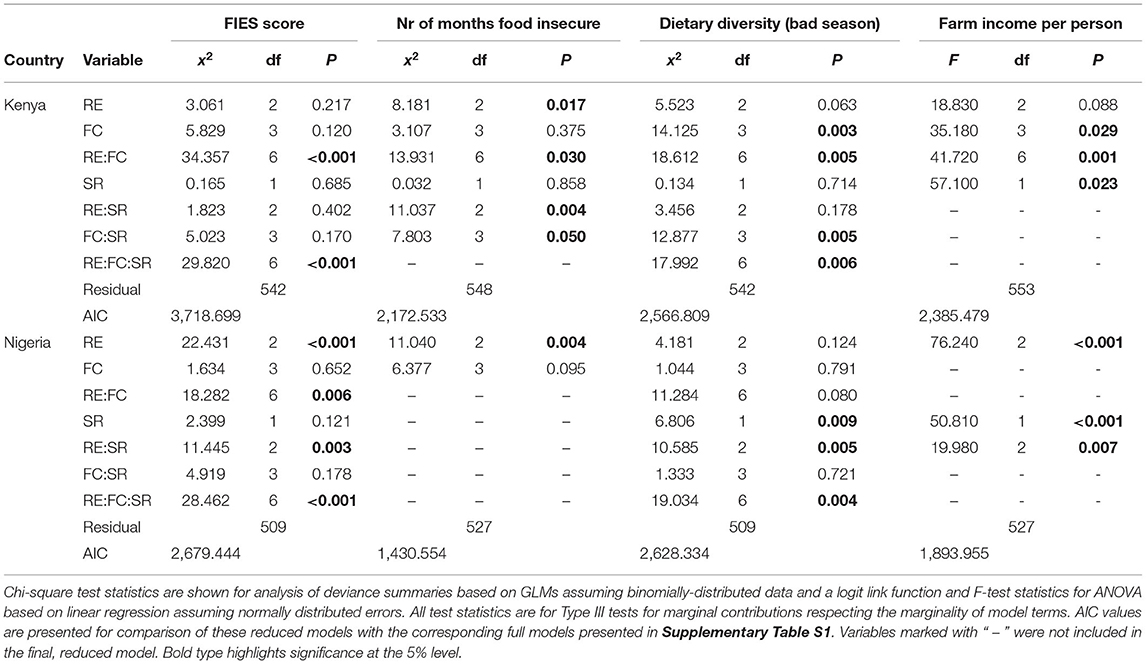
Table 5. Model fitting results showing the fitted effects of RE and FC groups and species richness for the four livelihood outcome indicators, for the final reduced models.
The four response variables in each country all have different forms of reduced models (Table 5). Figures 7, 8 show the fitted response patterns for each of the reduced models. In general, across both countries, higher RE was associated with lower food insecurity, more diverse diets, and higher incomes; however this relationship was modified by farm composition and farmed species richness, and their interactions. Farm composition tended not to have a strong overall effect, but did influence the effects of RE and SR for some response variables (Table 5), and in Kenya there appeared to be an association between FC and both dietary diversity and income, with cash cropping farms outperforming diverse cropping and mixed farming farms, and livestock dominated farms having the lowest values for these variables on average (Figure 7).
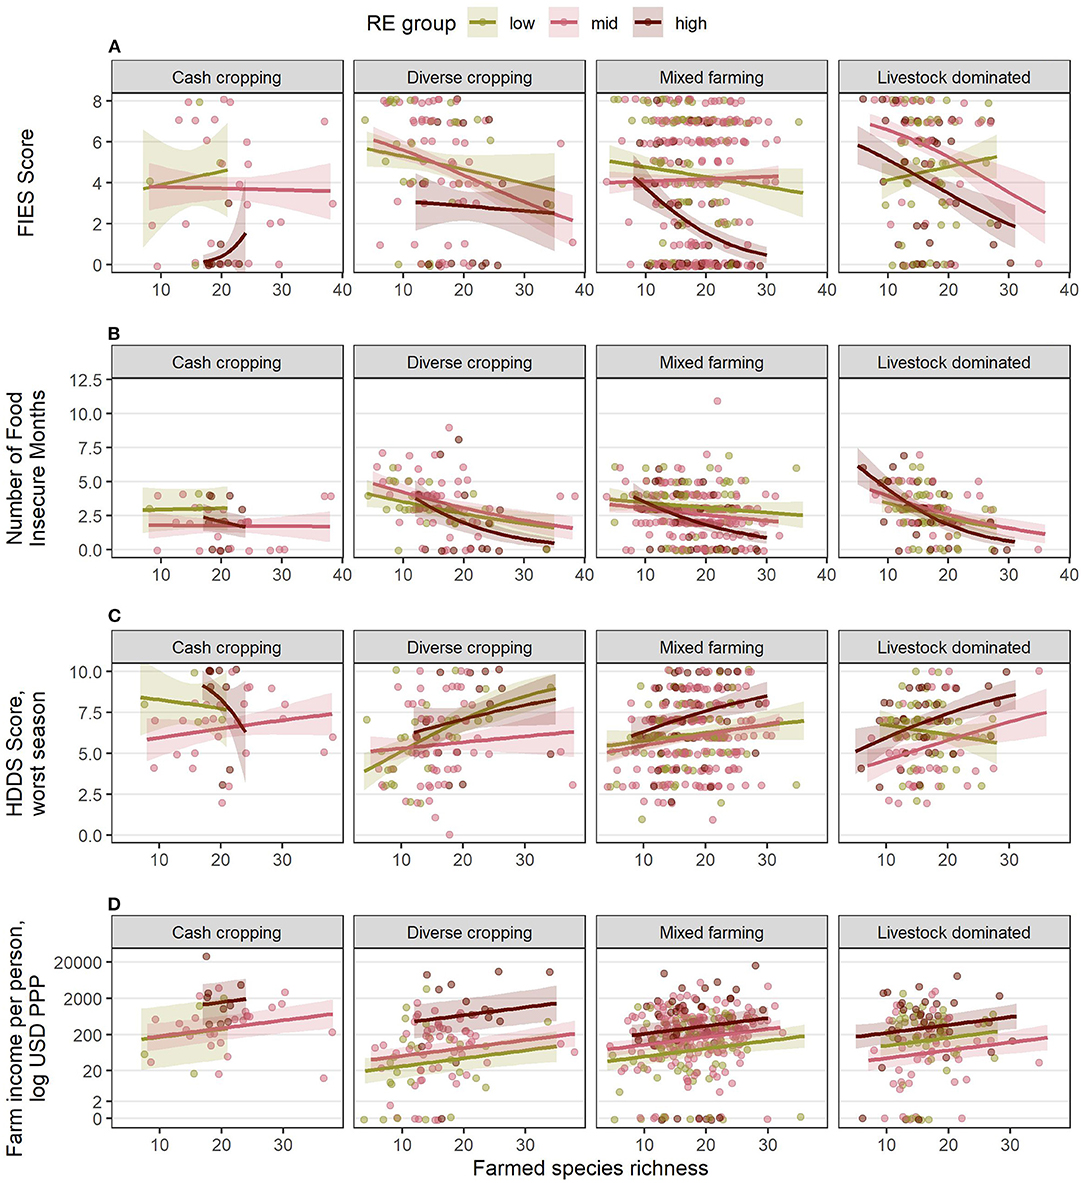
Figure 7. Estimated relationships between livelihood outcomes in Kenya and the combinations of RE groups, FC groups and species richness (SR) derived from the final, reduced models for (A) FIES score, (B) number of food insecure months, (C) HDDS in the worst season, and (D) farm income per person, USD PPP. Lines indicate the estimated mean response, while shaded ribbons indicate 95% confidence intervals for the mean response. Graphs include extrapolation of the estimated relationships beyond the observed ranges of farmed species richness, to enable comparison of the shapes of the responses for different combinations of RE and FC groups, but extrapolated estimates should be interpreted with caution. Estimated responses for (A–C) are back-transformed from the logit scale on which the models were fitted. Estimated responses for (D) are shown on the log-transformed scale used for analysis (although axis labels show values on the linear scale). Points show individual (raw) datapoints from the survey responses, jittered around the true value so points do not obscure one another.
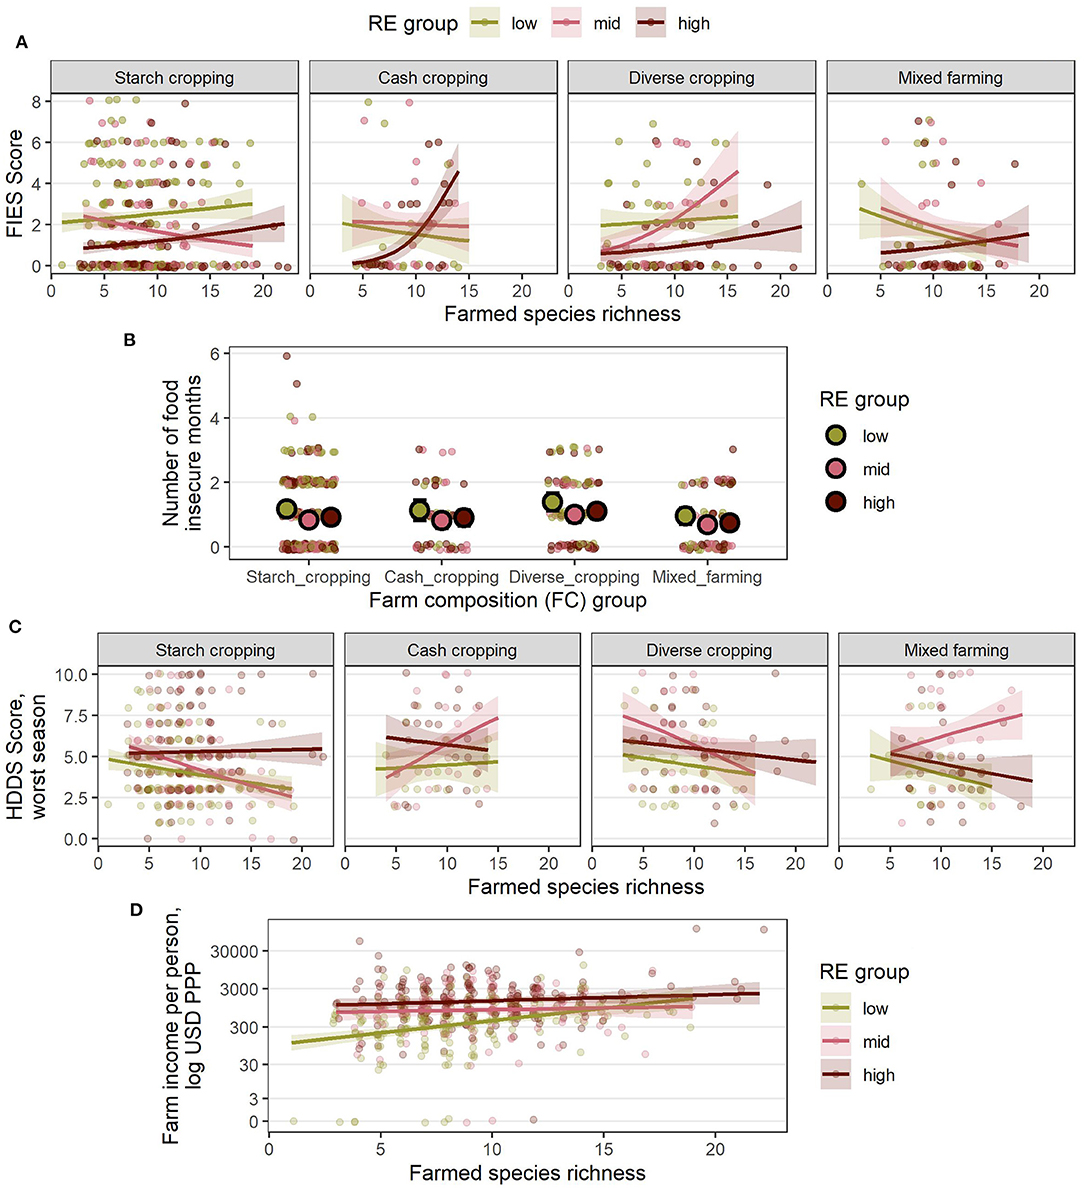
Figure 8. Estimated relationships between livelihood outcomes in Nigeria and the combinations of RE groups, FC groups and species richness (SR) derived from the final, reduced models (A) FIES score, (B) number of food insecure months, (C) HDDS in the worst season, and (D) farm income per person, USD PPP. For (A–D), lines indicate the estimated mean response, while shaded ribbons indicate 95% confidence intervals for the mean response. For (B), large points indicate group means for each RE and FC combination and error bars indicate 95% confidence intervals (SR was not included in the reduced model of food insecure months in Nigeria). Graphs include extrapolation of the estimated relationships beyond the observed ranges of farmed species richness, to enable comparison of the shapes of the responses for different combinations of RE and FC groups, but extrapolated estimates should be interpreted with caution. Estimated responses for (A–C) are back-transformed from the logit scale on which the models were fitted. Estimated responses for (D) are shown on the log-transformed scale used for analysis (although axis labels show values on the linear scale). Points show individual (raw) datapoints from the survey responses jittered around the true value so points do not obscure one another.
Increased species richness was associated with lower food insecurity (both FIES score and number of hungry months), higher dietary diversity and higher incomes within a given RE group. In Kenya (Figure 7), farms with a high species diversity in a low RE group could have better outcomes than those with a low species diversity in a high RE group. The main exception to this was for livestock dominated farms, where increased species richness was associated with a higher FIES score (higher insecurity) and lower dietary diversity—although the number of hungry months was still reduced, and incomes were higher. There were often too few datapoints within each RE group for cash cropping farms for the model fitting to give a clear idea of the effects of species richness in this farm composition type in Kenya.
In Nigeria (Figure 8), species richness had a consistently positive association with incomes, where again, on average, a low RE farm with high species diversity could outperform a high RE farm with low species diversity (Figure 8D). In contrast however, it appeared that higher SR was associated with increased food insecurity and reduced dietary diversity in most RE and FC groups, although the wider confidence intervals compared with Kenya suggest this conclusion should be drawn with caution. No association with species richness and the number of hungry months was observed in Nigeria.
A further analysis of the sources of dietary diversity (Table 6) showed that farmed species richness was associated with higher dietary diversity from on-farm food sources in both countries but had a stronger positive relationship with “other” food sources. In contrast, higher farmed species richness was associated with a decline in purchased dietary diversity. The estimated relationships between species richness and all three sources of dietary diversity are shown for each RE and FC group combination in Figure 9, to visualize the relative increases and decreases in each category that underpin the observed results for total HDDS in Figures 7D, 8D.
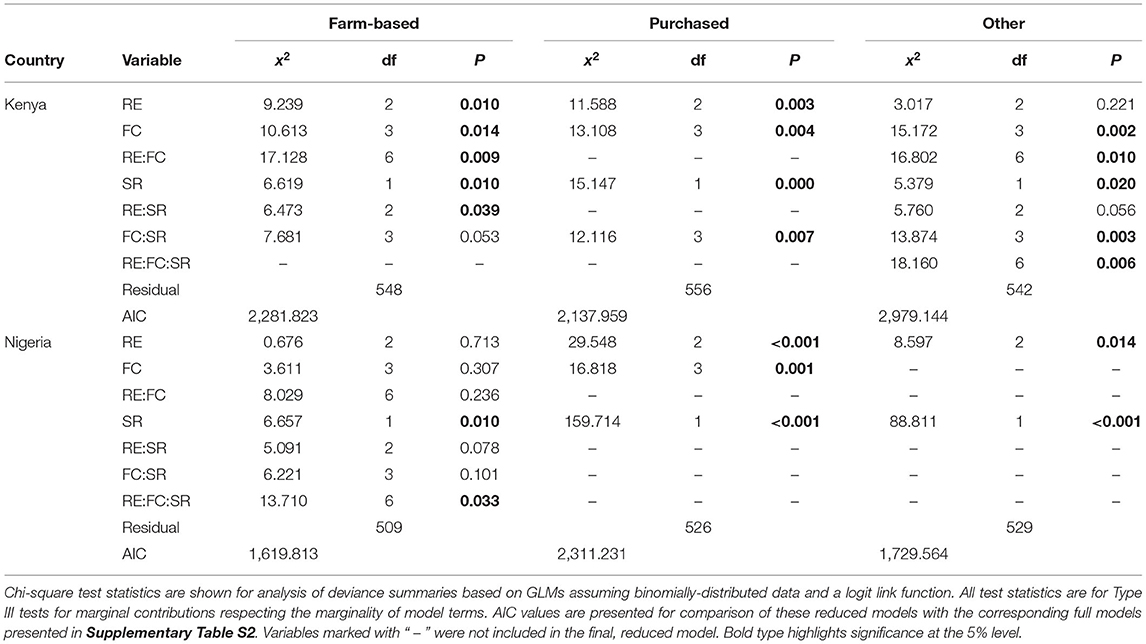
Table 6. Model fitting results showing the fitted effects of RE and FC groups and species richness for the three dietary diversity sources (purchased, farm-based and “other”), for the final reduced models.
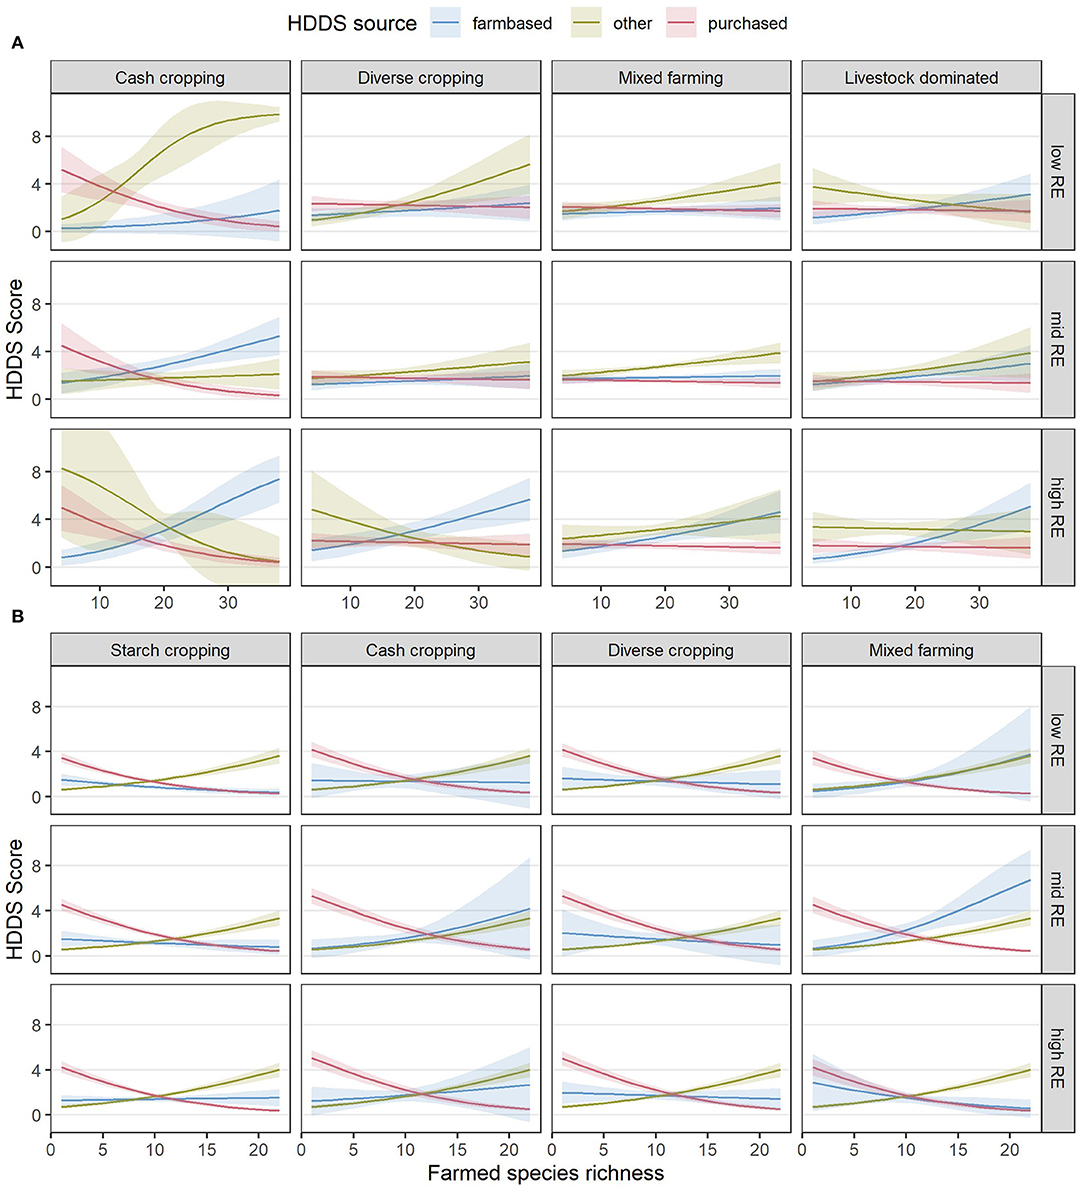
Figure 9. Estimated relationships between diet diversity scores from different sources in Kenya (A) and Nigeria (B) and the combinations of RE groups, FC groups and species richness (SR) derived from the final, reduced models. Lines indicate the estimated mean response, while shaded ribbons indicate 95% confidence intervals for the mean response. Graphs include extrapolation of the estimated relationships beyond the observed ranges of farmed species richness, to enable comparison of the shapes of the responses for different combinations of RE and FC groups, but extrapolated estimates should be interpreted with caution. Estimates are back-transformed from the logit scale on which the models were fitted. Raw datapoints are not shown as there would be three per response (one for each source) leading to an uninterpretable plot; however the distribution of total HDDS can be seen in Figures 6C, 7C.
No strong correlations between SR and variables used to create the RE clusters were found, indicating that these observed associations between outcomes and SR are not related to variability in resources within clusters. This indicates that our sampling approach (selecting randomly from lists of villages in each randomly selected ward, then including a small, medium, and large farm in each village to establish a gradient of RE) avoided structural bias that may have impacted the interpretation of the results. Most correlation coefficients were very low (between −0.2 and 0.2; Supplementary Table S3), demonstrating that no consistent patterns in RE variables could explain the observed effects of SR across all RE groups. However, somewhat larger correlations occurred between livestock holdings and SR in the low and mid RE groups in Nigeria (R > 0.4), so for these groups it could be questioned whether improved outcomes were in fact due to increased livestock holdings and not increased SR. In these groups, may be difficult to increase SR without also increasing livestock holdings, given the very low endowments observed for this group of <1 TLU per person and <1 ha cropland per person (Table 1).
Discussion
Relationships Between RE, FC, and SR
The findings of our study indicate that although RE imposes a constraint on household food security and incomes, there may be potential for farmers to improve these outcomes through their choices of farm strategy, as characterized by FC and SR. The farmers in our study spanned a wide range of RE, from very small farms with substantially fewer productivity assets than one hectare and one TLU per person, as well as very low off-farm incomes, to farms with much larger areas of cultivated land and/or livestock herds per person, and much higher off-farm incomes (Table 1; Supplementary Figure S1). Low to intermediately resourced households tended to use higher rates of labor and fertilizer per cultivated hectare, a pattern also observed in western Kenya by Tittonell et al. (2005), suggesting more pressure to make the most of their available resources to achieve food security and adequate incomes.
There was little evidence in our study that RE influenced farm strategy choices in terms of either FC or SR. Similar proportions of farms in all RE groups were classified into each FC group (Table 2), and we observed greater within-group, rather than between-group, variation in SR across all combinations of RE and FC groups (Figure 5). This contrasts with other studies that found either that low RE limited farm capacity for species diversity (Wiggins et al., 2011; Snapp and Fisher, 2015; Kuivanen et al., 2016; Mellisse et al., 2018), or that higher RE facilitated specialization in fewer species (Kindt et al., 2004). We did find differences in FC groups and in both the mean and variance of SR between western Kenya and northern Nigeria. These differences were potentially a response to environmental constraints such as climate and the soil types on which crop and livestock species can be raised productively in a given region (Waha et al., 2018), although cultural preferences may also have played a role. However, within in each country, most FC groups were found in most regions (counties in Kenya and LGAs in Nigeria), and the distributions of SR values did not vary substantially between regions within country (Supplementary Figure S6). This suggests that even where local conditions influence which species are grown, farmers can substitute in locally adapted species (e.g., different types of “starch” or “value” crops) to fulfill their preferred farm strategy. Thus, our results suggest that opportunity exists across different levels of RE and different environmental conditions for farmers to intensify production through optimizing their crop and livestock choices.
Relationships Between RE, FC, SR, and Food Security and Livelihood Outcomes
Our results suggest that different combinations of RE, FC, and SR may result in different outcomes for food security and farm incomes (Figures 7, 8). In general, farms from a higher RE group had better outcomes than farms from a lower RE group, in agreement with previous studies suggesting that higher RE entails not only a greater production base, but also a greater capacity to optimize the productivity of land and livestock held (Tittonell et al., 2005, 2010; Kuivanen et al., 2016). However, a key finding of our study is that increasing SR was associated with improvements to most outcomes across all RE groups, and, critically, our results show that it is possible for farms with lower RE but higher SR to achieve similar levels of food security, dietary diversity, and incomes as farms with lower SR but higher RE. Although further research is required to confirm causality, our results indicate an important potential for farmed species diversity to contribute to improving food security and incomes for smallholder farms. In particular, SR had a consistent association with increased farm incomes across all RE and FC groups in both countries (Figures 7D, 8D). In Kenya, high-SR low-RE farms also usually matched or outperformed low-SR high-RE farms for food security indicators across most FC groups (Figure 7).
FC group itself also influenced outcomes, although less consistently than changes in SR. In Kenya, the cash cropping and diverse cropping groups generally had a higher dietary diversity and farm income than the livestock-dominated group, and to some extent also the mixed farming group, for a given level of RE and SR. The effects of RE and SR were also often modified by the choice of FC group (indicated by significant interactions in Table 5): most notably, increasing SR in the low-RE livestock-dominated group in Kenya was associated with negative rather than positive outcomes, including a higher FIES score and a reduced dietary diversity score.
Positive effects of SR have been observed in many other studies. For example, crop diversity was found to be positively associated with on-farm-consumption of food crops as well as cash income from crops sold, in both northern Ghana (Bellon et al., 2020) and Uganda (Sekabira and Nalunga, 2020). Waha et al. (2018) found increased food security and food availability among households with a greater crop diversity across 18 African countries, and in western Kenya, Oduor et al. (2019) observed improvements to child nutrition as species diversity increased, while Boedecker et al. (2019) found that diversifying farm activities to include poultry-raising and homegardens improved dietary diversity. Alongside our results, these studies indicate that increasing farmed species diversity opens market opportunities for households, while also contributing to on-farm-consumption. This suggests that crop diversification could be more beneficial than specialization to smallholder farmers.
Other studies have suggested that the benefits of further diversification diminish above a certain level of diversity, and that other factors, such as market access, then become more important in generating further improvements to food security and livelihoods (Koppmair et al., 2017; Waha et al., 2018). In contrast, we observed continuing benefits across the observed range of SR for most of our outcomes in most combinations of RE and FC groups. We also observed smaller benefits of increased SR in northern Nigeria than in western Kenya, and farms in northern Nigeria typically had lower farmed species diversity than those in western Kenya—suggesting that already being at the higher end of the range of SR may have contributed to the stronger positive associations between SR and outcomes observed in western Kenya. These higher values of SR observed in western Kenya were largely driven by a greater number of fruit and vegetable species grown than in northern Nigeria (Supplementary Figure S5), suggesting that some benefits of increased SR may derive from the growing of diverse species in addition to the main crop and livestock activities, such as in diverse homegardens or integration of fruit trees in agroforestry layouts. This effect may not be captured by studies focusing only on crop and livestock diversity, rather than total farmed species richness, such as Waha et al. (2018). Kindt et al. (2004) and Degrande et al. (2006) both show that tree crops in particular can contribute to increased on-farm food consumption and incomes, while Boedecker et al. (2019) found that homegardens contributed positively to improved dietary diversity.
There were two important exceptions to the generally positive associations between increased SR and outcomes observed in our study. Firstly, increased SR was associated with increased food insecurity and reduced dietary diversity in livestock-dominated farms with low RE in Kenya, suggesting that it may be more beneficial for this group of farmers to focus on fewer species than to diversify. In general in Kenya, livestock-dominated farms, and to some extent mixed farms, tended to have poorer outcomes on average than diverse cropping and cash cropping farms (Figure 7). This observed negative effect of higher livestock holdings on outcomes, either directly or indirectly via modifying the effect of SR, is surprising given that many other studies indicate that higher livestock levels have a generally positive role in smallholder farms (Moll, 2005), including in western Kenya (Fuchs et al., 2019). Our result may reflect the “one-off” nature of our survey; perhaps it was undertaken during a period of relatively high crop product prices, favoring crop producers over livestock farmers, for example. The influence of current conditions on respondents' recall of food security and earnings is a known limitation of household surveys (Bell et al., 2016). Thus, we would urge caution in making strong inferences from the apparent negative effect of increasing livestock levels in our study, given its inconsistency with other literature.
The second case in which we observed SR to have a negative association with outcomes was with regard to HDDS across many RE and FC groups in Nigeria (Figure 8C). It is possible that dietary group richness is not directly related to farmed species richness, as multiple species belong to the same dietary group and so farmed species richness can be increased without then increasing the number of dietary groups. However, a closer investigation into the different sources of dietary diversity suggested a more complex relationship between SR and HDDS (Figure 9). Across both countries in our study, although more so in Nigeria, farm-based and “other” dietary diversity tended to increase with increased SR while purchased dietary diversity decreased. In Nigeria, the decrease in purchased dietary diversity outweighed increases in farm-based and “other” dietary diversity, resulting in an overall decline in HDDS as SR increased.
Previous studies have indicated that the relationship between farmed species diversity and dietary diversity varies with the importance of markets and the availability of wild foods (Ickowitz et al., 2019). In our study, “other” dietary diversity is predominantly made up of gathered, gifted, or exchanged foods, so the increase in “other” dietary diversity with increasing SR suggests that households with a higher SR may be embedded in more diverse neighborhoods where more food sources are available outside the formal economy. It is possible that such diverse, food-gathering and food-exchanging neighborhoods could exist as a result of poor market access motivating both an increase in SR for self-sufficiency and an increase in wild food gathering or informal food exchanges. Other studies have observed greater benefits of increased SR (Kissoly et al., 2020) as well as an increased reliance on forest resources (Degrande et al., 2006) when market access is lower. Despite the plausibility of this explanation, however, it seems unlikely to be the case in our study, given that both “other” dietary diversity and farm incomes per capita (a function of market access) increased with increasing SR, across all combinations of RE and FC groups in both countries. It remains unclear why farmers in Nigeria with a higher SR would purchase sufficiently fewer different food groups so that their overall dietary diversity drops below that of farmers with a low SR.
Implications and Future Research
Our study presents evidence that farms with high SR but low RE can achieve the same or better food security and income outcomes than farms with low SR and high RE, suggesting diversification could be a promising component of intensification for smallholders. These findings question the widespread perception that low-resourced smallholder farming systems are inherently inefficient and that Green Revolution technologies (i.e., crop breeding and accessible agrochemical inputs) are the best route toward improving both agricultural production and rural livelihoods (Pingali, 2012). Although accredited with widespread increases in calorie availability, the yield gains of the Green Revolution have been associated with the homogenization and up-scaling of farming systems, with increased costs to the environment (pollution, declining biodiversity and soil erosion) as well as threats to agriculture itself though declines in the nutritional value of staple crops (Fan et al., 2008; Gashu et al., 2021), the evolution of pesticide resistance (Hawkins et al., 2019), and declining soil health (Kopittke et al., 2019). In contrast, farming systems intensified via increasing crop and livestock richness, in combination with diverse homegardens and agroforestry, could mitigate these negative trends of homogenization whilst also offering substantial improvements to food security and nutrition.
However, further research is required to identify whether the relationship observed between SR and food security and incomes is truly causal, as other studies have found that increased SR may be as much a reflection of overall better farming capacity than a cause of increased productivity in its own right. For example, Mwololo et al. (2019) observed that crop diversity increases with access to agricultural extension services, so observed increases in food security and incomes may be due to an overall improvement in agronomic practices, while Nyberg et al. (2020) suggest that increased labor per hectare leads to higher crop diversity, and thus benefits may arise from this combination of increased labor intensity and increased crop diversity. Mechanisms by which increasing SR can improve food security and livelihood outcomes have been demonstrated, such as a higher SR increasing the diversity of foods available (Jones, 2017) and increasing productivity via nutrient complementarity and weed, pest and disease suppression (Isbell et al., 2017; Storkey et al., 2019). However, it is not certain that these mechanisms and anticipated benefits will occur in any given situation—for example, we note the negative impact of increased farmed species diversity on two outcomes for the low-RE livestock-dominated farms in western Kenya, and the negative relationship observed with purchased dietary diversity in northern Nigeria.
The substantial variation in outcomes observed in our study (Figures 7, 8) indicates that additional variables must also moderate the relationship between SR and food security and incomes. Increasing SR may be just one of many farm practices that could improve food security and incomes within a given set of resource constraints. In addition, our investigation of dietary diversity sources suggests that the context around the farm—in terms of land-use and species diversity at the landscape or neighborhood level—may affect both the within-farm SR and the dietary diversity outcomes. Future research could address these knowledge gaps through taking a landscape-scale perspective of FC and SR, and/or through considering a wider range of explanatory variables, measuring factors such as access to markets, extension services, wild food resources, and community support networks, than we have in this survey.
The benefits of smallholder farm diversification must also be considered in a wider political and socioeconomic context, and our results here do not diminish the need for other actions to be taken to challenge food insecurity and poverty. Other authors have observed that although diverse farms can be much more productive, there is still a limit to the number of people that can be fed from a given land area (Conelly and Chaiken, 2000; Giller, 2020). Initiatives to improve land tenure and land availability, and to diversify rural economies, are therefore also important to increase food security, livelihoods, and wellbeing amongst rural communities.
Further insight into the roles of farm strategies in food security and livelihoods could be gained by performing similar analyses to those used in this study across a greater number and diversity of regions and countries across Africa and around the world. As noted previously, some differences in the observed effects of farm diversity between studies may relate to whether they consider just those plants and animals deemed to be “farmed crops and livestock” or whether they also include additional cultivated diversity such as fruits and vegetables in homegardens or as scattered trees. Here, our use of the RHoMIS platform can facilitate further research, given that other studies using the platform and contributing to the open database have collected data on crop, livestock and fruit and vegetable richness in the same way, as well as collecting the same indicators of resource endowment, food security and farm incomes. In our study, we did modify the data collected on areas cultivated under different crops in order to develop our FC classifications, so the FC groups would not be directly transferable to other RHoMIS datasets. However, we anticipate that key aspects of FC groups—for example the relative importance of livestock and of “value” crops—can be derived from the standard questionnaire. In addition, information is collected on whether farms have homegardens and practice agroforestry, and whether they use various synthetic and organic inputs and different soil and water conservation practices, so our typology of farms via RE and FC could be expanded to include other farm characteristics. The wider RHoMIS dataset therefore offers a rich resource to address many of the questions raised in this study about the role of different types of farmed species richness in improving food security and incomes, with regards to other agronomic practices and in the context of different levels of resource endowment.
Data Availability Statement
An anonymised version of the raw data supporting the conclusions of this article will be made available by the authors, without undue reservation. Harmonised data from the core RHoMIS modules are also available within a larger open access RHoMIS dataset: RHoMIS (2021). “The Rural Household Multiple Indicator Survey (RHoMIS) data of 35,713 farm households in 32 countries”, https://doi.org/10.7910/DVN/TFXQJN, Harvard Dataverse, V1, UNF:6:MuVv2zcmgeKv9w2G0072lA== [fileUNF].
Author Contributions
All authors contributed to conceptualization and design of this study. AM designed the sampling framework with input from WW, KTA and CM, and WW and KTA led the surveys. CM completed the data analysis with input from AM and KTA. CM drafted the manuscript. All authors contributed to the article and approved the submitted version.
Funding
This research was undertaken as part of GLTEN-Africa: Cropping System Diversity, a Cornerstone of Sustainable Intensification (BB/R020663/1) funded through the Global Research Challenge Fund (GCRF) Program of the Biotechnology and Biological Sciences Research Council (BBSRC).
Conflict of Interest
The authors declare that the research was conducted in the absence of any commercial or financial relationships that could be construed as a potential conflict of interest.
Publisher's Note
All claims expressed in this article are solely those of the authors and do not necessarily represent those of their affiliated organizations, or those of the publisher, the editors and the reviewers. Any product that may be evaluated in this article, or claim that may be made by its manufacturer, is not guaranteed or endorsed by the publisher.
Acknowledgments
We would like to thank all enumerators and other team members who assisted with undertaking the surveys, as well as RHoMIS staff who assisted with survey modifications and data management. Thanks also to Tunrayo Alabi for assisting with GIS during the sample selection, and to Jim Hammond for advice on earlier versions of this manuscript.
Supplementary Material
The Supplementary Material for this article can be found online at: https://www.frontiersin.org/articles/10.3389/fsufs.2022.744700/full#supplementary-material
References
Alvarez, S., Timler, C. J., Michalscheck, M., Paas, W., Descheemaeker, K., Tittonell, P., et al. (2018). Capturing farm diversity with hypothesis-based typologies: an innovative methodological framework for farming system typology development. PLoS ONE 13, e0194757. doi: 10.1371/journal.pone.0194757
Auricht, C., Dixon, J., Boffa, J.-M., and Garrity, D. (2014). “ATLAS farming systems of Africa,” in Atlas of African Agriculture Research and Development, eds. Sebastian K. (Washington DC: International Food Policy and Research Institute), 13–32. Available online at: https://ebrary.ifpri.org/digital/collection/p15738coll2/id/128741
Bell, A. R., Ward, P. S., Killilea, M. E., and Tamal, M. E. H. (2016). Real-time social data collection in rural Bangladesh via a “microtasks for micropayments” platform on android smartphones. PLoS ONE 11, 1–14. doi: 10.1371/journal.pone.0165924
Bellon, M. R., Kotu, B. H., Azzarri, C., and Caracciolo, F. (2020). To diversify or not to diversify, that is the question. Pursuing agricultural development for smallholder farmers in marginal areas of Ghana. World Dev. 125, 104682. doi: 10.1016/j.worlddev.2019.104682
Boedecker, J., Kennedy, G., Lachat, C., Damme, P., Van Kennedy, G., and Termote, C. (2019). Participatory farm diversification and nutrition education increase dietary diversity in Western Kenya. Matern. Child Nutr. 15, e12803. doi: 10.1111/mcn.12803
Cafiero, C., Viviani, S., and Nord, M. (2018). Food security measurement in a global context: the food insecurity experience scale. Meas. J. Int. Meas. Confed. 116, 146–152. doi: 10.1016/j.measurement.2017.10.065
Cecchi, G., Wint, W., Shaw, A., Marletta, A., Mattioli, R., and Robinson, T. (2010). Geographic distribution and environmental characterization of livestock production systems in Eastern Africa. Agric. Ecosyst. Environ. 135, 98–110. doi: 10.1016/j.agee.2009.08.011
Conelly, W. T., and Chaiken, M. S. (2000). Intensive farming, agro-diversity, and food security under conditions of extreme population pressure in western Kenya. Hum. Ecol. 28, 19–51. doi: 10.1023/A:1007075621007
Degrande, A., Schreckenberg, K., Mbosso, C., Anegbeh, P., Okafor, V., and Kanmegne, J. (2006). Farmer's fruit tree-growing strategies in the humid forest zone of Cameroon and Nigeria. Agrofor. Syst. 67, 159–175. doi: 10.1007/s10457-005-2649-0
Dixon, J., Gulliver, A., and Gibbon, D. (2001). Farming Systems and Poverty: Improving Farmers' Livelihoods in a Changing World. Rome and Washington DC: FAO and World Bank.
Fan, M. S., Zhao, F. J., Fairweather-Tait, S. J., Poulton, P. R., Dunham, S. J., and McGrath, S. P. (2008). Evidence of decreasing mineral density in wheat grain over the last 160 years. J. Trace Elem. Med. Biol. 22, 315–324. doi: 10.1016/j.jtemb,.2008.07.002
FAO IFAD, UNICEF, WFP, and WHO.. (2020). The State of Food Security and Nutrition in the World 2020. Rome: Transforming Food Systems for Affordable Healthy Diets, FAO.
Foley, J. A., Ramankutty, N., Brauman, K. A., Cassidy, E. S., Gerber, J. S., Johnston, M., et al. (2011). Solutions for a cultivated planet. Nature 478, 337–342. doi: 10.1038/nature10452
Franke, A. C., van den Brand, G. J., Vanlauwe, B., and Giller, K. E. (2018). Sustainable intensification through rotations with grain legumes in Sub-Saharan Africa: a review. Agric. Ecosyst. Environ. 261, 172–185. doi: 10.1016/j.agee.2017.09.029
Fuchs, L. E., Orero, L., Namoi, N., and Neufeldt, H. (2019). How to effectively enhance sustainable livelihoods in smallholder systems: a comparative study from Western Kenya. Sustainability 11, 1564. doi: 10.3390/su11061564
Garibaldi, L. A., and Pérez-Méndez, N. (2019). Positive outcomes between crop diversity and agricultural employment worldwide. Ecol. Econ. 164, 106358. doi: 10.1016/j.ecolecon.2019.106358
Gashu, D., Nalivata, P. C., Amede, T., Ander, E. L., Bailey, E. H., Botoman, L., et al. (2021). The nutritional quality of cereals varies geospatially in Ethiopia and Malawi. Nature. 594, 71–76. doi: 10.1038/s41586-021-03559-3
Giller, K. E.. (2020). The food security conundrum of sub-Saharan Africa. Glob. Food Sec. 26, 100431. doi: 10.1016/j.gfs.2020.100431
Hammond, J., Fraval, S., van Etten, J., Suchini, J. G., Mercado, L., Pagella, T., et al. (2017). The rural household multi-indicator survey (RHoMIS) for rapid characterisation of households to inform climate smart agriculture interventions: description and applications in East Africa and Central America. Agric. Syst. 151, 225–233. doi: 10.1016/j.agsy.2016.05.003
Hammond, J., Rosenblum, N., Breseman, D., Gorman, L., Manners, R., Wijk, M. T., et al. (2020). Towards actionable farm typologies: scaling adoption of agricultural inputs in Rwanda. Agric. Syst. 183, 102857. doi: 10.1016/j.agsy.2020.102857
Hawkins, N. J., Bass, C., Dixon, A., and Neve, P. (2019). The evolutionary origins of pesticide resistance. Biol. Rev. 94, 135–155. doi: 10.1111/brv.12440
Ickowitz, A., Powell, B., Rowland, D., Jones, A., and Sunderland, T. (2019). Agricultural intensification, dietary diversity, and markets in the global food security narrative. Glob. Food Sec. 20, 9–16. doi: 10.1016/j.gfs.2018.11.002
Isbell, F., Adler, P. R., Eisenhauer, N., Fornara, D., Kimmel, K., Kremen, C., et al. (2017). Benefits of increasing plant diversity in sustainable agroecosystems. J. Ecol. 105, 871–879. doi: 10.1111/1365-2745.12789
Jones, A. D.. (2017). Critical review of the emerging research evidence on agricultural biodiversity, diet diversity, and nutritional status in low- and middle-income countries. Nutr. Rev. 75, 769–782. doi: 10.1093/nutrit/nux040
Kamara, A. Y., Menkir, A., Chikoye, D., Tofa, A. I., Fagge, A. A., Dahiru, R., et al. (2020). Mitigating Striga hermonthica parasitism and damage in maize using soybean rotation, nitrogen application, and Striga-resistant varieties in the Nigerian savannas. Exp. Agric. 56, 620–632. doi: 10.1017/S0014479720000198
Kindt, R., Simons, A. J., and Van Damme, P. (2004). Do farm characteristics explain differences in tree species diversity among western Kenyan farms? Agrofor. Syst. 63, 63–74. doi: 10.1023/B:AGFO.0000049434.54654.97
Kissoly, L. D., Karki, S. K., and Grote, U. (2020). Diversity in farm production and household diets: comparing evidence from smallholders in Kenya and Tanzania. Front. Sustain. Food Syst. 4, 1–13. doi: 10.3389/fsufs.2020.00077
Kopittke, P. M., Menzies, N. W., Wang, P., McKenna, B. A., and Lombi, E. (2019). Soil and the intensification of agriculture for global food security. Environ. Int. 132, 105078. doi: 10.1016/j.envint.2019.105078
Koppmair, S., Kassie, M., and Qaim, M. (2017). Farm production, market access and dietary diversity in Malawi. Public Health Nutr. 20, 325–335. doi: 10.1017/S1368980016002135
Kuivanen, K. S., Alvarez, S., Michalscheck, M., Adjei-Nsiah, S., Descheemaeker, K., Mellon-Bedi, S., et al. (2016). Characterising the diversity of smallholder farming systems and their constraints and opportunities for innovation: a case study from the Northern Region, Ghana. NJAS Wageningen J. Life Sci. 78, 153–166. doi: 10.1016/j.njas.2016.04.003
Li, C., Hoffland, E., Kuyper, T. W., Yu, Y., Zhang, C., Li, H., et al. (2020). Syndromes of production in intercropping impact yield gains. Nat. Plants 6, 653–660. doi: 10.1038/s41477-020-0680-9
Linard, C., Gilbert, M., Snow, R. W., Noor, A. M., and Tatem, A. J. (2012). Population distribution, settlement patterns and accessibility across Africa in 2010. PLoS ONE 7, e31743. Available online at: https://www.worldpop.org
Manda, J., Azzarri, C., Feleke, S., Kotu, B., Claessens, L., and Bekunda, M. (2021). Welfare impacts of smallholder farmers' participation in multiple output markets: empirical evidence from Tanzania. PLoS ONE 16, 1–20. doi: 10.1371/journal.pone.0250848
Massawe, F., Mayes, S., and Cheng, A. (2016). Crop diversity: an unexploited treasure trove for food security. Trends Plant Sci. 21, 365–368. doi: 10.1016/j.tplants.2016.02.006
Mellisse, B. T., van de Ven, G. W. J., Giller, K. E., and Descheemaeker, K. (2018). Home garden system dynamics in Southern Ethiopia. Agrofor. Syst. 92, 1579–1595. doi: 10.1007/s10457-017-0106-5
Moll, H. A. J.. (2005). Costs and benefits of livestock systems and the role of market and nonmarket relationships. Agric. Econ. 32, 181–193. doi: 10.1111/j.0169-5150.2005.00210.x
Muthini, D., Nzuma, J., and Nyikal, R. (2020). Farm production diversity and its association with dietary diversity in Kenya. Food Secur. 12, 1107–1120. doi: 10.1007/s12571-020-01030-1
Mwololo, H. M., Nzuma, J. M., Ritho, C. N., and Aseta, A. (2019). Is the type of agricultural extension services a determinant of farm diversity? Evidence from Kenya. Dev Stud Res. 6, 40–46. doi: 10.1080/21665095.2019.1580596
Ng'endo, M., Bhagwat, S., and Keding, G. B. (2016). Influence of seasonal on-farm diversity on dietary diversity: a case study of smallholder farming households in Western Kenya. Ecol. Food Nutr. 55, 403–427. doi: 10.1080/03670244.2016.1200037
Nyberg, Y., Wetterlind, J., Jonsson, M., and Öborn, I. (2020). The role of trees and livestock in ecosystem service provision and farm priorities on smallholder farms in the Rift Valley, Kenya. Agric. Syst. 181, 102815. doi: 10.1016/j.agsy.2020.102815
Oduor, F. O., Boedecker, J., Kennedy, G., and Termote, C. (2019). Exploring agrobiodiversity for nutrition: household on-farm agrobiodiversity is associated with improved quality of diet of young children in Vihiga, Kenya. PLoS ONE 14, 1–15. doi: 10.1371/journal.pone.0219680
Oksanen, J., Blanchet, F. G., Friendly, M., Kindt, R., Legendre, P., and McGlinn, D.. (2020). Vegan: Community Ecology Package. R package version 2.5-7. Available online at: https://CRAN.R-project.org/package=vegan
Open Street Map Contributors. (2015). Planet dump. Open Street Map. Available online at: https://planet.openstreetmap.org (accessed August 06, 2021).
Pingali, P. L.. (2012). Green revolution: impacts, limits, andthe path ahead. Proc. Natl. Acad. Sci. USA. 109, 12302–12308. doi: 10.1073/pnas,.0912953109
R Core Team. (2020). R: A Language and Environment for Statistical Computing. R Foundation for Statistical Computing, Vienna, Austria. Available online at: https://www.R-project.org/
Robinson, T. P., William Wint, G. R., Conchedda, G., Van Boeckel, T. P., Ercoli, V., Palamara, E., et al. (2014). Mapping the global distribution of livestock. PLoS ONE 9, e0096084. doi: 10.1371/journal.pone.0096084
Sekabira, H., and Nalunga, S. (2020). Farm production diversity: Is it important for dietary diversity? Panel data evidence from Uganda. Sustainability. 12, 1028. doi: 10.3390/su12031028
Sibhatu, K. T., and Qaim, M. (2018). Review: the association between production diversity, diets, and nutrition in smallholder farm households. Food Policy 77, 1–18. doi: 10.1016/j.foodpol.2018.04.013
Snapp, S. S., and Fisher, M. (2015). “Filling the maize basket” supports crop diversity and quality of household diet in Malawi. Food Secur. 7, 83–96. doi: 10.1007/s12571-014-0410-0
Springmann, M., Clark, M., Mason-D'Croz, D., Wiebe, K., Bodirsky, B. L., Lassaletta, L., et al. (2018). Options for keeping the food system within environmental limits. Nature 562, 519–525. doi: 10.1038/s41586-018-0594-0
Steward, P. R., Thierfelder, C., Dougill, A. J., and Ligowe, I. (2018). Conservation agriculture enhances resistance of maize to climate stress in a Malawian medium-term trial. Agric. Ecosyst. Environ. 277, 95–104. doi: 10.1016/j.agee.2018.07.009
Storkey, J., Bruce, T., McMillan, V., and Neve, P. (2019). “The future of sustainable crop protection relies on increased diversity of cropping systems and landscapes,” in Agroecosystem Diversity, eds. Lemaire G., Carvalho P. C., de Kronberg F. S., Recous S (Cambridge, MA: Academic Press), 199–209.
Tittonell, P., Muriuki, A., Shepherd, K. D., Mugendi, D., Kaizzi, K. C., Okeyo, J., et al. (2010). The diversity of rural livelihoods and their influence on soil fertility in agricultural systems of East Africa - a typology of smallholder farms. Agric. Syst. 103, 83–97. doi: 10.1016/j.agsy.2009.10.001
Tittonell, P., Vanlauwe, B., Leffelaar, P. A., Rowe, E. C., and Giller, K. E. (2005). Exploring diversity in soil fertility management of smallholder farms in western Kenya: I. Heterogeneity at region and farm scale. Agric. Ecosyst. Environ. 110, 149–165. doi: 10.1016/j.agee.2005.04.001
Van Ittersum, M. K., Van Bussel, L. G. J., Wolf, J., Grassini, P., Van Wart, J., Guilpart, N., et al. (2016). Can sub-Saharan Africa feed itself? Proc. Natl. Acad. Sci. USA. 113, 14964–14969. doi: 10.1073/pnas.1610359113
Waha, K., van Wijk, M. T., Fritz, S., See, L., Thornton, P. K., Wichern, J., et al. (2018). Agricultural diversification as an important strategy for achieving food security in Africa. Glob. Chang. Biol. 24, 3390–3400. doi: 10.1111/gcb.14158
Wiggins, S., Argwings-Kodhek, G., Leavy, J., and Poulton, C. (2011). Small Farm Commercialisation in Africa: Reviewing the Issues. Research Paper No. 023. Future Agricultures Consortium, Brighton, United Kingdom. Available online at: https://assets.publishing.service.gov.uk/media/57a08ad1e5274a27b20007b3/Research_Paper23.pdf
Keywords: farm diversity, crop diversity, farm composition, resource endowment, food security, dietary diversity, RHoMIS
Citation: MacLaren C, Aliyu KT, Waswa W, Storkey J, Claessens L, Vanlauwe B and Mead A (2022) Can the Right Composition and Diversity of Farmed Species Improve Food Security Among Smallholder Farmers? Front. Sustain. Food Syst. 6:744700. doi: 10.3389/fsufs.2022.744700
Received: 20 July 2021; Accepted: 21 February 2022;
Published: 01 April 2022.
Edited by:
Jacob Van Etten, Bioversity International, ItalyReviewed by:
Simon Fraval, Wageningen University and Research, NetherlandsMark Van Wijk, International Livestock Research Institute (ILRI), Kenya
Copyright © 2022 MacLaren, Aliyu, Waswa, Storkey, Claessens, Vanlauwe and Mead. This is an open-access article distributed under the terms of the Creative Commons Attribution License (CC BY). The use, distribution or reproduction in other forums is permitted, provided the original author(s) and the copyright owner(s) are credited and that the original publication in this journal is cited, in accordance with accepted academic practice. No use, distribution or reproduction is permitted which does not comply with these terms.
*Correspondence: Chloe MacLaren, Y2hsb2UubWFjbGFyZW5Acm90aGFtc3RlZC5hYy51aw==
 Chloe MacLaren
 Kamaluddin Tijjani Aliyu
 Wycliffe Waswa3
 Lieven Claessens
 Bernard Vanlauwe
 Andrew Mead