 Tesfaye Walle Mekonnen
 Firew Mekbib
 Berhanu Amsalu
 Melaku Gedil
 Maryke Labuschagne
94% of researchers rate our articles as excellent or good
Learn more about the work of our research integrity team to safeguard the quality of each article we publish.
Find out more
ORIGINAL RESEARCH article
Front. Sustain. Food Syst., 08 December 2022
Sec. Crop Biology and Sustainability
Volume 6 - 2022 | https://doi.org/10.3389/fsufs.2022.1076760
This article is part of the Research TopicElucidating the roles of plant-microbe interactions, biological control and plant breeding in promotion of soil health and sustainable crop production systemsView all 5 articles
Nitrogen deficiency is the most limiting abiotic stress factor affecting the grain yield of cowpea (Vigna unguiculata L.) in sub-Saharan Africa (SSA) countries. Breeding for high-yielding potential in association with high nitrogen fixation performance is the principal objective of cowpea breeding programs to improve both the productivity and production of this orphan crop in the region. Therefore, the present study was undertaken to determine the diversity of genotypes for nodulation capacity in two environments and to understand the root architecture and morphology of genotypes as well as grain yield and yield-related traits in 324 cowpea genotypes. The experiment was conducted in two different environments during the 2017 cropping season. The experiments were laid out in 18 × 18 simple lattice design. Grain yield exhibited highly significant and positive genotypic correlations with stem diameter, basal root length of 1st whorls, basal root branching density, taproot length and adventitious root length, demonstrating that selection of cowpea genotypes based on these traits could be effective to capitalize on grain yield under low nitrogen conditions. Days to flowering, days to maturity, stem diameter, 1st whorl angle, basal root length of 1st whorls, basal root branching density, taproot length, adventitious root diameter and adventitious root length had significant and positive genotypic correlations with days to maturity. The first ten principal components (PC) explained 65.13% of the total variation. Stem diameter, taproot width, and taproot length traits were important contributors to the variability in the first PC. The highest inter-cluster distance (D2) was recorded between clusters III and IV. However, clusters II and V recorded the minimum inter-cluster distance (78.96 units). The range of intra-cluster distance was 24.22–5,112.92 units, indicating that the high genetic distance displayed within and between clusters has to be exploited via crossing and selecting the most divergent parents for future cowpea improvement. Five clusters of cowpea genotypes were evident, and within the clusters, the genotypes had good nodulation potential with high grain yield traits, which could significantly contribute to SSA food and nutritional security. Moreover, it can contribute to resilience and improve crop production and sustainability under marginal environmental conditions.
Cowpea [Vigna unguiculata (L.) Walp.] (2n = 2x = 22) is self-pollinating and a dicotyledonous grain legume that belongs to the genus Vigna within the family of Fabaceae and is native to Africa (Menssen et al., 2017). Cowpea is one of Africa's most important indigenous food sources and insurance legume crops during the dry season, grown by poor farmers in marginal environments (Mekonnen et al., 2022a).
Cowpea as a dryland legume crop has significant contribution to food and nutritional security in tropical and sub-tropical regions of the world, including in sub-Saharan Africa (SSA) (Dube and Fanadzo, 2013; Mekonnen et al., 2022b). Cowpea often is called “the poor man's meat” as it is a significant and cheap source of protein, minerals, and vitamins for the rural poor who have limited access to protein from animal sources such as meat and fish in SSA communities (Dube and Fanadzo, 2013). It has the ability to grow under harsh environmental conditions where other major crops fail (Timko and Singh, 2008) and is a climate-resilient smart legume crop for food security, especially in SSA (Mekonnen et al., 2022b).
Cowpea can fix as much as 337 kg/N ha−1 through biological nitrogen fixation in a symbiotic association with Bradyrhizobium species, contributing to soil fertility (Adusei et al., 2017; Damba, 2019; Horn and Shimelis, 2020). However, this potential is limited in soils with low phosphorus (P) availability because of the high P requirements for BNF (Nisar et al., 2016). To alleviate the severity of soil P shortage, the use of synthetic P -fertilizer is causing is a major problem among smallholder African farmers due to high cost and limited access (Mohammed et al., 2020). Cowpea also increases microbial diversity in the soil and plays a major role in resilience to current climate changes in the region and beyond (De La Peña and Pueyo, 2012), making it as a good crop to use in crop rotation with major cereal crops (Daryanto et al., 2015).
The most sustainable solution to address contests interrelated with low soil P and water deficit is through genetic improvement employing a trait-based selection of phenes related to drought and soil fertility (Lynch, 2019). Grain trait component-based selection, including root architecture and morphological traits, is the most effective and efficient approach for developing resilience to soil fertility and drought stress (Burridge et al., 2019; Mohammed et al., 2022). Assessment of genetic variation for root architecture traits, nodulation capacity, grain yield and maturity groups for cowpea improvement are equally crucial to identify potential genotypes for improving grain yield in marginal environments (Mohammed et al., 2022). Previous studies on cowpea root phenotype and related traits are minimal. To date, there is no sufficient information on root architecture trait diversity of cowpea genotypes. Therefore, the objective of this study was to assess the extent of genetic variation among 324 cowpea genotypes for root architecture and morphological traits, to identify the key root traits and root system variation related with the grain yield components and to identify the major traits contributing to the diversity by multivariate techniques.
The experiment was conducted at Melkassa Agricultural Research Center (MARC) and Miesso sub-center during the 2017 cropping season from July to November. Both experimental sites are rain fed, while Miesso is considered as a low soil moisture stress area (Table 1).
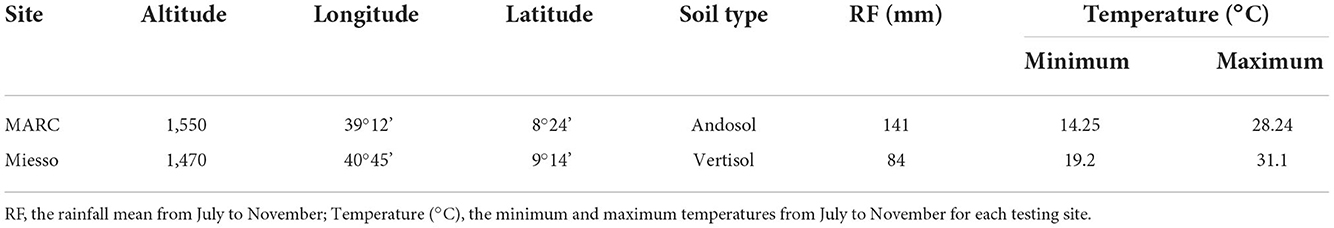
Table 1. Description of the experimental sites.
The experimental plant materials comprised 324 cowpea genotypes (316 are landraces collected from different parts of Ethiopia and eight nationally released varieties for different purposes) and were obtained from the National Lowland Pulse Research Division, Melkassa Agricultural Research Center, Ethiopia.
The experiment was laid out using a 18 × 18 simple lattice design. The plots were 2 m long, with a spacing of 0.75 m between rows and 0.2 m between plants. A plot consisted of two rows accommodating ten plants per row. The distance between plots, intra-blocks, and replications was 1, 1.5, and 2 m, respectively. The data were collected from the two rows (one row for root architecture and morphology data and the other row for the other agronomic traits, including grain yield data). The root architecture and morphology data were collected at the flowering stage of the plant from three plants in each plot. No additional fertilizer application was made throughout the experimental period. Pre planting and post planting soil analysis were not done for nitrogen, potassium and phosphorus. The plots were kept free of weeds the throughout experimental period.
The descriptor of Cowpea developed by International Board for Plant Genetic Resources (IBPGR, 1983) was followed for agronomic data collection. Root architecture and morphology traits was carried out a flowering state. For determine root architecture and nodules were carefully harvested (the plants and roots were removed from the soil) and sampled using “Shovelomics” (Lynch, 2011; Trachsel et al., 2011) techniques (Figures 1, 2) using a shovel and gently washing the root by water.
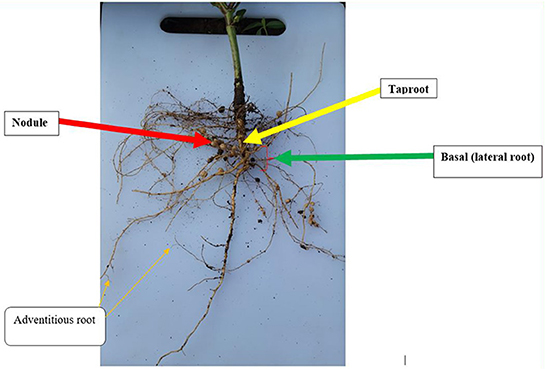
Figure 1. Root architecture and nodule distribution of cowpea genotypes.

Figure 2. Nodule distribution, number of whorls, angle of whorls, the position of whorls and nodule size.
The following data were collected on plot and plant basis.
Days to flowering (DF): the number of days from germination to when 50% of plants started flowering.
Days to maturity (DM): the number of days from the planting date to when 90% of the plants in a plot had mature pods.
Plant height (cm): the length of the central axis of the stem, measured from the soil surface up to the tip of the stem.
Grain yield (kg/ha): grain yield in grams harvested from plants in the one central rows.
Stem diameter (mm): the diameter of the stem at soil level (the base of the stem).
Number of whorls: the number of whorls per plant.
1st whorl angle: it is measured by displaying the whorl on a 180° protractor sketched board (similar to the root in the soil).
Basal root length 1st whorl (mm): the length of the basal root measured from the taproot to the end tip of the basal root.
Total number of basal roots (TNBR): number of roots in the basal region of the hypocotyl or plants.
Basal root branching density (BRBD): number of root hairs in mm2 on the basal roots.
Basal root diameter: taproot diameter (mm) 5, 10, and 15 cm below the soil surface.
Tap root width (thickness): the diameter of the tap root 2 cm away from the root origin (see Figure 1).
Tap root branching density (cm): number of first-order laterals emerging from the primary root between 2 and 5 cm of the taproot length.
Taproot length (cm): measured on the lower stem to the lower tip of the taproot.
Number of adventitious roots: the number of adventitious roots of 1st order lateral roots emerging from the hypocotyl.
Adventitious root diameter (mm): recorded by selecting representative adventitious roots by taking the average of the diameter of three adventitious roots 2 cm from the root origin.
Adventitious root length (cm): the length of the adventitious root measured in cm from the basal root to the tip of the adventitious root.
Number of nodules: after scoring, the total number of nodules per plant was counted.
Nodule size: it was determined by placing the multiple root nodules on a board with a sketch of the diameter of nodules (Kuang et al., 2005).
Nodule distribution: distribution in the upper parts of the root system within 5 cm from the soil surface = 5, between 5 cm and 10 cm = 10, between 10 and above = 15.
Nodule volume (NV): it was measured using a volumetric flask by taking all nodules collected from the sampled plants. Five ml of water was poured into the flask before adding the nodules for the sample, then the volume of the nodules was calculated from the total volume in the volumetric flask.
Adventitious root branching density: it was measured by taking a representative area from the adventitious root and counting the healthy lateral roots emerging within a 2 cm root segment for three randomly selected adventitious roots.
Twenty-two root architecture and morphology traits were used for combined analysis of variance for the two locations. Before doing a series of multivariate analyses, the genotype data were standardized to a mean of zero and a variance of unity to avoid bias due to difference in the scales of measurements. Principal component analysis (PCA), cluster heat mapping, score plot and plot loading effect analysis was done using NCSS (2022). PCA was performed using a correlation matrix to determine principal components, proportions of eigenvalues and the scores of the principal components. Hierarchical clustering of grain yield components and root architecture and morphological traits in cowpea genotypes was used to construct a cluster heat map by the hierarchical cluster algorithm method using NCSS 2022. The measure of dissimilarity was Euclidean distance. The average intra and inter-cluster distances were calculated using the generalized Mahalanobis's D2 statistics (Mahalanobis, 1936). The R2 (RSQ), Cubic Clustering Criteria (CCC), pseudo-F statistics (PSF) and pseudo-T2 statistics were considered for defining optimum cluster numbers (Milligan and Cooper, 1985). The contribution of each trait to divergence as described by Sharma (1998) with the formula [CTIC =] where SD and are the standard deviation and mean performance of each trait, respectively. Phenotypic and genotypic correlations between yield and yield related traits were estimated using the method described by Grossman (1970) as:
Where, rpxy is phenotypic correlation coefficient and genotypic correlation coefficient (rgxy) between character x and y; Covpxy and Covgxy are phenotypic covariance and genotypic covariance between characters x and y; and are genotypic variances of traits x and y; and are phenotypic variances of traits x and y, respectively. The coefficient of correlation was tested using tabulated value at n-2 degree of freedom, at 5 and 1% probability level, where n is the number of treatments (genotypes) described by Robertson (1959). META-R Version 6.01 (Alvarado et al., 2016) was employed for phenotypic and genotypic correlation coefficient analysis.
The estimated mean, standard errors, minimum and maximum of the studied 22 traits are presented in Supplementary Table 1. There was a wide range of variations for all the studied traits between the genotypes. The mean values of days to maturity varied from 66 (NLLP-CPC-0746-B) to 90.5 (NLLP-CPC-07-84) days with a mean of 78.53 days. The mean values for plant height ranged from 38 (NLLP-CPC-113) to 110.35 cm (NLLP-CPC-07-20), with an overall mean of 71.26 cm. The highest mean values were recorded in 211-491-C for stem diameter, White wonder for number of whorls, NLLP-CPC-07-88-B for 1st whorl angle, NLLP-CPC-07-150 for basal root length 1st whorls, Asrat for total number of basal roots, ACC-215-762 for basal root branching density, NLLP-CPC-0783 for basal root diameter, NLLP-CPC-105-A for taproot width, NLLP-CPC-07-146 for taproot branching density, and Dass 001 for taproot length.
Grain yield ranged from 220.48 to 1,804.78 kg/ha, with an average of 815.63 kg/ha. The average values of adventitious root branching density varied from 0.25 to 6.63. In this investigation, the wider root angle a genotype had, the more the basal root branching density; on the other hand, the smaller root angle genotypes had large taproot length and width. Furthermore, when the root angle decreased the adventitious root branching density, the number of adventitious roots, the number of nodules and nodule distribution significantly increased because the root system it grows prostrate and the main root (taproot) not growing deeply to the soil. The late-maturing genotypes had a deep taproot length and narrow root angle (Supplementary Table 1).
Grain yield had a significant and positive correlation with stem diameter, the total number of basal roots, primary root width, and primary root length (Table 2). However, grain yield had a significant and negative correlation with 1st whorl angle, number of adventitious roots and root branching density (Table 2). Highly significant (p < 0.001) correlations were recorded for plant height with days to flowering, days to maturity, nodule size and nodule distribution. Highly significant positive correlations were observed for stem diameter with primary root width (thickness), primary root length, adventitious root length, number of nodules and nodule volume; basal root length 1st whorl with basal root diameter, tap root width and adventitious root length; taproot width with taproot length and number of nodules; the number of nodules with nodule volume and taproot length; nodule distribution with nodule size (Table 2). The heat map showed the strength and the direction of the correlation between grain yield and other root morphometric and architecture traits (Figure 3). The heat map visualized the strong correlation between nodule distribution and nodule size.
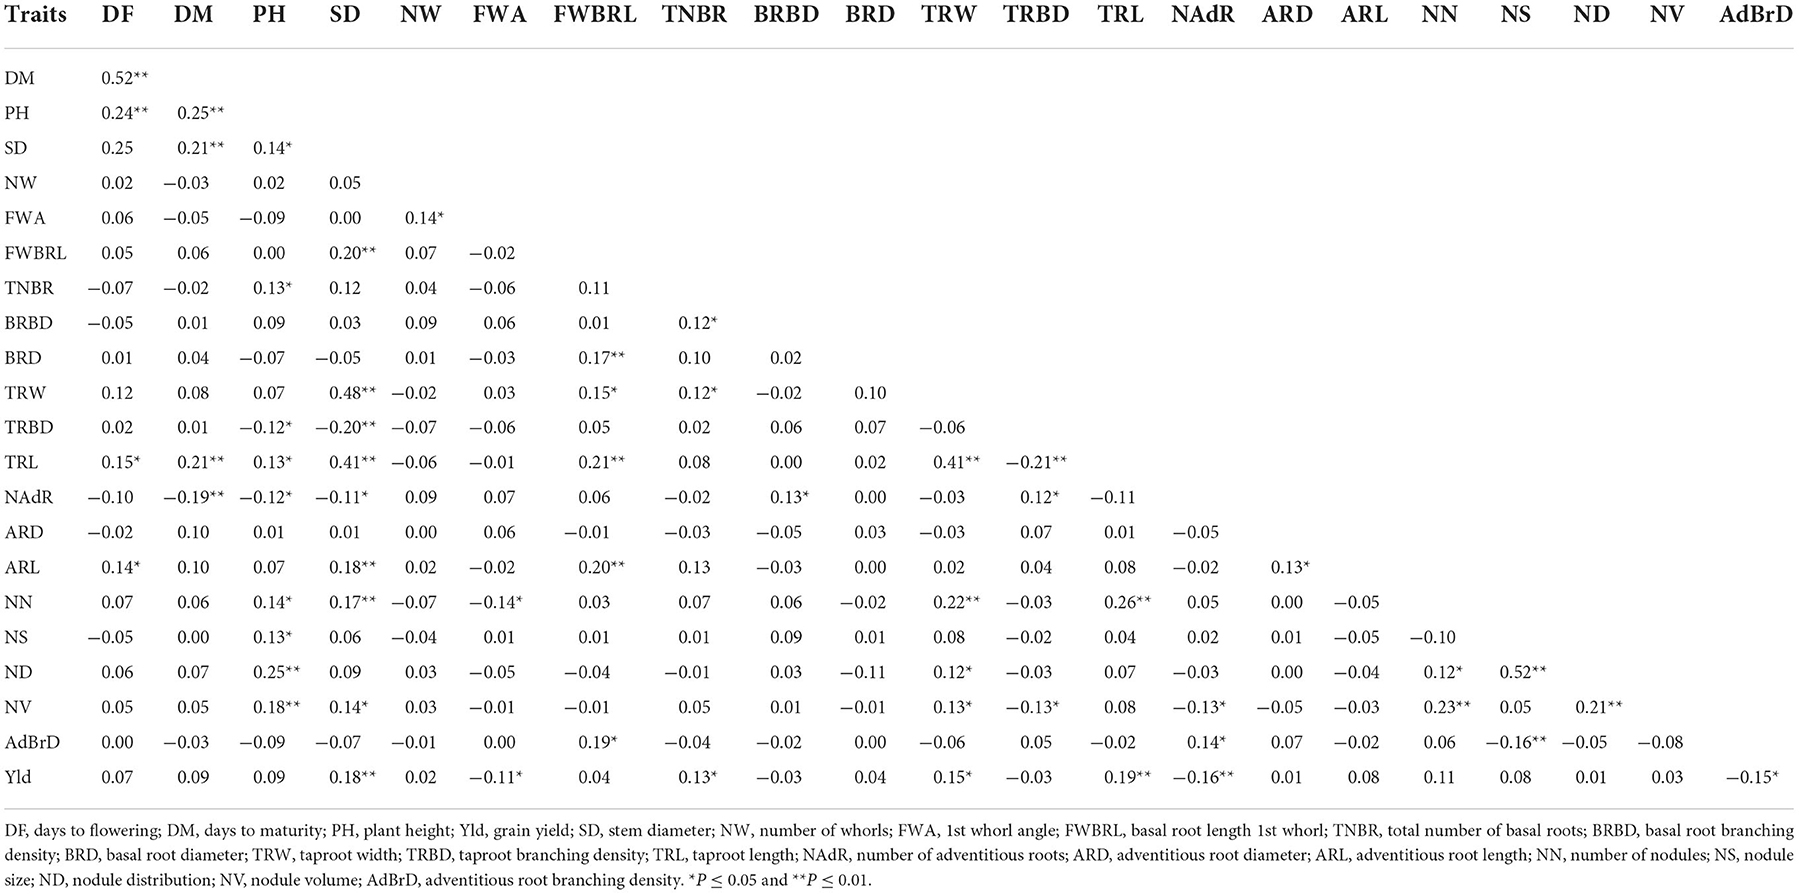
Table 2. Phenotypic correlation among cowpea grain yield and root phenotype traits.
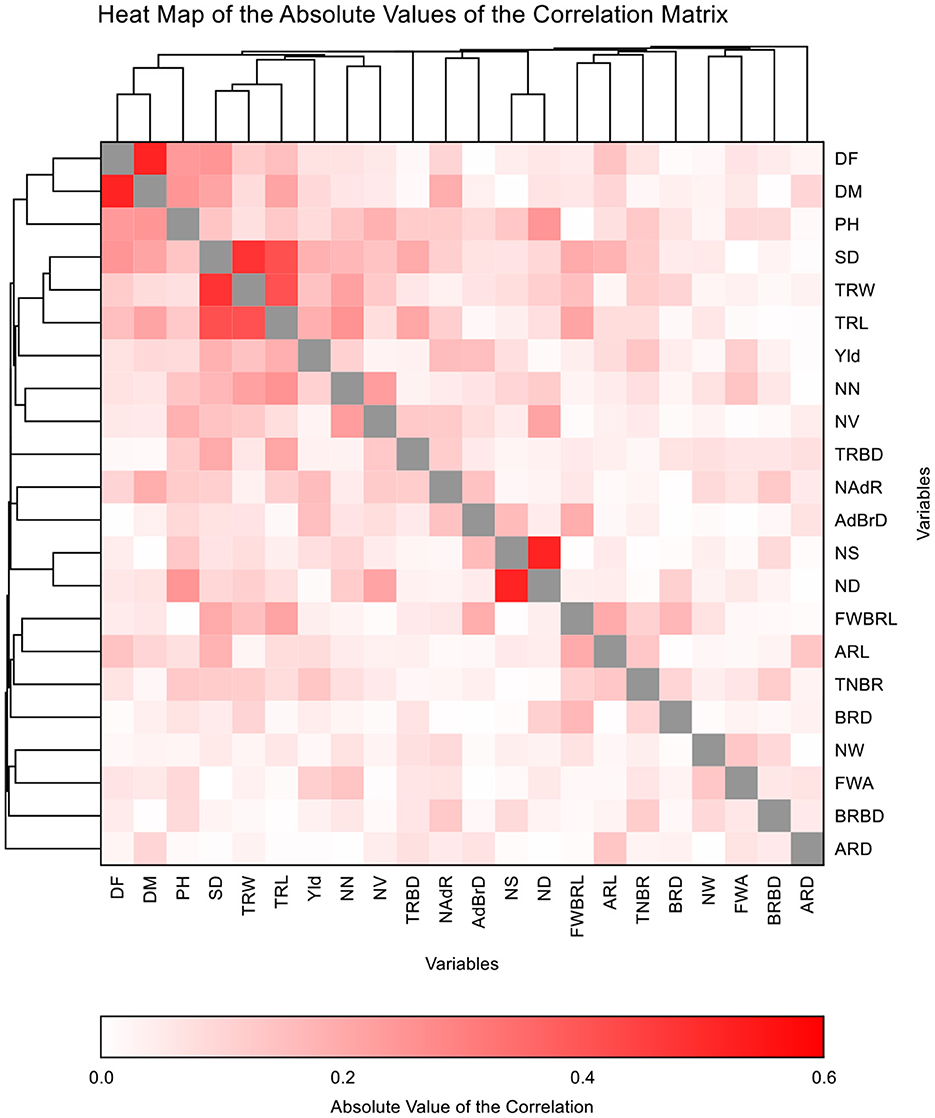
Figure 3. Heat map demonstrating phenotypic correlations among grain yield root morphometric and architecture of cowpea genotypes.
Grain yield exhibited highly significant and positive correlations with stem diameter, basal root length of 1st whorls, basal root branching density, taproot length and adventitious root length. However, basal root diameter and number of adventitious roots had highly significant and negative correlations with grain yield (Table 3). Days to flowering had a positive and perfect correlation with days to maturity and plant height. Highly significant and positive correlations were observed for plant height with the total number of basal roots, basal root branching density, adventitious root length, nodule size, and adventitious root branching density; stem diameter with basal root length 1st whorl, taproot width, adventitious root length, and the number of nodules; basal root length 1st whorl with basal root diameter, taproot length and adventitious root length; taproot width with taproot length the and number of nodules; taproot length with the number of nodules; nodule volume with the number of nodules and nodule distribution; nodule size with nodule distribution (Table 3).
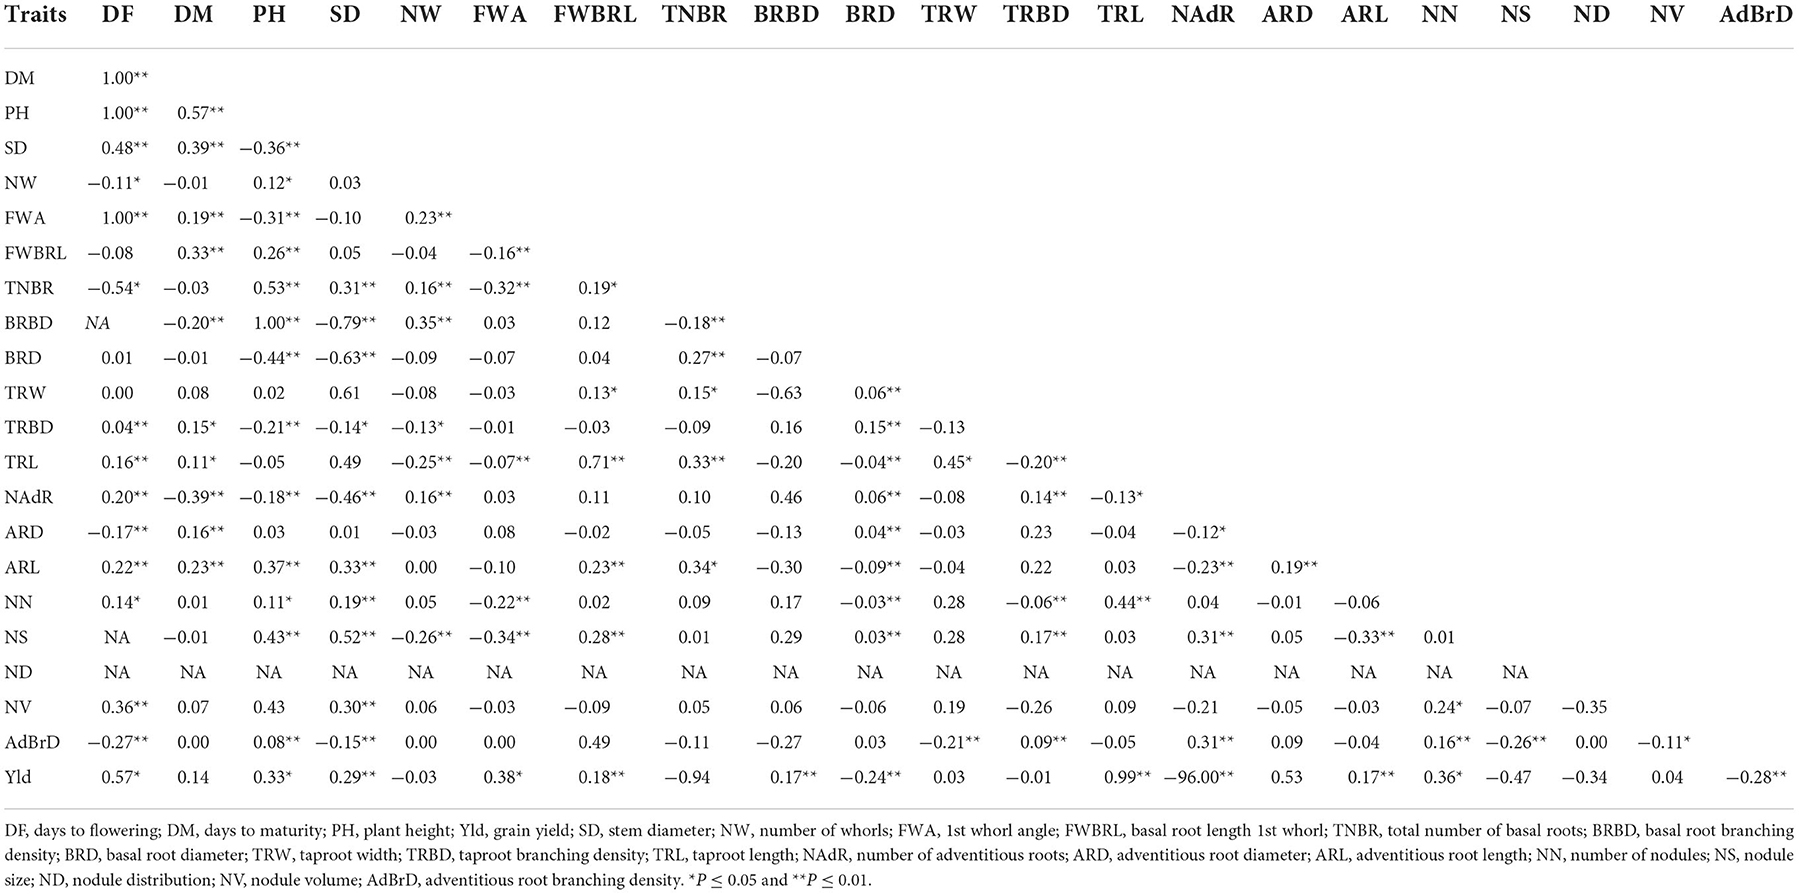
Table 3. Genotypic correlations among cowpea grain yield and root phenotype traits.
The first ten principal components (PCs) having latent roots greater than unity, explained 65.13% of the total variation (Table 4). Stem diameter, taproot width and taproot length made a high contribution to PC1. Basal root length 1st whorl had an eigenvalue of 1.74 and contributed 7.91% of the variation in PC2. Nodule size and nodule distribution contributed negatively to the second PC. Days to flowering, and days to maturity contributed positively to PC3, basal root branching density, taproot branching density and nodule size to PC4, 1st whorl angle and adventitious root branching density to PC5, they had latent roots 1.54, 1.38, and 1.31 and contributed 7, 6.27, and 5.97% of the variation in PC3, PC4, and PC5, respectively. The other PCs explained < 6% of the variation each.
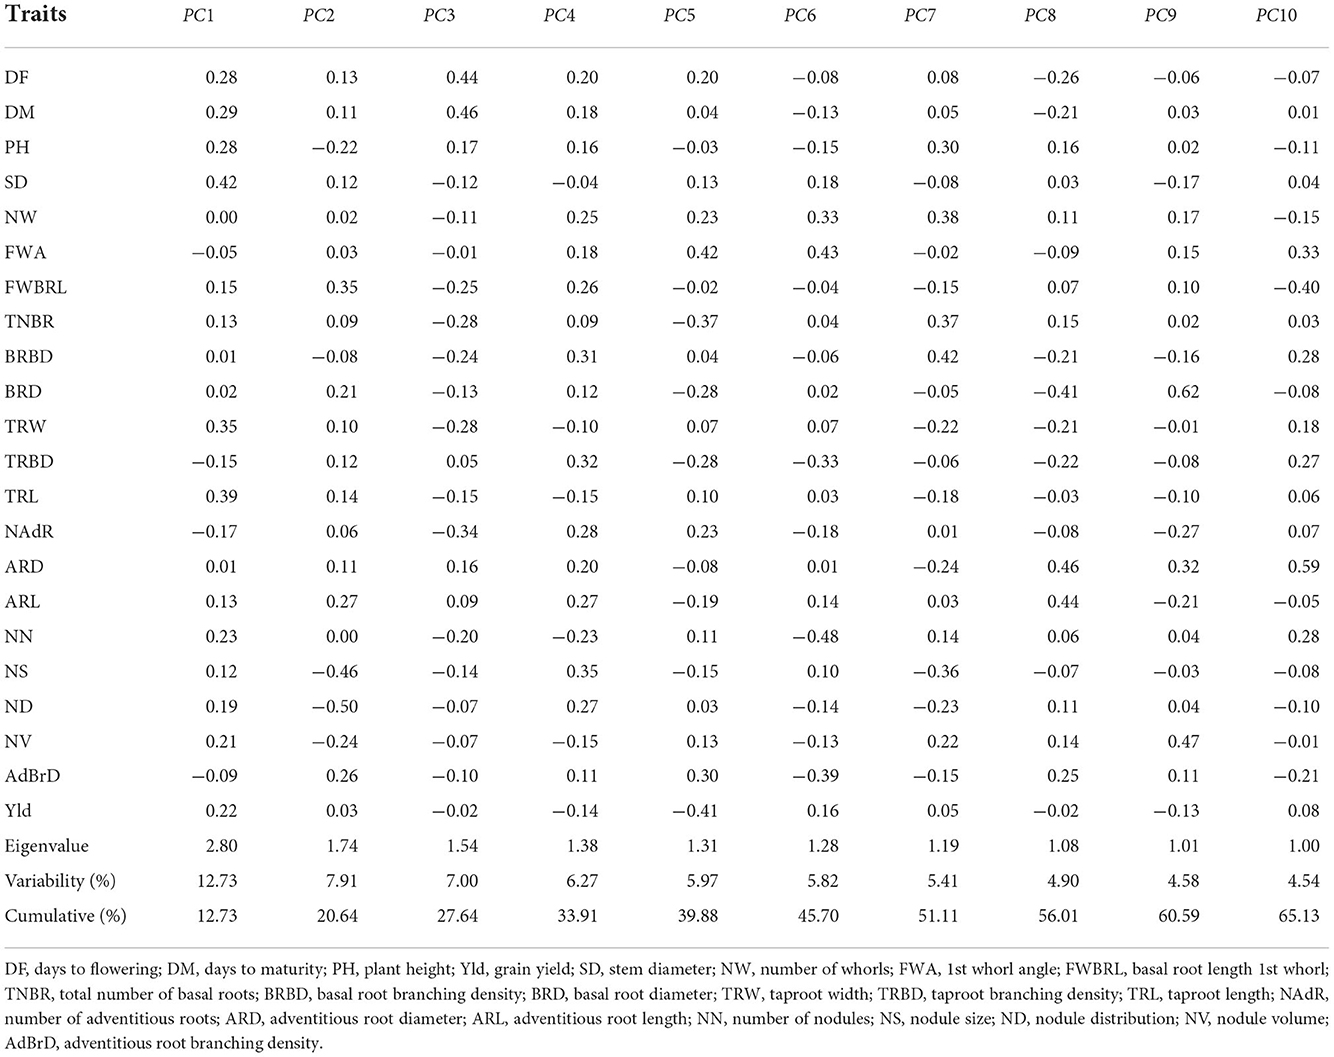
Table 4. Principal component analysis results for 324 cowpea genotypes.
This study grouped the evaluated genotypes into five main clusters comprising 34–96 genotypes (Table 4). Cluster I was the largest cluster containing 96 (29.63%) genotypes, followed by clusters III and V, which had 82 (25.31%) and 73 (22.53%) genotypes, respectively. In the clustered heat map rows represent genotypes, and the columns represent traits (Figure 4). The strength and association between the genotypes and traits were described in each box in different colors (blue, green, yellow, and red). The clustered heat map showed four major distinctive clusters of traits. The traits like days to flowering, days to maturity and plant height were grouped into cluster one; stem diameter, taproot width, taproot length, number of nodules, nodule size, nodule distribution, nodule volume, and grain yield were grouped into cluster two; basal root diameter, total number of basal roots, adventitious root length and basal root length 1st whorls was grouped into cluster three; adventitious root diameter, adventitious root branching density, 1st whorls angle, number of adventitious roots, basal root branching density, taproot branching density and number of whorls were grouped into cluster four.
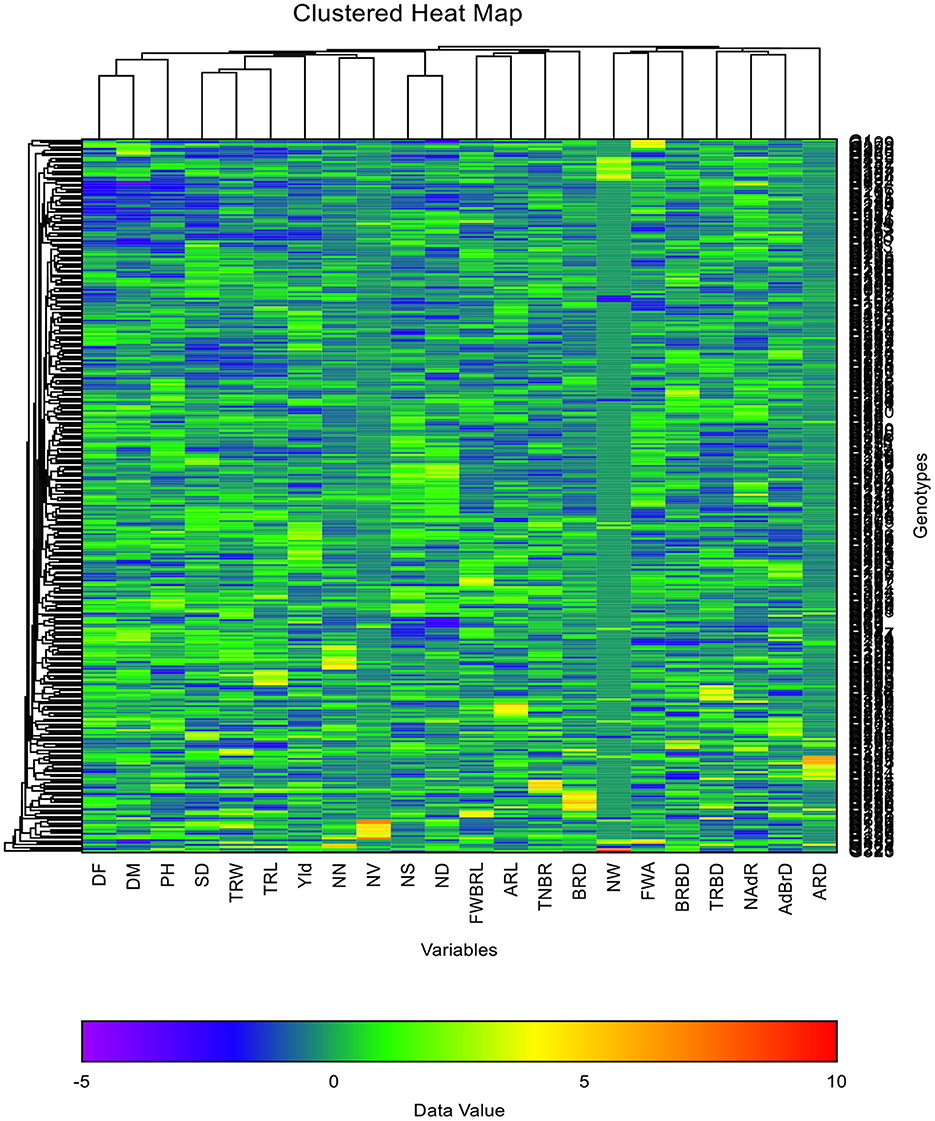
Figure 4. Clustered heat map showing the correlation between genotypes and root morphometric and architecture traits. DF, days to flowering; DM, days to maturity; PH, plant height; Yld, grain yield; SD, stem diameter; NW, number of whorls; FWA, 1st whorl angle; FWBRL, basal root length 1st whorl; TNBR, total number of basal roots; BRBD, basal root branching density; BRD, basal root diameter; TRW, taproot width; TRBD, taproot branching density; TRL, taproot length; NAdR, number of adventitious roots; ARD, adventitious root diameter; ARL, adventitious root length; NN, number of nodules; NS, nodule size; ND, nodule distribution; NV, nodule volume; AdBrD, adventitious root branching density.
The inter and intra-cluster distance (D2) results showed highly significant variation (Table 5). The intra-cluster distances varied from 24.22 to 5,112.92 units, and the inter-cluster ranged from 78.96 to 390.33 units. The largest inter-cluster distance (D2) was recorded between III and IV (390.33 units), followed by I and IV (292.66 units) and II and III (259.51 units). The maximum intra-cluster distance was exhibited in cluster I (5,112.92), while the minimum intra cluster distance was recorded in cluster V (24.22 units). The intra-cluster distance results showed that the most distinct genotypes were clustered compared to the other clusters.
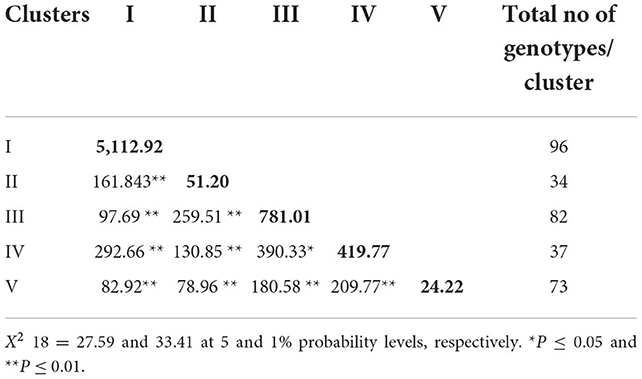
Table 5. Average intra cluster (bolded diagonal) and inter cluster (off-diagonal) distance (D2) values.
The mean values of the 22 root morphometric and architecture traits of the studied genotypes per cluster are presented in Table 6. The average performance of each trait among groups broadly varied from cluster to cluster. Cluster IV showed the best performance for days to flowering, days to maturity, plant height, total number of basal roots, taproot branching density, adventitious root length, nodule size and grain yield. Cluster II was preferable to other clusters for stem diameter, number of whorls, basal root length 1st whorls, basal root diameter and taproot length traits. Moreover, cluster V was the best performing for nodule distribution, nodule volume and adventitious root branching density traits.
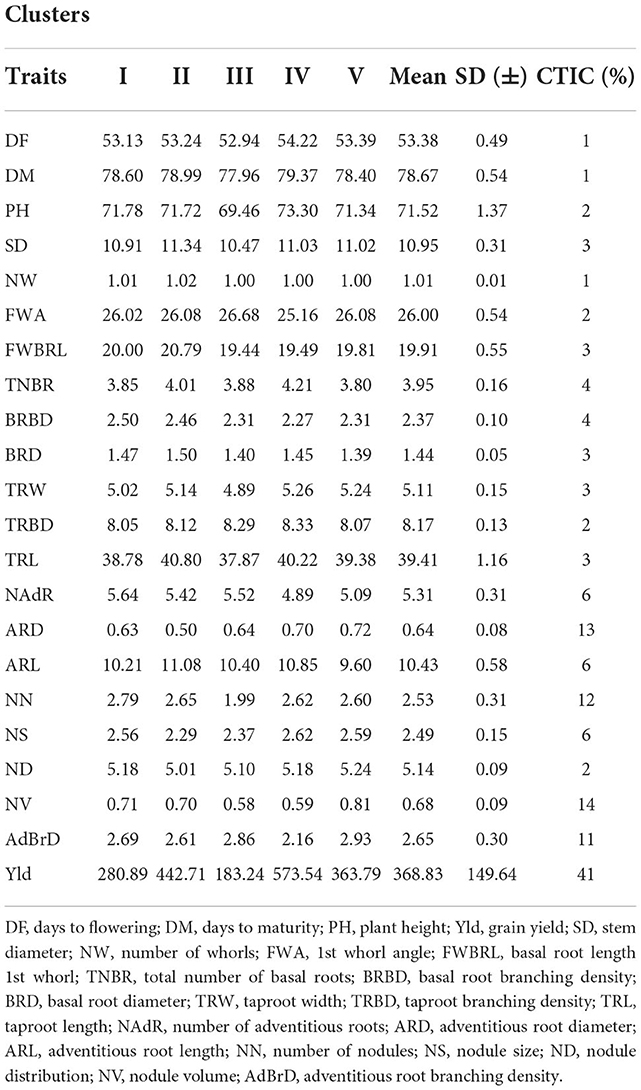
Table 6. Mean performance of cowpea genotypes and contribution of traits for grouping the genotypes into five distinct clusters.
Breeding for high-yielding with good nodulation potential genotypes is the ultimate objective of cowpea breeding strategies for improving productivity and production under marginal environments of SSA countries. In the present study, root architecture and morphometric traits helped identify mechanisms for grain yield performance and the maturity groups of the genotypes. The genotypes had broader (bigger) 1st whorl angle when belonging to early maturity groups. They produced a higher number of adventitious roots, wider adventitious root diameter, long adventitious roots, high number of nodules, high nodule distribution in the lateral root system and high adventitious root branching density. This implies that the genotypes would produce significant grain yield under low soil fertility stress conditions because they produce enough nodules under natural inoculation. These nodules can replace the soil N during the crop's flowering and grain-filling period. Based on the overall performance of genotypes, if the genotypes had broader 1st whorl angle, and also were early maturing, it indicated that there is potential to identify suitable genotypes for coping with low N soil stress conditions. The genotypes will also have adaptive mechanisms which involve rapid plant development to enable the completion of the entire life cycle before drought or low moisture stress sets in. If crops have wider root angles their roots grow shallow and they complete their life cycle compared to the crop's have narrow or small root angles (Prince et al., 2020).
Furthermore, narrow 1st whorl angle, high stem diameter, and high taproot length and width genotypes provided significantly higher grain yield and they clustered into late maturity groups as compared to the genotypes that have wider 1st whorl angle and small taproot length. This lengthy taproot helps water uptake in depleted soil conditions. Likewise, Mohammed et al. (2022) reported that the root length increased in depth, and the plant was capable of finding enough moisture and extracting nutrients from the deep soil. High root length positively influenced grain yield in drought conditions (Ramamoorthy et al., 2017). In general, in this study, high genetic diversity for root architecture and morphometric traits were observed in the studied genotypes; therefore, the selection of genotypes best adapted to targeted environmental constraints will be crucial for resilient, sustainable cowpea production in the context of climate change in SSA.
The extents of genotypic correlation coefficients for most of the traits were higher than phenotypic correlation coefficients, which indicates association among these traits due to genetic factors and the preponderance of genetic variance in the expression of traits. Grain yield had significant and positive genotypic correlations with days to flowering, plant height, stem diameter, basal root length of 1st whorls, basal root branching density, taproot length, adventitious root length, and the number of nodules, which indicated that the association with grain yield was because of additive genetic effects. These results suggest that improvement in any of these traits will lead to an increase through indirect selection for grain yield of cowpea in marginal environments. Kashiwagi et al. (2006) and Diaz et al. (2022) reported that grain yield significantly and positively correlated with root length and density in chickpeas under terminal drought stress. Moreover, grain yield was significantly positively correlated (phenotypic correlation) with stem diameter, total number of basal roots, taproot width and taproot branching density. This indicates the inherent correlation among the studied root architecture-related traits with grain yield and better opportunities for genetic improvement of cowpea grain yield through direct phenotypic selection for marginal environments. Previous studies were reported by Astereki et al. (2017), Walle et al. (2018), Girma et al. (2019), Diaz et al. (2022), and Mbuma et al. (2022) on similar trends on phenotypic diversity in genotypes for different traits.
Generally, grain yield is a complex trait which is governed by many minor genes, determined by the interactive effects of several yield-related agronomic traits that are influenced by their genotype and environmental factors. Thus, the direct measurement and improvement of grain yield itself may be difficult because of the influence of environmental factors and the nature of the genetic factors determining grain yield. Therefore, investigating root architecture and morphology traits with their correlation to grain yield is essential to understand the influence of root system-related traits on grain yield performance under contrasting environmental conditions.
In the present investigation, the first ten PCAs having latent roots greater than unity explained 65.13% of the total variation, which indicates that these ten PCs contributed significantly to the variability of the dataset. According to Joseph et al. (2019), the loading effect of any traits > ±0.3 was meaningful and significant. Stem diameter, taproot width and taproot length explained the most variation among the studied traits in PC1 with high positive loading. Basal root length of 1st whorls had a positive contribution to PC2 which had an eigenvalue of 1.74 and contributed 7.91% of the variation in the dataset. However, nodule size and nodule distribution had negative contributions to the second PC. This implies that the first and second PCs explained a considerable amount of variation among the genotypes, revealing a high degree of correlation among the traits.
In general, high root architecture and morphology trait diversity was observed among the genotypes, which can be used for genetic improvement and cowpea variety development (climate-resilient varieties) to mitigate problems associated with edaphic stresses, including low N and availability of P in the soil and low soil moisture stress (early, intermediate and terminal drought) in the cowpea production areas of SSA. Mohammed et al. (2022) used PCA and identified the vital root phenotypic traits for cowpea phenotypic diversity.
Genotypes G7, G37, G62, G109, G120, G121, G181, G201, G223, and G298 were the most diverse genotypes among 324 cowpea genotypes for all measured characteristics. These offer ample opportunity to select the appropriate parents for specific traits that fit breeding objectives and sustainable cowpea genetic enhancements to the particular environments. Previously, Walle et al. (2019), Ongom et al. (2021), and Mbuma et al. (2022) reported similar findings on cowpea traits. Similarly, Thakur et al. (2018) reported that within clusters, the genotypes have narrow genetic diversity and they similar levels of gene expression.
Dealing with, and understanding genetic diversity by measuring the genetic distances of genotypes within and among clusters is paramount to choosing parents for hybridization in successful crop improvement for biotic and abiotic stress tolerance or resistance within the time frame of breeding programs. This study recorded considerable genetic distance between clusters III and IV (390.33 units). This high genetic distance implies that enough genetically heterogeneous and divergent genotypes are available for grain yield and other traits in each cluster.
Therefore, this is an ample opportunity to select parents for population development among clusters, and it would help the breeder's selection efficiency for the trait improvements of cowpea. Increasing the trait variability within or among the clusters has a positive impact on sustainable crop breeding programs to mitigate climate changes, confront malnutrition problems in low-income populations and develop climate-resilient crop varieties for marginal environments in SSA. The maximum intra-cluster distance was exhibited in cluster I (5,112.92), while the minimum inter-cluster distance was recorded in cluster V (24.22 units). This intra-cluster distance results showed the most distinct genotypes were clustered compared to the other clusters. Maximum inter and intra-cluster distances help the hybridization program realize desirable transgressive segregates (Thakur et al., 2018; Walle et al., 2018). Likewise, Long et al. (2020) reported that high genetic diversity increases the efficiency of utilization of target traits in crop breeding.
Grouping genotypes based on their performance of root architecture and grain yield traits are crucial to identifying and documenting novel and desirable genes responsible for, or correlated to, low soil fertility stress and identifying water deficient tolerant genotypes with high yielding ability in the abiotic stress-prone areas of SSA countries. In this study, cluster IV showed the best performance for days to flowering, days to maturity, plant height, the total number of basal roots, taproot branching density, adventitious root length, nodule size and grain yield. Therefore, the most promising and high-performing genotypes grouped into this cluster and potential genotypes for improvement of grain yield ultimately and desirable other traits in cowpea improvement programs can be selected. Grain yield, number of nodules and nodule volume were grouped in one cluster, and they had positive correlation with each other; this implies that the performance of genotypes for yield and nodulation had similar (shared) levels of gene expression. Generally, there was highly significant mean performance variation among clusters for the studied traits, and this is an excellent opportunity for identifying parents based on the specific traits of interest based on the future breeding objectives and improvement strategies of cowpea. Similarly, Odireleng and Bose (2020) and Yasin et al. (2021) also identified cowpea genotypes based on their mean performance from the grouping of genotypes.
This study revealed significant genetic diversity in cowpea root architecture and morphology among cowpea genotypes. In the present investigation, the genotypes that had small 1st whorl angle were early maturing, and there is the potential to identify suitable genotypes for coping with low N stress conditions. These genotypes produced a higher number of adventitious roots, wider adventitious root diameter, long adventitious roots, a high number of nodules, high nodule distribution in the lateral root system and high adventitious root branching density. The extents of genotypic correlation for most of the root architecture and morphological traits were higher than phenotypic correlation coefficients due to genetic factors and the preponderance of genetic variance in the expression of traits.
The first ten principal components accounted for 65.13% of the total variation detected among the tested genotypes. Stem diameter, taproot width, taproot length, basal root length of 1st whorl, days to flowering, days to maturity, basal root branching density, taproot branching density, nodule size, 1st whorl angle and adventitious root branching density were the most significant traits that contributed to these principal components accounting for a large portion of the diversity of root traits among the studied genotypes.
The 324 cowpea genotypes were clustered into five distinct clusters, and the maximum inter-cluster distance was recorded between clusters III and IV. However, clusters II and V recorded the minimum inter-cluster distance. The range of intra-cluster distance was 24.22–5,112.92 units. In general, the present study indicated the existence of high genetic diversity for root architecture and morphological traits. Those traits are strongly associated with grain yield and days-to-maturity. This may offer an opportunity to understand and quantify genetic diversity by exploiting genotypes' genetic potentials to choose the most divergent parents for hybridization in successful crop improvement for marginal environmental conditions.
The original contributions presented in the study are included in the article/Supplementary material, further inquiries can be directed to the corresponding author.
TM wrote the first draft of the manuscript. TM, FM, BA, MG, and ML contributed to conceptualization, methodology, data curation, analysis, investigation, and validation. All authors contributed to manuscript editing and revision and approved the submitted version.
This work was supported by the McKnight Foundation through the Collaborative Crop Research Program (CCRP) (Grant Number: 13-349).
The authors sincerely acknowledge the contribution of Wolkite University, Melkassa Agricultural Research Center (EIAR), and the McKnight Foundation USA, for providing the research funds to complete this project.
The authors declare that the research was conducted in the absence of any commercial or financial relationships that could be construed as a potential conflict of interest.
All claims expressed in this article are solely those of the authors and do not necessarily represent those of their affiliated organizations, or those of the publisher, the editors and the reviewers. Any product that may be evaluated in this article, or claim that may be made by its manufacturer, is not guaranteed or endorsed by the publisher.
The Supplementary Material for this article can be found online at: https://www.frontiersin.org/articles/10.3389/fsufs.2022.1076760/full#supplementary-material
Adusei, G., Gaiser, T., Boukar, O., and Fatokun, C. (2017). Growth and yield responses of cowpea genotypes to soluble and rock P fertilizers on acid, highly weathered soil from humid tropical West Africa. Int. J. Biol. Chem. Sci. 10, 1493. doi: 10.4314/ijbcs.v10i4.3
Alvarado, G., López, M., Vargas, M., Pacheco, A., and Rodríguez, F. (2016). Multi-Environment Trial Analysis With R. Version 6.04”, hdl11529/10201, CIMMYT Res. Data Softw. Repos. Network, V23, Texcoco.
Astereki, H., Sharifi, P., and Pouresmael, M. (2017). Correlation and path analysis for grain yield and yield components in chickpea (Cicer arietinum L.). Genetika 49, 273–284. doi: 10.2298/GENSR1701273A
Burridge, J. D., Findeis, J. L., Jochua, C. N., Miguel, M. A., Mubichi-Kut, F. M., Quinhentos, M. L., et al. (2019). A case study on the efficacy of root phenotypic selection for edaphic stress tolerance in low-input agriculture: common bean breeding in Mozambique. Feild. Crop. Res. 244, 107612. doi: 10.1016/j.fcr.2019.107612
Damba, Y. (2019). Evaluation of Cowpea (Vigna unguiculata (L.) Walp) Genotypes for Drought Tolerance (Ph.D. Thesis), Tennessee State University, Nashville, TN, United States, 1–24.
Daryanto, S., Wang, L., and Jacinthe, P. A. (2015). Global synthesis of drought effects on food legume production. PLoS ONE 10, e0127401. doi: 10.1371/journal.pone.0127401
De La Peña, T. C., and Pueyo, J. J. (2012). Legumes in the reclamation of marginal soils, from cultivar and inoculant selection to transgenic approaches. Agron. Sustain. Dev. 32, 65–91. doi: 10.1007/s13593-011-0024-2
Diaz, S., Polania, J., Ariza-Suarez, D., Cajiao, C., Grajales, M., and Raatz, B. (2022). Genetic correlation between fe and zn biofortification and yield components in a common bean (Phaseolus vulgaris L.). Front. Plant Sci. 12, 2775. doi: 10.3389/fpls.2021.739033
Dube, E., and Fanadzo, M. (2013). Maximising yield benefits from dual-purpose cowpea. Food Secur. 5, 769–779. doi: 10.1007/s12571-013-0307-3
Girma, N., Mekibib, F., Fikre, A., Keneni, G., Rao, G., and Ojiewo, C. (2019). Estimate of heritability and correlation analysis for nitrogen fixation, yield and associated traits in chickpea. Int. J. Eng. Res. 10, 1266–1280.
Grossman, M. (1970). Sampling variance of the correlation coefficients estimated from analyses of variance and covariance. Theor. Appl. Genet. 40, 357–359. doi: 10.1007/BF00285414
Horn, L. N., and Shimelis, H. (2020). Production constraints and breeding approaches for cowpea improvement for drought prone agro-ecologies in Sub-Saharan Africa. Ann. Agric. Sci. 65, 83–91. doi: 10.1016/j.aoas.2020.03.002
Joseph, F. Jr., William, C., Barry, J., and Ea, R. (2019). Multivariate Data Analysis, 8th Edn. Basingstoke: Annabel Ainscow.
Kashiwagi, J., Krishnamurthy, L., Crouch, J. H., and Serraj, R. (2006). Variability of root length density and its contributions to seed yield in chickpea (Cicer arietinum L.) under terminal drought stress. F. Crop. Res. 95, 171–181. doi: 10.1016/j.fcr.2005.02.012
Kuang, R., Bin, L. H, Yan, X. L., and Dong, Y. S. (2005). Phosphorus and nitrogen interactions in field-grown soybean as related to genetic attributes of root morphological and nodular traits. J. Integr. Plant Biol. 47, 549–559. doi: 10.1111/j.1744-7909.2005.00072.x
Long, J., Zhang, J., Zhang, X., Wu, J., Chen, H., Wang, P., et al. (2020). Genetic diversity of common bean (Phaseolus vulgaris L.) germplasm resources in chongqing, evidenced by morphological characterization. Front. Genet. 11, 697. doi: 10.3389/fgene.2020.00697
Lynch, J. P. (2011). Root phenes for enhanced soil exploration and phosphorus acquisition: tools for future crops. Plant Physiol. 156, 1041–1049. doi: 10.1104/pp.111.175414
Lynch, J. P. (2019). Root phenotypes for improved nutrient capture: an underexploited opportunity for global agriculture. New Phytol. 223, 548–564. doi: 10.1111/nph.15738
Mahalanobis, P. C. (1936). On the generalized distance in statistics. Proc. Indian Natl. Inst. Sci. 2, 49–55.
Mbuma, N. W., Gerrano, A. S., Lebaka, N., and Labuschagne, M. (2022). Interrelationship between grain yield components and nutritional quality traits in cowpea genotypes. South African J. Bot. 150, 34–43. doi: 10.1016/j.sajb.2022.07.006
Mekonnen, T. W., Gerrano, A. S., Mbuma, N. W., and Labuschagne, M. T. (2022a). Breeding of vegetable cowpea for nutrition and climate resilience in Sub-Saharan Africa: progress, opportunities, and challenges. Plants 11, 1–23. doi: 10.3390/plants11121583
Mekonnen, T. W., Mekbib, F., Amsalu, B., Gedil, M., and Labuschagne, M. (2022b). Genotype by environment interaction and grain yield stability of drought tolerant cowpea landraces in Ethiopia. Euphytica 218, 1–13. doi: 10.1007/s10681-022-03011-1
Menssen, M., Linde, M., Otunga Omondi, E., Abukutsa-Onyango, M., Dinssa, F. F., and Winkelmann, T. (2017). Genetic and morphological diversity of cowpea (Vigna unguiculata (L.) Walp.) entries from East Africa. Sci. Hortic. 226, 268–276. doi: 10.1016/j.scienta.2017.08.003
Milligan, G. W., and Cooper, M. C. (1985). An examination of procedures for determining the number of clusters in a data set. Psychometrika. 50, 159–179. doi: 10.1007/BF02294245
Mohammed, S. B., Burridge, J. D., Ishiyaku, M. F., Boukar, O., and Lynch, J. P. (2022). Phenotyping cowpea for seedling root architecture reveals root phenes important for breeding phosphorus efficient varieties. Crop Sci. 62, 326–345. doi: 10.1002/csc2.20635
Mohammed, S. B., Mohammad, I. F., Pangirayi, T. B., Vernon, G., Dzidzienyo, D. K., Umar, M. L., et al. (2020). Farmers' knowledge, perception, and use of phosphorus fertilization for cowpea production in Northern Guinea Savannah of Nigeria. Heliyon 6, e05207. doi: 10.1016/j.heliyon.2020.e05207
Nisar, A., Khan, S. U., and Shah, A. H. (2016). Screening and evaluation of wheat germplasm for phosphorus use efficiency. Iran. J. Sci. Technol. Trans. A Sci. 40, 201–207. doi: 10.1007/s40995-016-0085-9
Odireleng, O. M., and Bose, C. M. (2020). Field evaluation of introduced and local cowpea genotypes performance in Botswana. African J. Agric. Res. 16, 1317–1324. doi: 10.5897/AJAR2020.15031
Ongom, P. O., Fatokun, C., Togola, A., Oyebode, O. G., Ahmad, M. S., Jockson, I. D., et al. (2021). Genetic worth of multiple sets of cowpea breeding lines destined for advanced yield testing. Euphytica 217, 1–18. doi: 10.1007/s10681-020-02763-y
Prince, S. J., Vuong, T. D., Wu, X., Bai, Y., Lu, F., Kumpatla, S. P., et al. (2020). Mapping quantitative trait loci for soybean seedling shoot and root architecture traits in an inter-specific genetic population. Front. Plant Sci. 11, 1284. doi: 10.3389/fpls.2020.01284
Ramamoorthy, P., Lakshmanan, K., Upadhyaya, H. D., Vadez, V., and Varshney, R. K. (2017). Root traits confer grain yield advantages under terminal drought in chickpea (Cicer arietinum L.). Field. Crop. Res. 201, 146–161. doi: 10.1016/j.fcr.2016.11.004
Robertson, A. (1959). The sampling variance of the genetic correlation coefficient. Int. Biometric Soc. 15, 469–485. doi: 10.2307/2527750
Sharma, J. (1998). Statistical and Biometrical Techniques in Plant Breeding. 1 Edn. New Delhi: New Age International Limited Publishers.
Thakur, N. R., Toprope, V. N., and Phanindra, K. S. (2018). Genetic diversity studies in chickpea (Cicer arietinum L.) germplasm. Int. J. Curr. Microbiol. Appl. Sci. 7, 2757–2763. doi: 10.20546/ijcmas.2018.709.342
Timko, M. P., and Singh, B. B. (2008). “Cowpea, a multifunctional legume,” in Genomics of Tropical Crop Plants, eds H. M. Paul and M. Ray (New York, NY: Springer Science+Business Media, LLC), 227–258.
Trachsel, S., Kaeppler, S. M., Brown, K. M., and Lynch, J. P. (2011). Shovelomics: high throughput phenotyping of maize (Zea mays L.) root architecture in the field. Plant Soil. 341, 75–87. doi: 10.1007/s11104-010-0623-8
Walle, T., Mekbib, F., Amsalu, B., and Gedil, M. (2018). Correlation and path coefficient analyses of cowpea (Vigna unguiculata L.) landraces in Ethiopia. Am. J. Plant Sci. 09, 2794–2812. doi: 10.4236/ajps.2018.913202
Walle, T., Mekbib, F., Amsalu, B., and Gedil, M. (2019). Genetic diversity of Ethiopian cowpea [Vigna unguiculata (L) Walp] genotypes using multivariate analyses. Ethiop. J. Agric. Sci. 29, 89–104.
Keywords: cowpea, marginal environments, nodulation, root architecture, root phenotype
Citation: Mekonnen TW, Mekbib F, Amsalu B, Gedil M and Labuschagne M (2022) Breeding implications of nodulation performance and root structure under natural inoculation for soil fertility enhancement and sustainable cowpea production. Front. Sustain. Food Syst. 6:1076760. doi: 10.3389/fsufs.2022.1076760
Received: 21 October 2022; Accepted: 23 November 2022;
Published: 08 December 2022.
Edited by:
Ahmed Idris Hassen, Agricultural Research Council of South Africa (ARC-SA), South AfricaReviewed by:
Surendra Barpete, International Center for Agricultural Research in the Dry Areas (ICARDA), IndiaCopyright © 2022 Mekonnen, Mekbib, Amsalu, Gedil and Labuschagne. This is an open-access article distributed under the terms of the Creative Commons Attribution License (CC BY). The use, distribution or reproduction in other forums is permitted, provided the original author(s) and the copyright owner(s) are credited and that the original publication in this journal is cited, in accordance with accepted academic practice. No use, distribution or reproduction is permitted which does not comply with these terms.
*Correspondence: Tesfaye Walle Mekonnen, dGVzZmF5ZS53YWxsZUBnbWFpbC5jb20=
Disclaimer: All claims expressed in this article are solely those of the authors and do not necessarily represent those of their affiliated organizations, or those of the publisher, the editors and the reviewers. Any product that may be evaluated in this article or claim that may be made by its manufacturer is not guaranteed or endorsed by the publisher.
Research integrity at Frontiers
Learn more about the work of our research integrity team to safeguard the quality of each article we publish.