 Nick W. Smith
 Andrew J. Fletcher1,2
 Warren C. McNabb
- 1Sustainable Nutrition Initiative®, Riddet Institute, Massey University, Palmerston North, New Zealand
- 2Fonterra Research and Development Centre, Palmerston North, New Zealand
- 3Manaaki Whenua Landcare Research, Lincoln, New Zealand
Introduction: The production of plant crops is foundational to the global food system. With the need for this system to become more sustainable while feeding an increasing global population, tools to investigate future food system scenarios can be useful to aid decision making, but are often limited to a calorie- or protein-centric view of human nutrition.
Methods: Here, a mathematical model for forecasting the future cropland requirement to produce a given quantity of crop mass is presented in conjunction with the DELTA Model®: an existing food system scenario model calculating global availability of 29 nutrients against human requirements. The model uses national crop yield data to assign yield metrics for 137 crops.
Results: The crops with the greatest variation between high and low yielding production were specific nuts, fruits, and vegetables of minor significance to global nutrient availability. The nut crop group showed the greatest overall yield variation between countries, and thus the greatest uncertainty when forecasting the cropland requirement for future increases in production. Sugar crops showed the least overall yield variation. The greatest potential for increasing global food production by improving poor yielding production was found for the most widely grown crops: maize, wheat, and rice, which were also demonstrated to be of high nutritional significance.
Discussion: The combined cropland and nutrient availability model allowed the contribution of plant production to global nutrition to be quantified, and the cropland requirement of future food production scenarios to be estimated. The unified cropland estimation and nutrient availability model presented here is an intuitive and broadly applicable tool for use in global food system scenario modeling. It should benefit future research and policy making by demonstrating the implications for human nutrition of changes to crop production, and conversely the implications for cropland requirement of food production scenarios aimed at improving nutrition.
1. Introduction
Global crop production is central to the delivery of nutrition to the world's population and will continue to be so as this population grows in the future. Insufficient future crop production risks reducing global and local food security, and increasing the burden of malnutrition. Conversely, increased crop production and the expansion of cropland poses environmental risks, including increased fertilizer, pesticide, and water use; deforestation; and loss of biodiversity (FAO, 2020b). Sustainable future cropland use will need to balance the demand for food production against the impacts of this land use.
Cropland dynamics and modeling featured at the United Nations Food Systems Summit in September 2021, with the Summit's Scientific Group emphasizing the key contribution of science through food systems modeling to support policy-makers and to avoid unintended consequences (von Braun et al., 2021). Computational modeling can be applied to global food system questions to aid thinking and decision making on future changes to achieve sustainability.
Existing models for global cropland use and production exist and have provided valuable insight into future possibilities for cropland use. For example, the Parsimonious Land Use Model (PLUM; Engström et al., 2016), has been used to identify possibilities for meeting global calorific requirements without exceeding planetary cropland boundaries (Henry et al., 2018). The GlobAgri-AgT model has been used to forecast crop and pasture area under a variety of 2050 scenarios, coupled to diet and global fore-sighting analyses (Mora et al., 2020). Other models have been used to estimate the environmental impact of forecast cropland expansion on biodiversity and carbon storage (Molotoks et al., 2018; Zabel et al., 2019).
Efforts in complex global system modeling have connected cropland to economic variables (e.g., demand, pricing, trade), and further to a range of environmental (e.g., greenhouse gas emissions, land conversion), and social variables (e.g., population, food consumption). Examples of such models include MAgPIE (Dietrich et al., 2019) and GLOBIOM (Havlík et al., 2011). Several of the most prominent of these integrated assessment models have been used to model the Shared Socioeconomic Pathways (O'Neill et al., 2014), forecasting (among many other variables) demand for crops and the subsequent impact on cropland area under these diverse scenarios (Popp et al., 2017; Wang et al., 2020). There was important variation in the predictions of these complex models, a result of their differing underlying assumptions. This reflects the unavoidable degree of uncertainty introduced when developing such complex models to capture the full behavior of complex systems. The complexity of these models can be a weakness, limiting their broad accessibility. They are also usually limited to a calorie- or protein-centric analysis of human nutrition.
Agricultural modeling and analysis that considers future crop production often focusses on yield gaps (Lobell et al., 2009; Licker et al., 2010; Neumann et al., 2010; Mueller et al., 2012; van Ittersum et al., 2013; Fischer et al., 2014; West et al., 2014; Hatfield and Beres, 2019; Rong et al., 2021). The yield gap for a crop in a given region is essentially the difference between its measured yield and its attainable yield, though the definition and quantification of these values varies (see Fischer et al., 2014 for a discussion of the differing approaches). These analyses focus on calculating the magnitude of yield gaps, what the potential increases in productivity would be if yield gaps were closed, and the approaches needed to reduce yield gaps. Various techniques have been used to calculate yield gaps and their potential for reduction at a local or global level, many of which involve sophisticated biophysical modeling, including consideration of water use, fertilizer application and local climate. This research is extremely useful for advancing efficient and sustainable agriculture globally, and even greater benefit could be accrued by linking this research through to a more complete view of human nutritional needs.
Previously, the DELTA Model® was developed and made accessible through an online platform to allow users to explore how future global food system scenarios would meet the nutritional needs of the global population for 29 essential nutrients (Smith et al., 2021; Sustainable Nutrition Initiative®, 2021). However, the initial version of the model did not include any consideration of the resources necessary to support food production in user scenarios, such as cropland.
Here, a mathematical model was developed to calculate the cropland requirement of a future global food production scenario. This model was then incorporated into the DELTA Model®, allowing cropland requirement to be weighed against the nutritional performance of future scenarios. The framework was used to examine 2018 global cropland production, use, and nutritional performance, and its ability to model future scenarios is demonstrated.
2. Materials and methods
2.1. The DELTA Model®
The contribution of crop foods to global nutrient supply was obtained from the DELTA Model® (version 1.3; Sustainable Nutrition Initiative®, 2021). This model was fully described by Smith et al. (2021), so only an outline of the relevant aspects is included here.
The DELTA Model® uses food balance sheet (FBS) data from the United Nations Food and Agriculture Organization (FAO) for global production of food commodities in 2018 (the most recent data currently included in the model) (FAO, 2020a). The total quantity of food commodities allocated to food use in this data set is adjusted to account for inedible portions [using food item-specific coefficients from various sources (Food and Agriculture Organization, 1989; United States Department of Agriculture Economic Research Service, 1992; Rodrigues et al., 2018)] and in-home waste [using coefficients reflecting food group wastage by global region (FAO, 2011)]. The remaining quantity of food available for consumption is converted to a total quantity of 29 available nutrients using food composition data (USDA, 2020). Finally, adjustments are made to the available protein and indispensable amino acid quantities to reflect their bioavailability in individual food items (FAO, 2013).
This calculation process (Figure 1) yields a global annual quantity of nutrients at the point of human consumption that can be compared to global nutrient requirements. The DELTA Model® was designed to allow scenario analysis out to 2050. For the purposes of this article, 2018 data is analyzed, and the scope to simulate future scenarios out to 2030 is presented. Only the contribution of crop food commodities to nutrient availability and cropland dynamics are presented here; animal-sourced foods and grazing land are not included.
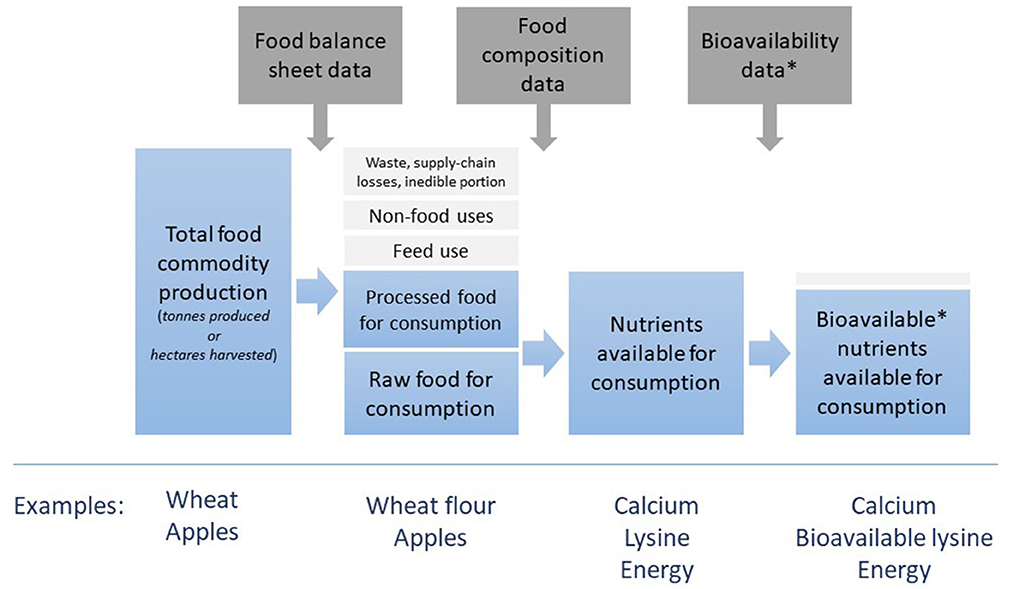
Figure 1. Illustration of the DELTA Model® calculation process. See section 2 for more detailed description. Some examples of food commodities, foods, and nutrients are shown for each stage of the calculation. Note that the calculation can be performed either in units of tons, or hectares of primary crop harvested. *Bioavailability coefficients are applied to protein and the indispensable amino acids only. Adapted from Smith et al. (2022b).
The DELTA Model® also uses the FBS mass allocations of each food commodity to final use. This allocation was adopted to calculate the cropland area dedicated to the various final uses. The six relevant FBS final uses are: food, animal feed, other uses (i.e., non-food, non-feed uses, such as biofuel production), processing, seed, and supply chain losses.
Here, we wished only to compare the cropland area dedicated to production of food, animal feed, and other uses. Thus, supply-chain losses and seed were assumed implicit, and not included in further calculations. All food commodities resulting from processing of a primary crop were included in the allocation of the primary crop. Finally, the proportion of the production of each food commodity allocated to food, feed, and other uses was used to identify the total area of cropland dedicated to each. A simplified example calculation is included in the Supplementary material. Thus, the total cropland area harvested for each crop was sub-divided into allocations to either human food, animal feed or other uses.
2.2. Land area calculations
The role of scenario models is to generate a range of possible futures that enable insights into the factors required for different potential outcomes. Whilst the nutrient supply that can be derived from a given set of primary food commodities is relatively determinate, the land area required for their production is subject to uncertainties and should be represented as a range of values, rather than a single point. As such, existing variability in crop yields around the world was used here to incorporate uncertainty into the model in a novel yield modeling approach.
Data for the harvested area and production mass in 2018 (the most recent available) of 137 primary agricultural crops, from 213 individual countries or territories, was obtained from the FAO online database (FAO, 2021).
The data was separated into individual crops and the list of countries producing each crop was ordered by yield (defined throughout this paper as the tons of crop produced per hectare of cropland). This allowed for calculation of overall global yield for each crop, and average yield of specific proportions of global production.
The ordered data was used to calculate the yields of the highest yielding 50 and 10% of global production, and the yields of the poorest yielding 50 and 10% of production (see Supplementary material for a graphical interpretation of this). On examination, the yield of the highest yielding 10% of production was considered not achievable in all parts of the world due to at least 30-fold differences between this value and the yield of the poorest yielding 10% of production for several crops.
For example, the highest yielding 10% of cashew nut production outperforms the global average by an order of magnitude, and outperforms the poorest yielding 10% by a factor of 30 (Table 1). Thus, achieving a global average yield of 9.38 tons per hectare does not appear feasible within the time scope of the DELTA Model®. In contrast, the variation in global soybean yields is relatively minor, meaning achieving a future global average yield equivalent to the 2018 yield of the highest 10% of production is more realistic. Wheat is also included in Table 1 as a crop with intermediate yield variation compared to cashew nuts and soybeans.
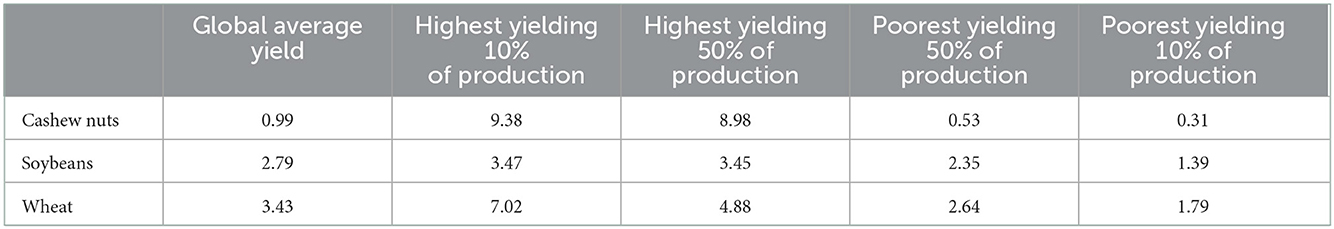
Table 1. Yield characteristics (tons per hectare) of selected global crop production in 2018, calculated using data from FAO (2021).
Beyond these examples, the degree of yield variation across the crops in the dataset was not consistent (Supplementary Figure S4). Following an analysis of yield variation for each individual crop in the dataset, it was assumed that the yield of the highest yielding 50% of production (hereafter referred to as HY) was a reasonable representation of an achievable global average yield by 2050 for most crops, although likely an underestimate for many staple crops. This assumption is discussed further in sections 2.2.2, 3.3.3, and 4, and could be updated as new data becomes available in the future to maintain relevance.
2.2.1. Production increases and decreases
The mathematical implementation of the model is fully described in the Supplementary material; an overview is given here. When predicting the land requirement of increases in crop production, the corresponding increase in land use was calculated assuming production at the global average yield (AY). To incorporate a range of uncertainty into these predictions, the calculation was also performed assuming increases in production at HY, or at the yield of the poorest yielding 50% of production (LY). This gives an expected cropland requirement, as well as an uncertainty range of cropland requirement needed to support the increase in production.
A similar approach was taken for decreases in production. It was calculated that any decreases may occur on land producing at AY, at HY, or at LY.
In a scenario of decreased crop production, the lower estimate for land area requirement is based on decreases at LY for a production decrease of up to 50%, after which HY is used for any further reduction. Conversely, the upper estimate for land area requirement in a scenario of decreased production is based on decreases at HY for a production decrease of up to 50%, after which LY is used for any further reduction. See the Supplementary material for graphical examples of these reductions.
To be compatible with the DELTA Model® visual outputs, it was necessary to aggregate individual crop data into nine crop groups (cereals, fruits, nuts, pulses, starchy roots, sugar, other plants, vegetables, and oilcrops). This was performed additively: upper bound estimates for the crop group are the sum of the upper bound estimates for all constituent crops, and similarly for lower bounds and the expected value.
2.2.2. Yield improvements
In addition to increases and decreases in production, it is also possible for the yield of existing land used to produce crops to increase or decrease its yield. Two possibilities for modeling this were considered.
The first approach is to apply a simple yield change coefficient to all existing yield values. For example, under the assumption that global yields for a crop will increase by 20%, the land area required to produce the same amount of the crop will decrease reciprocally to 83% of the original value. This coefficient can also be applied to upper and lower bounds when making predictions about changes to production quantity.
Whilst simple and transparent, this approach does not account for the extent to which yield of a crop is already approaching sustainable production limits, thus may result in unachievably high yield estimates if unconstrained yield change coefficients are used. Constraining these coefficients would require data for global yield gaps for all modeled crops, which are not currently available.
A second approach is to assume that HY constitutes a realistic estimate of the average yield that may be possible globally, as described above. The limitations of this assumption are presented in the section 4. A productivity improvement factor between 0 and 100% can then be applied, representing the proportion of production at LY that is improved to producing at HY. This approach was selected for use in this model. See the Supplementary material for a graphical example of this.
Let the “optimistic case” be defined as assuming 100% of LY land is improved to producing at HY. In this case, the optimistic global average yield is simply equal to the original HY. To calculate the upper and lower bounds in the optimistic case, the HY and LY for the optimistic case were calculated, i.e., the yield of the highest yielding 25% of original production, and the yield of the second-highest yielding 25% of original production. These values are used as the HY and LY for the optimistic case, and the upper and lower bounds on estimates can be calculated using these values. For productivity improvements of < 100%, a scaled linear combination of the original yield values and the optimistic case yield values are used.
3. Results
3.1. Global land use for crops
Figure 2 gives an overview of the 2018 crop production and cropland area reported by the FAO (2021), divided into nine major crop groups. These data capture the total mass of food commodities leaving the farm gate, so exclude harvesting losses (FAO, 2020a). Both production and area harvested were dominated by cereals. The next highest production crop groups were sugar and vegetables, whereas oilcrops had the next greatest area harvested after cereals.
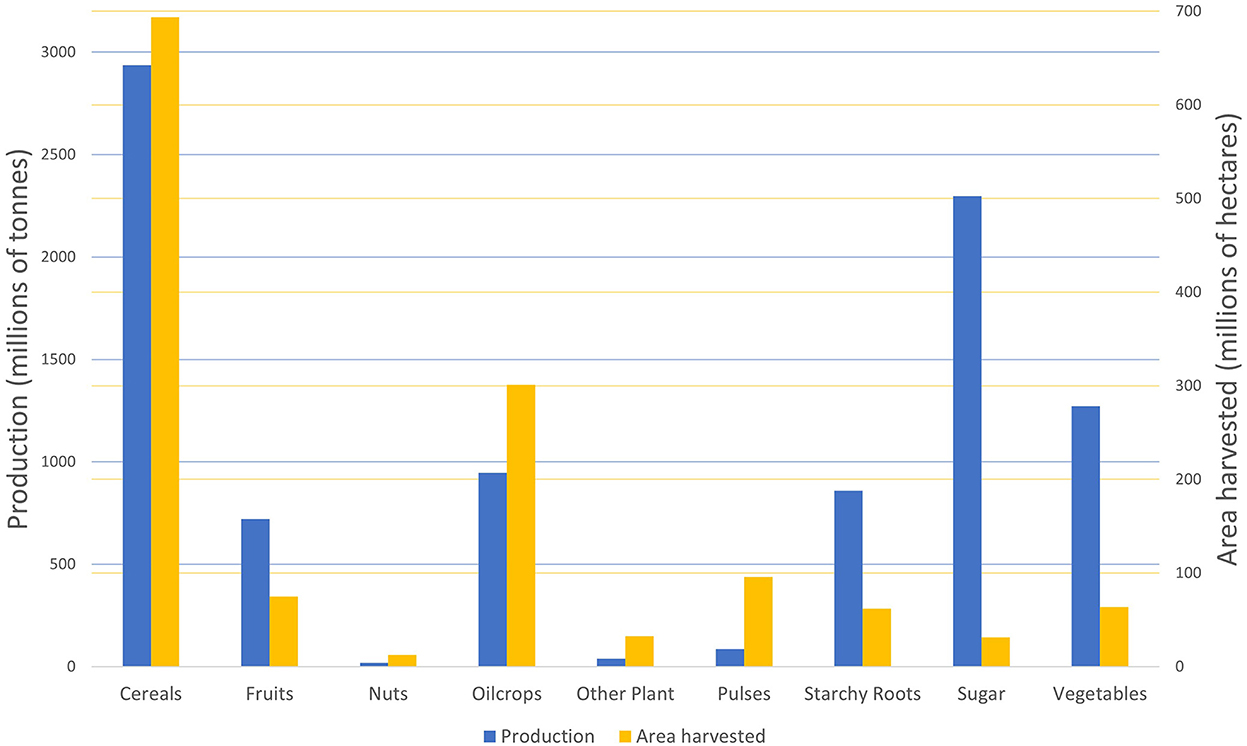
Figure 2. 2018 crop production and cropland area harvested by major crop group (FAO, 2021).
The uses of the produced crops varied between the food groups. The FAO FBS allocate crop commodity mass to end uses. Translating these allocations to the cropland area producing these commodities it was found that, of the overall cropland area in 2018, 66% was used to produce human food, 18% to produce animal feed, 14% to produce crops for other uses (e.g., biofuel production), and 1% was used to produce non-food crops (e.g., rubber).
However, note that this allocation method hides some information: for example, of the 795 million hectares of cropland allocated to human food production, around 12% was used to produce soyabeans. The production of soyabeans results in both soyabean products for human consumption and soyabean cake for animal feed, yet soyabean cake is not captured by the FBS as it is not considered a food commodity. Thus, the allocations above must not be interpreted as representative of the relative mass allocated to different uses, but rather the primary purpose of crop production, and exclusive of by-product use. The allocation breakdown for each crop group is shown in Table 2.

Table 2. Allocation of 2018 cropland area harvested to final use.
3.2. Current nutritional contribution of plant foods
Using the DELTA Model® (version 1.3; Sustainable Nutrition Initiative®, 2021), the contribution of crops to global nutrient availability from food in 2018 was established (Figure 3). These results are presented in tabular form in the Supplementary material.
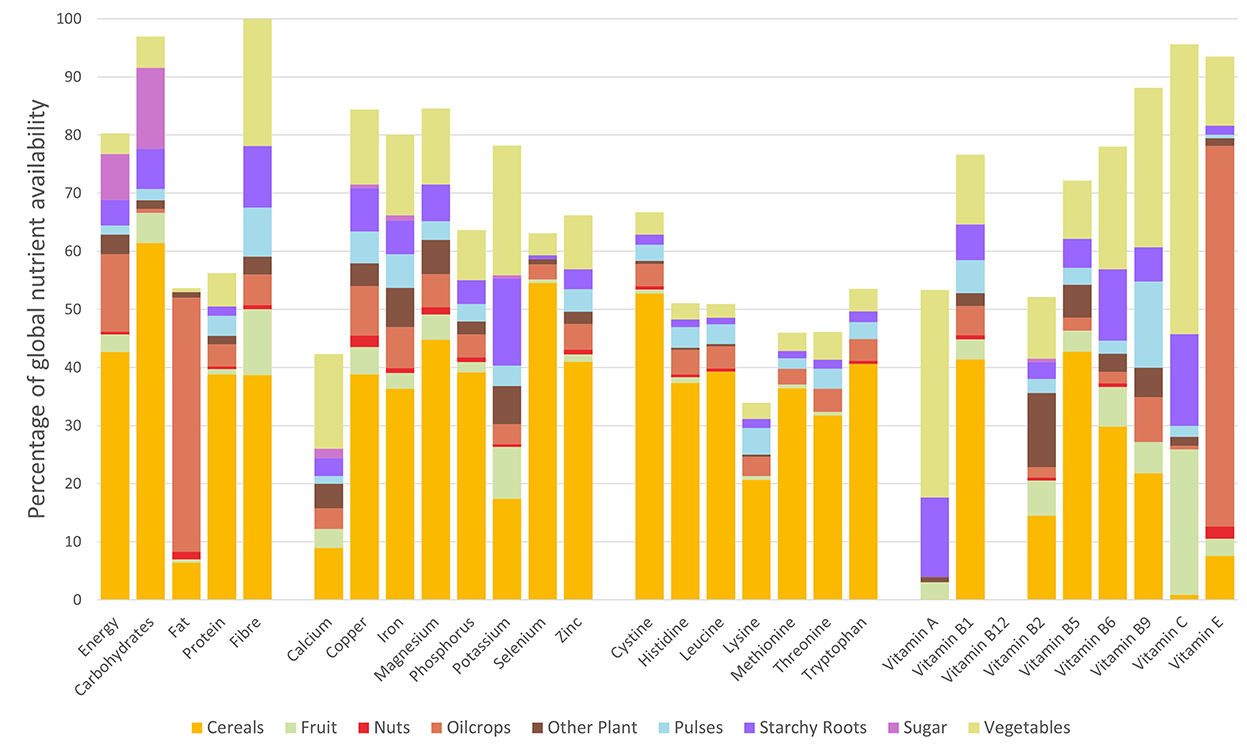
Figure 3. Contribution of plant foods to global nutrient availability. These values were calculated using the DELTA Model® (version 1.3; Sustainable Nutrition Initiative®, 2021), so have been adjusted for waste, inedible portions, and bioavailability as described in section 2.
Plant foods were responsible for at least 50% of global availability for most nutrients included in the model. The exceptions were calcium, vitamin B12 and the indispensable amino acids lysine, methionine, and threonine. Within the plant food groups, cereals were the major contributor to the availability of most nutrients, partly due to their high production totals: cereals constituted approximately one third of global crop mass leaving the world's farms. The exceptions to this were: fat and vitamin E, which were predominantly sourced from oilcrops; calcium, potassium, and vitamins A, B9, and C, to which vegetables were the greatest contributing group. The remaining crop groups (constituting 44% of global crop mass), had varying and comparatively minor contributions to global nutrient availability. Sugar crops, despite constituting 25% of 2018 crop mass, had a minimal impact on nutrient availability. This was due to a combination of the limited nutritional value of sugar crops, the high proportion of mass lost during processing, and the high proportion of mass directed to non-food uses, such as biofuel production.
3.3. Forecasting future changes in cropland requirement
To see the effect on predicted land requirement, global production of each major crop group was increased by 50% in the model. Following the calculation methodology, the predicted increase in land area required also increased by 50% for all crop groups, but the upper and lower estimates varied between groups. For most crop groups, the increase estimate ranged from ~ 25 to 75% above the 2018 total cropland area required for production. However, for the nuts group, the increase estimate ranged from 14 to 86%, reflecting the high global variability in nut crop yields. Contrastingly, the increase estimate for sugar crops ranged from 42 to 58%, due to the low global variability in yields of these crops.
3.3.1. Analysis of individual crops
The individual crop with the greatest potential for productivity gain when comparing HY with LY was cashew nuts: the LY/HY ratio for this crop was 0.06. This was followed by papayas (0.13), pistachios (0.18), and mushrooms and truffles (0.19). Papayas contributed around 2% of 2018 fruit production, while mushrooms and truffles were < 1% of vegetable production. In contrast, cashew nuts and pistachios together constituted around 40% of nut production in 2018, but the contribution of nuts to global nutrient availability was minor (Figure 2). Thus, these crops with low LY/HY ratios made relatively minor contributions to human nutrition. All other crops had an LY/HY ratio of at least 0.2.
Contrastingly, the individual crops with the least potential for productivity gain using the LY/HY ratio were cassava leaves (0.99; however, this only includes data from two countries: Congo and Colombia), cashewapple (0.97; includes data from four countries), and asparagus (0.91). Again, these crops at the other extreme of LY/HY ratio were minor contributors to global nutrient availability. The full list is included in the Supplementary material.
Using the productivity gains approach, the individual crops that showed the greatest potential for reduction of land use by improving poor yielding production could be investigated. Assuming all production at LY were improved to HY, the individual crops that would reduce their land footprints by the greatest amount were found. The crops at the top of this list were the major cereal crops: maize (reduction of 81 million hectares, or 42% of current land growing maize), wheat (63 million hectares, 30%), and rice (36 million hectares, 28%). These crops differ from those with the greatest potential for productivity gains as they occupy greater areas of land, hence have a greater potential for global cropland use reduction.
The increased production on the same land footprint that could be achieved if all production were improved to HY showed similar rankings. In this case, an extra 829 million tons of maize (72% increase), 312 million tons of wheat (42% increase), and 259 million tons of rice (38% increase) could be produced from the same land area as was used for these crops in 2018.
3.3.2. Analysis of crop groups
Table 3 shows the crop data aggregated to crop groups. The crop group with the greatest potential for productivity gains was nuts: the LY/HY ratio for this group was 0.16. This was followed by oilcrops (0.33) and other plant (0.33). Contrastingly, the crop groups with the least potential for productivity gain using this ratio were sugar (0.79) and vegetables (0.53).
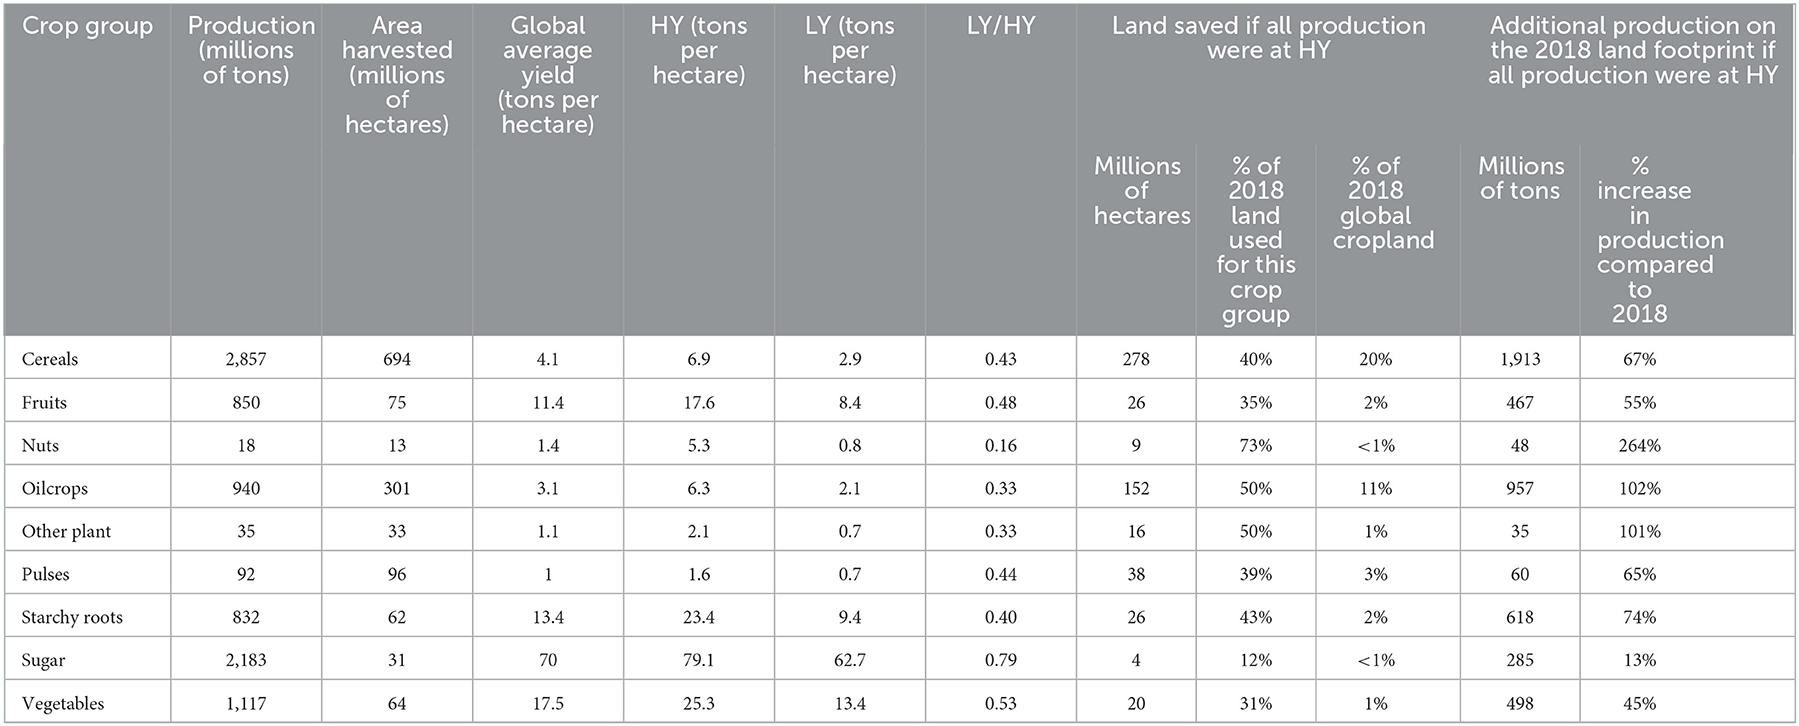
Table 3. Aggregated results by crop group for production, area harvested, yield and outcomes if HY were achieved for all crops globally.
Assuming all production at LY were improved to HY, the crop groups that would reduce their land footprints by the greatest amount were: cereals, with a possible reduction of 278 million hectares (40% of land currently producing cereals); followed by oilcrops (152 million hectares; 50%); and pulses (38 million hectares, 39%). At the other extreme, only 3.6 million hectares of sugar crop land would be saved (12%) and 9.1 million hectares of land producing nuts (although this constituted 73% of the land producing nuts in 2018).
The increase in production without increasing land footprint that could be achieved under global HY conditions was also dominated by the crop groups occupying the greatest land area. In this case, an extra 1.9 billion tons of cereals (67% increase), 957 million tons of oilcrops (102% increase), and 618 million tons of starchy roots (74% increase) could be produced from the same cropland area as was used for these crop groups in 2018.
3.3.3. Comparison to yield gap modeling
Several yield gap publications have calculated the potential increase in mass of specific crops if production were to achieve attainable or potential yields globally. Table 4 compares these estimates with the results found here.
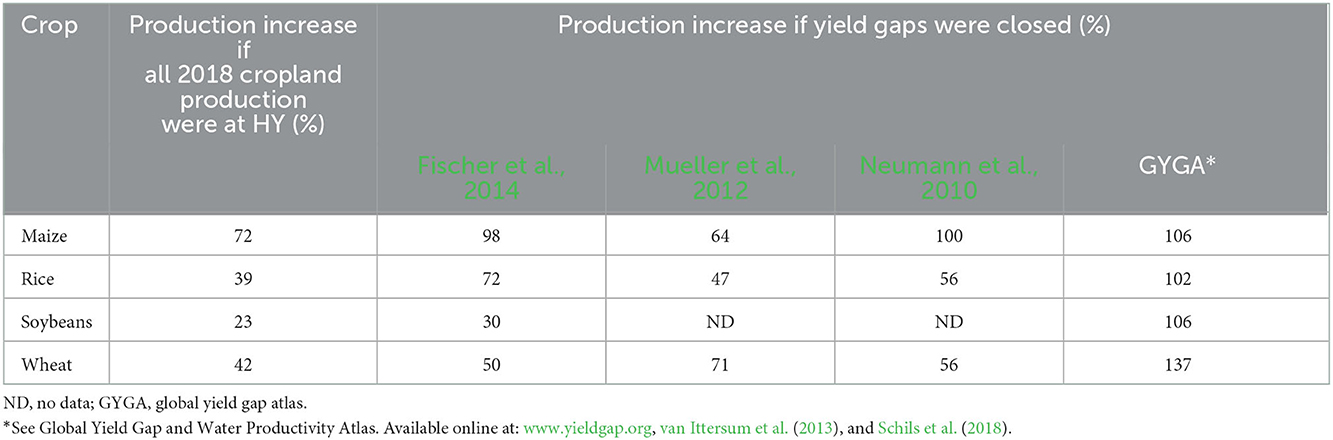
Table 4. Comparison of potential increase in production of specific crops calculated by differing sources using various methodologies.
The existing estimates use varying methodologies and data sources, and most rely on data recorded between 2000 and 2010, whereas this work uses 2018 data. The Global Yield Gap and Water Productivity Atlas is continuously updated and includes more recent data than the other publications used in this comparison.
The potential production increases calculated vary by 2–87% between the different yield gap analyses but are all greater than the potential increases calculated here, with the exception of the maize estimate from Mueller et al. (2012).
To check the sensitivity of these results to the definition of HY, the potential production increases were also calculated assuming HY represented the average yield of the best performing 10% of crop production, rather than the best 50%. In this instance, the potential production increases for rice (45%) and soy (24%) changed little. However, the increases for maize (101%) and wheat (105%) were significant, but still within the range observed in the literature.
3.3.4. Scenario example
To illustrate the use of the cropland area forecasting technique described here, it was implemented in the DELTA Model® framework to compare 2018 cropland requirement with 2030 cropland requirement if all crop production were to increase at the same rate as the forecast global population [i.e., increasing 12% from 7.6 billion people in 2018 to 8.5 billion people in 2030 (United Nations, Department of Economic and Social Affairs, Population Division, 2019)]. The results are shown in Figure 4.
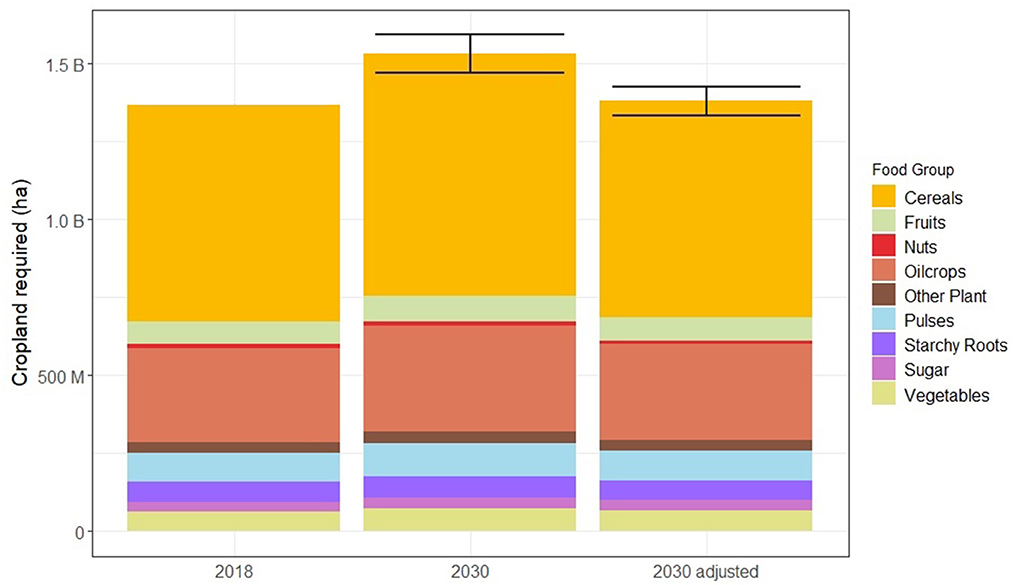
Figure 4. Comparing cropland requirement in 2018 with two simulated scenarios. The 2030 scenario shows predicted cropland requirement if all crop production were to increase by 12%, to match the population increase from 2018 to 2030. The 2030 adjusted scenario is identical, but 30% of LY production has been improved to HY. Error bars indicate the upper and lower bounds of the prediction.
The model predicted a matching 12% increase in cropland requirement over 2018 to support the increased production, with lower and upper bounds of 7 and 17% increases, respectively. However, improving 30% of global LY crop production to HY for all crops in this scenario was predicted to reduce cropland requirement to within 1% of the 2018 requirement. The upper and lower bounds for this estimate were a 4% increase and a 3% decrease compared to 2018, respectively.
The nutritional outcomes of these 2030 scenarios were similar to the 2018 scenario: under the assumption that non-food use of crops remained constant, per capita energy, protein, and fat availability would change by < 3%, as the population increase would be matched by increased crop production. The availability of most other nutrients changed by < 6% from 2018 levels. The exception was vitamin B12, per capita availability of which fell by ~ 10% due to being sourced almost exclusively from animal-sourced foods, production of which was held constant in this simulation.
4. Discussion
The DELTA Model® has been used to analyse the nutrient adequacy of current and future global food system scenarios (Smith et al., 2021; Sustainable Nutrition Initiative®, 2021). Broadening the scope of the model to include the cropland requirement of global food system scenarios, as detailed here, begins the task of including the resource footprints and environmental impacts of food production in the model. It also allows policy and research users to see the interrelationships and trade-offs between human nutrition and land use in future food production scenarios.
4.1. Analysis of findings
That crop production (and cereals in particular) should have a major role in the delivery of nutrition to the global population, as calculated here, is unsurprising. Also clear is the minor role of sugar crops in nutrition, despite their high contribution to global crop mass. However, sugar crops showed the least variation in yields of all crop groups. This is likely due to the dominance of sugar crop production by a few countries; for example, around 60% of global sugar cane is produced by Brazil and India. Sugar cane also uses C4 photosynthesis, increasing their photosynthetic, water, and nitrogen-use efficiency compared to crops using C3 photosynthesis, likely contributing to these minor yield variations compared to most food crops (Sage et al., 2013). Sugar crops occupy a relatively small land area at 31 million hectares (~2% of global cropland). Thus, although sugar crops are poor contributors to human nutrition, little cropland could be gained for production of other crops or alternative uses by reducing sugar production or by raising the productivity of poorer yielding sugar production to best practice.
Contrastingly, the production of both individual nut crops and the nut crop group showed wide variation in global yields. This is in part due to the dominance of production by individual nations. For example, the USA was responsible for 59% of global almond production on just 21% of the global area harvested for almonds, while Viet Nam produced 45% of cashew nuts on < 5% of the global area harvested. The remainder of production was sourced from a high number of low producing countries, meaning that HY largely reflects the performance of a single country. In these instances, it must be asked whether the performance of these dominant countries can be replicated by the rest of the nut-producing world, or whether the production in these high-yielding countries can be further increased.
It has been suggested that nut crops should be more widely produced and consumed due to their nutrient density and reduced carbon footprint, compared to many other protein sources (Clune et al., 2017; Afshin et al., 2019; Willett et al., 2019). However, others have raised concerns over the protein quality (Rutherfurd et al., 2014; Chalupa-Krebzdak et al., 2018; Wolfe et al., 2018) and high contributions to water use and water scarcity of nut production (Ridoutt et al., 2018; Sokolow et al., 2019). The results presented here pertain only to the yields of nut production, which show the greatest potential for improvement toward best practice of all crop groups.
However, the greatest potential for increasing food production on existing land was found for the staple crops. Although these crops showed smaller differences between HY and LY than nuts, the far larger areas of cropland dedicated to their production means that even minor gains in productivity would translate to large increases in production. However, whether increases in production of these crops should be targeted must be questioned. From a nutritional perspective, staple crops are high contributors to energy and macronutrient availability, as well as some specific minerals (e.g., iron, zinc). However, the DELTA Model® shows that it is micronutrients, rather than macronutrients, that are limiting global nutrient availability, and that the staple crops are not the densest sources of these nutrients (Smith et al., 2021; Sustainable Nutrition Initiative®, 2021). Other food groups, such as vegetables, nuts, and certain animal-sourced foods may be better options from the perspective of delivering global nutrient sufficiency.
A separate issue is the use of crops once harvested. Although the majority of all crop production modeled was allocated to human food use, more than a quarter of sugar crop mass and more than a third of oilcrop mass leaves the food system entirely for other uses, such as biofuel production (FAO, 2021). The efficiency of this cropland use for delivering nutrition is therefore poor, and this fact should be weighed against the benefits of these other uses.
The two future scenarios presented in Figure 3, one in which crop production increases with the population, and a second in which this occurs with a 30% productivity gain across all crop groups, are merely illustrations of the potential use of the model. It is almost certain that increases in production and changes to productivity will not be uniform across all crop groups in the future. However, the model can indicate the likely cropland requirement of future production systems, as well as showing the degree of uncertainty in these predictions.
4.2. Limitations
Due to the number of countries included in the analysis, we have not reported here results at a geographic level, such as where individual countries rank for production or yield of crops or crop groups. This would be a large exercise, beyond the scope of this work. This data is accessible online alongside the DELTA Model® (www.sustainablenutritioninitiative.com).
Uncertainty in estimating future cropland requirement stems from multiple factors. Crop yields are dependent on soil quality, crop genetics, weather, management practices, the rate of crop development, and several other factors. Moreover, these factors vary in importance between different crops. As such, forecasting the land required to produce a certain amount of a crop or crop group globally requires a high degree of generalization. The limitations of such top-down approaches are well-discussed in yield gap modeling, with the aggregation of localized, crop-specific, biophysical, bottom-up data to form a global picture presented as a more accurate approach (van Ittersum et al., 2013; Fischer et al., 2014; Rattalino Edreira et al., 2021). However, given the current absence of such data for many crops, top-down empirical approaches must suffice.
The FAO national crop production and area harvested data were chosen here for their broad coverage of global production and regular data updates, allowing for modeling estimates to be updated over time. However, the FAO data has several limitations. Data at a national level does not allow the variation at a sub-national level to be ascertained, which is high in some countries with regional variation in production practices and climate (Arata et al., 2020; Liu et al., 2021). There are also countries that are not included in the FAO dataset, and the quality of data included will vary between reporting authorities.
It should also be noted that solely 2018 crop data was used here. Others have analyzed temporal changes in crop yields using FAO and other datasets (see Arata et al., 2020 and references therein). These analyses are important for forecasting future changes to crop yields, which can be incorporated into cropland requirement forecasting.
To account for the variability in crop yields when forecasting increases and decreases in production in the future, the AY, HY, and LY for each crop was calculated. The choice of the average yield of the upper and lower yielding halves of production to represent bounds on predictions is worthy of discussion. Alternative choices, such as the highest and lowest yielding 10% of production as HY and LY [as has been used at regional and global scales for selected crops elsewhere (Licker et al., 2010; Laborte et al., 2012; Liu et al., 2021)], or specific bounds based on the yield characteristics of individual crops were considered, and compared to the results of yield gap analysis in section 3.3.3.
The choice of a 50% threshold for HY and LY was made due to the global resolution of the model and the diversity of crops included. The 10% thresholds used elsewhere were justified by a greater understanding of attainable yields, through the use of more localized data, often including climatic, management, and soil quality data. A similar approach here would have necessitated either the user or the model making decisions on the location of changes to production for the modeled crops. This added degree of complexity risked impairing the transparency of the model or the simplicity of its use, which were given greater priority due to the intended use of the model by a broad range of stakeholders. Improving low yields to HY was thus assumed attainable for most crops in most producing regions, regardless of fixed climatic and geographical constraints.
It is likely that for some crops, improving a large proportion of LY production to HY will not be possible. The highest yielding countries for a crop often have climatic, geographical, and technological advantages over the poorer yielding countries. Some of these barriers will be impossible to overcome, meaning that the modeled improvements will not be achievable. Even where such improvements are achievable, they may come with changes to management practices, such as higher use of fertilizers, pesticides, or irrigation. The trade-offs necessary to implement these practices, such as financial and environmental costs, should be considered in addition to yield outcomes (Fischer et al., 2014). As holistic a view of outcomes as possible is desirable when considering future changes to crop production. The method presented here does not capture all of these outcomes but was chosen as a transparent and intuitive generalizable approach.
As well as forecasting the cropland requirement of changes in total crop production, it was also necessary to consider the impacts of increasing crop yields on existing land. The approaches considered: linear increases to global average yields, or productivity gains via proportionally increasing land at LY to HY, each have advantages and disadvantages. While the former allows for yields to be achieved that are above current best practice due to future improvements in crop technology and management and is most analogous to existing yield gap approaches, the degree of possible improvement will vary between crops. The comparison of our results with those obtained in yield gap modeling in Table 3 demonstrates that, for the four major crops analyzed, our estimates of potential increases in production should be considered conservative. This is likely due to the fact that we do not allow for current high yielding production to be further improved, whereas previous yield gap analyses consider the possible improvement of all cropland more locally. The conservative nature of our estimates for the staple crops should not necessarily be extrapolated to other crops: there is a paucity of yield gap data for most food crops, preventing any conclusions on this.
Finally, the modeling approach presented here has not considered the varied characteristics of different cropland. The use of total cropland area as a metric has been criticized as not capturing the locally specific impacts of land use. Ridoutt and Navarro Garcia (2020) proposed metrics such as cropland scarcity, cropland malnutrition footprint, and cropland biodiversity footprint as alternatives that better capture the complexities of land suitability for specific crops. While these are powerful tools for local decision making, they were not included here due to the challenges of sufficient global data and intuitive ease of interpretation. Instead, the approach produced in this paper allows for rapid calculation and easy understanding of the implications of future changes to global food production on cropland use and its connection to human nutrition.
4.3. Recommendations for future study
Future work could use alternative methods for the consideration of specific crops, and indeed this approach has been taken by others. For example, Liu et al. (2021) considered China's total attainable maize and soy production if all production in each Chinese county was able to achieve the yields of the best performing 10% of production in that county. The use of the best performing 10% as the attainable level was considered appropriate given the individual crop and county resolution of the modeling approach. In contrast, given the global perspective of the modeling presented here, the best performing 50% was selected as a more appropriate estimate of an attainable global average.
As mentioned in the introduction, yield gap analysis is a common approach in researching future cropland requirement (Cassman et al., 2003; Lobell et al., 2009; Neumann et al., 2010; Mueller et al., 2012; Fischer et al., 2014; West et al., 2014; Hatfield and Beres, 2019; Rong et al., 2021). Frequently, average crop yields are found to plateau at around 80% of the potential yield, often due to the increasing financial costs of incremental production gains (Lobell et al., 2009; van Ittersum et al., 2013; Fischer et al., 2014). Using yield gaps in predictive modeling is limited by the availability of global data, which is only available for the most widely grown crops.
Previous research has shown that even staple crops such as wheat, maize and rice are not grown at full potential yields in the majority of producing countries (Lobell et al., 2009; Neumann et al., 2010; Hatfield and Beres, 2019; Rong et al., 2021). Thus, modeling linear yield increases may be appropriate for certain crops.
The method of productivity gains applied here does not allow for possible large improvements in attainable yields due to technological advancement. However, bringing global yields closer to best practice is more realistic when simultaneously considering all crop species. Future work could combine the approaches of linear increases in yield and the productivity gains presented here with consideration of yield gaps for individual crops.
Current and future reductions in the yields of certain crops in most parts of the world due to climate change have been identified, with particular focus on wheat, rice, maize, and soy (Lobell et al., 2011; Challinor et al., 2014; Zhao et al., 2017; Ray et al., 2019). It has been estimated that year-by-year climate variability already accounts for around a third of observed yield variability in major crop varieties (Ray et al., 2015); this variability may increase in many regions as climatic conditions diverge from previous averages. To model such future scenarios, linear decreases to crop yields or shifts of HY production to LY could be simulated. These approaches were beyond the scope of this work but should feature in future modeling.
Climate change is also likely to have an impact on the nutritional value of crops. Crops grown experimentally at elevated CO2 concentrations generally showed higher yields given sufficient nutrient and water availability, but also both positive and negative impacts on nutrient content (Myers et al., 2014; Dong et al., 2018). A full understanding of these impacts on nutrients in a wider range of crops would allow for these changes to be included in the nutritional calculations for future scenarios.
The FAO reported that cropland covered around 1.4 billion hectares in 2018, a rise of 20% since 2000 (FAO, 2020b). The potential for increasing cropland area without conversion of non-agricultural land lies largely in land currently used for animal grazing. It has been estimated that, of the close to two billion hectares of 2010 global grazing land, 685 million hectares was suitable for crops (Mottet et al., 2017). This sets an upper limit on cropland area (without conversion of non-agricultural land) of around 2.1 billion hectares, comparable to estimates elsewhere (Rockström et al., 2009; Henry et al., 2018). However, the conversion of grassland to crops would result in a reduction of available grazing land, with an impact on animal production. As implied by Figure 3, animal-sourced foods are major contributors to nutrient availability, particularly vitamin B12 from meat and calcium from dairy (Smith et al., 2022a,b). Any reductions in animal production due to cropland expansion may have consequences for nutrient availability from these sources. Moreover, further expansions in cropland are concerns for both biodiversity (Delzeit et al., 2017; Usubiaga-Liaño et al., 2019) and carbon balance (Engström et al., 2017). These factors must feature in any model attempting to capture the full scope of impacts of cropland expansion.
5. Conclusion
Forecasting the future dynamics of the global food system is clearly challenging given the high number and magnitude of the uncertainties involved. However, such forecasting will be key to inform shifts toward more sustainable crop production and achieving global nutrient adequacy. The modeling presented here allows for the simultaneous calculation of cropland footprint and nutrient availability in future scenario modeling. The insights generated by the DELTA Model® demonstrate the nutritional importance of current crop production and the potential cropland and nutritional outcomes of productivity gains in individual crops and crop groups. Unifying the nutritional value of production with the cropland area necessary to achieve it allows the sustainability of future food system scenarios to be assessed against both these criteria. The model should be used in future policy discussion and research to quantify the connections between human nutrition and land use, to avoid situations where one or the other is excluded from decision making.
Data availability statement
The original contributions presented in the study are included in the article/Supplementary material, further inquiries can be directed to the corresponding author.
Author contributions
NS, AF, JH, and WM conceived the idea for the research. NS and AF undertook the modeling and data analysis. All authors contributed to the writing and reviewing of the manuscript.
Acknowledgments
The authors thank the many international scientists who provided beneficial feedback on the cropland modeling in the DELTA Model®. We also thank Charlotte van der Lee and Sarah Golding for their inputs into the development of this model, and the Riddet Institute for their support of the research undertaken by the Sustainable Nutrition Initiative®. The authors thank the Global Yield Gap Atlas team for sharing relevant yield gap data.
Conflict of interest
AF and JH were employed by Fonterra Research and Development Centre. PM was employed by Manaaki Whenua Landcare Research.
The remaining authors declare that the research was conducted in the absence of any commercial or financial relationships that could be construed as a potential conflict of interest.
Publisher's note
All claims expressed in this article are solely those of the authors and do not necessarily represent those of their affiliated organizations, or those of the publisher, the editors and the reviewers. Any product that may be evaluated in this article, or claim that may be made by its manufacturer, is not guaranteed or endorsed by the publisher.
Supplementary material
The Supplementary Material for this article can be found online at: https://www.frontiersin.org/articles/10.3389/fsufs.2022.1063419/full#supplementary-material
Supplementary Data Sheet 1. Calculation methodology, calculation example, and supplementary figures.
Supplementary Data Sheet 2. Nutrient contribution of crop production to global nutrient supply.
Supplementary Data Sheet 3. Crop-level yield metrics.
References
Afshin, A., Sur, P. J., Fay, K. A., Cornaby, L., Ferrara, G., Salama, J. S., et al. (2019). Health effects of dietary risks in 195 countries, 1990-2017: a systematic analysis for the global burden of disease study 2017. Lancet 393, 1958–1972. doi: 10.1016/S0140-6736(19)30041-8
Arata, L., Fabrizi, E., and Sckokai, P. (2020). A worldwide analysis of trend in crop yields and yield variability: evidence from FAO data. Econ. Model. 90, 190–208. doi: 10.1016/j.econmod.2020.05.006
Cassman, K. G., Dobermann, A., Walters, D. T., and Yang, H. (2003). Meeting cereal demand while protecting natural resources and improving environmental quality. Annu. Rev. Environ. Resour. 28, 315–358. doi: 10.1146/annurev.energy.28.040202.122858
Challinor, A. J., Watson, J., Lobell, D. B., Howden, S. M., Smith, D. R., and Chhetri, N. (2014). A meta-analysis of crop yield under climate change and adaptation. Nat. Clim. Change 4, 287–291. doi: 10.1038/nclimate2153
Chalupa-Krebzdak, S., Long, C. J., and Bohrer, B. M. (2018). Nutrient density and nutritional value of milk and plant-based milk alternatives. Int. Dairy J. 87, 84–92. doi: 10.1016/j.idairyj.2018.07.018
Clune, S., Crossin, E., and Verghese, K. (2017). Systematic review of greenhouse gas emissions for different fresh food categories. J. Clean. Prod. 140, 766–783. doi: 10.1016/j.jclepro.2016.04.082
Delzeit, R., Zabel, F., Meyer, C., and Václavík, T. (2017). Addressing future trade-offs between biodiversity and cropland expansion to improve food security. Reg. Environ. Change 17, 1429–1441. doi: 10.1007/s10113-016-0927-1
Dietrich, J. P., Bodirsky, B. L., Humpenöder, F., Weindl, I., Stevanović, M., Karstens, K., et al. (2019). MAgPIE 4 – a modular open-source framework for modeling global land systems. Geosci. Model Dev. 12, 1299–1317. doi: 10.5194/gmd-12-1299-2019
Dong, J., Gruda, N., Lam, S. K., Li, X., and Duan, Z. (2018). Effects of elevated CO2 on nutritional quality of vegetables: a review. Front. Plant Sci. 9, 924. doi: 10.3389/fpls.2018.00924
Engström, K., Lindeskog, M., Olin, S., Hassler, J., and Smith, B. (2017). Impacts of climate mitigation strategies in the energy sector on global land use and carbon balance. Earth Syst. Dynam. 8, 773–799. doi: 10.5194/esd-8-773-2017
Engström, K., Rounsevell, M. D. A., Murray-Rust, D., Hardacre, C., Alexander, P., Cui, X., et al. (2016). Applying Occam's razor to global agricultural land use change. Environ. Model. Softw. 75, 212–229. doi: 10.1016/j.envsoft.2015.10.015
FAO (2011). Global Food Losses and Food Waste - Extent, Causes and Prevention. Rome: United Nations Food and Agriculture Organisation.
FAO (2013). “Dietary protein quality evaluation in human nutrition,” in FAO Food and Nutrition Paper (Auckland, NZ: United Nations Food and Agriculture Organisation). Available online at: https://www.fao.org/documents/card/en/c/ab5c9fca-dd15-58e0-93a8-d71e028c8282/
FAO (2020a). FAO Food Balance Sheets. United Nations Food and Agriculture Organization. Available online at: http://www.fao.org/faostat/en/#data/FBSH (accessed October 29, 2021).
FAO (2021). FAOSTAT. Available online at: : http://www.fao.org/faostat/en/#home (accessed April 20, 2020).
Fischer, R., Byerlee, D., and Edmeades, G. (2014). Crop Yields and Global Food Security: Will Yield Increase Continue to Feed the World? Canberra, ACT: ACIAR.
Food and Agriculture Organization (1989). Yield and Nutritional Value of the Commercially More Important Fish Species. Rome: FAO.
Hatfield, J. L., and Beres, B. L. (2019). Yield gaps in wheat: path to enhancing productivity. Front. Plant Sci. 10:1603. doi: 10.3389/fpls.2019.01603
Havlík, P., Schneider, U. A., Schmid, E., Böttcher, H., Fritz, S., Skalský, R., et al. (2011). Global land-use implications of first and second generation biofuel targets. Energy Policy 39, 5690–5702. doi: 10.1016/j.enpol.2010.03.030
Henry, R. C., Engström, K., Olin, S., Alexander, P., Arneth, A., and Rounsevell, M. D. A. (2018). Food supply and bioenergy production within the global cropland planetary boundary. PLoS ONE 13, e0194695. doi: 10.1371/journal.pone.0194695
Laborte, A. G., De Bie, K., Smaling, E. M. A., Moya, P. F., Boling, A. A., and Van Ittersum, M. K. (2012). Rice yields and yield gaps in Southeast Asia: past trends and future outlook. Eur. J. Agron. 36, 9–20. doi: 10.1016/j.eja.2011.08.005
Licker, R., Johnston, M., Foley, J. A., Barford, C., Kucharik, C. J., Monfreda, C., et al. (2010). Mind the gap: how do climate and agricultural management explain the ‘yield gap' of croplands around the world? Global Ecol. Biogeogr. 19, 769–782. doi: 10.1111/j.1466-8238.2010.00563.x
Liu, Z., Ying, H., Chen, M., Bai, J., Xue, Y., Yin, Y., et al. (2021). Optimization of China's maize and soy production can ensure feed sufficiency at lower nitrogen and carbon footprints. Nat. Food 2, 426–433. doi: 10.1038/s43016-021-00300-1
Lobell, D. B., Cassman, K. G., and Field, C. B. (2009). Crop yield gaps: their importance, magnitudes, and causes. Annu. Rev. Environ. Resour. 34, 179–204. doi: 10.1146/annurev.environ.041008.093740
Lobell, D. B., Schlenker, W., and Costa-Roberts, J. (2011). Climate trends and global crop production since 1980. Science 333, 616–620. doi: 10.1126/science.1204531
Molotoks, A., Stehfest, E., Doelman, J., Albanito, F., Fitton, N., Dawson, T. P., et al. (2018). Global projections of future cropland expansion to 2050 and direct impacts on biodiversity and carbon storage. Global Change Biol. 24, 5895–5908. doi: 10.1111/gcb.14459
Mora, O., Le Mouël, C., De Lattre-Gasquet, M., Donnars, C., Dumas, P., Réchauchère, O., et al. (2020). Exploring the future of land use and food security: a new set of global scenarios. PLoS ONE 15, e0235597. doi: 10.1371/journal.pone.0235597
Mottet, A., De Haan, C., Falcucci, A., Tempio, G., Opio, C., and Gerber, P. (2017). Livestock: On our plates or eating at our table? A new analysis of the feed/food debate. Glob. Food Sec. 14, 1–8. doi: 10.1016/j.gfs.2017.01.001
Mueller, N. D., Gerber, J. S., Johnston, M., Ray, D. K., Ramankutty, N., and Foley, J. A. (2012). Closing yield gaps through nutrient and water management. Nature 490, 254–257. doi: 10.1038/nature11420
Myers, S. S., Zanobetti, A., Kloog, I., Huybers, P., Leakey, A. D. B., Bloom, A. J., et al. (2014). Increasing CO2 threatens human nutrition. Nature 510, 139–142. doi: 10.1038/nature13179
Neumann, K., Verburg, P. H., Stehfest, E., and Müller, C. (2010). The yield gap of global grain production: a spatial analysis. Agric. Syst. 103, 316–326. doi: 10.1016/j.agsy.2010.02.004
O'Neill, B. C., Kriegler, E., Riahi, K., Ebi, K. L., Hallegatte, S., Carter, T. R., et al. (2014). A new scenario framework for climate change research: the concept of shared socioeconomic pathways. Clim. Change 122, 387–400. doi: 10.1007/s10584-013-0905-2
Popp, A., Calvin, K., Fujimori, S., Havlik, P., Humpenöder, F., Stehfest, E., et al. (2017). Land-use futures in the shared socio-economic pathways. Global Environ. Change 42, 331–345. doi: 10.1016/j.gloenvcha.2016.10.002
Rattalino Edreira, J. I., Andrade, J. F., Cassman, K. G., Van Ittersum, M. K., Van Loon, M. P., and Grassini, P. (2021). Spatial frameworks for robust estimation of yield gaps. Nat. Food 2, 773–779. doi: 10.1038/s43016-021-00365-y
Ray, D. K., Gerber, J. S., Macdonald, G. K., and West, P. C. (2015). Climate variation explains a third of global crop yield variability. Nat. Commun. 6, 5989. doi: 10.1038/ncomms6989
Ray, D. K., West, P. C., Clark, M., Gerber, J. S., Prishchepov, A. V., and Chatterjee, S. (2019). Climate change has likely already affected global food production. PLoS ONE 14, e0217148. doi: 10.1371/journal.pone.0217148
Ridoutt, B., and Navarro Garcia, J. (2020). Cropland footprints from the perspective of productive land scarcity, malnutrition-related health impacts and biodiversity loss. J. Clean. Prod. 260, 121150. doi: 10.1016/j.jclepro.2020.121150
Ridoutt, B. G., Hadjikakou, M., Nolan, M., and Bryan, B. A. (2018). From water-use to water-scarcity footprinting in environmentally extended input–output analysis. Environ. Sci. Technol. 52, 6761–6770. doi: 10.1021/acs.est.8b00416
Rockström, J., Steffen, W., Noone, K., Persson, A., Chapin, F. S. 3rd, Lambin, E. F., et al. (2009). A safe operating space for humanity. Nature 461, 472–475. doi: 10.1038/461472a
Rodrigues, S., De Oliveira Silva, E., and De Brito, E. S. (2018). Exotic Fruits: Reference Guide. London, UK: Academic Press.
Rong, L.-B., Gong, K.-Y., Duan, F.-Y., Li, S.-K., Zhao, M., He, J., et al. (2021). Yield gap and resource utilization efficiency of three major food crops in the world – A review. J. Integr. Agric. 20, 349–362. doi: 10.1016/S2095-3119(20)63555-9
Rutherfurd, S. M., Fanning, A. C., Miller, B. J., and Moughan, P. J. (2014). Protein digestibility-corrected amino acid scores and digestible indispensable amino acid scores differentially describe protein quality in growing male rats. J. Nutr. 145, 372–379. doi: 10.3945/jn.114.195438
Sage, R. F., Peixoto, M. M., and Sage, T. L. (2013). “Photosynthesis in sugarcane,” in Sugarcane: Physiology, Biochemistry, and Functional Biology, eds P. H. Moore and F. C. Botha, 121–154. doi: 10.1002/9781118771280.ch6
Schils, R., Olesen, J. E., Kersebaum, K.-C., Rijk, B., Oberforster, M., Kalyada, V., et al. (2018). Cereal yield gaps across Europe. Eur. J. Agron. 101, 109–120. doi: 10.1016/j.eja.2018.09.003
Smith, N. W., Fletcher, A. J., Dave, L. A., Hill, J. P., and Mcnabb, W. C. (2021). Use of the DELTA model to understand the food system and global nutrition. J. Nutr. 151, 3253–3261. doi: 10.1093/jn/nxab199
Smith, N. W., Fletcher, A. J., Hill, J. P., and Mcnabb, W. C. (2022a). Modeling the contribution of meat to global nutrient availability. Front. Nutr. 9, 766796. doi: 10.3389/fnut.2022.766796
Smith, N. W., Fletcher, A. J., Hill, J. P., and Mcnabb, W. C. (2022b). Modeling the contribution of milk to global nutrition. Front. Nutr. 8, 716100. doi: 10.3389/fnut.2021.716100
Sokolow, J., Kennedy, G., and Attwood, S. (2019). Managing crop tradeoffs: a methodology for comparing the water footprint and nutrient density of crops for food system sustainability. J. Clean. Prod. 225, 913–927. doi: 10.1016/j.jclepro.2019.03.056
Sustainable Nutrition Initiative® (2021). Available online at: www.sustainablenutritioninitiative.com (accessed October 29, 2021).
United Nations Department of Economic and Social Affairs, Population Division. (2019). World Population Prospects 2019: Data Booklet (ST/ESA/SER.A/424). New York, NY.
United States Department of Agriculture Economic Research Service (1992). Agricultural Handbook Number 697, Weights, Measures, and Conversion Factors for Agricultural Commodities and Their Products. Washington, DC: United States Department of Agriculture.
USDA (2020). FoodData Central. Available online at: https://fdc.nal.usda.gov/download-datasets.html (accessed August 21, 2020).
Usubiaga-Liaño, A., Mace, G. M., and Ekins, P. (2019). Limits to agricultural land for retaining acceptable levels of local biodiversity. Nat. Sustain. 2, 491–498. doi: 10.1038/s41893-019-0300-8
van Ittersum, M. K., Cassman, K. G., Grassini, P., Wolf, J., Tittonell, P., and Hochman, Z. (2013). Yield gap analysis with local to global relevance—A review. Field Crops Res. 143, 4–17. doi: 10.1016/j.fcr.2012.09.009
von Braun, J., Afsana, K., Fresco, L., and Hassan, M. (2021). Science for Transformation of Food Systems: Opportunities for the UN Food Systems Summit. Rome: United Nations Food Systems Summit.
Wang, X., Dietrich, J. P., Lotze-Campen, H., Biewald, A., Stevanovi,ć, M., Bodirsky, B. L., et al. (2020). Beyond land-use intensity: assessing future global crop productivity growth under different socioeconomic pathways. Technol. Forecast. Soc. Change 160, 120208. doi: 10.1016/j.techfore.2020.120208
West, P. C., Gerber, J. S., Engstrom, P. M., Mueller, N. D., Brauman, K. A., Carlson, K. M., et al. (2014). Leverage points for improving global food security and the environment. Science. 345, 325–328. doi: 10.1126/science.1246067
Willett, W., Rockström, J., Loken, B., Springmann, M., Lang, T., Vermeulen, S., et al. (2019). Food in the anthropocene: the EAT-Lancet commission on healthy diets from sustainable food systems. Lancet 393, 447–492. doi: 10.1016/S0140-6736(18)31788-4
Wolfe, R. R., Baum, J. I., Starck, C., and Moughan, P. J. (2018). Factors contributing to the selection of dietary protein food sources. Clin. Nutr. 37, 130–138. doi: 10.1016/j.clnu.2017.11.017
Zabel, F., Delzeit, R., Schneider, J. M., Seppelt, R., Mauser, W., and Václavík, T. (2019). Global impacts of future cropland expansion and intensification on agricultural markets and biodiversity. Nat. Commun. 10, 2844. doi: 10.1038/s41467-019-10775-z
Keywords: global food system, food security, computational modeling, human nutrition, sustainability
Citation: Smith NW, Fletcher AJ, Millard P, Hill JP and McNabb WC (2022) Estimating cropland requirements for global food system scenario modeling. Front. Sustain. Food Syst. 6:1063419. doi: 10.3389/fsufs.2022.1063419
Received: 07 October 2022; Accepted: 01 December 2022;
Published: 16 December 2022.
Edited by:
Bradley George Ridoutt, Commonwealth Scientific and Industrial Research Organisation (CSIRO), AustraliaReviewed by:
Thierry Brunelle, Centre de coopération internationale en recherche agronomique pour le développement, FranceKai Huang, Beijing Forestry University, China
Copyright © 2022 Smith, Fletcher, Millard, Hill and McNabb. This is an open-access article distributed under the terms of the Creative Commons Attribution License (CC BY). The use, distribution or reproduction in other forums is permitted, provided the original author(s) and the copyright owner(s) are credited and that the original publication in this journal is cited, in accordance with accepted academic practice. No use, distribution or reproduction is permitted which does not comply with these terms.
*Correspondence: Nick W. Smith,  bi53LnNtaXRoQG1hc3NleS5hYy5ueg==