 Pietro Tonini
 Pere Muñoz Odina
 Francesco Orsini
 Xavier Gabarrell Durany
94% of researchers rate our articles as excellent or good
Learn more about the work of our research integrity team to safeguard the quality of each article we publish.
Find out more
ORIGINAL RESEARCH article
Front. Sustain. Food Syst., 22 December 2022
Sec. Sustainable Food Processing
Volume 6 - 2022 | https://doi.org/10.3389/fsufs.2022.1043591
This article is part of the Research TopicFood Loss and Waste Management, From the Grave to the Cradle: A New Resource for the WorldView all 5 articles
Introduction: Reduction of food loss in the horticultural sector is critical to simultaneously support the transition toward a diet with higher consumption of vegetables and the achievement of policy goals aimed at halving the quantity of wastage by 2030. However, the lack of precise information and the presence of múltiple interconnected factors makes it difficult to assess the potential socioeconòmic benefits and therefore the decision-making process of food loss reduction strategies.
Methods: A case study approach has been used to assess the econòmic loss and nutrional impact of food loss in the horticulture primary production. The selection of the main vegetable products was based on an historical series while econòmic and nutritional impact were estimated starting from national and European indicator.
Results: The food loss correspond to 26% of the total production and 14% of the total agricultural production econòmic value. The social analysis confirm the possibility of redistributing food loss among the population even in the most critical months and areas.
Discussion: The combination of social and econòmic indicator resulted essential to provide key information at the decision-making level to pave the way for the elaboration of short- and long-term food loss reduction strategies. Indeed, no single-bullet strategy can be applied to overcome the problem of food loss as many actor with different needs are involved.
As a source of essential nutrients and fiber, vegetables are crucial components of healthy diets, e.g., reducing the risk of cardiovascular disease, type 2 diabetes, cancer, and obesity, among others (Gakidou et al., 2018). Recently, the EAT-Lancet Commission on Food, Planet, and Health released the Planetary healthy diet, promoting the consumption of 300 grams of non-starchy vegetables per day (Willett et al., 2019), and the World Health Organization (WHO) recommended a minimum daily intake of vegetables and fruits of 400 grams per person (WHO/FAO, 2004). However, their importance in human nutrition and global vegetable intake remains low, particularly in low-income households and among young people (Micha et al., 2015), making it a political priority to increase vegetable intake during the coming decades. However, the promotion of consumption must consider the high degree of the perishability of these products to ensure their supply and not generate negative impacts. Indeed, the vegetable sector is responsible for the highest quantity of food waste and loss originating at the global (Gustavsson et al., 2013), regional (Caldeira et al., 2019), and national levels, as, for instance, in Spain (Garcia-Herrero et al., 2018) and France (Redlingshöfer et al., 2017). Therefore, the reduction of food waste and loss in the vegetable sector is critical to envisage a sustainable diet and achieve policy goals to halve the quantity of wastage by 2030 (United Nations, 2015; European Commission, 2020). Among the steps of the value chain, the agricultural sector is characterized by the highest quantity of food loss available (Garrone et al., 2014), which raises concerns about possible strategies to reintegrate into the food value chain (Facchini et al., 2018). However, the difficulties in the quantification process and the multiple triggering factors affecting the system hamper the development of strategies in primary production (Stenmarck et al., 2016). The high variability of the results is related to the lack of harmonization in the definition (Fabi et al., 2021) and the different scopes and quantification methods applied (Corrado and Sala, 2018) in the literature. In particular, the main differentiating elements are when the product is considered food and if the analysis should consider the food as a whole (i.e., resource efficiency) or just the edible part (i.e., nutritional efficiency). In addition to the high variability of the literature, the factors that lead to the generation of food loss are external to the producer's controls, making it hard to forecast the quantity from one season to the other (Parfitt et al., 2010). Canali et al. (2017) identified three typologies of causes based on the producer's ability to act as inefficiencies at the business/consumer level (i.e., Micro causes), disorganization of the value chain (i.e., Meso causes), and the systemic problems that affect the food system (i.e., Macro causes). Among them, Diaz-Ruiz et al. (2018) selected the strict regulation of food quality and appearance, market saturation, and technical inefficiencies as the main causes within the primary production stage. These multitudes of triggering factors and the annual variability of food loss make crucial the identification of hot spot areas and periods where prioritize data collection and interventions. An intuitive and rapid characterization of the context can be made based on the market orientation of the vegetable system through the relationship between consumption and production. As seen from Figure 1, in European countries, Mediterranean countries such as Spain, Italy, and the Netherlands are characterized by the highest imbalance between production and consumption and thus are prioritized for food loss strategies.
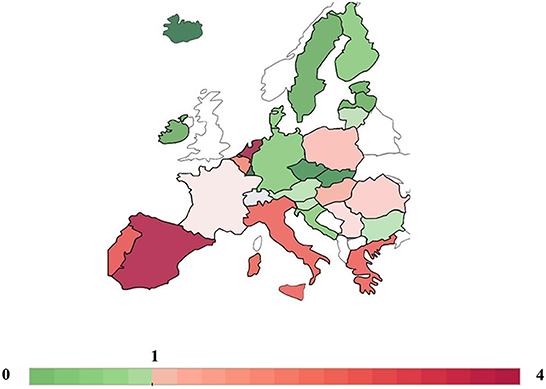
Figure 1. Identification of the exporting (red) and domestic-supply (green) countries in the European community based on the relationship between the consumption per capita of vegetables (excluding potatoes) in Europe (EEA, 2017) and the amount of product harvested per person in 2020 (EUROSTAT, 2020) (author source).
The several causes and actors involved in food loss make it difficult to assess socioeconomic benefits. The difficulties are related to the conflicts between different policy goals, such as a reduction in resource stress (Kuiper and Cui, 2021), increases in farm welfare, and enhanced food security (de Gorter et al., 2021). Following the rule of supply and demand, the increased availability of the product due to reduced food waste would negatively impact the crop's price and therefore the farmer's profit. However, the decrease in product availability in the market would positively affect the agricultural price with a negative impact on food cost and thus food security. Furthermore, the achievement of net impact in economics and society is hindered by the potential cascade effect on other value chains, external markets, and territories not involved in the food loss reduction strategies. The degree of the cascade effect is affected by the price elasticity of supply and demand and how price effects are transmitted vertically (i.e., within the value chain) and horizontally (i.e., across countries) (Cattaneo et al., 2021). For this reason, the weighting of the private and public costs and the benefit of potential intervention from food loss reduction is fundamental to facilitating collaborative work within the actors involved in the value chain (Filimonau and Ermolaev, 2021). Regarding the economic impact, the assessment of the magnitude of the profit loss has been calculated for one specific value chain (WRAP, 2017) or at the agricultural level (Kotykova and Babych, 2019) to target the investments and incentives where they are most needed and where the potential for improvements is the greatest. However, the indicator number of meals wasted per person (Cooper et al., 2018) or per quantity of nutritional value lost (Chen et al., 2020) has been used to identify the social impact of food loss in different areas. However, further quantitative evidence needs to be included within the analysis to envisage the achievement of a plant-rich diet and the reduction of the losses in the food system. To address this problem, the research aimed to provide different quantitative socioeconomic evidence that can be used in a complementary way to facilitate the decision-making process in food loss strategies. The present study was focused on Catalonia, Spain, which recently introduced a pioneer regulation in Europe aimed to foster the recollection of data on food loss and facilitate food donations for social purposes (Parlament de Catalonia, 2020). The geographical scope was provided to encompass the cultural and agronomic characteristics of the area analyzed (Wiskerke and Carey, 2015). Additionally, the case-study approach helps to give a greater understanding of a real-world case by implying the involvement of important contextual conditions related to the analyzed case (Yin and Davis, 2007). The research proposes a systematic process to select the crops and to identify temporal (i.e., month) and spatial (i.e., province) hotspots based on the social and economic variables. The analysis overcomes the previous economic studies providing a clear distinction between the economic value of commercial and edible-but-not-commercial vegetables to estimate the cost and benefit ratio. In addition, the consumption of the specific vegetable product was assessed to further advance the feasibility of changing dietary habits within a population to mitigate food loss at a regional level. Finally, the methodological process emphasizes which data were needed and how to obtain them to analyze food loss in the horticultural sector considering the annual variability of the phenomenon and the diversity of production systems around the world.
The following paragraphs describe the case study (2.1), define the food loss (2.2), the methodology applied to select the main vegetable products and the quantification process for the food loss at the primary production stage (2.3). After that, the economic benefit (2.4) and social impacts (2.5) were assessed to identify the most critical products, months, and provinces.
The Catalonia region is an autonomous community of Spain located in the northeastern Iberian Peninsula (Figure 1). The official population of Catalonia is ~7 million, divided into four provinces characterized by different population densities: Barcelona (743 people/km2), Girona (132 people/km2), Lleida (36 people/km2), and Tarragona (129 people/km2) (IDESCAT, 2020). Due to its location in the western Eurasian continent, the climate is mainly the Mediterranean, characterized by mild winters and hot and dry summers with daily annual irradiation of 14.5 MJ (ICAEN, 2000). The geographical variety of the area leads to ample variation in the annual mean temperatures throughout the year, from 0C to 17°C, and precipitation, from 400 to 1,200 mm (Vide, 1992). The final vegetable production reported in 2020 has a total economic value of 144 million euros (9% of the total final agricultural production), mainly generated in the provinces of Barcelona and Tarragona (75% of the hectares used). Figure 2 shows the relationship between the production and consumption of vegetables in the four provinces of Catalonia. The highest recorded imports are notably June, July, August, and December, and the region is a net importer of vegetable products of tomato, cabbage, and cauliflower. In particular, the province of Barcelona is responsible for almost two-thirds of all imports; Tarragona is a net exporter, while in Girona and Lleida, imports and exports are balanced (e.g., Girona and Lleida) (IDESCAT, 2021).
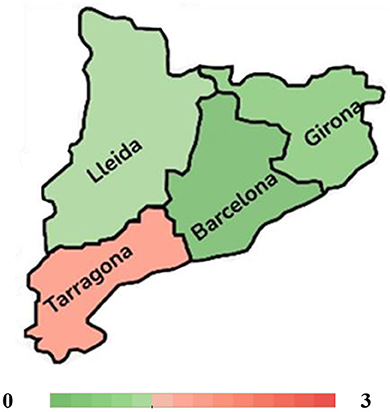
Figure 2. Identification of the exporting (red) and domestic-supply (green) provinces in Catalonia based on the relationship between the consumption per capita of vegetables (excluding potatoes) in Catalonia (MAGRAMA, 2014) and the amount of product harvested per person in 2020 (DARP, 2020) (author source).
Food loss refers to the quantity of crop that was originally produced for human consumption but then directed to non-food use or waste disposal (e.g., feed for animals, biomass input to waste treatment, disposal in a municipal solid waste incinerator) (HLPE, 2014). The starting point was set when the plant was “ready to harvest”, including in the food loss definition the product not harvested and stopped before the postharvest operations.
Currently, the global food loss index selects the 10 most important vegetables based on the mass for each country to perform the quantification (FAO, 2019). However, this methodology may rule out important crops due to external factors such as market demand and local climate (Beausang et al., 2017) that can affect the total amount of production. To avoid this issue, the crops included in this research have been identified as the lowest common denominators of a time series applying different percentiles to the yearly vegetable production. Since the decision of the percentile depends on the level of detail of the analysis, the 30th, 40th, 50th, 60th, 70th, 80th, and 90th percentiles were selected to observe how the number of products and the mass percentage of selected vegetable production changed. The time series selected had durations of 1, 3, 6, and 9 years to observe how the number of products and percentage of selected vegetable production changed. The year 2020 was used as a reference for the analysis, and the time series were created as follows: 1 year (i.e., 2020), 3 years (i.e., 2020–2018), 6 years (2020–2015), and 9 years (2020–2012).
The quantification of food loss has been estimated at provincial and regional levels based on agricultural production. Agricultural production is defined as the sum of the overall production, including food loss, self-consumption, and products sold1 Food loss is calculated and divided based on the causes of its generation, such as unharvested products (Avoidable Loss), quality sorting (Possibly Avoidable Loss), and technical problems (Unavoidable Loss) (Quested and Johnson, 2009). Data relating to avoidable food loss (AVL) have been retrieved from field quantitative studies (Hartikainen et al., 2018; Johnson et al., 2018; Baker et al., 2019). The methodology applied was based on random soil sampling and aims to quantify the commercial and non-commercial crops left in the harvested fields. The Possibly Avoidable food Loss (PAL), food loss value has been estimated through face-to-face interviews with a company representative, typically a field manager or an agronomist. The farms involved in the present research were proxies of the long supply chain, a globalized production model that mobilizes many intermediaries. These initiatives have a conventional production system and sell to large distributors or organizations of producers, thus representing most of the horticultural producers in Catalonia and Europe. The well-structured production system and the systematic organization of the sales that characterize these farms ensure more reliable data on food loss (Delgado et al., 2017), limiting the underestimation of food loss commonly in qualitative assessments (Baker et al., 2019). Finally, the results of the focus group discussion conducted by the Ministry of Agriculture, Fishery, Livestock, and Environment in collaboration with 100 farmers aimed to assess the loss generated during the harvest were taken for the Unavoidable food Loss (UVL). A single value of 5% based on a scenario of optimal production using the current best available technology for harvest in Spain was applied for all the crops selected. The data are consistent with the only other value found in the literature (Beretta et al., 2013). The percentages of food loss provided in this research refer to the marketed yield obtained by the subtraction between total agricultural production and the amount of self-consumption provided by the Department of Agriculture, Livestock, Fisheries and Food (DARP, 2020). Monte Carlo analysis has been applied to provide a probabilistic approach in the research and realized a sensitivity analysis (Raychaudhuri, 2008). The probability of minimum and maximum values followed a normal distribution in which the data used in the analysis have a 40% probability of occurring. Finally, the allocation per month was realized based on the percentage of harvested product disaggregated per product and province implemented at the national level (MAPA, 2019). The study was based on a qualitative assessment in collaboration with the most important organization of producers and cooperatives in Spain.
The economic value of the products has been estimated by multiplying the quantity of food loss and its economic value. Different economic values have been given to marketable products (AVL, UVL) and unmarketable products (PAL). The price perceived at the farm level has been assigned to AVL and UVL as the product fit with trade regulations (GENCAT, 2021). The perceived price does not include transport costs, the subsidies that farmers may receive, conditioning, or the indirect taxes or fees that may affect the transactions. However, for PAL, the economic value was equal to the cost of production of the horticultural product, as the product was not marketable. The unit costs of production (€/Kg) were calculated by dividing production cost per hectare available for tomatoes, onions, and general vegetables (XCAC, 2019) by the agricultural yield. Each crop production cost refers to the sum of the production factors needed to carry out the activity, such as fertilizers, pesticides, water, seeds and plants, labor, and plot rent. Detailed information on the unit cost of production per crop per province is provided in Supplementary Table S1.
The economic value of food loss (EVFL) came from Equation (1).
where:
AVSj,i = avoidable food loss of product j in province i.
PASj,i = possibly avoidable food loss of product j in province i.
Pxj,i = price perceived by the farmer of product j in province i during 2020.
cost of production of product j in province i during 2020.
The economic value of food surpluses was used to estimate the benefits of promoting alternative channels for the sale of edible food, improving the match between supply and demand and the investment in new technologies and methodologies for crop harvest. To estimate the magnitude of the investment compared to the value of horticultural production, the economic benefit generated by food loss reduction strategies was divided per the final horticultural production in Catalonia in 2020 (IDESCAT, 2022). Final vegetable production is a European indicator obtained by adding subsidies to the price received by the producer of the product free of tax during the accounting period and before processing2.
The rationale for this analysis was to highlight the potential contrast between the policy of reducing food losses and the ability of the population to increase the consumption of a specific vegetable product. The Meal Days wasted (MD) indicator was selected to identify the social impact of food loss generation corresponding to the number of wasted purchased days of a specific basket of product for the entire population in a selected area (Cooper et al., 2018). This indicator was based on the edible fraction of the food loss available for consumption and the amount of vegetable product purchased. The fraction of edible and inedible products was calculated based on the data provided by the National Institute of Nutrition (Fundación Española de la Nutrición, 2018). A percentage of food loss equal to 17% along the food value chain has been applied to the total amount of food loss to estimate the potential amount of vegetable product available for consumption (Gustavsson et al., 2013). The purchase of the vegetable product was calculated from the annual Spanish national purchase survey based on 12000 households, of which 14% were from Catalonia (MAPA, 2019). Finally, 13% of food waste is applied to the potential amount of vegetables available for consumption (De Laurentiis et al., 2018) to assess the increase in vegetable intake in the population. The feasibility of the increase in consumption has been assessed considering the recommended 300 grams of vegetable intake per day provided by the planetary diet (Willett et al., 2019).
The analysis of the historical series identified the 70th percentile and the time series of 3 years and the minimum number of years to be considered for the identification of 11 vegetable products accounting for 77% of total vegetable production (i.e., 185,000 million tons) in Catalonia during 2020 (Figure 3).
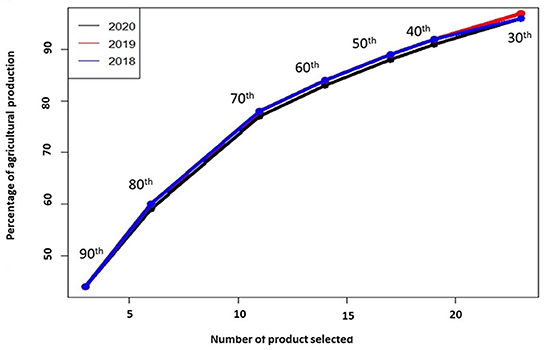
Figure 3. Comparison between the number of products and share of total horticultural production in the time series of 3 years (2020–2018).
The selection of this percentile was done because after this percentile, the agricultural mass added by each product was below or equal to 5% with respect to the contribution of 5–10% and 15–20% in the previous percentile. The results highlighted the concentration of the agricultural mass in three products (i.e., 90th) and 4–6 products (i.e., 80th), representing 44–47% and 59–63% of the total agricultural mass.
The 1-year time series was discarded because applying the 70th percentile results in more product (i.e., 13) and a slight increase in the percentage of vegetable production covered (81%), while no differences were detected between the 3-year time series and the other time series. The results highlighted the importance of carrying out crop selection based on a time series of at least 3 years to avoid the inclusion and exclusion of crops due to external drivers such as price increases or severe weather damage. More information on the analysis of the time series and a percentile is included in Supplementary Tables S3–S5. The eleven crops identified for the analysis were cabbage, lettuce, watermelon, pumpkin, zucchini cucumber, tomato, artichoke, cauliflower, onion, and green bean. Table 1 shows the food loss indicator collected for the present study resulting from the literature review (AVL) and the qualitative data collection (PAL) carried out for the analysis.
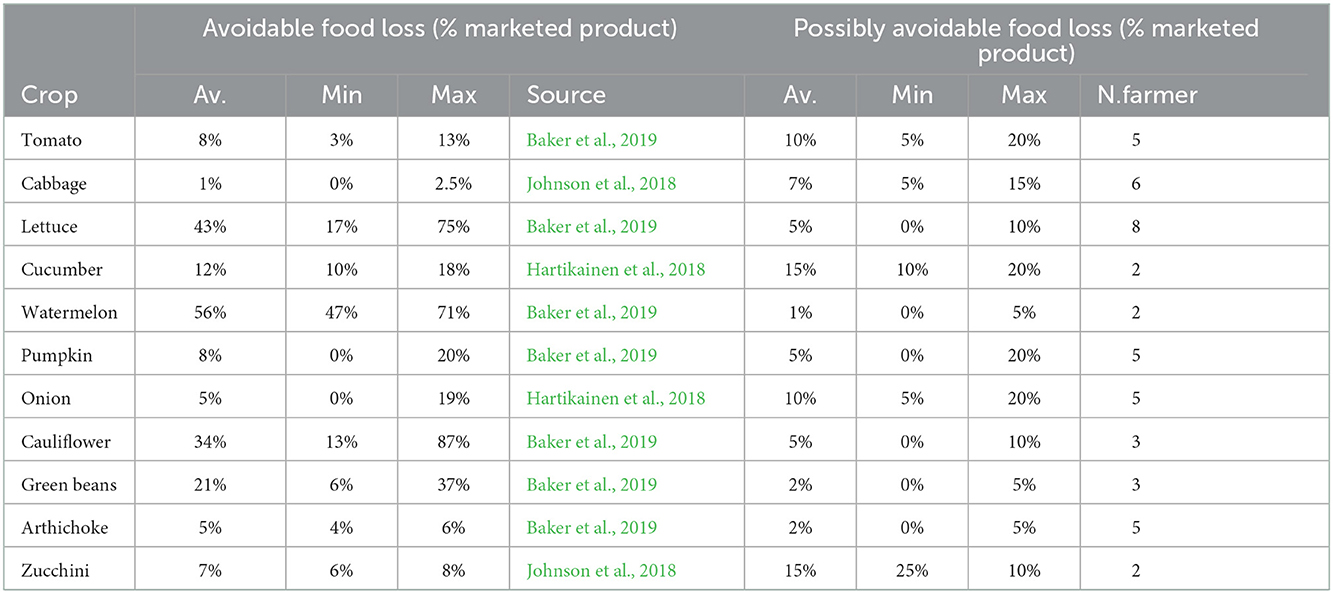
Table 1. Avoidable food loss and possibly avoidable food loss through literature review and semiconstructed interview.
Cabbage and cucumber aside, the percentage of unharvested products was higher than the percentage discarded for quality reasons. The products that were most discarded were zucchini (15%), tomato (10%), and onion (15%) because they have a longer storage period in warehouses; therefore, the producer tends to minimize the entry of damaged or imperfect products. As vegetables are highly perishable and the quantity was difficult to forecast, none of the companies interviewed reported selling the misshapen product to alternative channels or sending them for processing. The 11 crops were responsible for the generation of almost 46.5 million tons of food loss, corresponding to 26% of the agricultural production. Monte Carlo analysis has shown a high variability of the results with a maximum of 65 million tons (35%), a minimum of 35 million tons (19%) and a standard deviation of ~3,000 tons (2%). The analysis highlighted the negligible effect of the unique value of UVL retrieved at the national level and the dependence on the results by the AVL value. In particular, the value of unharvested products of watermelon and lettuce had the highest impact on the overall sum. The EVFS had a value of almost 19 million euros, corresponding to 14% of the economic value of horticultural production in 2020. The economic impact chiefly originated from the AVL (61%) and to a lesser extent the PAL (21%) and the UVL (17%). At the provincial level, two-thirds of the impact was allocated to Tarragona (41%), and Barcelona (34%) was mostly concentrated during the summer season when major production takes place (Figure 4). This impact is mainly due to the food loss derived from watermelon in Tarragona during June and July as well as tomato and lettuce in Barcelona in June and September. These three crops represent almost half of the entire economic value and 40% of the total amount of food loss.
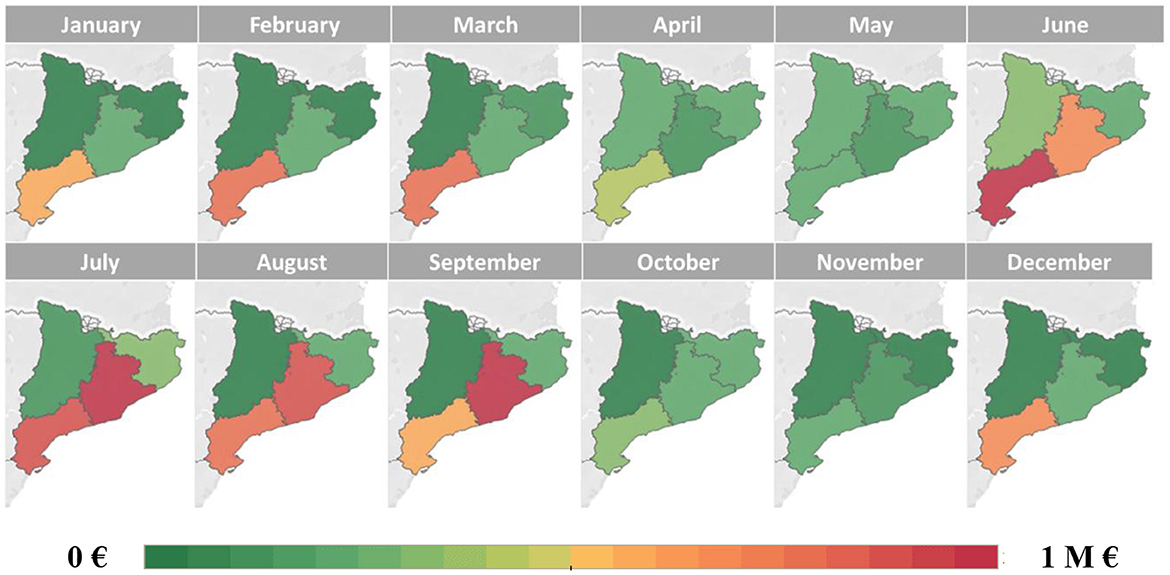
Figure 4. Spatial and temporal analysis of the economic impact of food loss in Catalonia, calculated as the sum of possibly avoidable food surpluses (PAS) and avoidable food surpluses (AVS).
However, the social impact analysis showed a huge difference between the provinces with the highest vegetable production, such as Tarragona (68) and Barcelona (8). Low-density rural areas where the detected low economic value of food loss, such as Girona and Lleida, have shown almost 30 days of MD close to the average value obtained for the entire region of Catalonia (33). The highest impacts were observed during the summer seasons, and the majority of the impact was based on a few products. In particular, the highest impacts were allocated to onion (17) in Lleida, tomato in Girona (9) and Barcelona (3) and lettuce (14) in Tarragona. The increase in vegetable purchase to reduce food loss corresponds to 18% of the actual purchase in Tarragona, 8–9% in Lleida, and Girona, and 2% in Barcelona. Considering Tarragona as the most critical province, the annual increase in vegetable intake was 14 kg/person, with a maximum increase of 30% during the most critical months of June, July, and August (Table 2). This increase would bring the vegetable intake to 290 grams per day, just 4% less than the recommendation provided by the Planetary Diet, mostly derived from lettuce, onion, watermelon, and tomato crops. These results confirm the possibility of redistributing food loss among the population even in the most critical months and areas.
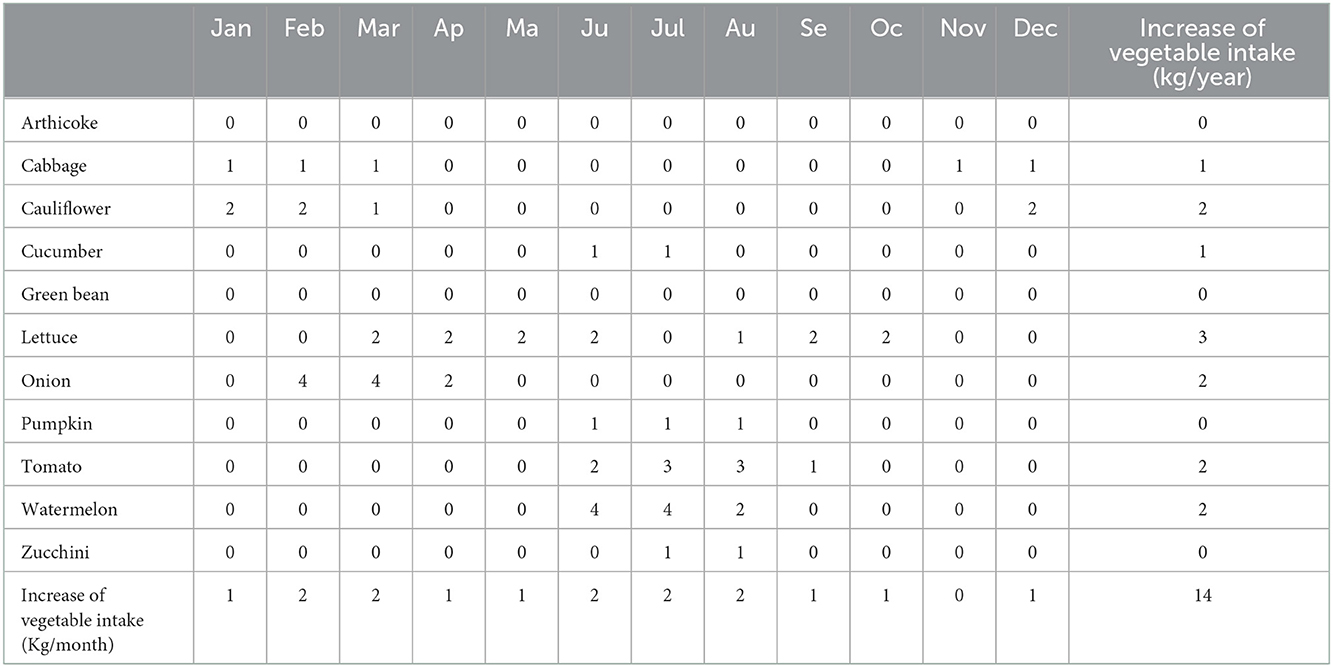
Table 2. Meal Days wasted and the increase in vegetable intake allocated per product and month in the province of Tarragona.
The analysis showed how to perform a multiyear analysis for the selection of the crop and highlights the possibility of reducing the number of crops from 10 (FAO, 2019) to 3–6 based on the details and scope of the analysis. The rationale behind the methodology was to provide a systematic way to select the proxies in the food loss analysis and reduce the amount of data to be processed by the selection of the shortest time series. The identification of the main important crop was fundamental to supporting the implementation of food loss reduction strategies (Mandyck and Schultz, 2015). The analysis confirms the importance of food loss in the primary sector by reporting maximum and minimum values similar to those calculated by Gustavsson et al. (2013) (20%) and by Caldeira et al. (2019) (30%) for the European Union. In particular, uncollected products account for more than half of the waste generated, underlining the need to take them into account in future food loss studies to avoid underestimating the phenomenon by 40–70%. This high variability of AVL due to external factors such as price (Baker et al., 2019) and climatic events (Beausang et al., 2017) partially explains the difference between food loss studies applying the same definition or methodology and justifies the need for the use of a probabilistic approach in future analyses. The analysis pointed out the high contribution of single products to the total amount of food loss and identified temporal and spatial hotspots that should be prioritized for short- and long-term interventions. Short-term strategies are aimed at mitigating food loss through the commercialization of ugly but-good crops in the local food system (Hingston and Noseworthy, 2020), the redistribution of surpluses to food banks (Kinach et al., 2020), or the conversion of surpluses to fooders for animals (Acheson, 2016). The quantification of the social impact helped to calibrate the capacity of food consumption based on the product available in the area analyzed. Indeed, the analysis has shown that food loss reduction could be mitigated by increasing vegetable intake in the population even during the most critical months and provinces. However, these mitigation strategies are aimed at redistributing surpluses or reducing industrial inefficiencies and are band-aid solutions that could potentially stimulate food loss if not implemented occasionally (Booth and Whelan, 2014). For this reason, in addition to the short-term policy, long-term policy should be developed focusing on the systematic causes supporting a transition that narrows the mismatch between the demand and supply within an area (Altieri, 2015; Belletti and Marescotti, 2020). The social indicators could identify loss thresholds regarding minimum or average food requirements at both global and local levels to set clear objectives in the national and international policy agendas. The economic indicator is useful to quantify the economic impact on the sector and on the farmer's income, giving a scale to quantify investments for the different typologies of the food value chain. Indeed, both the increase in consumption and the increase in the availability of vegetables should be pursued together to generate a win–win strategy for the farmer and consumer. For this reason, the use of long- and short-term strategies is, therefore, crucial to ensure the benefit in the short term to the consumer and in the long term to the producer, breaking the dichotomy between these two actors and paving the way for the elaboration of food loss reduction strategies (Cattaneo et al., 2021).
The reduction of food loss in the horticultural sector is critical to simultaneously support the transition toward a diet with higher consumption of vegetables and the achievement of policy goals aimed at halving the quantity of wastage by 2030 in the food system. Starting from crop selection, the present study proposes an alternative method to identify the main vegetable based on retrospective analysis and the characteristics of the production system. Food loss in vegetables corresponded to 19–35% of the agricultural production and 14% of the economic value of horticultural production. The unharvested product was confirmed to be the highest contributor to the impact, followed by quality sorting and technical inefficiencies. Based on the characteristics of the different typologies of food loss, economic and social impacts have been estimated to identify spatial and temporal hotspots in the region of Catalonia. The possibility of mitigating food loss through the redistribution of the selected crops has been confirmed. Additionally, the economic benefit of measuring the scale of investment aimed at reducing food loss has been provided. The combination of these two indicators was essential to provide key information at the decision-making level to pave the way for the elaboration of short- and long-term food loss reduction strategies.
The datasets presented in this study can be found in online repositories. The names of the repository/repositories and accession number(s) can be found in the article/Supplementary material.
All authors listed have made a substantial, direct, and intellectual contribution to the work and approved it for publication.
The authors are grateful to Rotary International, Rotary Club Barcelona district 2022, Rotary Club Bologna district 2072 for awarding a research scholarship to PT (Global Grant GG1984893). The research leading to these results has received funding from the European Research Council under the European Horizon 2020 research and innovation program under grant agreement No. 862663 (FoodE). Finally, we would like to thank Secretaria d'Universitats i Recerca del departament d'Empresa i Coneixement de la Generalitat de Catalunya for the grant awarded under the n° AGAU 2020 PANDE 00021. The publication reflects the author's views. The Research Executive Agency (REA) is not liable for any use that may be made of the information contained therein.
The authors declare that the research was conducted in the absence of any commercial or financial relationships that could be construed as a potential conflict of interest.
All claims expressed in this article are solely those of the authors and do not necessarily represent those of their affiliated organizations, or those of the publisher, the editors and the reviewers. Any product that may be evaluated in this article, or claim that may be made by its manufacturer, is not guaranteed or endorsed by the publisher.
The Supplementary Material for this article can be found online at: https://www.frontiersin.org/articles/10.3389/fsufs.2022.1043591/full#supplementary-material
AVL, avoidable food loss; EVFL, economic value of food loss; PAL, possible avoidable food loss; UVL, unavoidable food loss.
1. ^Regulation (EC) No 543/2009. European Parliament and of the Council of 18 June 2009 concerning crop statistics and repealing Council Regulations (EEC) No 837/90 and (EEC) No 959/93. Available online at: http://data.europa.eu/eli/reg/2009/543/oj.
2. ^Regulation (EC) No 138/2004 of the European Parliament and of the Council economic accounts for agriculture in the Community. Economic accounts for agriculture in the Community. Available online at: http://data.europa.eu/eli/reg/2004/138/oj.
Acheson, J. (2016). Global Analysis Report Health and Wellness Series Pea Protein Isolate in Food and Beverage Products: Executive summary. Ottawa, ON: Agriculture and Agri-Food Canada. Available online at: https://publications.gc.ca/site/fra/9.825565/publication.html
Altieri, M. (2015). “Agroecology: key concepts, principles and practices,” in Conference: Two International Short Courses Organized by TWN in Asia and Africa. Penang: Third World Network; Berkley, CA: Sociedad Cientifica Latinoamericana de Agroecologia. Available online at: https://www.researchgate.net/publication/284158848.
Baker, A., Gray, C., Harwood, M., Osland, T., and Tooley, J. B. (2019). On-farm food loss in northern and central California: results of field survey measurements. Resour. Conserv. Recycl. 149, 541–549. doi: 10.1016/j.resconrec.2019.03.022
Beausang, C., Hall, C., and Toma, L. (2017). Food waste and losses in primary production: qualitative insights from horticulture. Resour. Conserv. Recycl. 126, 177–185. doi: 10.1016/j.resconrec.2017.07.042
Belletti, G., and Marescotti, A. (2020). Short Food Supply Chain for Promoting Local Food on Local Markets. Vienna: Department of Trade, Investment, and Innovation (TII) of the United Nations Industrial Development Organization (UNIDO). Vienna International Centre. Available online at: https://tii.unido.org/sites/default/files/publications/SHORT%20FOOD%20SUPPLY%20CHAINS.pdf (accessed September 10, 2022).
Beretta, C., Stoessel, F., Baier, U., and Hellweg, S. (2013). Quantifying food losses and the potential for reduction in Switzerland. Waste Manag. 33, 764–773. doi: 10.1016/j.wasman.2012.11.007
Booth, S., and Whelan, J. (2014). Hungry for change: the food banking industry in Australia. Br. Food J. 116, 1392–1404. doi: 10.1108/BFJ-01-2014-0037
Caldeira, C., De Laurentiis, V., Corrado, S., Van Holsteijn, F., and Sala, S. (2019). Quantification of food waste per product group along the food supply chain in the European Union: a mass flow analysis. Resour. Conserv. Recycl. 149, 479–488. doi: 10.1016/j.resconrec.2019.06.011
Canali, M., Amani, P., Aramyan, L., Gheoldus, M., Moates, G., Östergren, K., et al. (2017). Food waste drivers in europe, from identification to possible interventions. Sustainability 9, 37. doi: 10.3390/su9010037
Cattaneo, A., Sánchez, M., Torero, M., and Vos, R. (2021). Reducing food loss and waste: five challenges for policy and research. Food Policy. 98, 101974. doi: 10.1016/j.foodpol.2020.101974
Chen, C., Chaudhary, A., and Mathys, A. (2020). Nutritional and environmental losses embedded in global food waste. Resour. Conserv. Recycl. 160. doi: 10.1016/j.resconrec.2020.104912
Cooper, K. A., Quested, T. E., Lanctuit, H., Zimmermann, D., Espinoza-Orias, N., and Roulin, A. (2018). Nutrition in the bin: a nutritional and environmental assessment of food wasted in the UK. Front. Nutr. 28, 19. doi: 10.3389/fnut.2018.00019
Corrado, S., and Sala, S. (2018). Food waste accounting along global and European food supply chains: State of the art and outlook. Waste Manag. 79, 120–131. doi: 10.1016/j.wasman.2018.07.032
DARP (Departament de Agricultura Ramaderia i Pesca). (2020). Surface, Yields and Production of Horticoltural Crops Per Provinces. Available online at: https://www.idescat.cat/indicadors/?id=aec&n=15424&lang=en
de Gorter, H., Drabik, D., Just, D., Reynolds, C., and Sethi, G. (2021). Analysing the economics of food loss and waste reductions in a food supply chain. Food Policy 98. doi: 10.1016/j.foodpol.2020.101953
De Laurentiis, V., Corrado, S., and Sala, S. (2018). Quantifying household waste of fresh fruit and vegetables in the EU. Waste Manage. 77, 238–251. doi: 10.1016/J.WASMAN.2018.04.001
Delgado, L., Schuster, M., and Torero, M. (2017). The Reality of Food Losses: A New Measurement Methodology. International Food Policy Research Institute, Institute of Development Policy and Management (IOB) University of Antwerp, The World Bank. Available online at: https://mpra.ub.uni-muenchen.de/80378/ (accessed September 2, 2022).
Diaz-Ruiz, R., Costa-Font, M., López-i-Gelats, F., and Gil, J. M. (2018). A Sum of incidentals or a structural problem? The true nature of food waste in the metropolitan region of Barcelona. Sustainability 10, 3730. doi: 10.3390/su10103730
EEA (European Environmental Agency). (2017). Food in a Green Light: A System Approach to Sustainable Food. Copenaghen: European Environmental Agency. Available online at: https://www.pbl.nl/sites/default/files/downloads/foodinagreenlight_report.pdf
European Commission (2020). Farm to Fork Strategy. European Union pubblication. Available online at: https://food.ec.europa.eu/horizontal-topics/farm-fork-strategy_en (accessed September 5, 2022).
EUROSTAT (2020). Harvested Production in EU Standard Humidity (2020)-Fresh Vegetables (Including Melons). Available online at: https://ec.europa.eu/eurostat/web/main/data/database (accessed September 5, 2022).
Fabi, C., Cachia, F., Conforti, P., English, A., and Moncayo, J. R. (2021). Improving data on food losses and waste: from theory to practice. Food Policy 98, 101934. doi: 10.1016/j.foodpol.2020.101934
Facchini, E., Iacovidou, E., Gronow, J., and Voulvoulis, N. (2018). Food flows in the United Kingdom: the potential of surplus food redistribution to reduce waste. J. Air Waste Manag. Assoc. 68, 887–899. doi: 10.1080/10962247.2017.1405854
FAO (2019). Methodological Proposal for Monitoring SDG Target; 12.3. The Global Food Loss Index Design: Data Collection, Methods and Challenges. Rome: Food and Agriculture Organization of the United Nations.
Filimonau, V., and Ermolaev, V. (2021). mitigation of food loss and waste in primary production of a transition economy via stakeholder collaboration: a perspective of independent farmers in Russia. Sustain. Prod. Consumpt. 28, 359–370. doi: 10.1016/j.spc.2021.06.002
Fundación Española de la Nutrición (2018). Informe de Estado de Situación: sobre Frutas y Hortalizas Nutrición y Salud en la España del siglo XXI. Madrid: FEN (in Spanish). Available online at: https://www.fesnad.org/resources/files/Noticias/frutasYHortalizas.pdf (accessed September 4, 2022).
Gakidou, E., Afshin, A., Abajobir, A. A., Abate, K. H., Abbafati, C., and Abbas, K. M. (2018). Global, regional, and national comparative risk assessment of 84 behavioural, environmental and occupational, and metabolic risks or clusters of risks for 195 countries and territories, 1990-2017: a systematic analysis for the global. Lancet. 390, 10104. doi: 10.1016/S0140-6736(17)32366-8
Garcia-Herrero, I. D., Hoehn, M., Margallo, J., Laso, A., Bala, L., and Batlle-Bayer, P. (2018). On the estimation of potential food waste reduction to support sustainable production and consumption policies. Food Policy 80, 24–38. doi: 10.1016/j.foodpol.2018.08.007
Garrone, P., Melacini, M., and Perego, A. (2014). Opening the black box of food waste reduction. Food Policy 46, 129–139. doi: 10.1016/j.foodpol.2014.03.014
GENCAT (2021). Price Perceived by Farmer in Catalonia 2015-2021. Generalitat de Catalonia (Spanish). Available online at: http://agricultura.gencat.cat/web/.content/de_departament/de02_estadistiques_observatoris/20_observatori_agroalimentari_de_preus/03_preus/01_preus_en_origen/02_preus_percebuts_pel_pages/arxius_estatics_nous/Plantilla_Preus_percebuts2015_2021_15.pdf (accessed August 24, 2022).
Gustavsson, J., Cederberg, C., Sonesson, U., and Emanuelsson, A. (2013). The Methodology of the FAO Study: ‘Global Food Losses and Food Waste-Extent, Causes and Prevention. Rome: Food and Agriculture Organization of the United Nations.
Hartikainen, H., Mogensen, L., Svanes, E., and Franke, U. (2018). Food waste quantification in primary production – The Nordic countries as a case study. Waste Manag. 71, 502–511. doi: 10.1016/j.wasman.2017.10.026
Hingston, S., and Noseworthy, T. (2020). On the epidemic of food waste: idealized prototypes and the aversion to Misshapen fruits and vegetables. Food Qual. Prefer. 86. doi: 10.1016/j.foodqual.2020.103999
HLPE (2014). Food Losses and Waste in the Context of Sustainable Food Systems A Report by The High Level Panel of Experts on Food Security and Nutrition. Food and Agriculture Organization of the United Nations. Available online at: www.fao.org/cfs/cfs-hlpe (accessed September 2, 2022).
ICAEN (2000). Atlante solar de radiación en Catalonia. Generalitat de Catalonia department d'industria i comerc i turismo and Institut Catala D' energia. Institut Catala D'Energia (in Catalan). Available online at: https://icaen.gencat.cat/web/.content/10_ICAEN/17_publicacions_informes/09_fons_documental/02_estudis_monografics/arxius/monografic12.pdf (accessed August 10, 2022).
IDESCAT (2020). Population Density. Counties and Aran, Areas and Provinces. Institut d'Estadística de Catalonia. Available online at: https://www.idescat.cat/pub/?id=aec&n=249&t=2020 (accessed September 6, 2022).
IDESCAT (2021). External Trade in Catalonia. Institut de Estadistica de Catalonia. Available online at: https://www.idescat.cat/sexterior/Comest?TC=1&L=1 (accessed August 2, 2022).
IDESCAT (2022). Final Agricultural Production (SEC-2010). By Products. At Current Prices in Catalonia. Institut de Estadistica de Catalonia. Available online at: https://www.idescat.cat/indicadors/?id=aec&n=15415&t=2010&lang=en (accessed August 10, 2022).
Johnson, K., Dunning, D., Gunter, C., Bloom, J. D., Boyette, M., and Creamer, N. (2018). Field measurement in vegetable crops indicates need for reevaluation of on-farm food loss estimates in North America. Agric. Syst. 167, 136–142. doi: 10.1016/j.agsy.2018.09.008
Kinach, L., Parizeau, K., and Fraser, E. (2020). Do food donation tax credits for farmers address food loss/waste and food insecurity? A case study from Ontario. Agric. Hum. Value 37, 383–396. doi: 10.1007/s10460-019-09995-2
Kotykova, O., and Babych, M. (2019). Economic impact of food loss and waste. Agris On Line Papers Econ. Inf. 11, 55–71. doi: 10.7160/aol.2019.110306
Kuiper, M., and Cui, H. (2021). Using food loss reduction to reach food security and environmental objectives—A search for promising leverage points. Food Policy 98. doi: 10.1016/j.foodpol.2020.101915
MAGRAMA (2014). Las pérdidas y el desperdicio alimentario generado por la producción agrícola de alimentos en España. Madrid: Secretaría General Técnica centro publicaciones. Ministerio de agricultura, alimentación y medioambiente (in Spanish). Available online at: https://www.mapa.gob.es/es/ministerio/servicios/publicaciones/memoria-2014-magrama-07-11-indice_tcm30-83989.pdf (accessed July 23, 2022).
Mandyck, J., and Schultz, E. (2015). Food Foolish: The Hidden Connection Between Food Waste, Hunger and Climate Change. London: Carrier Corporation.
MAPA (2019). Calendario de Siembra, Recolleción y Commercialización 2014-2016. Madrid: Ministerio de Agricultura, Pesca y Alimentación (in Spanish). Available online at: https://www.mapa.gob.es/es/estadistica/temas/estadisticasagrarias/agricultura/calendarios-siembras-recoleccion (accessed June 8, 2022).
Micha, R., Khatibzadeh, S., Shi, P., Andrews, K. G., Engell, R. E., Mozaffarian, D., et al. (2015). Global, regional and national consumption of major food groups in 1990 and 2010: a systematic analysis including 266 country-specific nutrition surveys worldwide. BMJ Open. 5, e008705. doi: 10.1136/bmjopen-2015-008705
Parfitt, J., Barthel, M., and MacNaughton, S. (2010). Food waste within food supply chains: quantification and potential for change to (2050). Philos. Transact. R. Soc. B Biol. Sci. 365, 3065–3081. doi: 10.1098/rstb.2010.0126
Parlament de Catalonia. (2020). Law 3/2020 of the Catalonia Parliament on the Prevention of Food Losses and Wastage. Official Journal of the Catalonia Government, No 8084. Available online at: https://residus.gencat.cat/web/.content/home/consultes_i_tramits/normativa/normativa_catalana_en_materia_de_residus/llei_3_2020_es.pdf
Quested, T., and Johnson, H. (2009). Household Food and Drink Waste in the UK: A Report Containing Quantification of the Amount and types of Household Food and Drink Waste in the UK. Banbury: WRAP (Waste and Resources Action Programme).
Raychaudhuri, S. (2008). “Introduction to Monte Carlo simulation,” in Winter Simulation Conference (Interlocken), 91–100.
Redlingshöfer, B., Coudurier, B., and Georget, M. (2017). Quantifying food loss during primary production and processing in France. J. Clean. Prod. 164, 703–714. doi: 10.1016/j.jclepro.2017.06.173
Stenmarck, Å., Jensen, C., Quested, T., Moates, G., Buksti, M., and Cseh, B. Juul, S. (2016). Estimates of European Food Waste Levels. IVL Swedish Environmental Research Institute. Available online at: https://edepot.wur.nl/378674 (accessed September 1, 2022).
United Nations (2015). Transforming our world: the 2030 Agenda for Sustainable Development Preamble. Available online at: https://www.un.org/ga/search/view_doc.asp?symbol=A/RES/70/1&Lang=E (accessed September 10, 2022).
Vide, M. (1992). Geografia general dels Països Catalans. El clima i el relleu. Volumen I. Barcelona, CA: Enciclopèdia Catalana.
Willett, W., Rockström, J., Loken, B., Springmann, M., Lang, T., Vermeulen, S., et al. (2019). Food in the anthropocene: the EAT–Lancet commission on healthy diets from sustainable food systems. Lancet. 393, 447–492. doi: 10.1016/S0140-6736(18)31788-4
Wiskerke, H., and Carey, J. (2015). City Region Food Systems Approach. RUAF Foundation International Network of Resource Centres on Urban Agriculture. Urban agriculture Megazine. Available online at: https://www.researchgate.net/publication/303366299 (accessed September 1, 2022).
WRAP (2017). Food Waste in Primary Production: A Preliminary Study on Strawberries and Lettuces Research to Quantify the Scale and Causes of Food Waste and Economic Losses. Banbury: Waste and Resources Action Programme.
XCAC (2019). Compte analític per cultiu i servei. Departament de Agricultura. Gabinet Tècnic - Servei d'Estadística i Preus Agroalimentaris. Xarxa comptable Agrària de Catalonia. Available online at: http://agricultura.gencat.cat/web/.content/de_departament/de02_estadistiques_observatoris/05_xarxa_comptable_agraria/arxius_estatics/Resultats-compte-analitic-per-cultius-i-serveis-any-2018.pdf
Keywords: food loss, food waste, primary production, horticulture, city-region food system, economic impact, nutritional impact
Citation: Tonini P, Odina PM, Orsini F and Gabarrell Durany X (2022) Economic benefit and social impact derived by a food loss prevention strategy in the vegetable sector: A spatial and temporal analysis at the regional level. Front. Sustain. Food Syst. 6:1043591. doi: 10.3389/fsufs.2022.1043591
Received: 13 September 2022; Accepted: 07 December 2022;
Published: 22 December 2022.
Edited by:
Luigi Ranieri, Università Lum Jean Monnet, ItalyReviewed by:
Konstadinos Abeliotis, Harokopio University, GreeceCopyright © 2022 Tonini, Odina, Orsini and Durany. This is an open-access article distributed under the terms of the Creative Commons Attribution License (CC BY). The use, distribution or reproduction in other forums is permitted, provided the original author(s) and the copyright owner(s) are credited and that the original publication in this journal is cited, in accordance with accepted academic practice. No use, distribution or reproduction is permitted which does not comply with these terms.
*Correspondence: Xavier Gabarrell Durany,  eGF2aWVyLmdhYmFycmVsbEB1YWIuY2F0
†ORCID: Pietro Tonini orcid.org/0000-0003-3113-619X
Pere Muñoz Odina orcid.org/0000-0002-2931-6311
Francesco Orsini orcid.org/0000-0001-6956-7054
Xavier Gabarrell Durany orcid.org/0000-0003-1730-4337
Disclaimer: All claims expressed in this article are solely those of the authors and do not necessarily represent those of their affiliated organizations, or those of the publisher, the editors and the reviewers. Any product that may be evaluated in this article or claim that may be made by its manufacturer is not guaranteed or endorsed by the publisher.
Research integrity at Frontiers
Learn more about the work of our research integrity team to safeguard the quality of each article we publish.