
95% of researchers rate our articles as excellent or good
Learn more about the work of our research integrity team to safeguard the quality of each article we publish.
Find out more
ORIGINAL RESEARCH article
Front. Sustain. Food Syst. , 21 October 2022
Sec. Agroecology and Ecosystem Services
Volume 6 - 2022 | https://doi.org/10.3389/fsufs.2022.1023579
This article is part of the Research Topic Nitrogen Use To Improve Sustainable Yields in Agricultural Systems View all 11 articles
 Winnie Ntinyari1,2*
 Joseph Gweyi-Onyango2
 Mekonnen Giweta3
 James Mutegi4
 Benson Mochoge2
 Generose Nziguheba1
 Cargele Masso3
Too little nitrogen (N) is a threat to crop productivity and soil fertility in sub-Saharan Africa (SSA). Nitrogen budgets (NB) and nitrogen use efficiency (NUE) are critical tools for assessing N dynamics in agriculture and have received little or no attention in the region. Data were collected from smallholder farmers clustered into two categories, farmers applying and farmers not applying N fertilizers. NB were calculated using the Coupled Human and Natural Systems (CHANS) model approach for field and farm spatial scales. The results showed spatial variabilities in NB and NUE at the field level (maize and rice) across all the catchments. At the field level, N balances were negative for the two crops in all the catchments. Similarly, at the farm gate, a deficit of −78.37 kg N ha−1 was observed, an indicator of soil N mining. NUE values at the field scale varied across the catchments for both crops, with values for maize grown without N ranging from 25.76 to 140.18%. Even with the application of mineral N at higher levels in rice fields compared to maize fields, NUE values ranged between 81.92 and 224.6%. Our study revealed that the Lake Victoria region suffers from inefficient N cycling due to depleted soil N pools and low synchrony between N input and N removal. Therefore, a challenge lies in exploiting more sustainable N sources for farmers in the region for sustainable farming systems. The NB and NUE provide critical information to agriculture stakeholders to develop environmental, agronomic, and economically viable N management solutions.
In recent decades, researchers have developed an increasing interest in understanding the role of nitrogen (N) cycling in agricultural systems, which involves mineral N inputs for improved crop production (Atieno et al., 2020). In sub-Saharan Africa (SSA), N constitutes 90% of the applied fertilizer (Sutton et al., 2013) and is sometimes accompanied with a little phosphorus (P) and potassium (K) but rarely with secondary or micronutrients (Swarbreck et al., 2019). In SSA, soil fertility is declining due to several years of crop nutrient mining and limited replenishment of nutrients either taken up or lost from the soil (Jones et al., 2013). This imbalance between input and output from the soil system has resulted in extreme nutrient deficits in croplands, threatening agricultural production and associated ecosystem functions (Reynolds et al., 2015). According to Jayne and Sanchez (2021), although the current average use of N fertilizers has increased over the past decades the amount is still very low at 17.9 kg N ha−1 and not enough to compensate the for the harvested/exported nutrients. Therefore, an initial challenge in SSA is to provide more nutrients into their fartms and building the soil health through soil orgnaic matter (Vitousek et al., 2009).
Monitoring N fluxes in ecosystems is crucial for improved N management (Nimmo et al., 2013). Quantifying nitrogen budgets (NB) is the first step toward improved N management as it helps identify the significant N sources and sinks and inform sound N management practices and policies (Zhang et al., 2020). It is becoming succinctly clear that assessing the fate of applied N is crucial for effectively constructing partial and complete NB at both field and farm gate scales (Quemada et al., 2020). Further, understanding N balance is crucial for evaluating N performance and developing strategies for reducing its losses to the environment (McLellan et al., 2018).
NUE is used as a performance indicator to show the relationship between N inputs and agricultural products obtained from the system. It also indicates potential losses of reactive N (Nr) to the environment as farmers strive to improve crop yields to meet the increasing demand for food, feed, fiber, and fuel (Fixen et al., 2015). The concept of NUE is critical in evaluating crop production systems and is impacted by soil, plant, irrigation, and fertilizer/nutrient management (EUNEP, 2015). Poor N management practices contribute to un-optimal NUE due to poor synchrony between applied N and the crop demand (Sharma and Bali, 2017). According to Ntinyari et al. (2022a), NUE can be used as a reasonable indicator to show the target threshold with good management and close simulation of farmer practices for improved N performance. Presentation of NUE as a percentage or mass fraction of N input, output, surplus, and possible changes in the N stocks in the soil system would provide a specific indicator for improved N management (EUNEP, 2015).
In East Africa, N is the most limiting nutrient due to farmers' inability to afford and apply the recommended N fertilizer rates in the cropping systems (Chianu et al., 2012; Masso et al., 2017). The low N fertilizer application to crops in the region, the export of N with harvested crop product, and losses of N through different pathways such as volatilization, runoff, and leaching contribute to soil nutrient depletion and mining of nutrient stock (Zingore et al., 2015; Masso et al., 2017). Maize and rice rank second and third, respectively, following wheat in terms of their contribution to per capita calories consumed, food supply, harvest area, total production, quantity imported, and Africa's share of the global import (Sileshi and Gebeyehu, 2021). Thus, the two crops are critical for meeting the United Nations Sustainable Development Goals (SDGs) on food security and poverty reduction in East Africa and across Africa (Majiwa, 2017; Sileshi and Gebeyehu, 2021).
Further, management of N input, outputs, and use efficiency in the Lake Victoria basin is crucial because the basin carries more than 20% of East Africa's population, and the Lake Victoria freshwater supports more than 4 million people through annual fishery production of about 1 million tons in East Africa in addition to being a source of river Nile. N loading is associated with declining lake water quality and the growth of water hyacinth (Eichhornia crassipes). Improving understanding of N dynamics from the Lake Victoria basin for significant cropping systems would be a crucial step toward reducing N accumulation and loading into Lake Victoria, thus managing potential negative impacts. Therefore, there are profound food security, economic and environmental impacts of improved N management in the Lake Victoria basin, for large populations in East Africa, and other areas where Lake Victoria is used as a source of water for humans, animals, and irrigation.
There are concerted efforts by the African governments and development partners to promote the increased use of fertilizers to close the yield gaps of most essential crops like maize and rice (AGRA, 2019). Consequently, fertilizer use has increased from 8 kg nutrient/ha in 2006 to slightly above 20 kg nutrient/ha in 2019 (AFDB, 2020; Ntinyari et al., 2022a). There is an overdue need to understand the sources, fate, and efficiency of N use in densely populated African agricultural regions to support future planning and investments. To our knowledge, there is no current information on NB and NUE for the smallholder, specifically maize and rice in East Africa. Therefore, the findings of this study will provide information to various stakeholders to facilitate the development of nutrient management strategies and policies that increase N management in cropland while reducing N losses to the environment. Based on this background, we hypothesized that estimation of N budgets at field and farm gate would give an explanation and interpretations on N cycling and management, reflecting smallholder farmer's scenarios in the Lake Victoria basin, which could trigger better adoption of measures for sustainable N management at farm level.
Data used in this study were obtained from participatory interviews using open-ended semi-structured questionnaires in an open data kit (ODK) as described by Ntinyari et al. (2022b). A total number of 447 observations comprising of 154 farms, 135 rice fields and 158 maize fields were compiled from four catchments of the Lake Victoria basin, namely: Nyando, Sondu, Yala, and Nzoia. Each farm selected represented a farmer per household and the selected sites represented 50 % of the entire mass land area. around the lake region on the Kenyan side. The Lake Victoria basin extends to five Eastern African countries (Burundi, Kenya, Rwanda, Uganda, and Tanzania), covering an approximate area of 194,000 km2 (Kayombo and Jorgensen, 2006). The basin is inhabited by some of the most resource-constrained Eastern African rural populations, with an approximate population of 30 million and a projected annual increase of 6% (Kayombo and Jorgensen, 2006; Zhou et al., 2014). More than 70% of the population in the basin is involved in agricultural production activities. The main staple food crops within the catchment are maize and rice growing in predominant soil types, including Ferralsols, Nitisols, Vertisol, Cambisols, and Acrisols (Nkonya et al., 2015). The climate is equatorial, with temperatures modified by the high elevation of lakes and mountains like Mt. Elgon. However, since the temperatures are lower than the typical tropical conditions, it is classified as humid, with temperatures ranging from 20°C to over 35°C. The region experiences bimodal rainfall, with short rains occurring between mid-March and the end of May and long rains occurring from mid-October to the end of December. Annual rainfall quantities range from 1,000 to 1,500 mm in a year and lie at an elevation of 1,500 m (4,921 ft) (Okungu et al., 2005).
The farmers interviewed at field level that was defined as a crop, i.e., maize and rice as monocrop was drawn from the population given by the extension officers within the local region. The sample was selected using a purposive sampling technique, a non-probability sampling method that is selective to identify and choose information-rich participants. The puposive sampling procedure was followed by random engagement of the farmers for subsequent in-person interviews.
A similar selection approach defined at the field level was used at the farm level. Here a mixed farming system was considered, including all kinds of crops a farmer grows, mostly cereal-legume system and livestock and manure use practices. Data collected from fields and farms were categorized into two: i.e., Farmers applying mineral N fertilizers and farmers not applying mineral N fertilizers in their fields or farms. All collected data for N inputs and outputs at the field and farm level was reported as kg N ha−1. The collected data included: land size, N inputs from fertilizers, the quantity of planted seeds, crop growth seasons, yield, and various planted crops.
At the field level, soil surface N budget (NB) and soil system NB approaches were used to quantify NB for maize and rice, as reported by Oenema et al. (2003). In each category of the N budget, there was the characterization of farmers applying and not applying mineral N. The soil surface NB considers all the significant N fluxes entering the soil via surface and only leaves the soil through crop uptake (Eq. 1). The soil system NB includes all N inflows and outflows, including N uptake, exported N harvested with the crop, and losses within and from the soil surface, as reported by EUNEP (2016) and shown in Eq. 2.
Where; NB, nitrogen budgets; SNF, synthetic N fertilizer; AND, atmospheric N deposition; NPM, nitrogen in planting materials; CNR, crop N removal; Lch, leached N; RF, runoff; DNT, denitrification.
Data collected through field surveys included land size, N inputs as mineral fertilizers, the quantity of planted materials, yield, seasons, legume crops grown, and any other crops grown by the farmers in the fields. The actual rate of N applied from different N fertilizers sources was calculated by dividing the fertilizer application rate per ha by the proportion of N in the fertilizer used. The proportion of N in the fertilizer used is indicated in the local fertilizer grades, as shown in Supplementary Table S1. The N in straw recycling was not considered in this budget because it is common for farmers around the catchment to burn crop residues. The N in irrigation water was not accounted for due to a lack of information on actual or estimated water supplied per hectare per growing rice season. Livestock manure as an N input source was not included in this budget because the majority of the farmers in the catchment area were practicing communal grazing. In many cases, the livestock excreta on overnight grazing are used as fuel, and others burn the droppings. BNF fixation was excluded because leguminous crops were not integrated into the target maize and rice plots as the focus was mainly on maize and rice monocrops.
Wet and dry atmospheric deposition of N was obtained from direct measurements from Lake Victoria (Kayombo and Jorgensen, 2006; Bakayoko et al., 2021). To calculate N input in planting material, the actual seeding rate in kg ha−1 was multiplied by the N content for maize and rice seeds, while harvested N was determined by multiplying the respective N content for the specific crop and the amount of yield obtained from the fields as shown in Supplementary Table S2. This was achieved using a tiered approach to estimate various N inputs from the planting materials and harvested products.
For soil system budget, N loss in soils from applied mineral N fertilizer through ammonia (NH3) volatilization and nitrous oxide (N2O) emissions were calculated using country-specific emission factors according to Intergovernmental Panel on Climate Change (IPCC) (FAO, 2001; Bouwman et al., 2002) (Supplementary Table S3). To estimate gaseous emission, net N inputs were multiplied by the emission factors according to Eq. 3 (Eggleston et al., 2006). Soil denitrification was estimated by the N balance method using global estimates for upland and wetland crops (Supplementary Table S4) (Hofstra and Bouwman, 2005), and leaching and runoff losses of applied N were estimated using the IPCC factor of 0.3 kg N ha−1 of mineral N (FAO, 2001; Wang et al., 2019).
Where; SNF, synthetic N fertilizer; EF, emission factors.
The farm-gate N budget was determined considering all the N sources flowing into the farm-gate as N inputs and leaving the farm-gate as N output (Eq. 4). For farm-gate, all crops grown by the farmer were considered in budgeting. The parameters collected and estimated for this scale included applied mineral N fertilizers, the quantity of planted seeds, seasons for specific crops, the yield for all crops, and the total land under agricultural production. At farm-gate, BNF was determined by multiplying the crop area under legume production by the global mean rate of N2 fixation for each legume type as described by Smil (1999) (Supplementary Table S5). All N inputs and outputs were converted to kg N ha−1. In this study, vegetables and fruits were excluded due to a lack of data on actual yield in kgs and analyzed N contents to estimate N removal by crop. N loss via gaseous NH3 and N2O emission was calculated using the same Emission Factors (EF) used for field level and denitrification rates for upland and wetland crops. There was no consideration of imported and exported feeds N because livestock were openly grazed, and feed trade was rare.
Where; FNB, Farm N balance.
NUE in the field was determined using European Union Nitrogen Expert (EUNEP) methodology. EUNEP denotes that NUE is a ratio between harvested N in crops divided by the total sum of N inputs, including N from fertilizer, atmospheric N deposition, and N in the planted seeds (Eq. 5) (EUNEP, 2016).
Where; NUE, nitrogen use efficiency.
All statistical analyses were performed with R Software (R Core Team R, 2020). The Least Square Means were computed using ““lsmeans” packages. Means were separated by adjusted” “Tukey's method using “cld”” function from “multicompView'package for N inputs, N outputs, NUE, and N balance (p < 0.001). Mean distribution for N inputs, outputs, NUE, and N surplus/deficit were analyzed using the ggplot command from the ggpubr package. The Coupled Human and Natural Systems (CHANS) model version 1.3 (Gu et al., 2015) for the cropland subsystem was applied to estimate N budgets at different spatial scales. The choice of this model was based on its fundamental principle of mass balance of N fluxes in a whole system and each subsystem. CHANS model also accommodates data fluxes that are missing or could not be estimated, more so in Lake Victoria, where data on N flows is limited. In this study, the CHANS model was divided into two functional groups; N inputs and N outputs in the cropland subsystem.
For the soil surface, the maize farmers who do not apply mineral N fertilizers, the atmospheric deposition represented the primary flow with an average N input of 15.0 kg N ha−1 (Table 1). In this type of N budget, farmers without application of mineral N recorded negative balances in Nyando and Sondu with average values of −3.45 and −4.29 kg N ha−1, respectively.
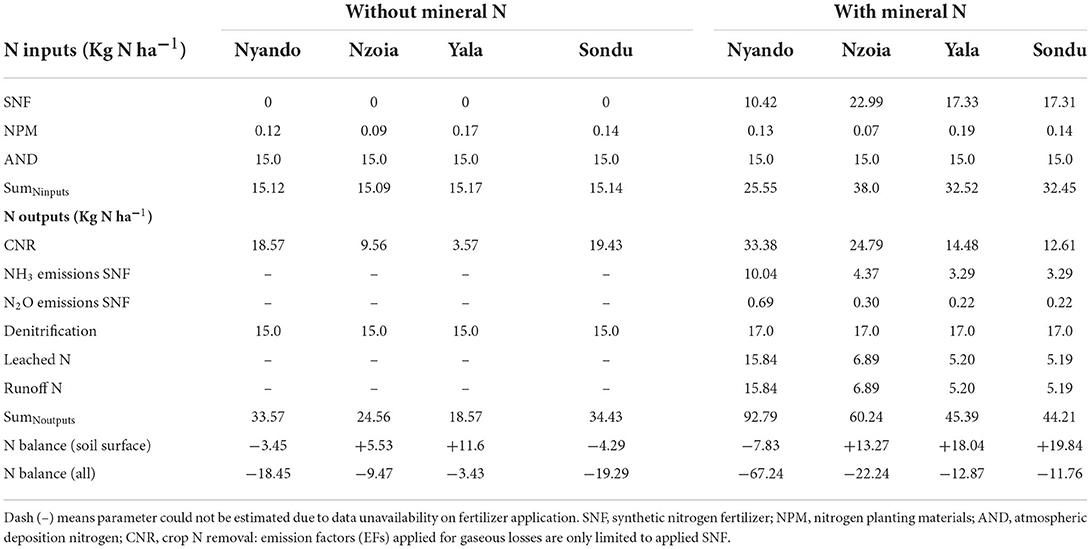
Table 1. Soil system N budget for maize with and without mineral N fertilizer applications in four Lake Victoria catchment.
Similarly, farmers applying mineral N recorded negative balances for soil surface N budget in Nyando catchment. Despite the addition of N, the negative N budget in Nyando implies that more N was removed from the system than that added with fertilizers, an indicator of soil N mining. Among farmers who apply N fertilizers, positive balances were reported in three catchments, Nzoia, Yala, and Sondu, with average values of 13.27, 18.04, and 19.84 kg N ha−1, respectively (Table 1).
Both farmer categories were associated with negative N balances in soil system NB. In farmers not applying mineral N fertilizers, N balances ranged between −3.43 to −19.29 kg N ha−1 across the four catchments areas, as shown in Table 1. More pronounced N losses were recorded to fertilizers associated outflows n the farmers applying mineral N categories. In Nyando balance of −67.24 kg N ha−1 was recorded, indicating severe soil N depletion and mining in the farms. Soil system had higher N losses to significant outflows from denitrification, leaching, runoff, and N2O and NH3 emissions, pointing to the importance of appropriate soil management.
In rice fields, soil surface NB showed variabilities across the catchments (Table 2). N balance was more pronounced in Sondu, with a value of −35 kg N ha−1, while Nzoia showed a positive balance (+31.94 kg N ha−1). The positive N balance in Nzoia could indicate N sufficiency Nyando and Nzoia had the highest mineral N application rates of 102.19 and 77.78 kg N ha−1, respectively. The N in crop removal formed the largest N outflow across the three catchments in the two budget systems (Table 2). At soil system balance, all catchments recorded negative balances of −148.42, −77.31, and −51.88 kg N ha−1 in Nyando, Nzoia, and Sondu, respectively (Table 2).
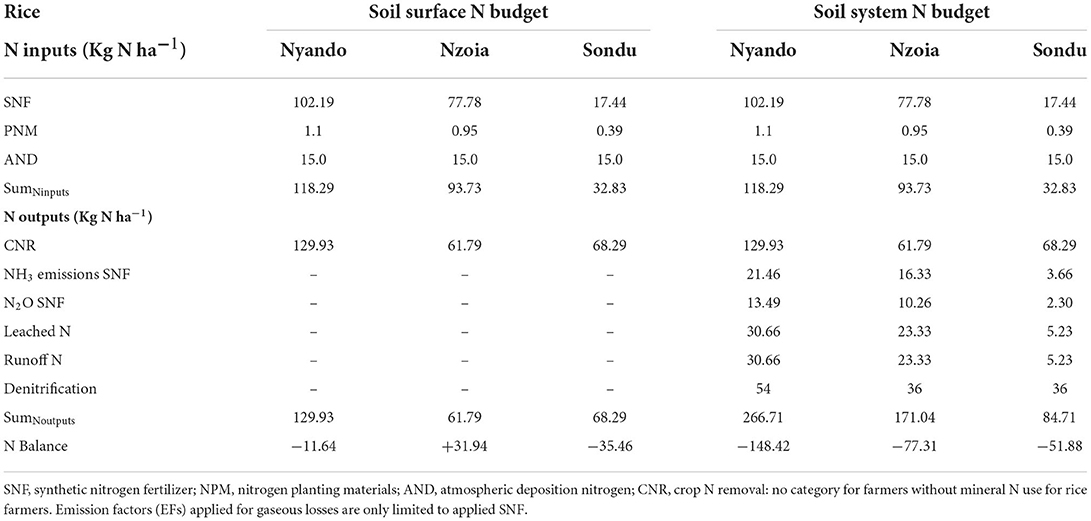
Table 2. Rice soil surface and soil system N budget in main rice-growing catchments in Lake Victoria basin.
Farms without mineral N application, had the main N input from atmospheric deposition (15.0 kg N ha−1) and biological N fixation with 6.99, 14.76, and 16.7 kg N ha−1 for Nyando, Nzoia, and Sondu, respectively. At soil surface N budget, negative balances were observed in Nzoia for farms with no N fertilizer applications with value of −0.53 kg N ha−1. In contrast, in Nyando and Sondu, the N budget was +6.35 and +6.63 kg N ha−1, respectively. Conversely, in farms with mineral N application, positive balances of +26.59 and +41.98 kg N ha−1 were observed with Nzoia and Sondu, respectively. In comparison, Nyando had a negative balance of −12.92 kg N ha−1 (Table 3) due to increased N losses.
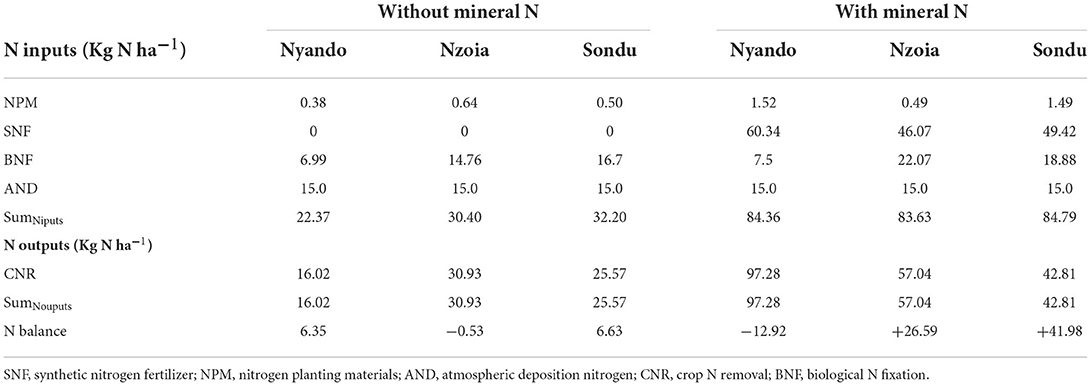
Table 3. Soil surface N budget for farms with and without mineral N applications.
In Nyando, Nzoia and Sondu for the category of farmer using fertilizers, mineral N fertilizer was the dominant source of N input with 60.34, 46.07, and 49.42 kg N ha−1, respectively. Farm-gate N balances were characterized by negative budgets for farm categories with and without mineral N fertilizer application. For farms without N fertilizers, the highest N balance was recorded in Nzoia, while the lowest value was Sondu (Table 4).
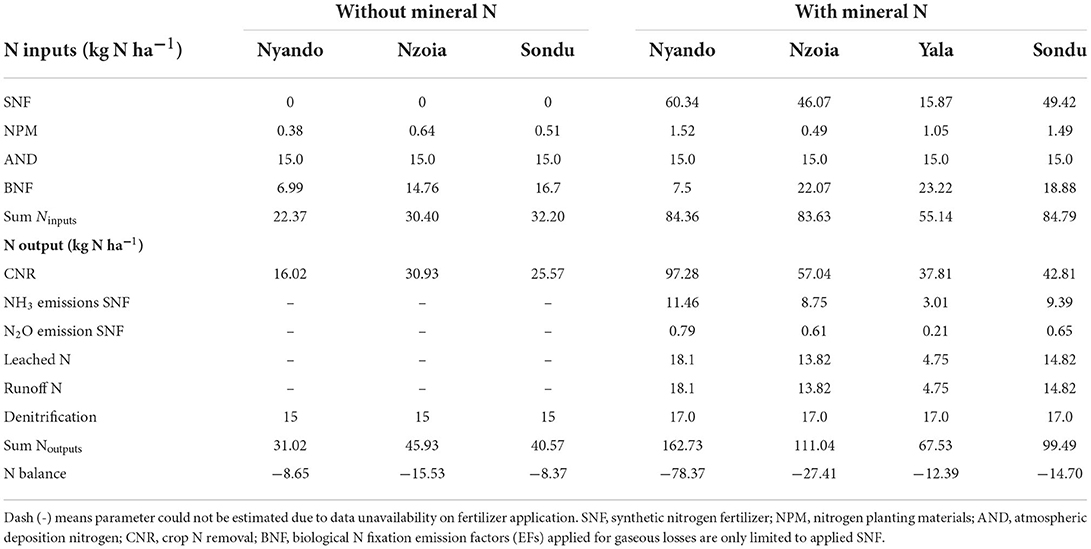
Table 4. Nitrogen budget for two categories of farms with and without mineral N applications.
For farms where farmers applied N fertilizers, more losses and the largest negative balances were observed in Nyando with a mean value of −78.37 and the lowest in Yala with a mean value of −13.69 kg N ha−1. In the two farm categories, the largest N outflow was recorded in crop removal (Table 4).
In maize fields without application of mineral N fertilizer, analysis of variance for the catchments did not show significant effects of non-application of N fertilizers on total N inputs, outputs, and NUE (p < 0.001). Mean N inputs for the catchments ranged between 15.79 and 15.87 kg N ha−1 (Figure 1). Similarly, the mean NUE for maize farms without N fertilizers in Nyando and Sondu exceeded 100% with 132.22 and 140.18%, respectively. In Yala, a lower mean NUE was recorded at 25.76%, while Nzoia had a close to optimal NUE of 69.21%. The NUEs also varied significantly across all the catchments for maize farmers with N fertilizer application. The NUE for N fertilizer applied farms were a lesser variable as they ranged between 34.6 and 76.3 %.
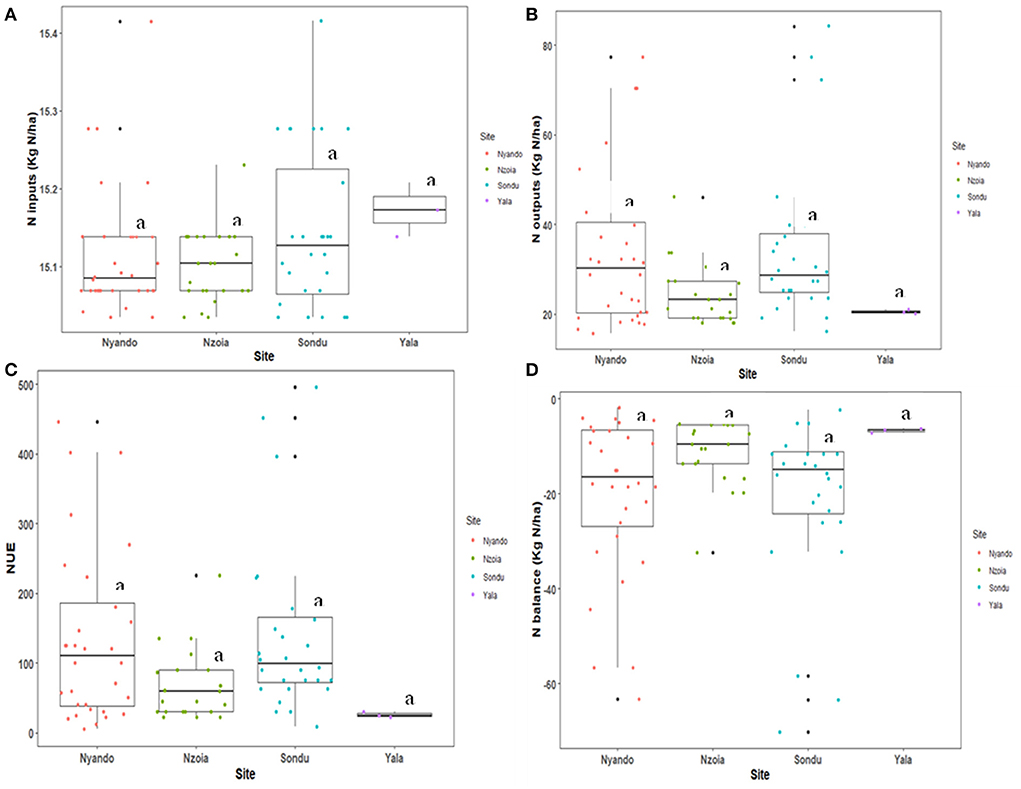
Figure 1. Box plots for Maize (A) nitrogen inputs (kg N/ha), (B) outputs (kg N/ha), (C) NUE, and (D) N balance (kg N/ha), in four catchment areas of Lake Victoria basin for farmers without application of mineral N fertilizer.
Significant differences (p < 0.001) were observed in the data set for total N inputs, outputs, and NUE in fertilized rice fields. The highest mean total N inputs were observed in Nyando at 117.0 kg N ha−1, while the least was in Sondu with 31.53 kg N ha−1 (Figure 3). A similar trend was observed in the total N outputs data set, where Nyando had the highest mean value of 279.2 kg N ha−1, whereas Sondu had the least mean of 120.7 kg N ha−1.
In Nyando and Sondu, the mean NUE exceeded 100%, with Sondu having an extreme value of 224.6% (Figure 3C). Low N inputs could explain the extremely high NUE values in Sondu catchment in rice systems. Severe N deficits were observed in all catchments for rice fields, with Nyando having a twofold highest negative balance of −162.2 kg N ha−1, relative to Sondu with −89.2 kg N ha−1 and Nzoia with −78 kg N ha−1 (Figure 3D).
At the field level, estimated N balances in the two categories of farmers showed variability across the study catchments. The soil surface, that represented sources of N input and consideredcrop removal as the only output, NB ranged from −3.45 and −4.29 kg N ha−1 for maize farmers without mineral N application (Table 1). The negative values from our study are an indication of an insufficient amount of N in the systems contributing to further N depletion (Nkonya et al., 2005). The imbalances across farms can be attributed to poor management practices within the region, low availability, and low potential to purchase adequate N inputs. The maize fields with mineral N fertilizers application had a positive N balance except for Nyando with −7.84 kg N ha−1. The positive balances are due to more N applications than in Nyando.
Extreme Nlosses and variations at soil system NB between maize fields with and without were observed. The fields without mineral N application category had lesser negative ranging from −3.43 to −18.45 kg N ha−1 (Table 1), compared with the fields with mineral N application, more N losses were anticipated due to estimated losses from fertilizer applications (−11.76 to −67.24 kg N ha−1). Specifically, in Sondu catchment, the higher crop export from the category of farmers without mineral N could be due to more mining of nutrients from the soil by the crops. Also, there could be more losses of applied N into the cropping system leading to less N available to be utilized by the crop and also depending on the time of application by the farmers as a management practice. Chianu et al. (2012) reported that exporting more nutrients than those applied is one of the most important causes of negative nutrient balances and soil N depletion in African agriculture.
In rice systems, the soil surface N budget, there was a positive balance of +13.94 kg N ha−1 (Table 3), in Nzoia catchment. In this site, the average N input from mineral fertilizers was 77.78 kg N ha−1, this is an indicator that this range could be optimal to correct the negative balances in the soils but has to be coupled with the proper management practices, including the 4 R (right rate, right source, right placement, and right timing) stewardship. The high use of N fertilizer in both Nyando and Nzoia catchments on rice fields is closely associated with the influence of the National Irrigation Board (NIB), which supports farmers with farm inputs on credit and at subsidized rates, compared to Sondu, where rice fields are under individual farmer management.
More significant negative balances were observed in the rice soil system N budget (Table 2). The negative balances could result from various mechanisms of N losses: first, as these catchments are characterized by regular cycles of flooding and drying/wetting cycle; the wetness and flooding, cycles could elicit nitrification and denitrification processes due to changing soil gas diffusivity and water-filled pore spaces leading to enhanced losses of N as N2O (Tan et al., 2005). High positive balances are not always desirable as they indicate excess N left in the system, susceptible to losses into surface/groundwater as NO3−, or atmosphere as N2O or NOx emission, leading to environmental degradation (Dalgaard et al., 2017). All rice farmers in our case study had access to mineral N fertilizers due to the regulation, and the farmers could access more inputs in a coordinated manner. The regulation of rice farming by the National Irrigation Board (NIB) is one of the strategies that could be embraced in other cropping systems to guide management.
Without considering soil N transformations, the soil surface NB at farm scale shows an improved N content in the cropping systems since a positive surplus remains in the soil (Table 3). Considering the soil surface, NB positive balances were recorded at the farm level in farms with and without mineral N application). In farms without mineral N application, the primary source of N inflow was from atmospheric deposition of N estimated to be 15 kg N ha−1. In addition, BNF estimated was also very low, ranging from 6.99 to 16.7 kg N ha−1. Therefore, this category of farmers need to explore other sources of the organic source to replenish their fields and increase N availability in the soils for higher crop yield and balanced nutrition because this particular inflow is too low and because of the high cost of fertilizers.
The soil system NB for farms recorded a deficit of <50 kg N ha−1 in the category of farmers not applying mineral N, while the farmer using mineral none catchment exceeded a deficit of above −50 kg N ha−1 (Table 4). The negative values indicated the extent of N depletion due to inadequate N supply, while positive values showed a loss of N that was taken up by the intended crop. Low or no N inputs among farmers could be attributed to the lack of policies by national and local governments to enhance affordability, accessibility, and use of mineral fertilizer in various cropping systems (Ciceri and Allanore, 2019).
NUE represented the efficiency of N in production process and showed in different categories of fields (maize and rice; either applying or not applying fertilizers) indicated poor efficiency of the available N resource in the cropping systems (Figures 2, 3). NUEs exceeding 100% in Nyando and Sondu for maize farmers (Figure 1C) not applying mineral N represented excessive N mining in the fields.
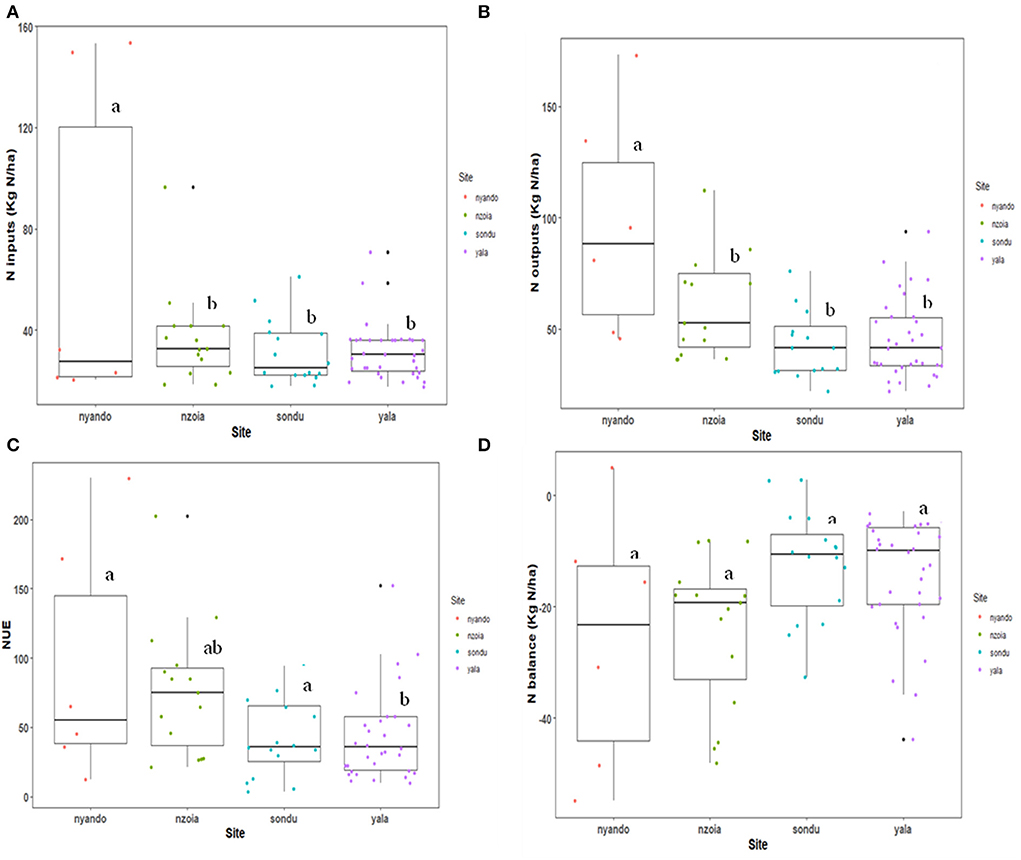
Figure 2. Box plots for Maize (A) nitrogen inputs (kg N/ha), (B) outputs (kg N/ha), (C) NUE, and (D) Balance (kg N/ha), in four catchment areas of Lake Victoria basin for farmers with the application of mineral N fertilizer.
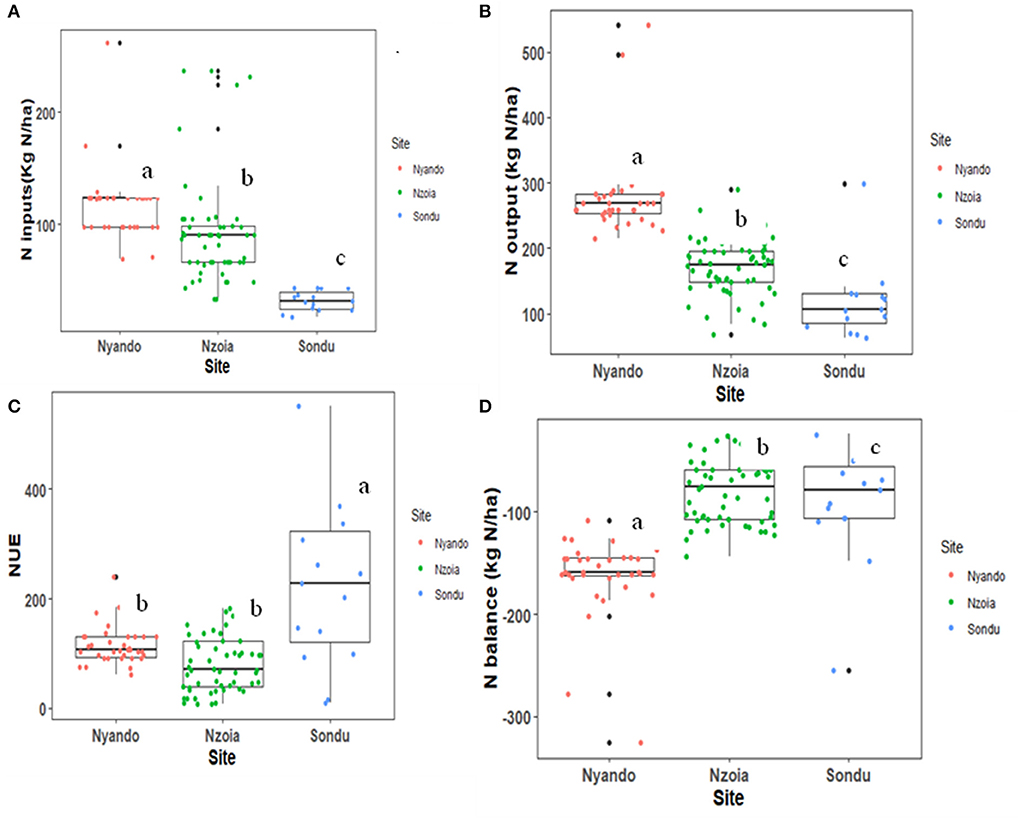
Figure 3. Box plots rice (A), nitrogen input (B), nitrogen output (C), and NUE and nitrogen balance (D), with farmers with applied mineral N fertilizers. There was no category of farmers not applying mineral N in rice fields.
On the contrary, in rice fields where farmers had access to mineral N, there was higher NUE (224.6 %) in Sondu (Figure 3C). The higher NUE value is due to low N input and higher N output in crop harvest. This demonstrates that, despite the addition of mineral N, there must be a balance to match available soil N and crop demand. Higher soil N mining in fertilized rice fields may be due to higher biomass accumulation with more available N in the soil influencing crop N uptake, whereas this is not the case in non-N applied fields.
According to EUNEP, a threshold for assessing the efficiency of N in cropping systems is between 50 and 90%, which most scenarios in our studies exceeded, and thus this shows the need for better strategies to optimize the NUE. These findings agree with Edmonds et al. (2009), on, estimated values of NUE are more than 100% in cereal production systems, especially in rice, due to low average application rates of mineral N that leads to a decline in soil fertility. Omara et al. (2019) revealed that high fertilizer applications in cereals result in lower NUE, while low or zero N inputs lead to extremely high depletion of the N pool in the soils. According to Bruulsema et al. (2009), it is also possible to apply sufficient N and boost N use efficiency through split application and adherence to 4R nutrient stewardship, which is crucial for closing the crop yield gaps without significant high losses of N to the environment.
Overall, our findings exhibited spatial variability on the indicators based on the four catchments under study. In Nyando, all the cases showed an extreme deficit for NUE in both fields with and without the application of mineral N fertilizers. This could be due to different soil properties in the regions characterized and defined by Ntinyari et al. (2022a). Vertisol in Nyando, Fluvisols in Sondu, humic gleysols in Nzoia, and Ferralsols in Yala. In Nyando, the Vertisol having high N requirements resulting in more N mining in both fields with mineral N and without for both crops. Besides. The soils in Nyando have a higher clay percentage with swelling, shrinking, low soil organic carbon and deep cracking property causing deterioration in soil health; hence, more improved and sustainable practices for improved N cycling within the region. Therefore, these differences in soil properties could contribute to the variabilities in the two indicators assessed for the various catchments.
The relevance of NB in assessment of N management at the field and farm level as per the analysis of the current study is to help understand N cycling and assess the efficacy of applied measurements through identifying deficits and surplus in the systems. This is achieved through quantifying the main fluxes in an input-output model as defined by either field or farm boundaries (Cameira et al., 2019). Morever, it provides linkages between agricultural N uses and the losses to the environment. Furthermore, NB provides policymakers with a tool to monitor environmental impacts resulting from agricultural production and make informed choices. On the other hand, NUE, as determined in this study, is useful in evaluating the efficiency of applied N in the systems by defining the regions of soil N mining, N inefficiency, and N neutrality. As revealed from this analysis, NUE represented high values showing inefficiency for both fields with mineral N application and without. More pronounced values above the threshold were evident in rice farmers where mineral N was highly applied.
The results of this study show atmospheric deposition as the primary source of N in the Lake Victoria region in the majority of farms and fields where farmers do not use any mineral N. Managing N sources from atmospheric deposition could be challenging since a significant proportion may end up in unintended areas, for instance, water bodies or uncultivated land where runoff is more likely causing more pollution to the environment. Given that the N use of fertilizer in sub-Sahara Africa is low with many cases of no use, these results indicate a need for improved use of fertilizers to change farm N balances to +ve. Across the two cropping systems, the soil system registered higher N losses than the soil surface, implying significant outflows from denitrification, leaching, runoff, and N2O and NH3 emissions and pointing to a need for improved N management. These results affect environmental management, policy-making, and optimal agricultural resource management. These results could potentially be applied in projecting N dynamics for over 3 million hectares where maize and rice are grown in this region.
Several cases presented herein have indicated significantly higher negative balances in the N applied farms relative to non-N applied plots. The results indicate significant losses of applied N to the environment with a potential to pollute water bodies and contribute to increased N2O emission (Tables 1–3). Furthermore, negative balances imply poor management, which results in the extraction of available N resources. This implies that farmers will require widespread capacity building in order to implement NUE optimizing practices. Furthermore, managing N losses could be accomplished through good agronomic practices such as integrated soil fertility management to improve nutrient balance.
An integrated approach is relevant toward reducing N losses in cropping systems to ensure a reduced negative impact on the environment soil degradation. These include promoting balanced nutrient management, the 4R nutrient stewardship, and integrated soil fertility management. As in recent studies by IFDC (2018), over 50% of fertilizers used in East Africa supply only N and P. Such nutrient imbalance alters crop uptake of N, contributing to losses and optimal NUE. A better-balanced application of fertilizers; ensuring availability of all essential nutrients is crucial for optimal N uptake, leading to minimizing losses. Additionally, whereas the majority of farmers apply most N fertilizers at planting, the 4R nutrient stewardship framework recommends splitting N application to 2- or 3-times during crop growth to match N supply with N demand by the crop, thus reducing the accumulation of N in soil and reducing such losses.
Our results revealed relatively low to no N use, particularly in maize fields, while in rice fields, most farmers had access to fertilizers. However, both categories did not imply proper management due to higher NUE than optimal values and negative N balance. Therefore, decision support tools that guide farmers on the rate and time of application of nutrients to reduce excess N in the soil and match crop requirements with availed N quantities, thus reducing the outflow of N from the agricultural system, should be given priority in this region. Some of the practical examples of decision support tools like the Nutrient Expert (NE) and Nutrient Manager for Rice (NMR) support the implementation of site-specific fertilizer management, leading to improved NUE (Sharma et al., 2019; Rurinda et al., 2020). Decision support tools make it possible to significantly manage N fertilizer application rates through improved NUE while sustaining or increasing crop yield levels (Wang et al., 2019).
Calculating agricultural N budgets include generalizations and assumptions Lassaletta et al. (2014). Particularly in Africa, with limited data on quantification of N flows at field and farm levels due to a lack of specialized systems for monitoring N fluxes. We relied on specific conversion factors to calculate crop N removal and BNF, which could produce some uncertainties due to crop variations and adaptations to local environmental conditions. For instance, BNF is determined based on the crop area of the legume using global N2 fixation rates. The approach for N budgeting does not also consider the available N in the soil but rather what goes in and comes out of the system.
We used the territorial emission factors as proposed by FAO (2001) and Bouwman et al. (2002) for different cropping systems (lowland or upland). In addition we applied, unified co-efficient for all regions to estimate losses on leaching and runoff as proposed by IPCC (2006). These N-loss pathways could vary even on the same farm and could produce intermediate values and therefore future studies should avoid this kind of uncertainty Similarly, losses via denitrification were determined on fixed factors based on the amount of N fertilizer application. Similarly, losses in gaseous losses, runoff, and leaching were limited to farms or fields with synthetic N fertilizer application due to the lack of emission factors for other sources of N, including BNF and atmospheric deposition.
Livestock manure was excluded from the N budget estimations due to the farmer's practices of burning manure or grazing the animals along the road. Of overnight grazing incidences, farmers use the dropping as a source of fuel/firewood. Due to the very low quality of the feed components, primarily grasses and crop residues, it is assumed that the excreta or the quality of the manure is very low and does not represent a significant N inflow into the farms. Burning and random grazing overall affect N cycling due to the associated losses of NH3 and N2O that could be very high without proper manure management.
At the farm level, imported feeds were also omitted from the N budgeting method due to the farmers' economic limitations in buying feeds for their livestock. Also, there is scanty information on the availability of the N co-efficient for manure. More public knowledge and policy advocacy on manure management and its implications for N cycling is crucial. In addition, the role of straw management in N cycling should be emphasized to encourage farmers to leave crop residues in the field other than burning to enhance the sustainability of the system regarding nutrient cycling. N in irrigation water, particularly in rice systems, was omitted due to budgeting lack of data on N contents concentration and the amount of water supplied in the growing season. This could vary due to limitations in irrigation water. Leguminous trees in the farms were also not accounted for in the estimation due to the absence of N fixation rates to make the estimation.
The method used to determine field level NUE does not account for indigenous soil N or N mineralization during the cropping season's growth. It was challenging to determine NUE at the farm level due to the complexity in defining the farm boundary and the products needed to adopt the unified methodologies for NUE. At the farm level, there are complexities in nutrient flows. However, future studies should focus on defining the boundaries to enhance a more straightforward determination of N efficiency and overall farm management. Despite these limitations, the current study data provides a comprehensive scenario of the N budgets status at field and farm levels. Future studies on N budgeting within the Lake Victoria basin should focus on establishing long-term experiments at the field and farm level for accurate measurements for the transformation of N in soil gradients under specific rates of N fertilization to reduce existing uncertainties in such studies (Elrys et al., 2019).
Our analysis of nitrogen budget and use efficiencies offers a better interepreation and explanation on N management at field and farm levels. We report for the first time N budgets and NUE characterization for smallholder farms within Lake Victoria, highlighting excessive soil N mining and above the safe operating boundary for N in production systems, although with uncertainties due to limited data sources and lack of specialized systems to accurately monitor N flows at smaller spatial scale. The N mining reported is due to low input of N fertilizers and poor management practices in scenarios where farmers apply N in their field. Maize fields have relatively low N input with an average range of 10.42–22.99 kg N ha−1. The insufficient use of N input also contributes to un-optimal NUE, with values surpassing NUE operational threshold for cropping systems. In rice fields, particularly in Nyando and Nzoia, with a higher rate of N application 102.19 and 77.78 kg N ha−1, better agronomic practices should be implemented to improve the NUE. The knowledge gap still exists due to difficulty quantifying actual N flows, hence the need for improved and better quantification of N fluxes into the cropping systems. Informing the strategic policy-making process will entail closing all the uncertainties in determining N budgets. In addition, effective policies should target improving the current scenario of low to zero N input through increasing the availability of fertilizers and affordable prices and encouraging the use of organic sources of N to increase sustainability in farms.
The original contributions presented in the study are included in the article/Supplementary material, further inquiries can be directed to the corresponding author.
CM formulated the idea for this article. WN, MG, JG-O, JM, and GN reviewed the methodologies. WN collected the data, performed the statistical analysis, and wrote the first manuscript. WN and CM revised the manuscript. All authors reviewed the manuscript, provided input and suggestions in the text, and approved the submitted version of the manuscript.
The authors wish to acknowledge toward an International Nitrogen Management System (INMS) project through the International Institute of Tropical Agriculture (IITA) for providing financial support for this study.
We thank the International Institute of Tropical Agriculture (IITA) for facilitating this study.
The authors declare that the research was conducted in the absence of any commercial or financial relationships that could be construed as a potential conflict of interest.
All claims expressed in this article are solely those of the authors and do not necessarily represent those of their affiliated organizations, or those of the publisher, the editors and the reviewers. Any product that may be evaluated in this article, or claim that may be made by its manufacturer, is not guaranteed or endorsed by the publisher.
The Supplementary Material for this article can be found online at: https://www.frontiersin.org/articles/10.3389/fsufs.2022.1023579/full#supplementary-material
AFDB (2020). Africa's Fertilizer Sector and the Bank's High 5 s. Abidjan: AFDB. Available online at: https://www.afdb.org (accessed July 2, 2021).
AGRA (2019). Feeding Africa Soils: Fertilizers to Support Africa's Agricultural Transformation. Nairobi: Alliance for a Green Revolution in Africa (AGRA).
Atieno, M., Herrmann, L., Nguyen, H. T., Phan, H. T., Nguyen, N. K., Srean, P., et al. (2020). Assessment of biofertilizer use for sustainable agriculture in the Great Mekong Region. J. Environ. Manag. 275, 111300. doi: 10.1016/j.jenvman.2020.111300
Bakayoko, A., Galy-Lacaux, C., Yoboué, V., Hickman, J. E., Roux, F., Gardrat, E., et al. (2021). Dominant contribution of nitrogen compounds in precipitation chemistry in the Lake Victoria catchment (East Africa). Environ. Res. Lett. 16, 045013. doi: 10.1088/1748-9326/abe25c
Bouwman, A. F., Boumans, L. J. M., and Batjes, N. H. (2002). Emissions of N2O and NO from fertilized fields: summary of available measurement data. Glob. Biogeochem. Cycles 16, 6–1. doi: 10.1029/2001GB001811
Bruulsema, T., Lemunyon, J., and Herz, B. (2009). Know your fertilizer rights. Crops Soils 42, 13–18.
Cameira, M. R., Rolim, J., Valente, F., Faro, A., Dragosits, U., and Cordovil, C. M. (2019). Spatial distribution and uncertainties of nitrogen budgets for agriculture in the Tagus River basin in Portugal: implications for effectiveness of mitigation measures. Land Use Policy 84, 278–293. doi: 10.1016/j.landusepol.2019.02.028
Chianu, J. N., Chianu, J. N., and Mairura, F. (2012). Mineral fertilizers in the farming systems of sub-Saharan Africa: a review. Agron. Sustain. Develop. 32, 545–566. doi: 10.1007/s13593-011-0050-0
Ciceri, D., and Allanore, A. (2019). Local fertilizers to achieve food self-sufficiency in Africa. Sci. Total Environ. 648, 669–680. doi: 10.1016/j.scitotenv.2018.08.154
Dalgaard, T., Brock, S., Graversgaard, M., Hansen, B., Hashemi, F., Häsler, B., et al. (2017). “Sustainable nitrogen management in Denmark,” in Innovative Solutions for Sustainable Management of Nitrogen. Aarhus: Wageningen University 13–16.
Edmonds, D. E., Abreu, S. L., West, A., Caasi, D. R., Conley, T. O., Daft, M. C., et al. (2009). Cereal nitrogen use efficiency in sub-Saharan Africa. J. Plant Nutri. 32, 2107–2122. doi: 10.1080/01904160903308184
Eggleston, H. S., Buendia, L., Miwa, K., Ngara, T., and Tanabe, K. (2006). 2006 IPCC Guidelines for National Greenhouse Gas Inventories.
Elrys, A. S., Abdel-Fattah, M. K., Raza, S., Chen, Z., and Zhou, J. (2019). Spatial trends in the nitrogen budget of the African agro-food system over the past five decades. Environ. Res. Lett. 14, 124091. doi: 10.1088/1748-9326/ab5d9e
EUNEP (2015). Nitrogen Use Efficiency (NUE) an Indicator for the Utilization of Nitrogen in Food Systems. Alterra: Wageningen University.
EUNEP and NUE. (2016). Guidance Document for Assessing NUE at Farm Level. Alterra: Wageningen University. Available online at: http://www.eunep.com/wp-content/uploads/2019/09/NUEGuidance-Document.pdf (accessed October 12, 2021).
FAO. (2001). Global Estimates of Gaseous Emissions of NH3, NO and N2O from Agricultural Land. Rome: Food and Agriculture Organization of the United Nations
Fixen, P., Brentrup, F., Bruulsema, T., Garcia, F., Norton, R., and Zingore, S. (2015). Nutrient/fertilizer use efficiency: measurement, current situation and trends. Manag. Water Fertil. Sustain. Agric. Intensif. 270.
Gu, B., Ju, X., Chang, J., Ge, Y., and Vitousek, P. M. (2015). Integrated reactive nitrogen budgets and future trends in China. Proc. Natl. Acad. Sci. 112, 8792–8797. doi: 10.1073/pnas.1510211112
Hofstra, N., and Bouwman, A. F. (2005). Denitrification in agricultural soils: summarizing published data and estimating global annual rates. Nutr. Cycl. Agroecosyst. 72, 267–278. doi: 10.1007/s10705-005-3109-y
IFDC (2018). Assessment of Fertilizer Distribution and Opportunities for Developing Fertilizer Blends. Results for AGRA Commissioned Multi-Country Studies. Muscle Shoals, AL: IFDC. Available online at: www.agra.org
IPCC. (2006). “N2O emissions from managed soils, and CO2 emissions from lime and urea application,” in IPCC Guidelines for National Greenhouse Gas Inventories, Prepared by the 367 National Greenhouse Gas Inventories Programme, Vol. 4 (Hayama: Institute for Global Environmental 368 Strategies), 1–54.
Jayne, T. S., and Sanchez, P. A. (2021). Agricultural productivity must improve in sub-Saharan Africa. Science 372, 1045–1047. doi: 10.1126/science.abf5413
Jones, D. L., Cross, P., Withers, P. J., DeLuca, T. H., Robinson, D. A., Quilliam, R. S., et al. (2013). Nutrient stripping: the global disparity between food security and soil nutrient stocks. J. Appl. Ecol. 50, 851–862. doi: 10.1111/1365-2664.12089
Kayombo, S., and Jorgensen, S. E. (2006). Lake Victoria: Experience and Lessons Learned Brief. Kusatsu: International Lake Environment Committee, Lake Basin Management Initiative.
Lassaletta, L., Billen, G., Grizzetti, B., Anglade, J., and Garnier, J. (2014). 50 year trends in nitrogen use efficiency of world cropping systems: the relationship between yield and nitrogen input to cropland. Environ. Res. Lett. 9, 105011. doi: 10.1088/1748-9326/9/10/105011
Majiwa, E. B. O. (2017). Productivity and efficiency of the agricultural sector: Africa with a special focus on rice farming and processing in Kenya (Doctoral dissertation). Queensland University of Technology.
Masso, C., Baijukya, F., Ebanyat, P., Bouaziz, S., Wendt, J., Bekunda, M., et al. (2017). Dilemma of nitrogen management for future food security in sub-Saharan Africa: a review. Soil Res. 55, 425–434. doi: 10.1071/SR16332
McLellan, E. L., Cassman, K. G., Eagle, A. J., Woodbury, P. B., Sela, S., Tonitto, C., et al. (2018). The nitrogen balancing act: tracking the environmental performance of food production. BioScience 68, 194–203. doi: 10.1093/biosci/bix164
Nimmo, J., Lynch, D. H., and Owen, J. (2013). Quantification of nitrogen inputs from biological nitrogen fixation to whole farm nitrogen budgets of two dairy farms in Atlantic Canada. Nutr. Cycl. Agroecosyst. 96, 93–105. doi: 10.1007/s10705-013-9579-4
Nkonya, E., Kaizzi, C., and Pender, J. (2005). Determinants of nutrient balances in a maize farming system in eastern Uganda. Agric. Syst. 85, 155–182. doi: 10.1016/j.agsy.2004.04.004
Nkonya, E., Place, F., Kato, E., and Mwanjololo, M. (2015). “Climate risk management through sustainable land management in Sub-Saharan Africa,” in Sustainable Intensification to Advance Food Security and Enhance Climate Resilience in Africa (Cham: Springer), 75–111. doi: 10.1007/978-3-319-09360-4_5
Ntinyari, W., Giweta, M., Gweyi-Onyango, J., Mochoge, B., Mutegi, J., Nziguheba, G., et al. (2022a). Assessment of the 2006 Abuja fertilizer declaration with emphasis on nitrogen use efficiency to reduce yield gaps in maize production.
Ntinyari, W., Gweyi-Onyango, J., Giweta, M., Mochoge, B., Mutegi, J., Nziguheba, G., et al. (2022b). Nitrogen use efficiency trends for sustainable crop productivity in Lake Victoria basin: smallholder farmers' perspectives on nitrogen cycling. Environ. Res. Commun. 4, 015004. doi: 10.1088/2515-7620/ac40f2
Oenema, O., Kros, H., and de Vries, W. (2003). Approaches and uncertainties in nutrient budgets: implications for nutrient management and environmental policies. Eur. J. Agron. 20, 3–16. doi: 10.1016/S1161-0301(03)00067-4
Okungu, J. O., Njoka, S., Abuodha, J. O. Z., and Hecky, R. E. (2005). An introduction to Lake Victoria catchment, water quality, physical limnology, and ecosystem status (Kenyan sector). Frontiers Media SA. 5. doi: 10.3389/fsufs.2021.758724
Omara, P., Aula, L., Oyebiyi, F., and Raun, W. R. (2019). World cereal nitrogen use efficiency trends: review and current knowledge. Agrosyst. Geosci. Environ. 2, 1–8. doi: 10.2134/age2018.10.0045
Quemada, M., Lassaletta, L., Jensen, L. S., Godinot, O., Brentrup, F., Buckley, C., et al. (2020). Exploring nitrogen indicators of farm performance among farm types across several European case studies. Agric. Syst. 177, 102689. doi: 10.1016/j.agsy.2019.102689
R Core Team R (2020). Language and Environment for Statistical Computing. Vienna: R Core Team R. Available online at: http://www.r-project.org/ (accessed June 15, 2020).
Reynolds, T. W., Waddington, S. R., Anderson, C. L., Chew, A., True, Z., and Cullen, A. (2015). Environmental impacts and constraints associated with the production of major food crops in Sub-Saharan Africa and South Asia. Food Sec. 7, 795–822. doi: 10.1007/s12571-015-0478-1
Rurinda, J., Zingore, S., Jibrin, J. M., Balemi, T., Masuki, K., Andersson, J. A., et al. (2020). Science-based decision support for formulating crop fertilizer recommendations in sub-Saharan Africa. Agric. Syst. 180, 102790. doi: 10.1016/j.agsy.2020.102790
Sharma, B., Vaish, B., Singh, U. K., Singh, P., and Singh, R. P. (2019). Recycling of organic wastes in agriculture: an environmental perspective. Int. J. Environ. Res. 13, 409–429. doi: 10.1007/s41742-019-00175-y
Sharma, L. K., and Bali, S. K. (2017). A review of methods to improve nitrogen use efficiency in agriculture. Sustainability 10, 51. doi: 10.3390/su10010051
Sileshi, G. W., and Gebeyehu, S. (2021). Emerging infectious diseases threatening food security and economies in Africa. Glob. Food Sec. 28, 100479. doi: 10.1016/j.gfs.2020.100479
Smil, V. (1999). Nitrogen in crop production: an account of global flows. Glob. Biogeochem. Cycles 13, 647–662. doi: 10.1029/1999GB900015
Sutton, M. A., Bleeker, A., Howard, C. M., Erisman, J. W., Abrol, Y. P., Bekunda, M., et al. (2013). Our Nutrient World. The Challenge is to Produce More Food and Energy with Less Pollution. Lancaster: Centre for Ecology and Hydrology.
Swarbreck, S. M., Wang, M., Wang, Y., Kindred, D., Sylvester-Bradley, R., Shi, W., et al. (2019). A roadmap for lowering crop nitrogen requirement. Trends Plant Sci. 24, 892–904. doi: 10.1016/j.tplants.2019.06.006
Tan, Z. X., Lal, R., and Wiebe, K. D. (2005). Global soil nutrient depletion and yield reduction. J. Sustain. Agric. 26, 123–146. doi: 10.1300/J064v26n01_10
Vitousek, P. M., Naylor, R., Crews, T., David, M. B., Drinkwater, L. E., Holland, E., et al. (2009). Nutrient imbalances in agricultural development. Science 324, 1519–1520. doi: 10.1126/science.1170261
Wang, Y., Ying, H., Yin, Y., Zheng, H., and Cui, Z. (2019). Estimating soil nitrate leaching of nitrogen fertilizer from a global meta-analysis. Sci. Total Environ. 657, 96–102. doi: 10.1016/j.scitotenv.2018.12.029
Zhang, X., Davidson, E. A., Zou, T., Lassaletta, L., Quan, Z., Li, T., et al. (2020). Quantifying nutrient budgets for sustainable nutrient management. Glob. Biogeochem. Cycles 34, e2018GB006060. doi: 10.1029/2018GB006060
Zhou, M., Brandt, P., Pelster, D., Rufino, M. C., Robinson, T., and Butterbach-Bahl, K. (2014). Regional nitrogen budget of the Lake Victoria Basin, East Africa: syntheses, uncertainties, and perspectives. Environ. Res. Lett. 9, 105009. doi: 10.1088/1748-9326/9/10/105009
Keywords: cropping system, mineral fertilizer, N losses, N management, soil depletion
Citation: Ntinyari W, Gweyi-Onyango J, Giweta M, Mutegi J, Mochoge B, Nziguheba G and Masso C (2022) Nitrogen budgets and nitrogen use efficiency as agricultural performance indicators in Lake Victoria basin. Front. Sustain. Food Syst. 6:1023579. doi: 10.3389/fsufs.2022.1023579
Received: 19 August 2022; Accepted: 07 October 2022;
Published: 21 October 2022.
Edited by:
Sudhakar Srivastava, Banaras Hindu University, IndiaReviewed by:
Christopher Neill, Marine Biological Laboratory (MBL), United StatesCopyright © 2022 Ntinyari, Gweyi-Onyango, Giweta, Mutegi, Mochoge, Nziguheba and Masso. This is an open-access article distributed under the terms of the Creative Commons Attribution License (CC BY). The use, distribution or reproduction in other forums is permitted, provided the original author(s) and the copyright owner(s) are credited and that the original publication in this journal is cited, in accordance with accepted academic practice. No use, distribution or reproduction is permitted which does not comply with these terms.
*Correspondence: Winnie Ntinyari, dy5udGlueWFyaUBjZ2lhci5vcmc=
Disclaimer: All claims expressed in this article are solely those of the authors and do not necessarily represent those of their affiliated organizations, or those of the publisher, the editors and the reviewers. Any product that may be evaluated in this article or claim that may be made by its manufacturer is not guaranteed or endorsed by the publisher.
Research integrity at Frontiers
Learn more about the work of our research integrity team to safeguard the quality of each article we publish.