- 1Sustainable Vegetable Production Lab, Department of Horticulture, Iowa State University, Ames, IA, United States
- 2Soil Plant Interactions Lab, Department of Agronomy, Iowa State University, Ames, IA, United States
Summer cover crops (SCCs) provide valuable agroecosystem services to growers using spring and autumn vegetable crop rotations. Choosing the right SCCs to maximize agroecosystem services and fit growers' interests is challenging due to the wide array of SCC functions and one benefit may come at the cost of another (i.e., a tradeoff). In particular, fast-growing grasses may produce greater SCC biomass but may immobilize plant-available N needed by the autumn vegetable crop. We conducted a field study in Ames, Iowa US to compare agroecosystem services – weed suppression, autumn cabbage yield, soil nutrients, and net nitrogen (N) mineralization of eight SCC species over 2 years. Cover crop species were grown for an average of 55 days and included: brown top millet (Panicum ramosum L., BTM), buckwheat (Fagopyrum esculentum Moench, “Mancan”, BW), cowpea (Vigna unguiculata (L). Walp., “Iron and Clay”, CP), flax (Linum usitassimum L. “Golden”, GF), mung bean (Vigna radiata (L.) R. Wilczek, MB), sunnhemp (Crotalaria juncea L., SH), sorghum sudangrass (Sorghum bicolor L. Moench x Sorghum sudanense Piper Staph. “Sorgrow BMR Dwarf”, SS), and Teff grass (Eragrostis tef (Zuccagni) “Selam”, TEF), and a no-SCC control (NCC) treatment. The range of mean cover crop biomass was 0.8 (cowpea) to 7.5 (teff grass) Mg ha−1. There was a strong, negative correlation between SCC biomass and weed biomass (R2 = 0.83). Low biomass producing legumes resulted in greater weed biomass, but 34–58% greater cabbage yield in one of two experimental years. Ion exchange membranes (IEMs) were not able to capture differences in total net N mineralization among SCC treatments however, soil inorganic N was greater under legume SCCs at SCC termination. We show there are tradeoffs when choosing SCCs between weed suppression and net N mineralization and that the environmental conditions, i.e., climate, regulate whether these tradeoffs favor greater vegetable crop yields.
Introduction
Summer cover cropping, although relatively unexplored, provides an opportunity for implementing CCs in vegetable cropping systems (Kaspar and Singer, 2011). Short-duration SCCs can provide benefits to the subsequent autumn vegetable cash crop, by way of weed suppression (Osipitan et al., 2019), Nitrogen (N) provisioning (Finney et al., 2009), and increased soil organic matter (SOM) (Creamer and Baldwin, 2000). Choosing a SCC however, is challenging due to the wide variety of CC options, covering multiple functions, available to spring-autumn vegetable growers. Making an appropriate selection depends on the grower's objectives and particular agroecosystem services the grower is interested in (Sustainable Agriculture Research and Education (SARE), 2012). Summer CCs can provide multiple agroecosystem services, widely referred to as “multi-functionality” (Byrnes et al., 2014; Blesh, 2018). On the other hand, there can also be tradeoffs between agroecosystem services provided by SCCs. For example, yield gains due to weed suppression from fast-growing grasses may be offset by immobilization of plant-available N (Abdul-Baki et al., 1997; Creamer and Baldwin, 2000).
There is strong evidence for the weed-suppressing benefits of SCCs. Summer CCs such as millet, sorghum sudangrass, buckwheat, and cowpea are well documented to suppress weeds (Abdul-Baki et al., 1997; Hutchinson and McGiffen, 2000; Finney et al., 2009; Bjokman and Shail, 2013; Kruse and Nair, 2016; Sturm et al., 2018). For example, sorghum sudangrass, in a conventional tilled system, reduced total weed biomass by 51 to 72% (Kruse and Nair, 2016) compared to a no-CC control sampled at CC termination. Bjokman and Shail (2013) found that buckwheat could keep weed biomass below 1 Mg ha−1 when planted 1 week following spring vegetable incorporation after just 6 weeks of growth.
The challenge, however, with high-biomass producing CCs is that they often have wide carbon to nitrogen (C:N) ratios (Hunter et al., 2019) which can drive net N immobilization of plant-available N (Vigil and Kissel, 1991; Hansen et al., 2021). Plant residue studies show that the net N mineralization/immobilization threshold value is somewhere between 20 and 40. Grass cover crop C:N ratios can range from 20 to 40:1 (Hunter et al., 2019) with the widest ratios during maturity rather than earlier growth stages (White et al., 2017). C:N ratios for SCCs (sorghum sudangrass, and millet) of 44 to 53:1 were thought to have caused net N immobilization (Creamer and Baldwin, 2000). Cover crops of C:N ratios of >20 have been documented causing net N mineralization of up to −28mg N g−1 of residue (Trinsoutrot et al., 2000; Jensen et al., 2005).
While the relationship between high-biomass-producing CCs and weed suppression appears rather straightforward, the relationship between leguminous CCs, weed suppression, and N provisioning is more mixed. When it comes to weed suppression leguminous SCCs can produce a varying range of biomass. Sunnhemp biomass ranged from 4.8 to 7.3 Mg ha−1 in East and Central AL, US (Mansoer et al., 1997) while cowpea and soybean CCs produced only 3 Mg ha−1 in Central New York, US (Brainard et al., 2011). In addition slower growth as compared to grasses can result in poor competition with weeds (Baraibar et al., 2018). Nitrogen provisioning to cash crops via N2 fixation and narrow C:N ratio is commonly reported as a benefit to the use of leguminous CCs in a crop rotation (Creamer and Baldwin, 2000; Kruse and Nair, 2016; Pissinati et al., 2018). However, N provisioning by leguminous CCs through N-fixation and biomass C:N can vary greatly and depend on factors such as stage of growth, species, and abiotic factors (Doran and Smith, 1991; Hunter et al., 2019). For example, the N content of sunnhemp at time of sampling (2.5 months of growth) was 144 kg N ha−1 (Balkcom and Reeves, 2005) while only 45 kg N ha−1 was measured in sunnhemp biomass at time of corn planting (Mansoer et al., 1997). However, a narrow C:N ratio of legume does not always translate into yield benefit to the following cash crop. Despite estimated N provided by SCCs ranging from 110 to 153 kg ha−1 there was no difference in the yield of fall broccoli that followed (Schellenberg et al., 2009). While Balkcom and Reeves (2005) found that corn grain yield following a sunnhemp cover crop with no supplemental N was greater as compared to fallow or fallow with additional 56 kg ha−1 N. Cherr et al. (2006) found that the combination of a sunnhemp CC and a winter green manure still required 133 kg N ha−1 from fertilizer to achieve marketable sweet corn yields. The need for fertilizer in combination with leguminous CCs despite narrow C:N ratio of tissues, could be the result of asynchronous N release by CCs and uptake by cash crops (Campiglia et al., 2011). For example, fresh market cabbage has been estimated to have an exponential N uptake curve (Fink and Feller, 1998; Duarte et al., 2019) with rapid uptake starting in the first couple of weeks after transplanting (Fink and Feller, 1998). O'Connell et al. (2015) determined peak N mineralization of legume CCs to be 5 weeks after CC termination. This N asynchrony dilemma is further compounded in organic production systems where use of N management is limited to materials that meet National Organic Program (NOP) guidelines (NOP USDA AMS, 2000 7 CFR 205.203). Without careful management use of CCs alone in organic production for N management can result in N limiting environments and reductions to cash crop yields.
Given that CCs are a common part of many organic vegetable crop rotations (Hartz et al., 2000; Haas et al., 2007; Kaspar and Singer, 2011; Blanco-Canqui et al., 2015; O'Connell et al., 2015) and the potential tradeoffs between weed suppression and N availability, we designed an experiment to compare eight SCC species ranging in functionality under organic production.
Our primary objectives were to monitor weed biomass, net N mineralization, and cabbage growth/yield in response to eight SCC species and a control treatment with no SCC. We hypothesized that: (1) SCCs with greater biomass will have lower weed biomass, (2) SCCs with a more narrow carbon-to-nitrogen (C:N) ratio will have more plant-available N for autumn vegetable crop via increased net N mineralization, (3) cabbage yield will increase with plant available N from SCCs with narrow C:N ratios (Figure 1; Abdul-Baki et al., 1997; Creamer and Baldwin, 2000). Or alternatively, cabbage yield will increase with degree of weed suppression (Figure 1B). These competing hypotheses illustrate trade-offs between SCC functional types, and impact on cash crop yields (Figure 1).
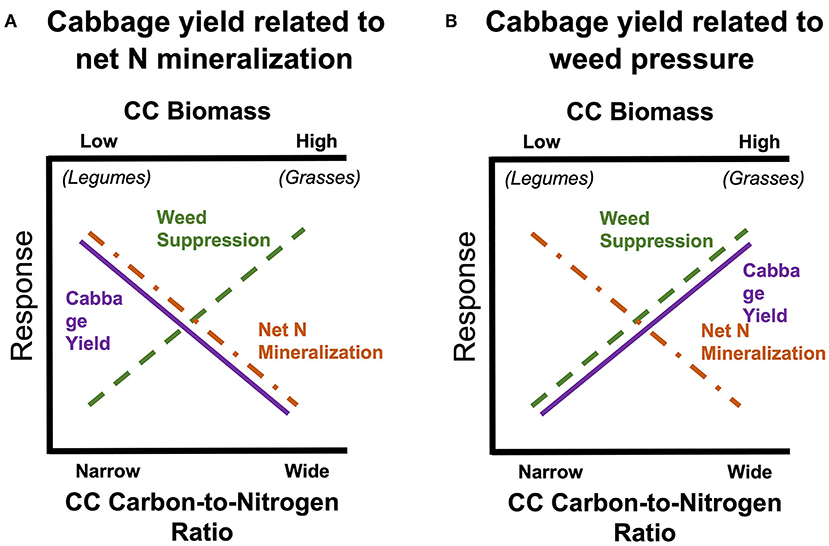
Figure 1. Conceptual diagram of our hypothesized relationship between cover crop biomass (also carbon-to-nitrogen ratio) and two negative responses: weed biomass and potential net N mineralization. This depicts that there is a “trade-off” between greater plant-available N, weed suppression, and yield.
Materials and methods
Site description
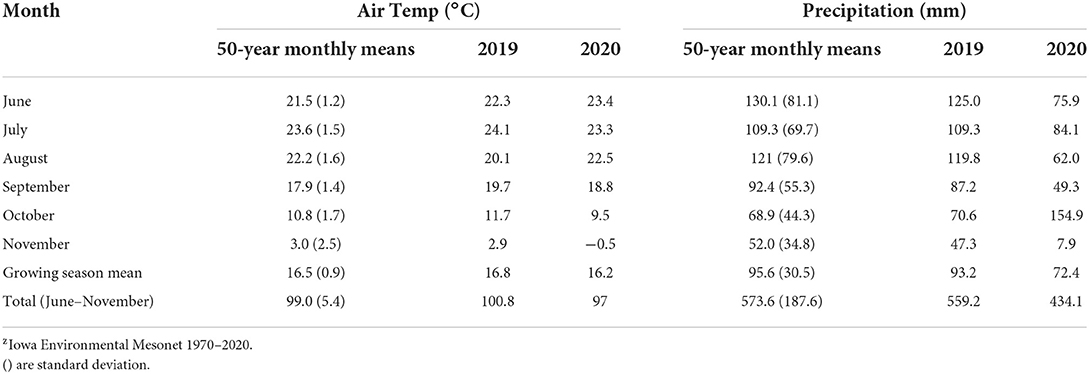
The study was carried out on certified organic land at the Iowa State University Horticulture Research Station in Ames, Iowa (latitude 42.106778, longitude −93.589583) from June through November 2019 and 2020. Cover crop plots were established in the same location each year such that the same treatments were in the same location as the previous year. The soils are derived from Wisconsinan glacial till, and primarily Clarion loam (fine-loamy, mixed, superactive, mesic Typic Hapludoll). The mean annual air temperature for the growing season during 2019 and 2020 was 16.8 and 16.2°C, respectively and precipitation was 93.2 and 72.4 mm for 2019 and 2020, respectively. Table 1 provides the 50-year mean temperature and precipitation. Before the establishment of the study, the plot was cover cropped with a mixture of Sunnhemp (Crotalaria juncea L.), cowpea (Vigna unguiculata (L). Walp), and sorghum sudangrass (Sorghum bicolor (L.) Moench xSorgum sudanense (Piper) Staph.) which was terminated in May 2019.
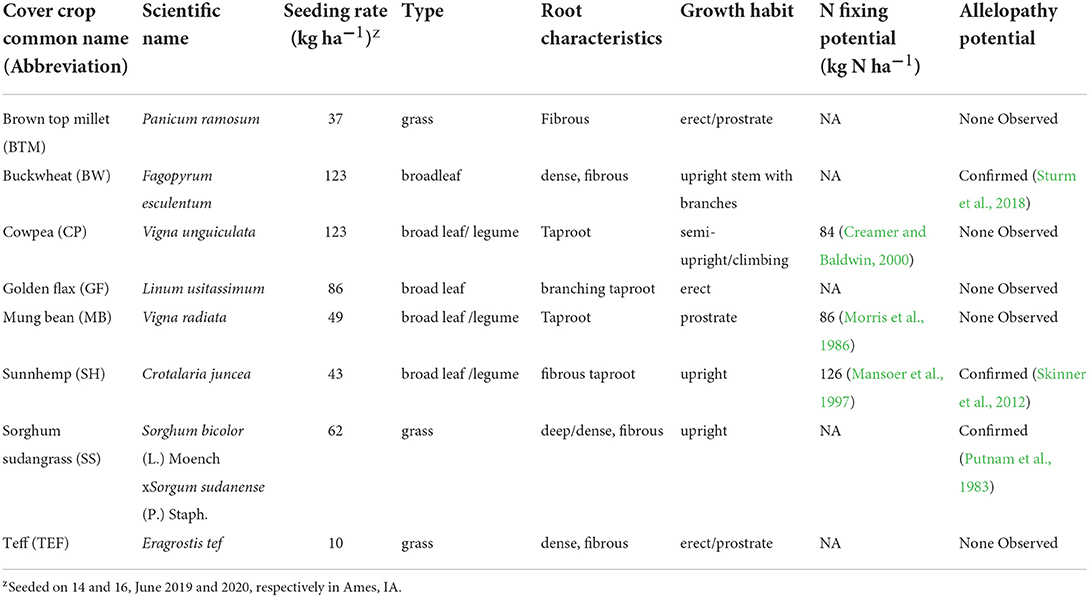
The study was set up as a randomized complete block design with four replications of nine treatments: eight short-durations CCs (Table 2) and a no-CC control (further referred to as NCC). Cover crops were all untreated and purchased from Green Cover Seed (Bladen, NE) (Supplementary Figure S1). The CCs characteristics and seeding rates are presented in Table 2. The selection of CC species was based on characteristics of rapid growth and heat tolerance. Following termination and incorporation of CCs in late summer, cabbage (Brassica oleraceae var. capitata L. “Red Express”) was planted.
Cover crop establishment
Details and dates of field preparation from cover crop seeding to cash crop harvest are presented in Table 3. Cabbage was planted following termination and incorporation of CCs in late summer. On 13 June 2019, and 14 June 2020. To establish CCs, plots were roto-tilled and then cultipacked to firm the seedbed. Each treatment was seeded to a 6 x 6 m plot. All CCs except mungbean were seeded by a drop spreader. Mung bean had to be seeded by hand due to seed crushing by the implement. Immediately after seeding, a drag harrow was pulled by a four-wheeler over the entire field to ensure seed-soil contact. Overhead irrigation was immediately installed to apply 2.5 cm of water which resulted in uniform germination of CCs within a week.
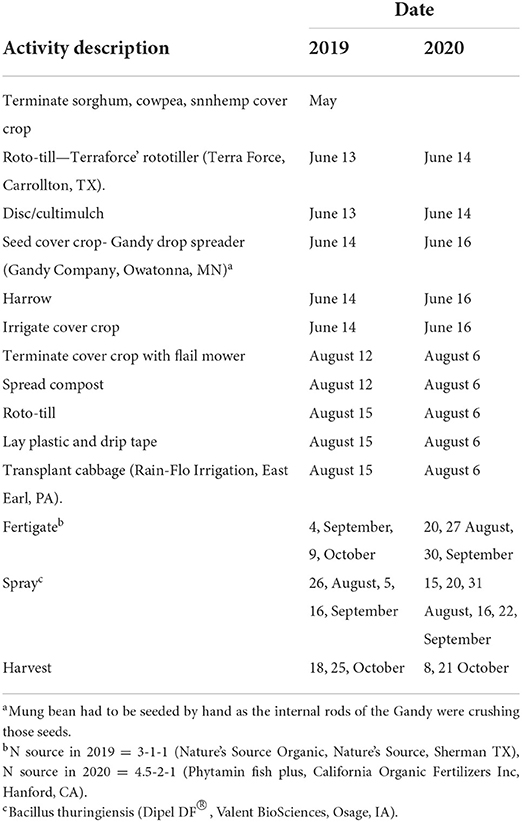
Table 3. The sequence of field activities carried out at the Iowa State Horticulture Research Farm 2019 and 2020.
Cover crop and weed biomass
Aboveground CC and weed biomass was collected on 9 and 4 August 2019 and 2020, respectively, and then terminated with a flail mower (Table 3). Briefly, two 50 x 50 cm quadrats were placed within each treatment and all aboveground plant material was cut at the soil level. Plants were categorized as CC or weeds (grass or broadleaf), placed in separate labeled paper bags, and dried to a constant weight at 67°C. Cover crop and weed biomass of each subsample was weighed separately after drying. Recorded dry weights of biomass from each subsample were averaged across the two samples. Dried CCs were ground to 1 mm using a Thomas Wiley Laboratory Mill (Thomas Scientific, Philadelphia PA). A 10 g sample of dried and ground CC from three replications was sent to Ward Laboratories (Kearney, NE) for analysis of percent C and N.
Vegetable culture
Cabbage “Red Express” (High Mowing Organic Seeds, Walcott, VT) transplant production took place in the Iowa State University Horticulture Hall Greenhouses, Ames, IA. On 5 and 2 July 2019 and 2020, respectively, cabbage seeds were sown into 72 cell plug trays filled with organic growing mix (Beautiful Land Products, West Branch, IA). Seedlings were grown for 6 and 5 weeks in 2019 and 2020, respectively. Fertilizer was applied to seedlings using a watering can and fertigated till saturation. Transplants were fertilized on 16 July and 2 August 2019 with N5.5–0–0 organic liquid fertilizer (Fertilgold, Gilbert, AZ) at a concentration of 400 mg L−1 and in 2020 with 4.5N−2P−1K (Phytamin fish plus, California Organic Fertilizers Inc, Hanford, CA) at a concentration of 300 mg L−1 on 16 and 23 July and 400 mg·L−1 on 30 July and 6 August.
Field preparation
Following termination of CCs, we applied and incorporated (Table 3) compost from the Iowa State University Compost Facility with a manure spreader at a rate of 50 Mg·ha−1 on a dry weight basis. The compost rate was determined based on the maximum capacity of the compost spreader used. Compost was analyzed for total N, phosphorus (P), potassium (K), OM, pH, and EC by the Environmental Research and Innovation Center (University of Wisconsin, Oshkosh, WI) (Supplementary Table S1). Vegetable plots were established within the terminated CC and the NCC treatments. Across each replication, two 1.5 m wide by 30.5 m long plastic mulch beds were established (Table 3). A plastic mulch layer was used to lay 0.025 mm thick black plastic mulch (Polyexpert Inc. Laval, Quebec) along with 16 mm diameter drip tape with 0.2 mm wall thickness and 20 cm emitter spacing (Toro Irrigation, Riverside, CA). On 15 and 6 August 2019 and 2020, respectively, 20 cabbage seedlings per replication were transplanted onto the plastic mulch beds using a water wheel transplanter (Table 3). Each bed consisted of two rows of cabbage with plants spaced 30 cm within and between rows. Cabbage transplants were hand watered directly after transplanting.
Fertigation using a liquid organic fertilizer supplied 4 and 9 kg of N per ha over the season in 2019 and 2020, respectively (Table 3). Cabbage plants were sprayed three times during the season each year to manage Cabbage looper (Trichoplusia ni) and imported cabbage worm (Pieris rapae) (Table 3). The area between cabbage beds and directly surrounding the cabbage plants was weeded once on 24 August 2019 and 1 September 2020 after which no other weeding occurred.
Mid-season cabbage measurements and weed data collection
Cabbage plant height and width were measured on 18 and 15 September in 2019 and 2020, respectively. Six plants from each treatment were measured from the base of the plant at soil level to the tip of the newest leaf for height, and by taking two measurements from each of the six plants from tip to tip of the longest leaves in two directions for plant width. On 20 and 17 September in 2019 and 2020, respectively, a mid-season weed biomass sample between plastic rows was collected by cutting all aboveground weeds at soil level from within two 25 x 25 cm quadrats placed randomly within each treatment plot. We sorted, dried, and weighed weeds according to the methods previously mentioned.
On the first cabbage harvest date of each year (Table 3), we harvested only firm heads, this included heads from all treatments except buckwheat and teff. On the second harvest date (Table 3), all heads were harvested, irrespective of quality. Cabbage heads were weighed to collect total yield. Weight of heads that were bolting or not fully formed was also recorded. Three cabbage heads per replication were selected and cut in half for measurement of head length, width, and internal core length. Width was measured from one of the cabbage halves at the widest point, length from the top of the head to harvested cut end, and core from the start of the core to the cut end.
Soil net N mineralization via ion exchange membranes (IEMs)
The day after cabbage transplanting, IEMs were deployed. IEMs were removed and placed weekly for 6 weeks. IEMs were used to capture the ammonium-N (NH-N) and nitrate-N (NO3-−N) released from both soil and CC residue mineralization. IEM materials were obtained from Suez Water Technologies and Solutions (Bensenville, IL) and cut into 1.5 x 7 cm strips before deployment. After CC termination and immediately after vegetable planting, two IEMs per plot were placed in all cabbage treatment plots just below the soil surface by making a 2.8 cm wide slit in the soil with a wooden stake. The IEMs were left in the field for 1-week intervals over 6 weeks. Preparation of IEMs for placement in the field and extraction followed methods adapted from Qian and Schoenau (1995, 2005, 2011), Subler et al. (1995), and McDaniel et al. (2014). Before IEM placement in the field, IEMs were rinsed for 10 min with 5% Hydrochloric acid (HCl) solution and triple rinsed with deionized (DI) water. IEMs were placed in plastic bags with DI water to keep them from drying, before deployment in the field. After removal from the field, IEMs were rinsed with DI water. For extraction of inorganic N (NO3-N and NH4-N), IEMs were placed in ziplock bags and shaken at 200 rpm for 60 min on a reciprocating shaker with 1.4 ml of 2 M potassium chloride (KCl) per square cm of resin, based on the “Protocol for Exchange Resin Strips” (Kellogg Biological Station, Michigan State University). After shaking, the 2 M KCl extractant was filtered through #1 filter paper into 20 ml scintillation vials and refrigerated at 3°C. Methods adapted from Doane and Horwáth (2003) were used to determine NO3-N and adsorbed to IEMs and methods adapted from Sinsabaugh et al. (2000) were used to determine NH4-N adsorbed to IEMs. Briefly, for extraction of NO3-N, extracts were placed onto 96 well microplates with 200 μl of vanadium chloride reagent and absorbance readings were collected using a spectrophotometer (Bio-Rad iMark, Bio-Rad Laboratories, Hercules CA) at 540 nm wavelength. For NH4-N, extracts were again plated onto 96 well microplates but 40 μl Ammonia Salicylate and 40 μl Ammonia Cyanurate reagents were used and absorbance readings were at 595 nm wavelength.
Soil sample collection and analyses
On 6 June 2019, a baseline soil sample was collected from the whole field by collecting and homogenizing ten 2.5 cm (0–15cm depth) soil cores to create a composite sample. The soil samples were sent to Solum Ag, Ames, IA for analysis of macronutrients, select micronutrients, pH, cation exchange capacity (CEC), electrical conductivity (EC), and percent organic matter (OM) (Supplementary Table S2). In addition to the baseline soil sampling on 6 June 2019, soil samples from each plot were collected after CC termination on 13 and 5 August 2019 and 2020, respectively, further referred to as “at termination”. A final soil sample was collected after vegetable harvest on 1 and 4 November 2019 and 2020, respectively, further referred to as “post-harvest”. At each sampling time (termination and post-harvest), six 2.5 cm soil cores at 0–15 cm depth from each 6 x 6 m plot were collected, homogenized to create a composite sample, sieved using a 4.76 mm sieve, and sent for analysis. Samples were sent to Solum Ag, Ames IA in 2019 and AgSource Laboratories, Ellsworth, IA in 2020 for the analysis of P, K, magnesium (Mg), calcium (Ca), sulfur (S), sodium (Na), zinc (Zn), pH, OM, and CEC. Soil was also analyzed for inorganic N (Minnesota Valley Testing Lab, Nevada, IA).
Statistical analysis
Data were analyzed using R statistical software version 3.6.3 (R-Core-Team, 2020). For all balanced and continuous data, the package lme4 (Bates et al., 2015) was used to determine the significance of fixed effects. An initial model included year as a fixed effect using lmer to look for significant year and treatment by year interactions. Most response variables had significant year effects so treatment differences were examined separately for each year. All data were examined using normal probability plots with functions qqnorm, qqline, plot (density) to check assumptions of normality and homoscedasticity. All soil, CC, and vegetable yield and quality data were analyzed as an RCBD. Proportion data was log transformed to meet assumptions of normality and homoscedasticity and back transformed for presentation in tables. To examine the response variables of soil chemical properties measured at two time points, a model that included sampling interval (SI) and the interactions among SI were included in the model. Analysis of repeated measures was performed on NO3- NO3-N data from IEMs using lmer with week as the repeated factor. Plot was considered the subject for the statement subject = ID. All data was subject to mean separation at α = 0.05 and considered significant at P < 0.05 adjusted using Tukey's HSD. When ANOVAs produced significant fixed effects, planned single degree of freedom contrasts were analyzed to test the hypotheses that legumes were different than grasses and each cover crop functional group different from NCC (grasses, legumes, forbes). To determine the significant effect of CC biomass on weed suppression, weed biomass was regressed on CC biomass using lm.
Results
Climate and general observations for 2019 and 2020
Our 2-year study investigating the effects of SCCs on weed suppression and N provisioning for fall cabbage production took place over two growing seasons, 2019 and 2020. Mean monthly air temperatures for June to Nov. were comparable to long-term, 50-year means (Table 1). Monthly precipitation, however, was quite variable among the two study years. Overall, 2020 was a drier year than 2019, by almost 100 mm during summer and autumn. In 2019, we had greater precipitation during both the CC establishment period (June-August) and cabbage growth period (August-November). as compared to 2020 however, October 2020 was wetter than 2019 by 84.3 mm. Overall we found that cover crop growth and N provisioning varied among years. Variation among years may be attributed to the differences in precipitation in the two study years. Despite these differences, the effect of precipitation on cover crop growth was not directly measured in this study.
Cover crop characteristics: Biomass, carbon and nitrogen content, and weed biomass
To investigate the potential benefits of eight summer CCs to weed suppression and N provisioning for fall organic cabbage production, we conducted a field study where eight summer CCs were grown in monoculture. After 8 weeks of growth, CCs were sampled and dry weight of cover crops and weeds were determined along with CCs carbon and N content.
Cover crop and weed biomass at termination
Cover crop biomass production ranged from 2.0–7.5 Mg·ha−1 in 2019 to 0.8–7.2 Mg·ha−1 in 2020 (Table 4). The least biomass was produced by cowpea, mungbean, and golden flax in both 2019 and 2020. The greatest biomass was produced by the grasses, buckwheat, and sunnhemp in 2019 and the grasses and buckwheat in 2020. Although sunnhemp biomass in 2020 was lower than the grasses it was not statistically different (Table 4). Overall, the presence of a cover crop suppressed weeds compared to NCC (Table 4). Suppression of weeds by CCs ranged from 99% to 17% weed reductions compared to the NCC. On average (across both years), brown top millet, buckwheat, and teff reduced weeds over the NCC control by ~95% (Table 4). Cover crop biomass was significantly, negatively correlated to weed biomass (P < 0.001; Figure 2A), and on average, high-biomass producing CCs (>5 Mg·ha−1) consistently reduced weeds below ~1 Mg·ha−1. Across all treatments, 2020 had greater weed biomass than 2019 (P < 0.01).
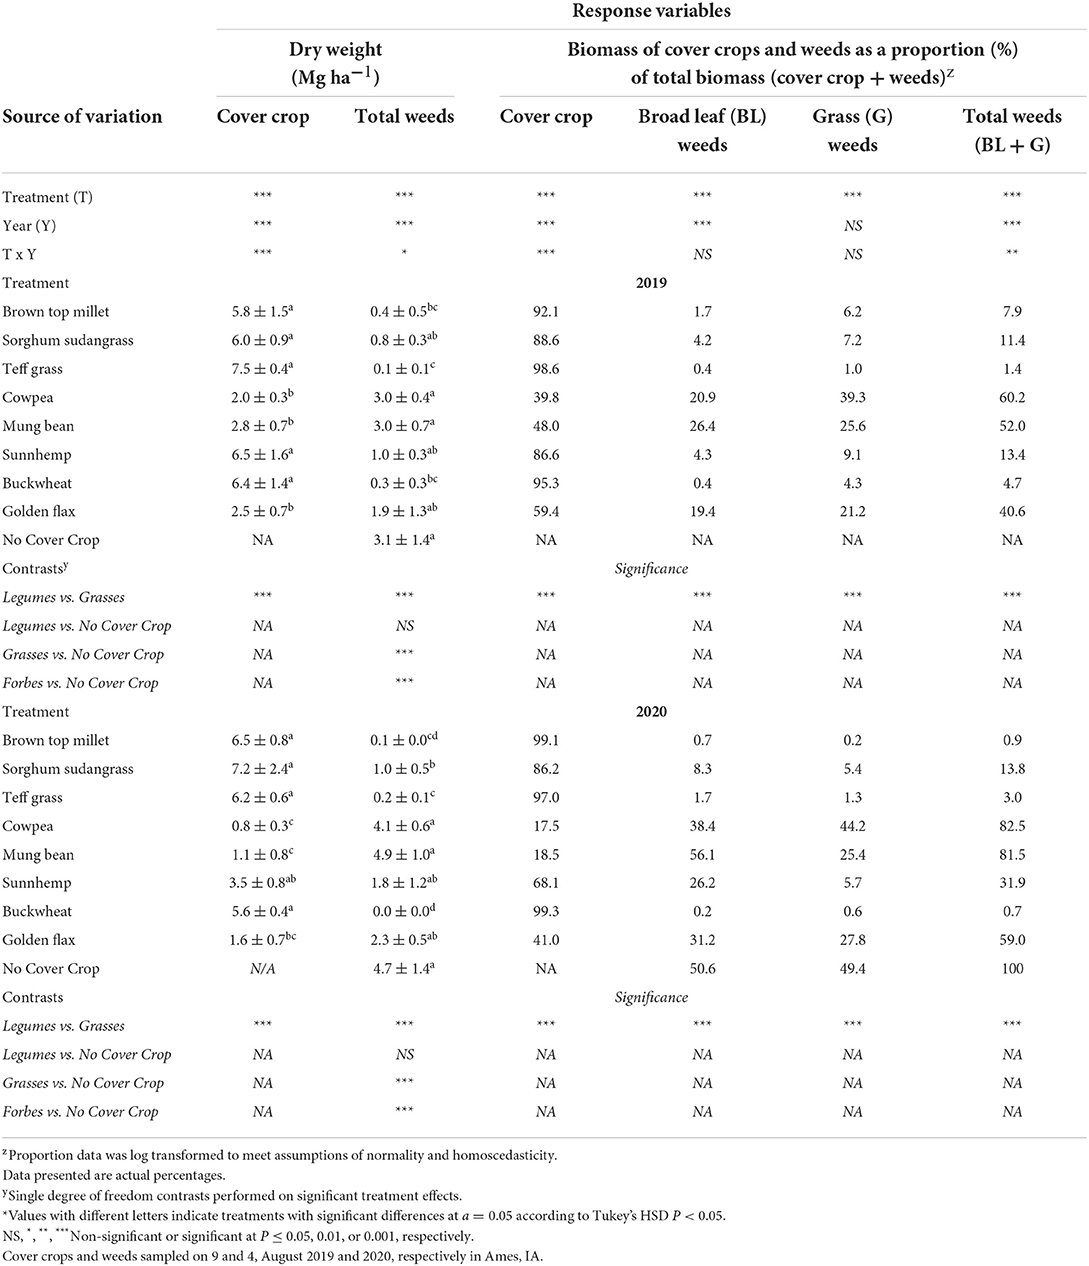
Table 4. Results of analysis of variance and treatment means for the effect of cover crop biomass, weed biomass, and the proportion of cover crops and weeds to total biomass and the associated single degree of freedom.
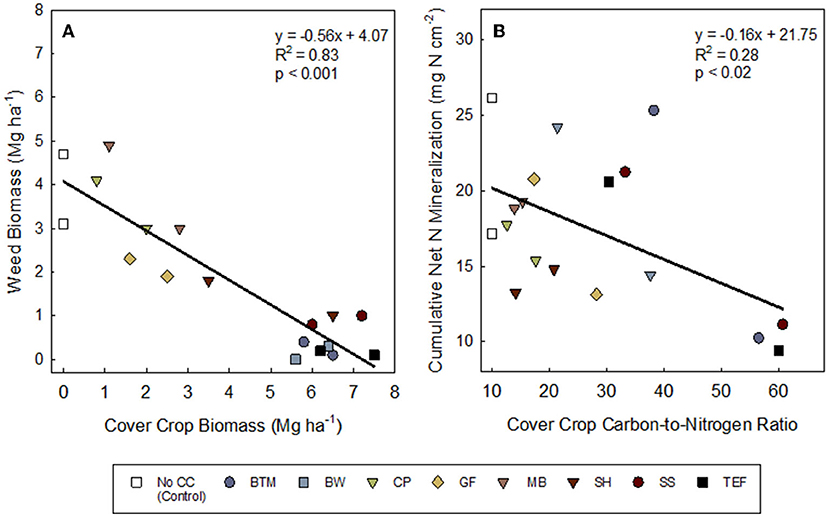
Figure 2. Relationships between (A) cover crop and weed biomass (Mg ha−1) and (B) cover crop tissue carbon-to-nitrogen ratio and potential cumulative net nitrogen mineralization measured with ion exchange mebranes. Both 2019 and 2020 data are included in the figure. Treatments: NCC, no cover crop (Control); BTM, brown top millet; BW, buckwheat; CP, cowpea; GF, golden flax; MB, mung bean; SH, sunnhemp; SS, sorghum sudangrass; TEF, teff. Leguminous cover crops are shown in downward triangle (∇).
Cover crop carbon and nitrogen content
As hypothesized, we had a strong gradient in C:N ratio of SCC biomass (Table 5). Generally, leguminous SCCs and golden flax had 40% greater N content, and a more narrow C:N ratio than grasses and buckwheat (Table 5). Legumes C:N ranged from 12.6 to 20.8, non-legume broadleaf CCs (buckwheat and golden flax) SCCs ranged from 17.3 to 37.6, and grasses C:N ranged from 30.4 to 60.7. Across both years, grasses had C:N ratios that were on average 2.6x wider as compared to golden flax and the legume SCCs. Interestingly, grass CCs and buckwheat all had wider C:N ratios in 2019 as compared to 2020 (P < 0.0001). While, the legume CCs and golden flax C:N did not seem to be affected by year.
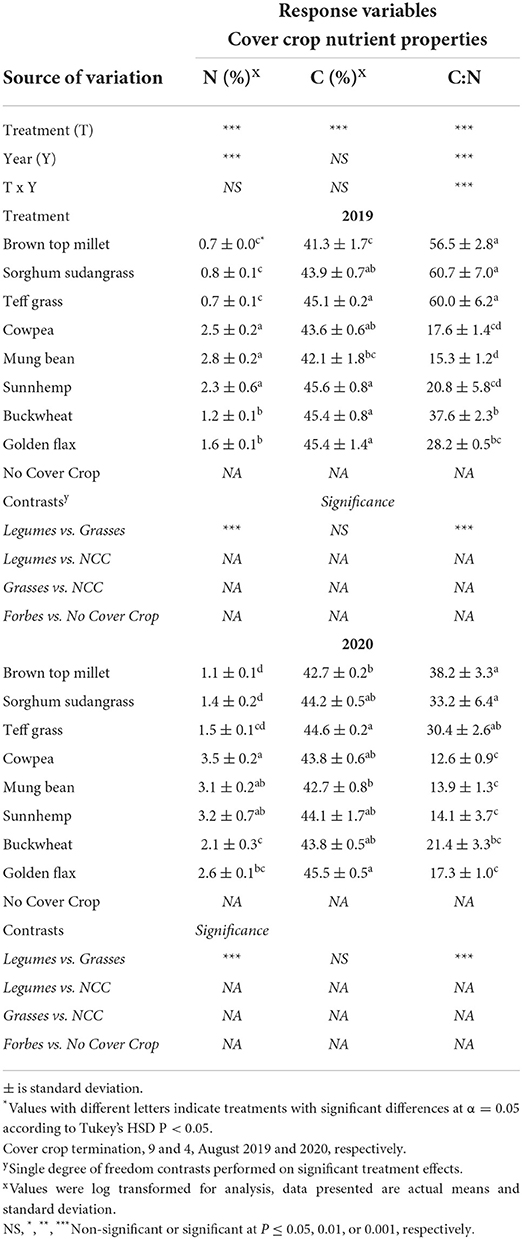
Table 5. Mean percent nitrogen (N) and carbon (C) and C:N ratio of dried cover crops collected following cover crop termination in Ames, IA.
Soil net N mineralization (via IEMs) and soil test results
Although cumulative net N mineralized was in general negatively related to C:N of the SCC residue C:N (Figure 2B), cumulative net N mineralization (NO3-N + NH4-N), measured via IEMs, varied among weeks of deployment and years (Ps < 0.0001; Supplementary Table S4) but not so much by SCCs (P = 0.95). All treatments showed increasing cumulative net N mineralization over the 6 weeks (Figures 3A,B), but some SCCs, like brown top millet and buckwheat showed little-to-no net N released during the first few weeks indicating temporary net N immobilization during this period (at least in 2019, Figure 3A). In 2019, in general, net N mineralization was greater for legume CCs in 2019 at all weeks except weeks 1 and 6 (Supplementary Table S3) although not significant. Across all CCs, weeks 3 through 6 showed greater net N mineralization than week 1 (P's = 0.02, 0.17, 0.04, 0.06). But at the end of the 6-week period net N mineralization converged and was not different among treatments (Supplementary Table S4; Table 6). Similarly, in 2020, week 4 showed the greatest N mineralized across all treatments (P < 0.001).
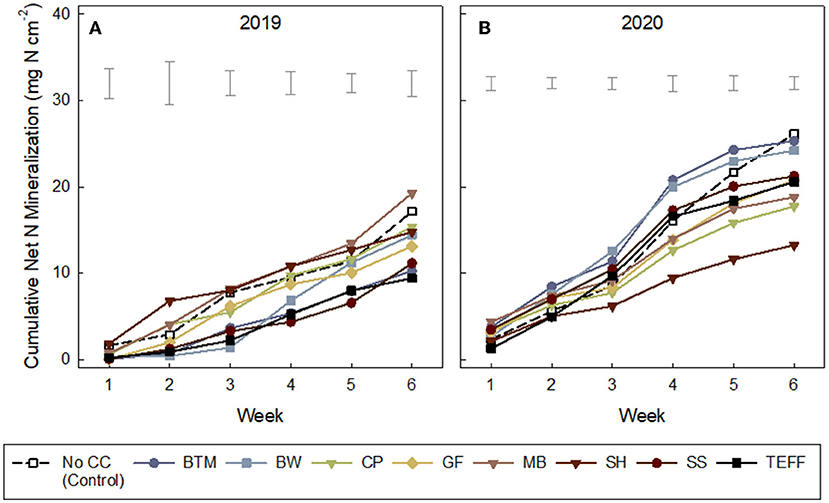
Figure 3. (A,B) Cumulative inorganic nitrogen (ammonium-N and nitrate-N) collected on ion exchange membranes (IEMs) over a 6-week period after cover crop termination in growing cabbage. Treatments: NCC, no cover crop (Control); BTM, brown top millet; BW, buckwheat; CP, cowpea; GF, golden flax; MB, mung bean; SH, sunnhemp; SS, sorghum sudangrass; TEF, teff. Leguminous cover crops are shown in downward triangle (∇). See Table 6 for standard deviations. for final cumulative net N mineralization at Week 6.
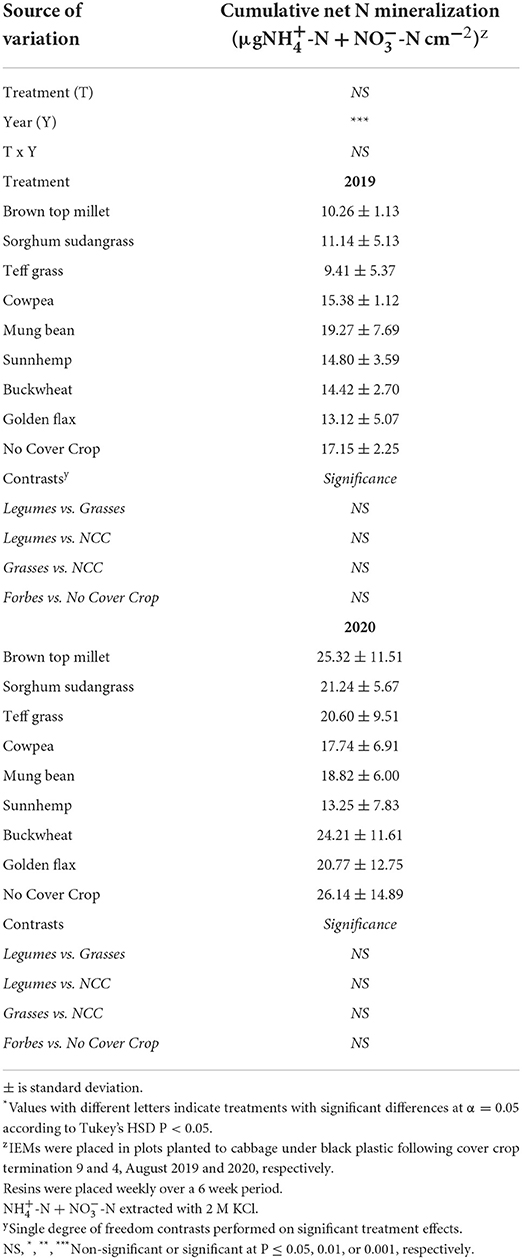
Table 6. Mean cumulative net N mineralization measure via inorganic N adsorbed to IEMs over a 6 week period following cover crop termination in cabbage plots.
Soil sampling occurred at two time points and an ANOVA is presented in Supplementary Table S5. There was a significant treatment, year, and sample interval (SI) effect as well as the interactions among fixed effects. Total salt-extractable inorganic N, ammonium-N plus nitrate-N ranged from ~3 to >30 mg N kg−1 in soil and was on average 61% greater in legumes than grass SCCs, particularly SH, in 2019 at SCC termination (Table 7). No other soil nutrients along with pH, CEC, and percent OM differed among treatments.
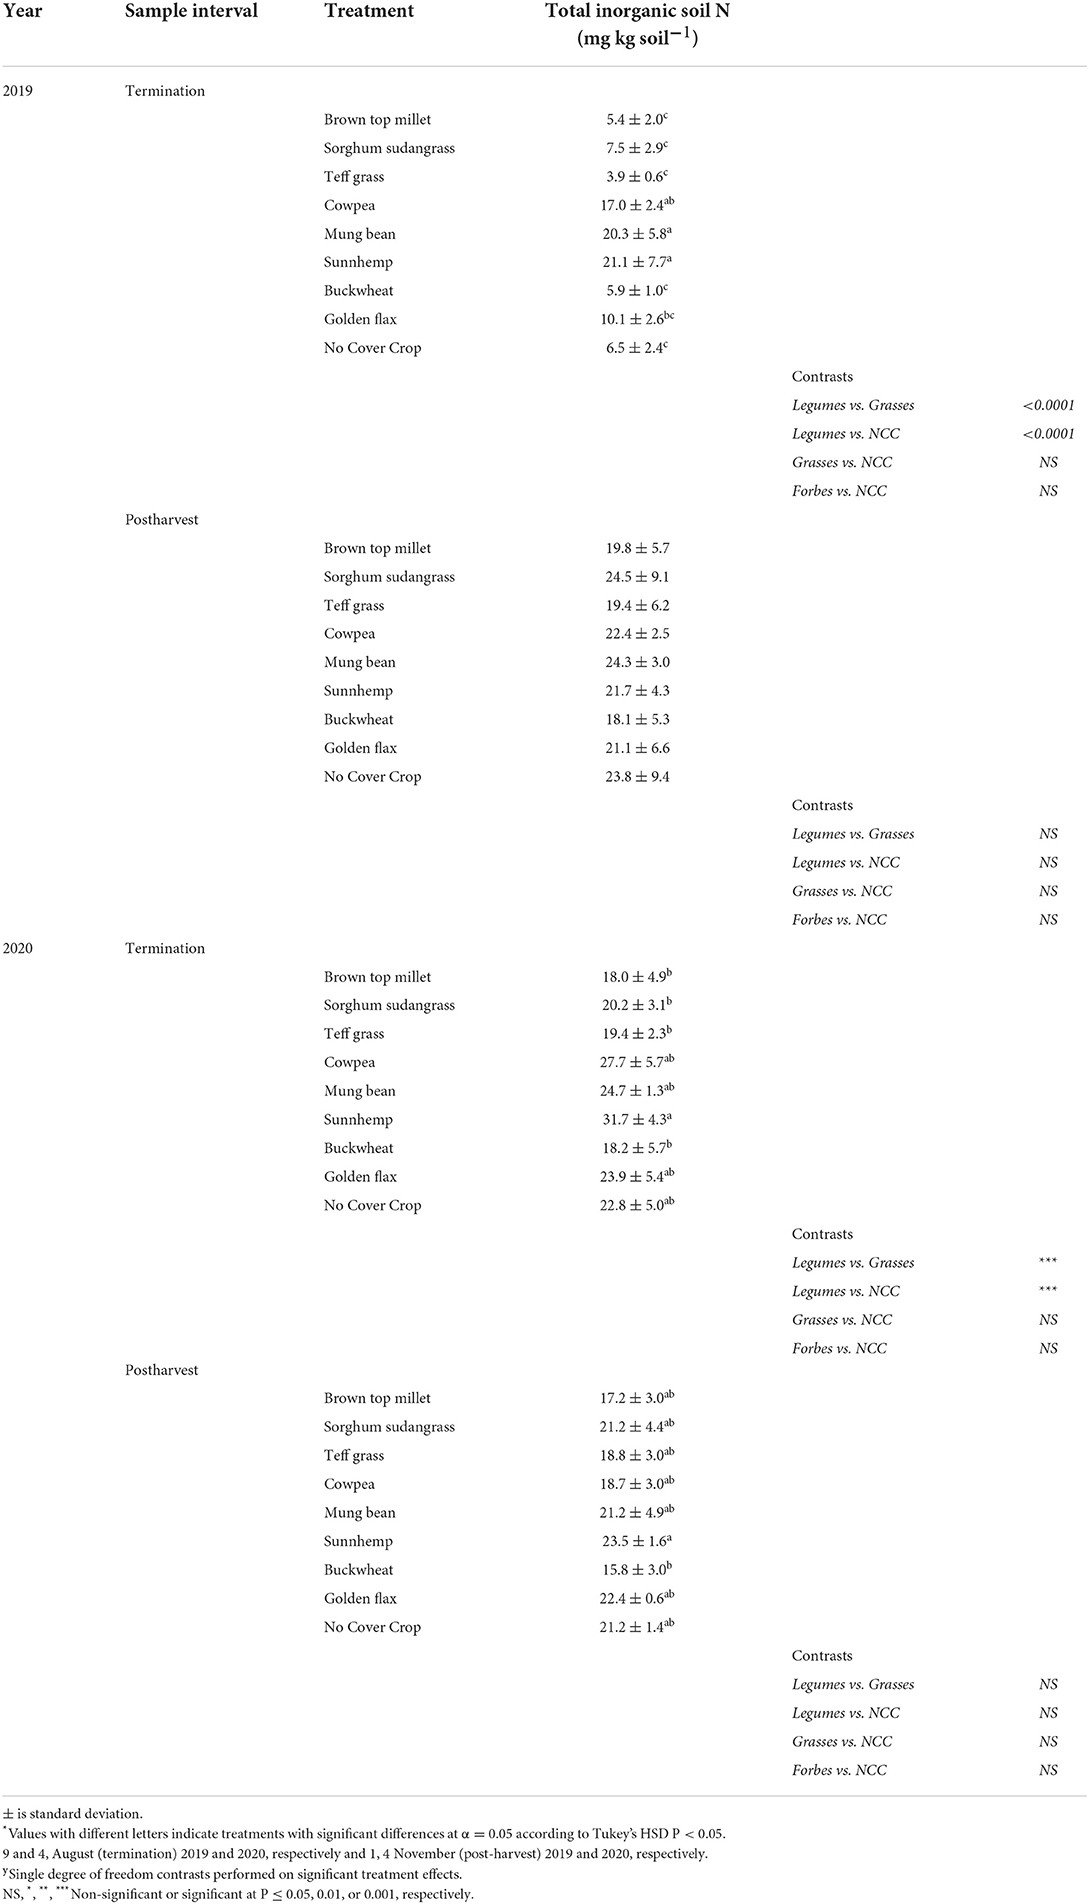
Table 7. Mean total inorganic soil N sampled at cover crop termination and post vegetable harvest in Ames, IA.
Mid-season measurements: Cabbage height, width, and weed biomass, and cabbage yield and quality
There were treatment differences in cabbage plant height (P < 0.0001) but only significant in 2019. Plants grown following sunnhemp were taller as compared to the NCC control and the SCC treatments brown top millet, buckwheat, sorghum sudangrass, and teff. There were no differences among treatments in cabbage plant width or mid-season weed biomass in either year. Mid-season weed biomass ranged from 0.01–1.7 Mg·ha−1 in 2019 to 0–5.5 Mg·ha−1 in 2020. Across all treatments, mid-season weeds were greater in 2020 as compared to 2019 (P = 0.00194). The bulk of the weeds sampled between rows was purslane (Portulaca oleracea L.), red root pigweed (Amaranthus retroflexus L.), and water hemp (Amaranthus tuberculatus (Moq.) J.D. Sauer). Across both years broadleaf weeds made up 70% of the weed biomass.
To understand how SCC treatment affected cabbage yield and quality, all 20 cabbage heads from each plot were weighed, sorted by bolted or loose or free from defects. Representative heads of good quality were measured for core length and head width. The expected yield per head for red express cabbage is 0.9–1.3kg per head according to the seed source. The mean weight per head of cabbage ranged from 0.1 to 0.4kg. Heads did not reach yield potential regardless of treatment. We relied on the compost as our main source of fertility which likely lead to insufficient N being released when needed.
Despite the low yields, leguminous SCCs increased total cabbage yield over the NCC control in 2019 by 45% (Figure 4). Leguminous SCCs (cowpea, mungbean, sunnhemp) yielded cabbage that was on average 71% greater as compared to grasses in 2019 (Figure 4). In 2020, no SCCs yielded greater over the control, however, sunnhemp had greater yields over Teff by 41%. The diameter of cabbage heads (Table 8) were larger in mungbean and sunnhemp treatments as compared to buckwheat and teff by 3.1 cm on average in 2019. In 2020, the head diameter of cabbage from sunnhemp was larger as compared to NCC.
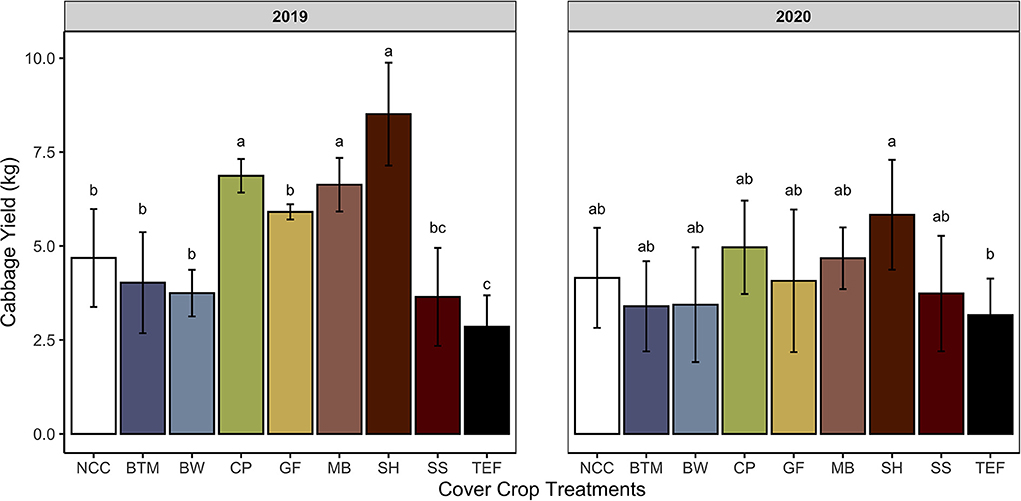
Figure 4. Total cabbage yields by summer cover crop. Means and standard deviations shown for treatments: NCC, no cover crop (Control); BTM, brown top millet; BW, buckwheat; CP, cowpea, GF, golden flax; MB, mung bean; SH, sunnhemp; SS, sorghum sudangrass; TEF, teff. Values with different letters indicate significant differences according to Tukey's HSD P < 0.05. Single degree of freedom contrasts performed: Legumes vs. grasses, Legumes vs. NCC, grasses vs. NCC, and forbes vs. NCC (2019 P-values < 0.0001, 0.0008, 0.3518, and 1.000. 2020 P-values 0.002, 0.4793, 0.7851, and 1.000, respectively).
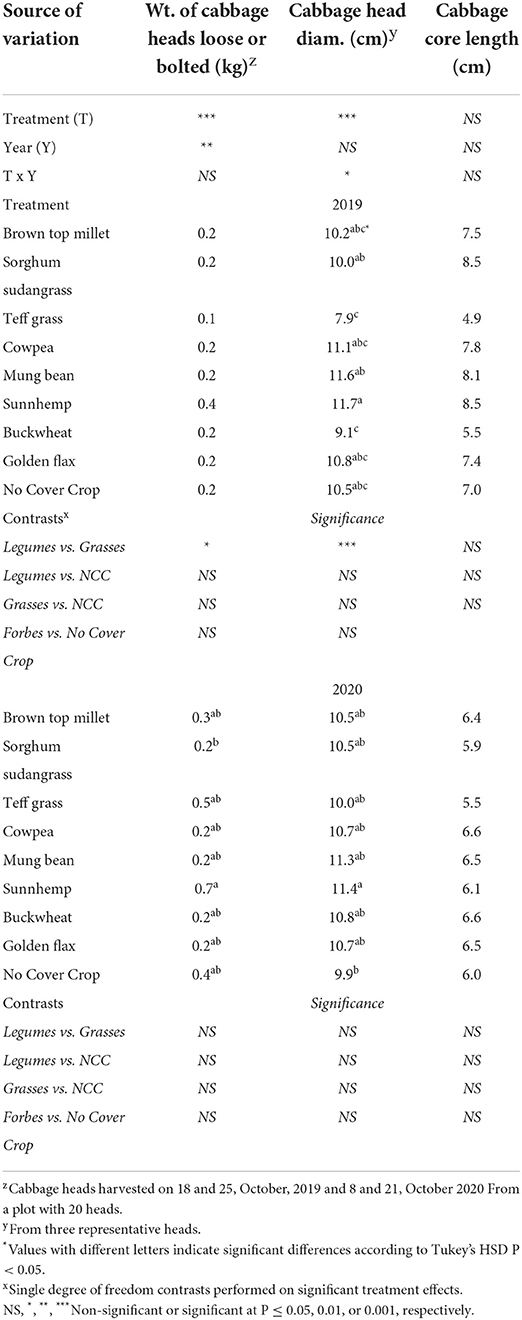
Table 8. Effect of cover crop treatment on loose and bolted cabbage heads (kg), mean head diameter (cm), and core length (cm).
Discussion
Cover crops are used extensively in organic vegetable production (Mennan et al., 2020), and finding ways to alter crop rotations to include CCs is of increased interest to farmers and policymakers (Kathage et al., 2022). Understanding CC species, their use in vegetable crop rotations, and the benefits and or tradeoffs they provide is essential to the adoption of their use and success in a cover cropping program (Baraibar et al., 2018; Romdhane et al., 2019). Therefore, our objectives were to evaluate the ability of eight SCCs (and one weedy control treatment) to suppress weeds, regulate plant-available N, and ultimately affect autumn cabbage yield and quality. We chose SCCs from a wide variety of growth habits, ability to fix N, and phenology (Table 2), which resulted in a wide range of biomass C:N ratios (Table 5). We hypothesized that there would be a strong C:N ratio gradient, with SCCs with greater biomass production providing excellent weed suppression but with the tradeoff that they would immobilize N due to wide C:N ratio while, leguminous SCCs would have an opposite effect. We did find there was a strong C:N gradient and in general the high biomass producing CCs did have a wider C:N ratio however, sunnhemp provided both high biomass production and a narrow C:N ratio. In addition biomass production, N mineralization, and yield were largely dependent on the year, possibly due to precipitation or soil moisture availability (Table 1). Here we discuss and synthesize the tradeoffs, mechanisms, and practical application of the results.
Did SCCs with greater biomass lower weed biomass?
Cover crops suppress weeds through direct competition for light and resources (Blanco-Canqui et al., 2015). Others have reported weed seed suppression through allelopathic effects by CCs such as sorghum sudangrass, sunnhemp, and buckwheat (Putnam et al., 1983; Finney et al., 2009; Summers et al., 2009; Skinner et al., 2012; Sturm et al., 2018). Suppression by allelopathy was not measured in this study. Our focus is on competition through biomass production as it was the main means for determining competition. Large quantities >8 Mg ha−1 of plant biomass accumulation have been reported for SCCs like sorghum sudangrass (Creamer and Baldwin, 2000; Kruse and Nair, 2016) and sunnhemp (Balkcom and Reeves, 2005; Cherr et al., 2006), although these results can vary based on length of cover crop growing time (Baraibar et al., 2018), environmental conditions and seeding rate (Brennan and Boyd, 2012).
We found that brown top millet, teff, and buckwheat CCs produced the most biomass and resulted in the greatest weed suppression across both years. Under the highest biomass-producing CCs, the percent weed cover was reduced by more than half compared to treatments with low biomass production (Table 4). Interestingly, buckwheat often had similar or greater weed suppressing capabilities as the grasses while golden flax biomass had a narrow C:N ratio and poor weed suppression (similar to legumes we used).
We found a direct relationship between cover crop biomass and weed biomass (Figure 2A; Table 4). This is in agreement with other studies of CCs. For example, Nigouajio and Mennan (2005) reported 1.72 Mg ha−1 of weed biomass when sorghum sudangrass biomass was 5.2 Mg ha−1 in contrast to 0.42 Mg ha−1 of weed biomass when sorghum sudangrass biomass was 7.7 Mg ha−1. The grass CCs (brown top millet, sorghum sudangrass, teff) and buckwheat, generated 80% more biomass on average than legume CCs (cowpea, mungbean, sunnhemp), resulting in fewer weeds during CC growth. Creamer and Baldwin (2000) also reported grass CCs, sorghum sudangrass, and pearl millet, had greater 76% and 51% more biomass than cowpea.
Biomass accumulation of the legume CCs and golden flax underperformed in 2020 based on potential biomass estimates for legumes. For example, 4–9.6 Mg ha−1 have been reported for cowpea CCs (Creamer and Baldwin, 2000; Hutchinson and McGiffen, 2000; Sustainable Agriculture Research and Education (SARE), 2012). Cover crop biomass of legumes in our study ranged from 2–6.5 Mg ha−1 in 2019 to 0.8–3.5 Mg ha−1 in 2020. Despite overall low biomass production by legume SCCs, sunnhemp rivaled the grasses with biomass generation of 6.5 ± 1.6 Mg ha−1 in 2019 and 3.5 ± 0.8 Mg ha−1 in 2020, which is in line with the 4.8–7.5 Mg ha−1 of biomass reported by Mansoer et al. (1997). Legume CCs produced more biomass in 2019 than in 2020 by 71% on average, and consequently weed biomass was greater in legume plots in 2020 as compared to 2019. Poor weed suppression by legumes may also be compounded by poor competitiveness from slow establishment rates of the legumes (Baraibar et al., 2018). Baraibar et al. (2018) found that weed suppression under legume CCs was low regardless of biomass, ranging from 0.6 to 3 Mg ha−1. Grass weeds made up a greater proportion of the weed biomass in all SCC treatments in 2019, while in 2020, all treatments but buckwheat and cowpea had greater broadleaf composition. Nigouajio and Mennan (2005) reported broadleaves making up the majority of weed biomass after a summer CC of sorghum sudangrass. In this study, the CC treatments were grown in the same location in both study years, which may have resulted in a CC legacy effect (Jernigan et al., 2017), e.g.; low CC biomass in legume plots in 2019 leading to an increase in the weed seed bank expressed as higher weed biomass in low CC biomass plots the following year.
Did SCCs with narrow carbon-to-nitrogen ratios increase plant-available N?
The answer to this question is complex and depended on the year (Table 5). However, overall we did find evidence that plant-available N was greater under legumes (Supplementary Table S5), and that C:N ratio of SCC residue was weakly negatively correlated with cumulative net N mineralization (Figure 2B). Our reports of C:N ratios match those of others reported. For example, Ranells and Wagger (1996) reported 40:1 for rye and 14:1 for crimson clover and hairy vetch, while we saw a range of 30:1–60:1 C:N for grasses and 12:1–20:1 C:N for legumes. A C:N of 20:1 or less is often discussed as essential for rapid decomposition and net N release (Bajgai et al., 2013; O'Connell et al., 2015). Ranells and Wagger (1996) determined that hairy vetch and crimson clover had higher rates of decomposition than rye. Across both years, brown top millet, sorghum sudangrass, teff, and buckwheat had C:N ratio above 20:1 which could have contributed to lower net N mineralization.
Although net N mineralized and adsorbed to IEMs was weakly negatively related to C:N of the SCC residue C:N (Figure 2B), this did not translate to significant differences in net N mineralization among treatments when measured via IEMs. However, soil N was greater following legume cover crop termination in 2019 (Table 7), but interestingly not in 2020. An N mineralization legacy effect from compost application may have also contributed. All plots had greater total soil N and net N mineralization in 2020 as compared to 2019. The study occurred in the same field in 2020 as in 2019 and nutrient release from compost applied in 2019 may have had sufficient time to mineralize and release some plant available N in 2020. Compost mineralization can be up to 34% of the total N in the first year and up to 8% in the years following (Amlinger et al., 2003).
Predicting net N mineralization from CC residues remains a perplexing issue for agronomists. Many factors like precipitation, soil texture, pH, and management practices (tillage and N fertilizer) can all strongly affect net N mineralization (Clivot et al., 2017; Yin et al., 2020). These multiple, interacting factors complicating net N mineralization are just under non-cover cropped conditions; predicting net N mineralization in cover cropped systems is likely even more complex.
Did legume or grass SCCs increase cabbage yield?
In our previous question, we asked if legume CCs with a narrow C:N ratio had greater net N mineralization rates than non-legume SCCs. The results of N adsorbed to IEMs and soil N provided conflicting results. We observed increasing N mineralization over the 6 week IEM deployment across all SCCs however, there were no differences among SCC treatments. Weak evidence showed that in 2019 mineralization of N from legume CC tissues was greater compared to non-legume CCs, but that total cumulative N mineralized from CC tissues was not different among CCs or the NCC control. Soil test N however, showed greater N following termination of leguminous SCCs as compared to non-legume SCCs and NCC in 2019 and in sunnhemp compared to grasses and buckwheat in 2020. These soil test N values more closely mimic our yield results. In 2019, leguminous SCCs improved yield over the control (Figure 4). Specifically, cowpea, mungbean, and sunnhemp all increased cabbage yield by 34 to 58 % on average compared to NCC (Figure 4). The greatest biomass producer however with a wide C:N ratio in 2019, teff, decreased cabbage yield by 51% compared to the control (Figure 4). In 2020, (Table 1), in line with our soil test results, there was no SCC that increased cabbage yield over NCC and only a significant difference among sunnhemp and teff (Figure 4). SCC biomass, C:N ratio, or both could have contributed to these yield gains and losses.
Observed yield differences in 2019 but not 2020 may be attributed to several factors. Including cover crop biomass, precipitation, Cover crop biomass was greater in 2019 as compared to 2020 across all CCs but especially among legumes. All SCCs were terminated ~5 days earlier in 2020 as compared to 2019 (Table 3). Which may have allowed for additional biomass accumulation in 2019. Creamer and Baldwin (2000) grew SCCs for 65–70 days before terminating resulting in cowpea biomass of ~4 Mg ha−1, while our SCCs were grown for ~50 days and only Sunnhemp reached greater than 4 Mg ha−1 of biomass in both years. Although biomass quantity may have contributed, O'Connell et al. (2015) found that quality over quantity of biomass was a greater predictor of N mineralization. Low precipitation in 2020 may have also played a role. Lower precipitation has a two-pronged effect –it lowers overall SCC biomass but also can slow the decomposition of residue and release of N (Zhou et al., 2018). Blazewicz-Wozniak and Wach (2012), for example, observed that biomass of common vetch (Vicia sativa L.) was reduced by ~60% during a dry year which translated to reduced nutrient accumulation. Hutchinson and McGiffen (2000) reported ~8–9 Mg ha−1of biomass when cowpea was grown for 57–65 days and drip irrigated. In our study, SCC biomass was lower across all treatments in 2020 compared to 2019, which may have been attributed to the lower precipitation. It is not unusual for agroecosystem services from CCs such as yield benefits to have varying results based on climate and soil type. Abdul-Baki et al. (1997) reported 29% greater broccoli yields under soybean and soybean mixture CCs as compared to those under a millet monoculture at one study site. Beck et al. (2016) found cowpea and cowpea mixtures increased strawberry yields by 26% compared to pearl millet monoculture, but just in one of two study years although Beck et al. (2016) suggested increased microbial activity from additions of compost may have improved yields in the second year. There is a considerable lack of data on how CCs perform under differing environmental conditions and future work should include monitoring and recording weather variables and their effects on CCs and ecosystem services. Finally, soil test N was higher in all plots at termination 2020 maybe owing to compost mineralization from compost applied the previous year.
We also did not find supporting evidence that cabbage yield directly, positively related to SCC biomass (perhaps via weed suppression, Figure 2B). The cabbage yield was much lower than its yield potential of 0.9–1.4 kg ha−1. Although some have reported potential allelopathic effects of CCs such as sorghum sudangrass, sunnhemp, and buckwheat (Putnam et al., 1983; Finney et al., 2009; Skinner et al., 2012; Sturm et al., 2018) and we did have a short 3 and 0-day window from cover crop termination to cabbage transplanting, but yields were low across treatments, even those not typically reported as having negative allelopathy to subsequent crops. Low yields were likely due to the N limiting environment and cabbages' high need for N (Abdul-Baki et al., 1997). In this study we estimated N provided by CCs based on N content of aboveground cover crop residues. We estimated that on average, across years, legume SCCs provided 80 kg·ha−1 of N and that N provided by the legume SCC sunnhemp was greatest among SCC treatments across both years (160 and 130 kg·ha−1 in 2019 and 2020, respectively). These estimates are in line with others reporting 69–120 kg·ha−1 of N in CC tissues (Mansoer et al., 1997; Creamer and Baldwin, 2000; O'Connell et al., 2015). Despite these estimates, yields were below the yield expectations of 0.9–1.4 kg ha−1, which may be the result of asynchronous N release with cabbage rapid growth which occurs exponentially starting in the first 2 weeks after transplant (Fink and Feller, 1998; Duarte et al., 2019). The first 2 weeks after cover crop termination resulted in N immobilization while 50% of sunnhemp cover crop N was released in the first 4 weeks (Mansoer et al., 1997). O'Connell et al. (2015) found that potential mineralizable N peaked 4–8 weeks after cowpea CC incorporation, which is similar to what we saw of N tracked with IEMs. Greater N immobilization in 2019 low N content producing CCs may have also contributed to low yields in comparison to the NCC control. Finney et al. (2009) found that cabbage yield was reduced following a high sorghum sudangrass CC compared to no CC.
Practical implications for growers selecting SCCs
Our study showed that using a SCC reduced weeds over a weedy fallow even when CCs had low biomass. Weedy fallow is not a typical practice for growers and future research should compare no cover crop treatments managed by tillage, mowing, or herbicide for more practical comparison. Summer cover cropping can be a challenge due to higher temperatures and reduced precipitation, but a poor CC stand could still be preferable to a weedy fallow based on our results. This has important implications when determining whether to terminate a poor stand vs. letting it stay. The choice of summer cover crop can greatly influence weed pressure and cash crop success. Our study did not follow our clear cut hypotheses (Figure 1). For example, in line with our hypotheses the legume SCCs mungbean and cowpea had low biomass production and poor weed suppression however, sunnhemp also a legume was excellent at suppressing weeds and also improved yield. The forb golden flax was a poor weed suppressor while buckwheat suppressed weeds as grasses and sunnhemp. Our study also showed that SCC performance is likely affected by precipitation. Additionally, although not measured in our study we observed a low biomass producing SCC with no other weed management seemed to increase the weed pressure the following season. This potential for high weed pressure following a poor SCC stand should be taken into account when planning for the cash crop to follow, as the success of the crop could be greatly influenced. For instance, a poorly competitive cash crop grown following a low biomass producing SCC could translate to increased competition from weeds in the cash crop (Madden et al., 2021).
A combination of compost, CCs, and commercial organic fertilizers is a common practice for fertility management in organic vegetable production (Badgley et al., 2007). Commercial organic fertilizers take fossils fuels to make and distribute them. The use of leguminous SCCs could help growers reduce N fertilizer inputs (Büchi et al., 2015). Although, in our low input system, cabbage did not reach expected yield for the variety, possibly due to asynchronous N release/uptake from CCs and compost and minimal commercial fertilizer additions. To be successful, N mineralization from CCs and compost must coincide during times of rapid crop growth (Masunga et al., 2016). From our study, we saw net N mineralization peak around weeks 4–5. Farmers should manage their crop rotations with these estimates in mind in addition to understanding N uptake curves of different cash crops produced. Additionally, we saw the potential for net N immobilization following SCCs with wide C:N ratios. Cash crop production following SCCs with high net N immobilization potential may require additional N fertilizer to compensate for this.
Conclusions
This study demonstrates that SCCs grown in Iowa prior to fall vegetable production can accumulate enough biomass to suppress weeds during CC growth. However, cabbage did not reach maximum yield potential during the 12-week growing period. Much of this was likely attributable to the low input system, but more research is needed to examine the timing of SCC seeding and autumn vegetable planting to determine optimal planting windows for SCCs and autumn vegetables following. We were able to test eight SCC species' effectiveness in producing biomass, releasing plant-available nitrogen to the autumn cabbage, and ultimately impacting cabbage yield. Greater biomass-producing SCCs suppressed weeds but decreased yields in some cases. The lesser biomass-producing SCCs, typically legumes, presumably provisioned N to the autumn cabbage, however this was not confirmed with IEMs. SCCs increased cabbage yields but only during the wetter of 2 years. Thus, the SCC chosen for the tight window of summer growth is critical to the success of the system as some benefits and tradeoffs depend on the year. Sunnhemp, a leguminous SCC, increased yields the most (by 38–80%) compared to NCC, presumably not making N limiting, while also having weed suppression comparable to the grasses. However, the effectiveness of these SCCs to provide these agroecosystem services is highly dependent on year-to-year precipitation and SCC biomass accumulation.
Although CCs have been examined as a tool for sustainable vegetable production for several decades, there are still many avenues of research left to explore. With increased droughts and severity of weather events, future CC research should address how the interaction among SCCs, organic amendments, and climatic factors such as rain and temperature affect vegetable crop growth and yield.
Data availability statement
The raw data supporting the conclusions of this article will be made available by the authors, without undue reservation.
Author contributions
Conceptualization: MB and AN. Methodology, writing—review and editing, resources, and supervision: MB, AN, and MM. Formal analysis, investigation, and writing—original draft preparation: MB. Funding acquisition: AN. All authors contributed to the article and approved the submitted version.
Funding
This work is supported by USDA NCSARE ENC19-180 and Iowa Hatch IOW03901.
Acknowledgments
I would like to thank Nick Howell, Brandon Carpenter, Jeff Breland, and Chad Arnold at the Iowa Horticulture Research Station for their help in setting up this field project without their tireless efforts on the farm would not have been possible. I would also like to thank Jenna Eartthum and Henric Kraus, I would have been lost without your help. Thank you to Alex Lindsay for assistance with methods and materials related to IEMs.
Conflict of interest
The authors declare that the research was conducted in the absence of any commercial or financial relationships that could be construed as a potential conflict of interest.
Publisher's note
All claims expressed in this article are solely those of the authors and do not necessarily represent those of their affiliated organizations, or those of the publisher, the editors and the reviewers. Any product that may be evaluated in this article, or claim that may be made by its manufacturer, is not guaranteed or endorsed by the publisher.
Supplementary material
The Supplementary Material for this article can be found online at: https://www.frontiersin.org/articles/10.3389/fsufs.2022.1021639/full#supplementary-material
References
Abdul-Baki, A. A., Morse, R. D., Devine, T. E., and Teasdale, J. R. (1997). Broccoli production in forage soybean and foxtail millet cover crop mulches. HortScience 32, 836–839. doi: 10.21273/HORTSCI.32.5.836
Amlinger, F., Götz, B., Dreher, P., Geszti, J., and Weissteiner, C. (2003). Nitrogen in biowaste and yard waste compost: dynamics of mobilisation and availability—a review. Eur. J. Soil Biol. 39, 107–116. doi: 10.1016/S1164-5563(03)00026-8
Badgley, C., Moghtader, J., Quintero, E., Zakem, E., Jahi Chappell, M., Avilés-Vázquez, K., et al. (2007). Organic agriculture and the global food supply. Renew. Agric. Food Syst. 22, 86–108. doi: 10.1017/S1742170507001640
Bajgai, Y., Kristiansen, P., Hulugalle, N., and McHenry, M. (2013). Comparison of organic and conventional managements on yields, nutrients, and weeds in a corn-cabbage rotation. Renew. Agric. Food Syst. 30, 132–142. doi: 10.1017/S1742170513000264
Balkcom, K. S., and Reeves, D.W. (2005). Sunn-hemp utilized as a legume cover crop for corn production. Agron. J., 97, 26–31. doi: 10.2134/agronj2005.0026
Baraibar, B., Hunter, M. C., Schipanski, M. E., Hamilton, A., and Mortensen, D. A. (2018). Weed suppression in cover crop monocultures and mixtures. Weed Sci. 66, 121–133. doi: 10.1017/wsc.2017.59
Bates, D., Mächler, M., Bolker, B., and Walker, S. (2015). Fitting linear mixed-effects models using lme4. J. Stat. Softw. 67, 1–48. doi: 10.18637/jss.v067.i01
Beck, J. E., Schroeder-Moreno, M. S., Fernandez, G. E., Grossman, J. M., and Creamer, N. G. (2016). Effects of cover crops, compost, and vermicompost on strawberry yields and nitrogen availability in North Carolina. J. Amer. HortTech. 26, 604–613. doi: 10.21273/HORTTECH03447-16
Bjokman, T., and Shail, J. W. Jr. (2013). Using a buckwheat cover crop for maximum weed suppression after early vegetables. HortTech. 23, 575–580. doi: 10.21273/HORTTECH.23.5.575
Blanco-Canqui, H., Shaver, T. M., Lindquist, J. L., Shapiro, C. A., Elmore, R. W., Francis, C. A., et al. (2015). Cover crops and ecosystem services: Insights from studies in temperate soils. Agron. J. 107, 2449–2474. doi: 10.2134/agronj15.0086
Blazewicz-Wozniak, M., and Wach, D. (2012). The fertilizer value of summer catch crops preceding vegetables and its variation in the changing weather conditions. Acta Sci. Pol. Hortorum Cultus 11, 101–116.
Blesh, J. (2018). Functional traits in cover crop mixtures: biological nitrogen fixation and multifunctionality. J. Appl. Ecol. 55, 38–48. doi: 10.1111/1365-2664.13011
Brainard, D. C., Bellinder, R. R., and Kumar, V. (2011). Grass-legume mixtures and soil fertility affect cover crop performance and weed seed production. Weed Technol. 25, 473–479. doi: 10.1614/WT-D-10-00134.1
Brennan, E. B., and Boyd, N. S. (2012). Winter cover crop seeding rate and variety affects during eight years of organic vegetables: I. cover crop biomass production. Agron. J. 104, 684–698. doi: 10.2134/agronj2011.0330
Büchi, L., Gebhard, C.-A., Liebisch, F., Sinaj, S., Ramseier, H., Charles, R., et al. (2015). Accumulation of biologically fixed nitrogen by legumes cultivated as cover crops in Switzerland. Plant and Soil 393, 163–175. doi: 10.1007/s11104-015-2476-7
Byrnes, J. E. K., Gamfeldt, L., Isbell, F., Lefcheck, J. S., Griffin, J. N., Hector, A., et al. (2014). Investigating the relationship between biodiversity and ecosystem multifunctionality: challenges and solutions. Methods in Ecol. and Evol. 5, 111–124. doi: 10.1111/2041-210X.12143
Campiglia, E., Mancinelli, R., Radicetti, E., and Marinari, S. (2011). Legume cover crops and mulches: effects on nitrate leaching and nitrogen input in a pepper crop (Capsicum annuum L.). Nutr. Cycl. Agroecosys. 89, 399–412. doi: 10.1007/s10705-010-9404-2
Cherr, C. M., Scholberg, J. M. S., and McSorley, R. (2006). Green manure as nitrogen source for sweet corn in a warm–temperate environment. Agron. J. 98, 1173–1180. doi: 10.2134/agronj2005.0036
Clivot, H., Mary, B., Valé, M., Cohan, J.-P., Champolivier, L., Piraux, F., et al. (2017). Quantifying in situ and modeling net nitrogen mineralization from soil organic matter in arable cropping systems. Soil Biol. and Biochem. 111, 44–59. doi: 10.1016/j.soilbio.2017.03.010
Creamer, N. G., and Baldwin, K. R. (2000). An evaluation of summer cover crops for use in vegetable production systems in North Carolina. Hortscience 35, 600–603. doi: 10.21273/HORTSCI.35.4.600
Doane, T. A., and Horwáth, W. R. (2003). Spectrophotometric determination of nitrate with a single reagent. Anal. Lett. 36, 2713–2722. doi: 10.1081/AL-120024647
Doran, J. W., and Smith, M. S. (1991). “Role of cover crops in nitrogen cycling,” in Cover Crops for Clean Water. Proc. Int. Conf., Jackson, TN. 9–11 Apr. 1991, ed W.L. Hargrove (Ankeny, IA: Soil and Water Conserv. Soc.), 85–90.
Duarte, L. O., Clemente, J., Caixeta, I. A. B., Senoski, M. D. P., and Aquino, L. A. D. (2019). Dry matter and nutrient accumulation in cabbage crop. Revista Caatinga 32, 679–689. doi: 10.1590/1983-21252019v32n312rc
Fink, M., and Feller, C. (1998). An empirical model for describing growth and nitrogen uptake of white cabbage (Brassica oleracea var. capitata). Sci. Hortic. 73, 75–88. doi: 10.1016/S0304-4238(97)00154-4
Finney, D. M., Creamer, N. G., Schultheis, J. R., Wagger, M. G., and Brownie, C. (2009). Sorghum sudangrass as a summer cover and hay crop for organic autumn cabbage production. Renew. Agric. Food Syst. 24, 225–233. doi: 10.1017/S174217050999007X
Haas, G., Brand, H., and Puente de la Vega, M. (2007). Nitrogen from hairy vetch (vicia villosa roth) as winter green manure for white cabbage in organic horticulture. Biol. Agric. Hortic. 25, 37–53. doi: 10.1080/01448765.2007.10823207
Hansen, V., Eriksen, J., Jensen, L. S., Thorup-Kristensen, K., and Magid, J. (2021). Towards integrated cover crop management: N, P and S release from aboveground and belowground residues. Agric. Ecosyst. Environ. 313, 107392. doi: 10.1016/j.agee.2021.107392
Hartz, T. K., Mitchell, J. P., and Giannini, C. (2000). Nitrogen and carbon mineralization dynamics of manures and composts. HortScience 35, 209–212. doi: 10.21273/HORTSCI.35.2.209
Hunter, M. C., Schipanski, M. E., Burgess, M. H. J. C., LaChance, B. A., Bradley, M. E., Barbercheck, J. P., et al. (2019). Cover crop mixture effects on maize, soybean, and wheat yield in rotation. Agric. Environ. Lett. 4, 180051–180051. doi: 10.2134/ael2018.10.0051
Hutchinson, C. M., and McGiffen, M. E. (2000). Cowpea cover crop mulch for weed control in desert pepper production. HortScience 35, 196–198. doi: 10.21273/HORTSCI.35.2.196
Jensen, L. S., Salo, T., Palmason, F., Breland, T. A., Henriksen, T. M., Stenberg, B., et al. (2005). Influence of biochemical quality on C and N mineralisation from a broad variety of plant materials in soil. Plant Soil. 273, 307–326. doi: 10.1007/s11104-004-8128-y
Jernigan, A. B., Caldwell, B. A., Cordeau, S., DiTommaso, A., Drinkwater, L. E., Mohler, L. E. C. L., et al. (2017). Weed abundance and community composition following a long-term organic vegetable cropping systems experiment. Weed Sci. 65, 639–649. doi: 10.1017/wsc.2017.33
Kaspar, T. C., and Singer, J.W. (2011). The Use of Cover Crops to Manage Soil. Publications from USDA- ARS / UNL Faculty. 1382. Available online at: https://digitalcommons.unl.edu/usdaarsfacpub/1382 (accessed September 28, 2022).
Kathage, J., Smit, B., Janssens, B., Haagsma, W., and Adrados, J. L. (2022). How much is policy driving the adoption of cover crops? Evidence from four EU regions. Land Use Policy 116, 106016. doi: 10.1016/j.landusepol.2022.106016
Kruse, R., and Nair, A. (2016). Summer cover crops and lettuce planting time influence weed population, soil nitrogen concentration, and lettuce yields. Horttech 26, 409–416. doi: 10.21273/HORTTECH.26.4.409
Madden, M. K., Widick, I. V., and Blubaugh, C. K. (2021). Weeds impose unique outcomes for pests, natural enemies, and yield in two vegetable crops. Environ. Entomol. 50, 330–336. doi: 10.1093/ee/nvaa168
Mansoer, Z., Reeves, D. W., and Wood, C. W. (1997). Suitability of sunn hemp as an alternative late-summer legume cover crop. Soil Sci. Soc. Am. J. 61, 246–253. doi: 10.2136/sssaj1997.03615995006100010034x
Masunga, R. H., Uzokwe, V. N., Mlay, P. D., Odeh, I., Singh, A., Buchan, D., et al. (2016). Nitrogen mineralization dynamics of different valuable organic amendments commonly used in agriculture, Appl. Soil Ecol. 101, 185–193. doi: 10.1016/j.apsoil.2016.01.006
McDaniel, M. D., Kaye, J. P., and Kaye, M. W. (2014). Do “hot moments” become hotter under climate change? Soil nitrogen dynamics from a climate manipulation experiment in a post-harvest forest. Biogeochemistry 121, 339–354. doi: 10.1007/s10533-014-0001-3
Mennan, H., Jabran, K., Zandstra, B. H., and Pala, F. (2020). Non-chemical weed management in vegetables by using cover crops: a review. Agronomy 10, 257. doi: 10.3390/agronomy10020257
Morris, R. A., Furoc, R. E., and Dizon, M. A. (1986). Rice responses to a short-duration green manure. I. Grain Yield Agron. J. 78, 409–412.
Nigouajio, M., and Mennan, H. (2005). Weed populations and pickling cucumber (Cucumis sativus) yield under summer and winter cover crop systems. Crop Prot. 24, 521–526. doi: 10.1016/j.cropro.2004.10.004
O'Connell, S., Shi, W., Grossman, J. M., Hoyt, G. D., Fager, K. L., Creamer, N. G., et al. (2015). Short-term nitrogen mineralization from warm-season cover crops in organic farming systems. Plant Soil. 396, 353–367. doi: 10.1007/s11104-015-2594-2
Osipitan, O. A., Dille, J. A., Assefa, Y., Radicetti, E., Ayeni, A., Knezevic, S. Z., et al. (2019). Impact of cover crop management on level of weed suppression: a meta-analysis. Crop Sci. 59, 833–842. doi: 10.2135/cropsci2018.09.0589
Pissinati, A., Moreira, A., and Santoro, P. H. (2018). Yield components and nutrients content in summer cover plants used in crop rotation in no-tillage system, Commun. Soil Sci. Plant Anal. 49, 1604–1616. doi: 10.1080/00103624.2018.1474899
Putnam, A. R., Defrank, J., and Barnes, J. P. (1983). Exploitation of allelopathy for weed control in annual and perennial cropping systems. J. Chem. Ecol. 9, 1001–1010. doi: 10.1007/BF00982207
Qian, P., and Schoenau, J. J. (1995). Assessing nitrogen mineralization from soil organic matter using anion exchange membranes. Fertil. Res. 40, 143–148. doi: 10.1007/BF00750099
Qian, P., and Schoenau, J. J. (2005). Use of ion-exchange membrane to assess nitrogen-supply power of soils. J. Plant Nutr. 28, 2193–2200. doi: 10.1080/01904160500324717
Qian, P., and Schoenau, J. J. (2011). Practical applications of ion exchange resins in agricultural and environmental soil research. Can. J. Soil Sci. 82, 9–21. doi,: 10.4141/S00-091
Ranells, N. N., and Wagger, M. G. (1996). Nitrogen release from grass and legume cover crop monocultures and bicultures. Agron. J. 88, 777–782. doi: 10.2134/agronj1996.00021962008800050015x
R-Core-Team (2020). R Foundation for Statistical Computing. Vienna, Austria. Available online at: https://www.R-project.org/ (accessed September 2, 2022).
Romdhane, S., Spor, A., Busset, H., Falchetto, L., Martin, J., Bizouard, F., et al. (2019). Cover crop management practices rather than composition of cover crop mixtures affect bacterial communities in no-till agroecosystems. Front. Microbiol. 10, 1618. doi: 10.3389/fmicb.2019.01618
Schellenberg, D. L., Morse, R. D., and Welbaum, G. E. (2009). Organic broccoli production on transition soils: comparing cover crops, tillage and sidedress N. Renew. Agric. Food Syst. 24, 85–91. doi: 10.1017/S1742170508002470
Sinsabaugh, R. L., Reynolds, H., and Long, T. M. (2000). Rapid assay for amidohydrolase (urease) activity in environmental samples. Soil Biol. Biochem. 32, 2095–2097. doi: 10.1016/S0038-0717(00)00102-4
Skinner, E. M., Díaz-Pérez, J. C., Phatak, S. C., Schomberg, H. H., and Vencill, W. (2012). Allelopathic effects of sunnhemp (Crotalaria juncea L.) on germination of vegetables and weeds. HortScience 47, 138–142. doi: 10.21273/HORTSCI.47.1.138
Sturm, D. J., Peteinatos, G., and Gerhards, R. (2018). Contribution of allelopathic effects to the overall weed suppression by different cover crops. Weed Res. 58, 331–337. doi: 10.1111/wre.12316
Subler, S., Blair, J. M., and Edwards, C. A. (1995). Using anion-exchange membranes to measure soil nitrate availability and net nitrification. Soil Biol. Biochem. 27, 911–917. doi: 10.1016/0038-0717(95)00008-3
Summers, C. G., Mitchell, J. P., Prather, T. S., and Stapleton, J. J. (2009). Sudex cover crops can kill and stunt subsequent tomato, lettuce and broccoli transplants through allelopathy. California Agric. 63, 35–40. doi: 10.3733/ca.v063n01p35
Sustainable Agriculture Research and Education (SARE) (2012). Managing Cover Crops Profitably, 3rd Edn. SARE Outreach 1122 Patapsco Building University of Maryland College Park, MD 20742-6715
Trinsoutrot, I., Recous, S., Bentz, B., Linères, M., Chèneby, D., Nicolardot, B., et al. (2000). Biochemical quality of crop residues and carbon and nitrogen mineralization kinetics under nonlimiting nitrogen conditions. Soil Sci. Soc. Am. J. 64, 918–926. doi: 10.2136/sssaj2000.643918x
United States Department of Agricultural Marketing Service (USDA AMS) (2000). National Organic Program. 7 CFR part 205, 203. United States Department of Agriculture, Washington, DC.
Vigil, M. F., and Kissel, D. E. (1991). Equations for estimating the amount of nitrogen mineralized from crop residues. Soil Sci. Soc. Am. J. 55, 757–761. doi: 10.2136/sssaj1991.03615995005500030020x
White, C. M., DuPont, S. T., Hautau, M., Hartman, D., Finney, D. M., Bradley, B., et al. (2017). Managing the trade off between nitrogen supply and retention with cover crop mixtures. Agric. Ecosyst. Environ. 237, 121–133. doi: 10.1016/j.agee.2016.12.016
Yin, X., Beaudoin, N., Ferchaud, F., Mary, B., Strullu, L., Chlébowski, F., et al. (2020). Long-term modelling of soil N mineralization and N fate using STICS in a 34-year crop rotation experiment. Geoderma 357, 113956. doi: 10.1016/j.geoderma.2019.113956
Keywords: agriculture, ion exchange membranes, green manure, multi-functionality, nutrient-supplying power, organic, Brassica oleracea var. Capitata, vegetable
Citation: Bilenky MT, Nair A and McDaniel MD (2022) Effect of summer cover crops on cabbage yield, weed suppression, and N mineralization in a low input cropping system. Front. Sustain. Food Syst. 6:1021639. doi: 10.3389/fsufs.2022.1021639
Received: 17 August 2022; Accepted: 21 September 2022;
Published: 17 October 2022.
Edited by:
Johann G. Zaller, University of Natural Resources and Life Sciences, Vienna, AustriaReviewed by:
Vimlendu Bhushan Sinha, Sharda University, IndiaVivian M. Wauters, University of California, Davis, United States
Copyright © 2022 Bilenky, Nair and McDaniel. This is an open-access article distributed under the terms of the Creative Commons Attribution License (CC BY). The use, distribution or reproduction in other forums is permitted, provided the original author(s) and the copyright owner(s) are credited and that the original publication in this journal is cited, in accordance with accepted academic practice. No use, distribution or reproduction is permitted which does not comply with these terms.
*Correspondence: Moriah T. Bilenky, bXRiNTU4OUBwc3UuZWR1; Ajay Nair, bmFpcmFqYXlAaWFzdGF0ZS5lZHU=
†Present address: Moriah T. Bilenky, Weed Science Laboratory, Department of Plant Science, The Pennsylvania State University, University Park, PA, United States
 Moriah T. Bilenky
 Ajay Nair
 Marshall D. McDaniel