
95% of researchers rate our articles as excellent or good
Learn more about the work of our research integrity team to safeguard the quality of each article we publish.
Find out more
ORIGINAL RESEARCH article
Front. Sustain. Food Syst. , 06 December 2022
Sec. Waste Management in Agroecosystems
Volume 6 - 2022 | https://doi.org/10.3389/fsufs.2022.1005740
This article is part of the Research Topic Circular Economy and Sustainability in the Agro-Food System View all 12 articles
 Asteria Aili Ndiipohamba Katakula1,2Werner Gawanab3Bethold Handura1Fisseha Itanna4,5
 Hupenyu Allan Mupambwa1*
Vermicomposts are organic fertilizer sources that are being promoted; however, their concentrations of macronutrients such as NPK are very low. This study, therefore, evaluated the effects of amending goat manure–food waste mixture with biochar prepared from seaweed (Gracilariopsis funicularis) at 0% (control), 2, 4, 6, and 8% on vermicompost degradation and macronutrient release. After 10 weeks of vermicomposting, the highest pH of 9.06 was observed within the control, whilst the lowest was 8.7 in the 8% treatment. The electrical conductivity showed a positive relationship with the level of biochar incorporation with the highest of 16.5 mS/cm from the 8% treatment, whilst the lowest was within the control with 6 mS/cm. There were no significant differences between treatments on humification parameters; however, there were significant differences in the changes in a C/N ratio with the final C/N ratio of 14.4, 14.9, 16.7, 15.1, and 14.4 for the control, 2, 4, 6, and 8% treatments, respectively. A higher incorporation rate resulted in the higher concentration of potassium with a value of 32.3 g/kg at week 8. The final percentage change in Olsen P was 19, 14.2, 7.3, 4.1, and 3.0% for the 8%, 6%, control, 4%, and 2% treatments, respectively. An optimized level of 6% to 8% biochar incorporation ratio can be recommended. However, the incorporation of G. funicularis biochar does not seem to influence changes in the vermidegradation efficiency, though it can significantly improve the macronutrients such as P, K, and Mg concentrations as well as the macroelement concentrations.
The advent of the green revolution saw the introduction of huge industrialization and intensification of agricultural activities, which has generated huge quantities of waste materials (Chen et al., 2020). Furthermore, the application of inorganic fertilizers to increase yields of crops has resulted in increased crop yield though this has also contributed to soil degradation as these fertilizers only feed the crop, not the soil, which is a living ecosystem. Traditionally, composts have been used as organic sources of nutrients, with their limitations being the slow release of nutrients into the soil coupled with low nutrient levels and the probability of introducing potentially toxic pathogens and heavy metals into the environment (Chen et al., 2020). Recently, research has focused on improved organic fertilizers in sustainable agriculture such as vermicomposts which involve the use of solid organic materials such as food waste, animal waste, and sewage sludge processed using earthworms such as Eisenia fetida and other species (Mupambwa et al., 2022).
Though both composts and vermicomposts are being promoted as nutrient sources, they are still inferior in nutrition when compared with inorganic fertilizers; hence, farmers always prefer to use inorganic fertilizers regardless of their limited soil health benefits. For example, urea has 46% nitrogen, compound fertilizer like 3:2:3 (35%) has 42.8% phosphorus and 28% potassium, whilst homemade compost was reported to have as low as 0.5% nitrogen, 0.27% phosphorus, and 0.81% potassium. This has led researchers to use various materials for amendment such as fly ash, rock phosphate, and biochar as well as other methods such as phosphorus-solubilizing bacteria to increase nutrient content. A study by Zheng et al. (2020) reported that the total and extractable phosphorus fractions increased, whilst loss of N was reduced during composting of sewage sludge mixed with bulking agents such as spent mushroom substrate. According to Lukashe et al. (2019), the inoculation of fly ash–cow dung-based vermicompost with phosphate-solubilizing microbes accelerated the biodegradation resulting in improved vermicompost with low C/N ratio and high Olsen phosphorus. A study that used modified fly ash as an amendment to remediate heavy metal contamination from the soil reported that the mixture of fly ash and chicken manure reduced the concentrations of cadmium, copper, and lead by 49.0, 53.5, and 67.8%, respectively. They also observed an increase in organic matter and available NPK (Hu et al., 2021).
In another study, the incorporation of biochar made from corn cobs and wood enhanced the quality of soil as it supplied a more stable carbon source as well as essential plant nutrients during the production of maize (Kizito et al., 2019). Biochar as an amendment is quite interesting as it is rich in recalcitrant forms of carbon and contains elevated nutrient concentrations (Katakula et al., 2020). The use of biochar as an amendment of composting materials has the potential to increase organic matter content and reduce the bioavailability of heavy metals, whilst enhancing humification parameters and nutrient retention during vermicomposting (Were et al., 2019). Furthermore, the amendment with biochar enhances bioavailable nutrients in the soil and increases microbial action that drives soil biochemical processes which are critical in improving soil physical properties responsible for nutrient and water retention (Wang et al., 2020).
Research has shown that the amendment of 10% (w/w) plant biochar into kitchen waste–sewage sludge vermicompost increased the growth and multiplication of earthworms by up to 53.9% (Khan et al., 2019). In this same study, biochar amendments enhanced the bioavailability of nitrogen by up to 31%, phosphorus by 10%, and potassium by 17%. Similarly, Makini et al. (2020) reported that amending soils with vermicompost prepared from goat manure at a rate of 30t ha−1 resulted in higher soil pH, total N, and extractable P and K.
Much of the research that has used biochar as an amendment has mainly used a material of terrestrial origin with no research having used marine biomass. Recently, Katakula et al. (2020) identified that biochar derived from seaweed species such as Laminaria pallida and Gracilariopsis funicularis pyrolysed at a temperature of 400°C can generate nutrient-rich and carbon-rich biochar. Marine biomass derived-biochar can be an important source of amendment for organic fertilizers in hyper-arid countries such as Namibia. However, there is limited research that looked at marine biomass and converted them into biochar to be used as an amendment into vermicompost. Research that focuses on the use of waste materials such as animal manures, food waste, and seaweeds can be critical in circular economies as they are critical in waste beneficiation. Furthermore, unlike in uncontrolled decomposition of these wastes where the decomposition results in the loss of C, processes such as vermicomposting are also critical in carbon sequestration as they create materials that can bring back carbon into the soil. With this background, this study was guided by the objective of evaluating seaweed biochar incorporation into food waste–goat manure vermicompost for enhanced vermidegradation (carbon-to-nitrogen ratio, pH, and electrical conductivity) and nutrient mineralization (P, Ca, Na, Mg, and K).
The experiment was conducted at the University of Namibia's Sam Nujoma Campus, located in Henties Bay in the Erongo Region of Namibia. The optimum ratio of food waste and goat manure mixture of 50% food waste and 50% goat manure was used based on the results of Katakula et al. (2021). The seaweed biochar used in this study was identified from Katakula et al. (2020), and this was derived from G. funicularis which was pyrolysed at a temperature of 400°C for 1 h. Vermireactors made from 20-L plastic buckets were used as outlined by Katakula et al. (2021). The characteristics of the food waste–goat manure and biochar used in this study can be found in Katakula et al. (2020, 2021). The earthworms were obtained from the local wormery at the University of Namibia's Sam Nujoma Campus, where the species Eisenia fetida was kept feeding on mainly vegetable food waste and goat manure.
Seaweed biochar (SB) was incorporated into the optimized food waste–goat manure mixture (FWGM) at five different levels on a dry w/w basis, and this gave five treatment combinations, which are control (FWGM only), 2% SB + FWGM, 4% SB + FWGM, 6% SB + FWGM, and 8% SB + FWGM. These treatments were laid in a completely randomized design which were replicated three times. Following the preparation of the various treatments, these were allowed to pre-compost for 2 weeks before the addition of 25 g of earthworms (E. fetida) per kg of vermicompost as recommended by Mupambwa and Mnkeni (2016). A moisture content of 70–80% was maintained by lightly sprinkling the buckets with water, and these treatments were kept under a shade at room temperature. Non-destructive sampling was done for each treatment at 0, 4, 8, and 10 weeks. The collected vermicompost samples were air-dried and ground using a mechanical grinder (Polymix PX-MFC 90 D, Kinematica AG, Switzerland) for chemical characterization.
Electrical conductivity (EC) and pH were measured in water at a ratio of 1:10 (w/v) as described by Agri Laboratory Association of Southern Africa (AgriLASA) (2004). In brief, 5.g of the vermicompost was mixed with 50 mL of deionized water and shaken with a horizontally reciprocating shaker at 120 rpm for 30 min, and then, pH and EC were measured using a calibrated multimeter (Lovibond Water Testing, SensoDirect 150).
The Olsen method was used to determine extractable phosphorus because it has been shown to be effective for acidic materials (Schoenau and O'Halloran, 2006). A solution of 0.5 M sodium hydrogen carbonate adjusted to a pH of 8.5 using 1 M of sodium hydroxide was used for extraction. In brief, 2.5 g of the vermicompost was shaken in 50 mL of the extracting solution for 30 min at 120 rpm and then filtered with Whatman No. 2 filter paper. The extracts were then analyzed for P using the ascorbic acid method as described by Kuo (1996).
Total C and N were determined using the dry combustion method employing a LECO CHN628 auto analyser (LECO Corporation, USA).
The cations were extracted using the ammonium acetate method as described by Agri Laboratory Association of Southern Africa (AgriLASA) (2004). A solution of 1 M ammonium acetate adjusted to pH 7 was used to extract the cations. To prepare this, an amount of 57 mL of glacial acetic acid was diluted with deionized water to a volume of 500 mL. An amount of 69 mL of concentrated ammonia solution was then added to the diluted solution of acetic acid. The solution was mixed well and diluted to about 900 mL with deionized water, and then, pH was adjusted to 7 using either acetic acid or ammonia solution. Five grams of vermicompost was placed in a 100-mL extraction bottle, 50 mL of ammonium acetate solution was added to the extraction bottle, and the mixture was shaken horizontally on a reciprocating shaker at 180 rpm for 30 min. The extracts were filtered using Whatman Number 2 filter paper, and the cation concentrations in the solution were determined using a calibrated inductively coupled plasma–optical emission spectrometer (ICP-OES—iCAP 6000 series).
The humic and fulvic acid fractions in the vermicomposts were extracted using a method described by Sanchez-Monedero et al. (1996). A 0.1 mol L−1 NaOH solution was used at an extraction ratio of 2:40 (w/v) and shaken for 4 h with a reciprocal shaker. The extracts were then centrifuged at 4,000 rpm for 15 min. After centrifugation, the supernatant was divided into two fractions, with one half stored for analysis of the total extractable C fraction (CtEX). The other half was acidified to pH 2 by adding drops of concentrated H2SO4, to form a precipitate representing the humic acid (HA) fractions, whilst the liquid part represented the fulvic acid fraction. The acidified extracts were allowed to coagulate for 24 h at 4 °C and further centrifuged at 4,000 rpm to separate the humic and fulvic fractions. The non-precipitated part of the centrifuged samples was then further analyzed for fulvic acid carbon (CFA). The C concentrations in the supernatants were determined using the dichromate oxidation method, with the concentration of the humic acid (CHA) fraction being calculated as the difference between CtEX and CFA. The humification ratio (HR, equation 1), humification index (HI, equation 2), percentage of humic acids (Pha, equation 3), and polymerization index (PI, equation 4), which are indices used for the evaluation of humification level in the vermicompost, were then calculated as indicated in the equations.
The data were analyzed using repeated measures of analysis of variance (ANOVA). Where sphericity assumptions could not be met, the Greenhouse–Geisser correction of P was used. For the humification parameters, a one-way analysis of variance (ANOVA) was performed for the data collected at week 10. Mean separations were conducted using the Fisher's protected least significant at P < 0.05 when analysis of variance indicated a significant P-value. All data were analyzed using JMP version 14.0.0 statistical software (SAS Institute, Inc., Cary, North Carolina, USA, 2010), whilst all the graphs were plotted using Microsoft Excel (2007).
A significant difference (P < 0.05) was observed between treatments on changes in pH across the 10 weeks of vermicomposting (Table 1). The pH was alkaline throughout the vermicomposting process with pH increasing from the initial values across all treatments (Figure 1). After 10 weeks of vermicomposting, the control treatment which had no biochar incorporated into it had the highest pH of 9.06, whilst the lowest pH was 8.72 observed in the 8% biochar treatment. It was interesting to observe that the final pH values at 10 weeks showed a strong link to the level of biochar incorporation as it followed the order 0 >2 >6 >4 >8% biochar. After 10 weeks of vermicomposting, the pH values observed were 9.06, 8.83, 8.79, 8.82, and 8.72 for the 0, 2, 4, 6, and 8% treatments, respectively.

Table 1. Repeated measures of ANOVA for changes in the selected parameters during vermicomposting of a goat manure–food waste mixture amended with seaweed (G. funicularis) biochar.
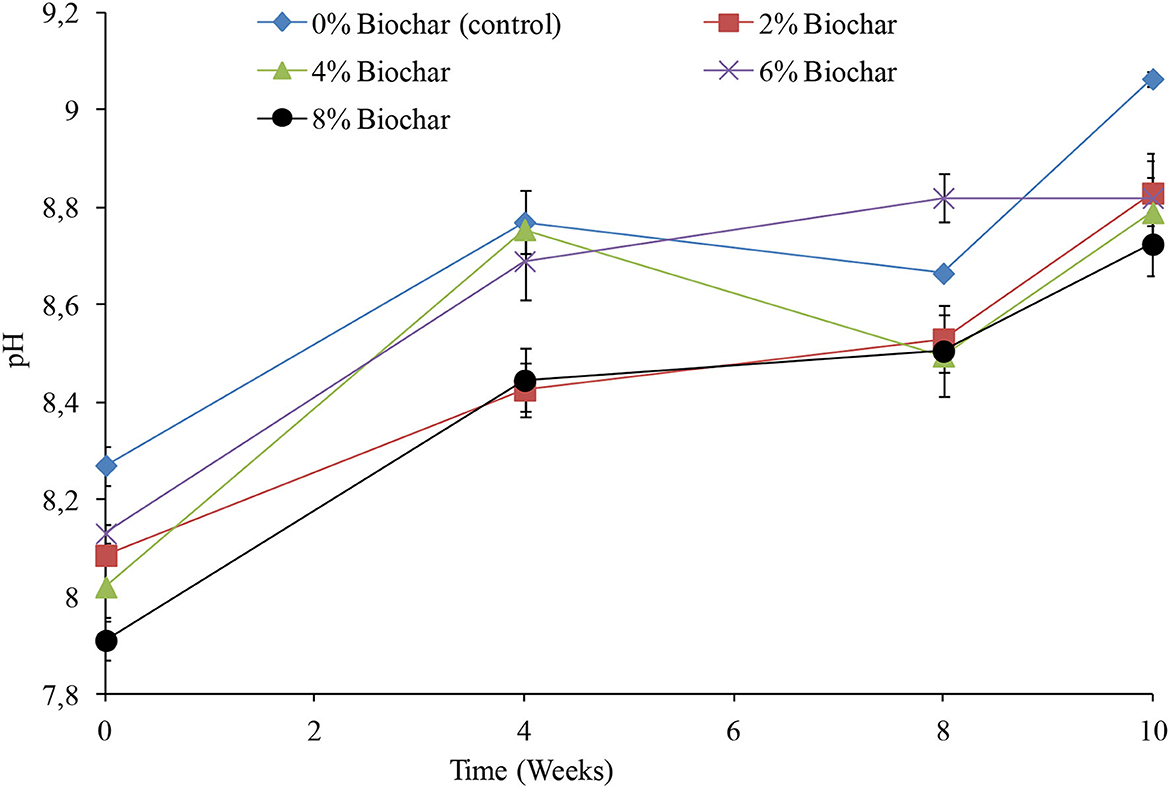
Figure 1. Changes in pH during vermicomposting of goat manure–food waste mixture amended with seaweed (G. funicularis) biochar. Error bars indicate standard deviation.
Throughout the 10 weeks of vermicomposting, EC showed an almost linear increase for all treatments, with a significant difference (P < 0.05) being observed between treatments and time as shown in Table 1 and Figure 2. Similar to the observations of pH, the higher the biochar incorporation rate, the higher the EC, and also, the higher the incorporation rate, the higher the rate of change (Figure 2). Across all treatments between 0 and 10 weeks, EC increased by 28, 42.2, 42.3, 54, and 67% for the 0, 2, 4, 6, and 8% treatments, respectively. After the 10 weeks of vermicomposting, the final EC values were 6, 9.2, 10.9, 12.4, and 16.5 mS/cm for the 0, 2, 4, 6, and 8% treatments, respectively.
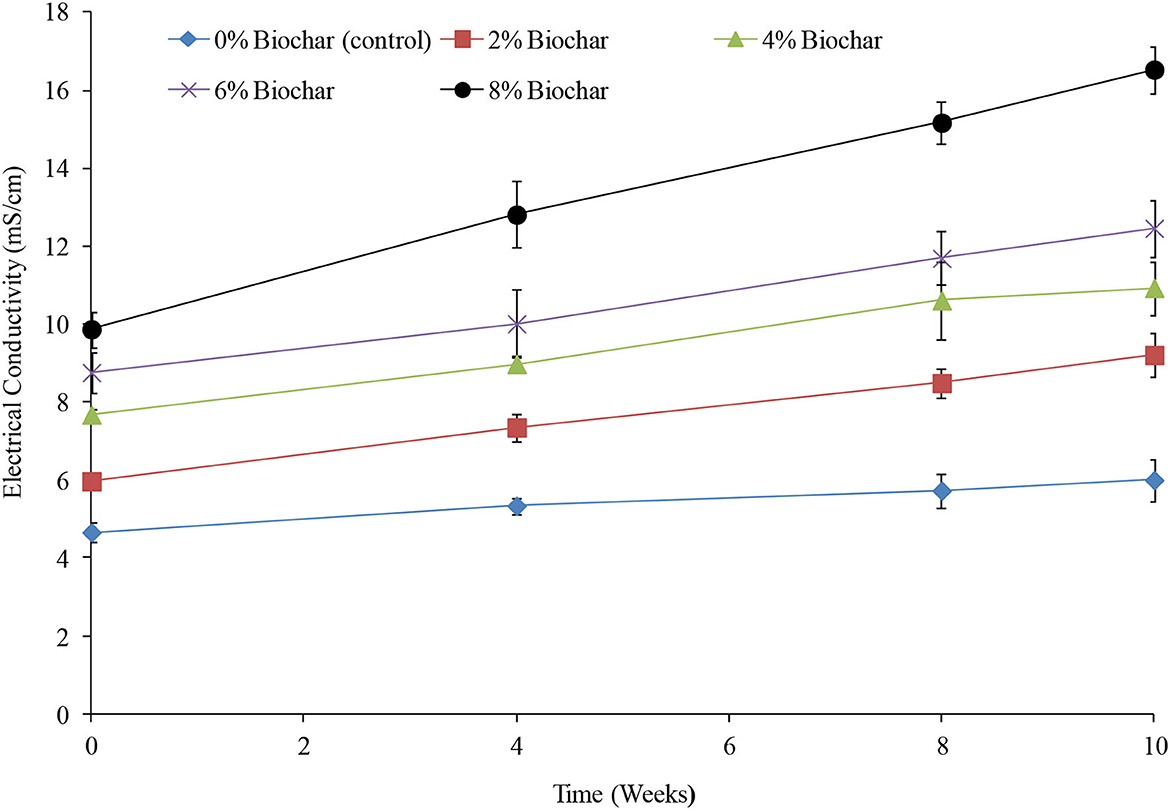
Figure 2. Changes in electrical conductivity during vermicomposting of goat manure–food waste mixture amended with seaweed (G. funicularis) biochar. Error bars indicate standard deviation.
Across the different treatments, there were significant differences (P < 0.05) observed in changes in a C/N ratio, across the 10 weeks of vermicomposting (Table 1). Generally, across all treatments the C/N decreased from an average C/N of 34:1 at week 0 to a final average of 15:1 at week 10 (Figure 3). After the 10 weeks of vermicomposting, relative to the starting values, the C/N ratio decreased by 97, 116, 155, 128, and 134% for the 4, 6, 2, 8%, and control treatments, respectively, as indicated by the significant difference in time indicated in Table 1. At the end of the vermicomposting, the final C/N ratios were 14.4, 14.9, 16.7, 15.1, and 14.4 for the treatments 0, 2, 4, 6, and 8%, respectively. There were no significant interactions (P > 0.05) between treatments and time (Table 1).
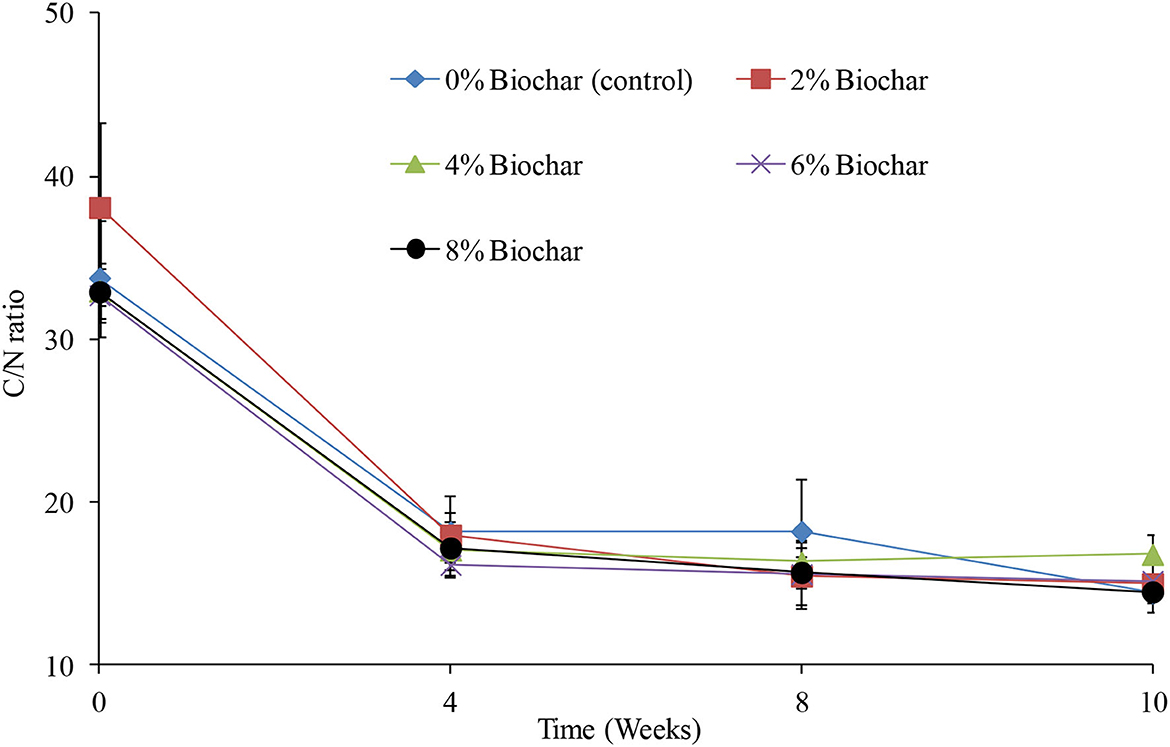
Figure 3. Changes in carbon-to-nitrogen ratio (C/N) during vermicomposting of a goat manure–food waste mixture amended with seaweed (G. funicularis) biochar into. Error bars indicate standard deviation.
For all the four humification indices measured which are humification ratio (HR), humification index (HI), percentage of humic acids (Pha), and polymerization index (PI), there were no significant differences (P > 0.05) between all treatments after 10 weeks of vermicomposting. The highest humification ratio was observed in the control treatment with a humification ratio of 16.1, whilst the lowest was the 4% treatment with a HR of 13.8. The HR values followed the order 0 > 8 > 2 > 6 > 4% with final values of 16.1, 16.0, 15.6, 15.3, and 13.8 for biochar treatments, respectively (Figure 4A). For a humification index, the control treatment had the highest value of 2.8, whilst the lowest was with the 4% treatment with a HI of 2.3. The final HI after 10 weeks of vermicomposting followed the order of 4 < 6 < 2 < 8% < control (Figure 4B).
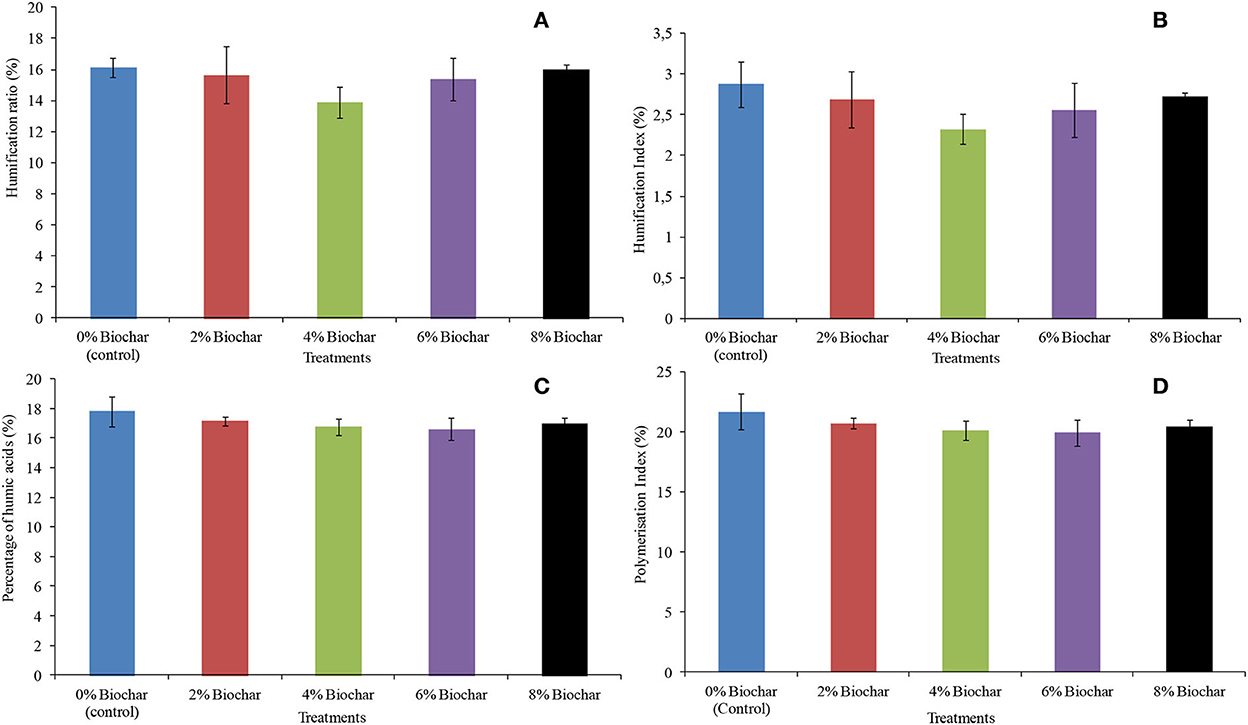
Figure 4. Final humification parameters after 10 weeks of vermicomposting of a goat manure–food waste mixture amended with seaweed (G. funicularis) biochar. (A) (Humification ratio); (B) (humification index); (C) (percentage of humic acids); and (D) (polymerization index).
Similarly, the control treatment also resulted in the highest value of percentage of humic acids of 17.8, whilst the 6% treatment had the lowest Pha of 16.5. The Pha followed the order of 6 < 4% < 8 < 2% < control with 16.5, 16.7, 16.9, 17.1, and 17. 8, respectively (Figure 4C). For a polymerization index, the highest value was observed at the control treatment with a PI of 21.6, whilst the lowest was 19.9 at 6% biochar treatment. The PI followed the order of 6 < 4 < 8 < 2% < control with 19.9, 20.1, 20.4, 20.6, and 21.6, respectively (Figure 4D).
There were significant differences (P < 0.05) observed between treatments on changes in Olsen phosphorus as shown in the repeated measures of ANOVA (Table 1). The 8% treatment gave the highest final concentration of Olsen extractable phosphorus of 0.40 g per kg, whilst the 2% treatment had the lowest final concentration of 0.30 g per kg of vermicompost at 10 weeks. It was interesting to observe that the changes in Olsen P during vermicomposting could be modeled using a second-order polynomial equation with very high R2 values (Figure 5). For all treatments, the peak Olsen phosphorus was observed between week 6 and week 8 of vermicomposting, and after 8 weeks, almost all treatments started showing a decrease in Olsen P concentration. After 10 weeks of vermicomposting, the final percentage change in Olsen P was 19, 14.2, 7.3, 4.1, and 3.0% for the 8, 6, 0, 4, and 2% treatments, respectively (Figure 5).
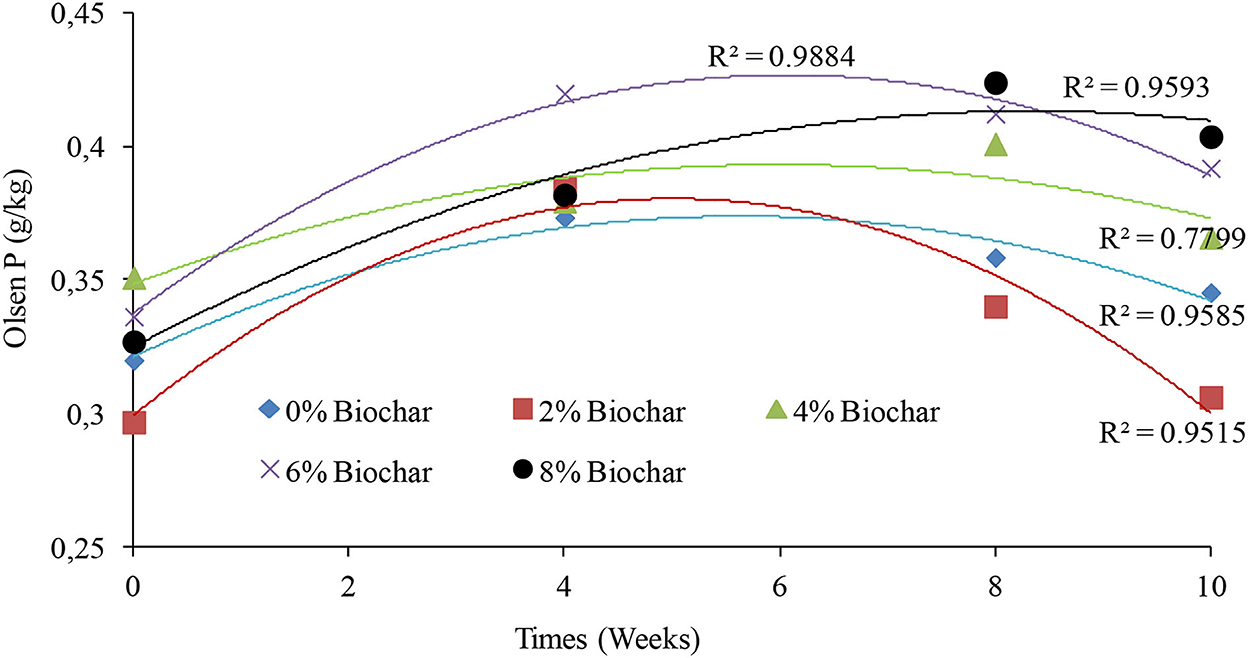
Figure 5. Second-order polynomial line graphs showing the trends of changes in Olsen P after 10 weeks of vermicomposting of a goat manure–food waste mixture incorporated with seaweed (G. funicularis) biochar.
For the control treatment, the peak concentration of Olsen P was observed at week 4 with a concentration of 0.37 g/kg which was a 7.3% increase in Olsen P compared with the initial concentration. The peak concentration of the 2% biochar treatment for Olsen P was observed at week 4 with a concentration of 0.38 g/kg with a 3.0 % increase. For the 4% treatment, the peak concentration of Olsen P was observed at week 8 with a concentration of 0.40 g/kg with a 4.1 % increase in Olsen concentration. The peak concentration of the 6% treatment was observed at week 4 with the Olsen concentration of 0.41 g/kg with a 14.2 % increase in Olsen P. For the 8% treatment, the peak Olsen concentration was 0.42 g/kg observed at week 8 with a 19% increase in Olsen P relative to the starting values (Figure 5).
There were significant differences (P < 0.05) observed between treatments for Mg, K, and Na except for Ca as shown in repeated measures of ANOVA (Table 1). For all treatments except for the control, the concentration of calcium increased from week 0 until week 8 and thereafter significantly decreased to concentrations that were below the original concentrations. However, the control treatment showed an almost constant concentration of calcium across the 10 weeks of vermicomposting. After 10 weeks of vermicomposting, the final concentration of calcium was observed to be high in the control followed by the 2, 4, 8, and 6% treatments with the final concentration of 18.9, 16.2, 15., 15.5, and 15.3 g/kg, respectively (Figure 6A). It was observed that the final concentration of calcium for all treatments was lower than that of the treatment without biochar.
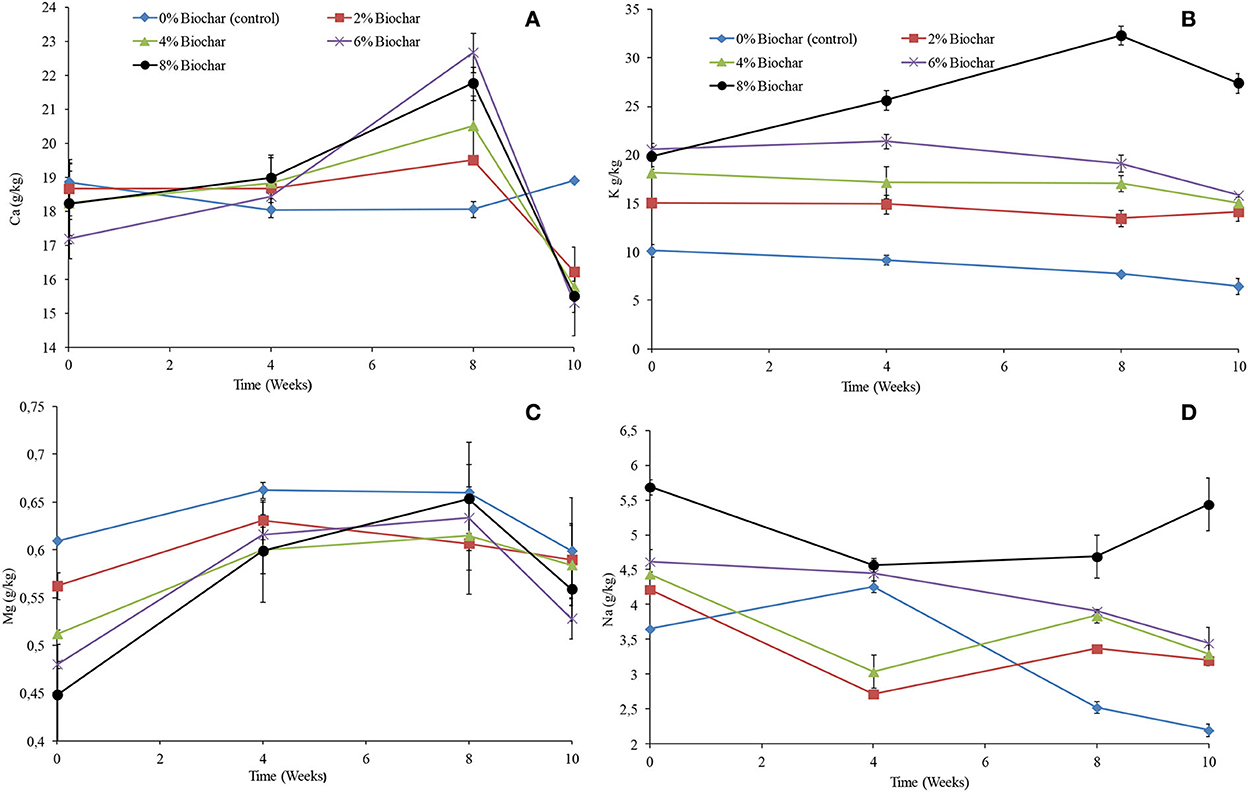
Figure 6. Changes in extractable (A) (Ca), (B) (K), (C) (Mg), and (D) (Na) after 10 weeks of vermicomposting of a goat manure–food waste mixture amended with seaweed (G. funicularis) biochar. Error bars indicate standard deviation.
Similar to the changes in electrical conductivity, the higher the concentration of biochar incorporation rate, the higher the concentration of potassium. For all treatments, the concentration was almost consistent across the 10 weeks of vermicomposting, whilst it increased only for the 8% biochar concentration (Figure 6B). The final concentration of potassium followed the order 8 > 6 > 4 > 2 > 0% with the final concentration of 27.4, 15.8, 15.0, 14.1, and 6.4 g/kg after 10 weeks of vermicomposting. For all treatments, the concentration of magnesium increased until week 8 and thereafter decreased (Figure 6C). The final concentration of magnesium followed the order 0 > 2 > 4 > 8 > 6% with the final concentration of 0.59, 0.58, 0.58, 0.55, and 0.52 g/kg at 10 weeks (Figure 6C). Generally, sodium showed a small decrease for most of the treatments across the 10 weeks of vermicomposting. After 10 weeks, the higher the biochar incorporation rate, the higher the concentration of sodium. The final concentration of sodium followed the order 8 > 6 > 4 > 2 > 0% with the final concentration of 5.44, 3.45, 3.29, 3.2, and 2.2 g/kg at 10 weeks (Figure 6D).
According to the results of the study, the alkalinity of the pH is probably from the materials used which are goat manure and food waste which had a pH of 9 and not due to the application rate of biochar. The increase in pH across all treatments could be attributed to the release of ammonia and calcium as suggested by Karwal and Kaushik (2021), and this has been attributed to earthworm activity. Furthermore, the pH increase has also been reported to be attributed to the increase in ash formation and mineralization of organic nitrogen as a result of microbial activities (Jain et al., 2018). The alkaline vermicompost may present an opportunity to use it as an amendment for acidic soils though there is no clear link between the level of inclusion of biochar and the changes in pH. Though the pH was alkaline, it was still within the region where most of the macronutrients needed by the plants will still be bioavailable as recommended by Simms et al. (2020). In our study, it was clear that the higher EC observed is attributed to the level of biochar incorporation. The increase in EC is attributed to the high levels of cations mainly calcium and potassium that are present in the biochar; hence, the higher the biochar level, the higher the EC. Higher EC reflects the presence of more soluble salts, metabolites such as ammonium, and inorganic ions that are produced by earthworm's activities during vermicomposting (Lukashe et al., 2019). It will be critical to monitor the changes in electrical conductivity when seaweed biochar amended vermicompost is incorporated into the soil as the EC value of beyond 4 mS/m has been reported to result in soil salinity. The high salinity observed in the vermicomposts from the different treatments could mean that these vermicomposts may not be an appropriate amendment in the growing of saline-sensitive crops. However, it will be interesting to observe the changes in soil EC after the moderate amendment of sandy soils, which leach faster with these vermicomposts. In a review, Gondek et al. (2020) highlighted that other studies have used composts with conductivities higher than 4 mS/m with no crop phytotoxicity in the second and third seasons. It is recommended to fully evaluate such vermicomposts on their agronomic effectiveness, especially with saline-tolerant crops such as wheat and barley. Also, such vermicomposts have been observed to be more ideal for growing plants rather than for seedling emergency and growth.
The incorporation of biochar did not influence the trend of change in a C/N ratio as all treatments followed the same trend. The C/N ratio is the key indicator of biodegradation during the vermicomposting process (Karwal and Kaushik, 2021), and C/N of < 20 has been reported to represent mature vermicompost through a C/N ratio of below 15 representing a much more stable compost (Bernal et al., 2009). In our study, it was observed that the treatments that had biochar incorporated at 6–8% resulted in much more stable vermicompost though even the control resulted in mature vermicompost with a C/N ratio of below 20. The decrease in the C/N ratio may be due to the accumulation of nitrogenous compounds, the release of CO2 by earthworm metabolism, and enzyme–microbe-induced decomposition of organic matter (Bhat et al., 2015; Karwal and Kaushik, 2021). This was also observed in a study by Ravindran and Mnkeni (2016) who reported that the C/N ratio decreases may be due to a higher loss of carbon accompanied by an increase in nitrogen during vermicomposting of waste paper and chicken manure. In the study, the decrease in C/N may have been a result of the rapid breakdown of organic matter for microbial metabolism. When you incorporate biochar into vermicompost, you may get faster maturity relative to the control without biochar. The inclusion of biochar does not result in reduced decomposition but rather enhanced decomposition as observed in the study.
The humification parameters showed a different trend with the control having the highest humification parameters though they were not significantly different from the other treatments. As observed in our study, the incorporation of biochar does not result in reduced humification parameters. Mature compost has been indicated to have a humification ratio of >7, which was achieved in all treatments in our study (Bernal et al., 2009). However, according to Bernal et al. (2009) the humification index, polymerization index, and percentage of humic acids were all below the recommended levels for mature compost. This may be because the humification takes place after the initial decomposition during vermicomposting; therefore, it might be interesting to do this vermicomposting over a longer period to see whether humification can be improved. It is interesting that the C/N ratio indicated mature vermicompost unlike the humification parameters. There is still a need to evaluate other parameters other than humification parameters that are critical in the evaluation of compost maturity (Li et al., 2015).
An incorporation rate of biochar of between 6 and 8% resulted in the highest Olsen extractable P after 10 weeks of vermicomposting. The peak concentration of Olsen P was observed between weeks 6 and 8, which unfortunately was when the vermicompost was not yet matured. The decline in Olsen P may be due to the leaching of the nutrients in the leachate. The higher the biochar, the higher the concentrations of Olsen P observed. The higher concentrations in vermicomposts may be due to various earthworm activities during vermicomposting with the enzymes that help the release of phosphorus from feedstock (Sharma and Garg, 2019). According to the Food and Agriculture Organization of the United Nations, the potassium content in organic fertilizer should not be <1.5%, whilst the concentration of calcium and other essential micronutrients should be in the range from 0.01 to 0.05%. In this study, the concentration of potassium was above 1.5%, which means the incorporation of biochar may enhance the concentration of potassium in composts. Zhang et al. (2016) found that the concentration of Na ions was lower in the composted mixture amended with biochar as compared to the mixture without biochar addition. However, in this study that was not the case, and this might be attributed to the origin of the material that was used to prepare the biochar, which is from the marine environment where salinity is higher. It will be important to monitor the changes in soil physical properties when this seaweed biochar amended vermicompost is used as the soil amendment. The increase in exchangeable calcium and magnesium is ascribed to the higher content of these nutrients in the materials used. In the study, that was not the case, the increase in calcium and magnesium could be attributed to the effect of organic acids produced during the process of decomposition, which enhances the solubility of calcium and magnesium. The incorporation level of biochar increased the potassium concentration, and this may be due to the biochar used which had high amounts of potassium from the first experiment.
The study observed that biochar incorporation does not really influence the biodegradation process. However, higher inclusion levels of the seaweed biochar in vermicomposts might result in elevated EC. In terms of nutrients, the seaweed biochar resulted in significantly higher Olsen extractable P levels as compared to the control. An optimized level of 6% to 8 biochar incorporation ratio can be recommended in terms of nutrition and decomposition during vermicomposting of food waste–goat manure mixture. During vermicomposting, the peak concentration of elements such as P was observed before the vermicompost indicated maturity based on the C/N ratio and humification parameter. The vermicompost in this study could be ideal for growing, mainly saline-sensitive crops such as wheat, barley, and other grasses, not for seedling growth. It will be interesting to evaluate the changes in soil parameters and plant growth when vermicompost with seaweed biochar incorporated between 6 and 8% is used.
Enhanced vermicomposting process makes use of marine biomass biochar to enhance nutrient composition whilst other researchers used terrestrial biomass. It creates a enhanced frontier in marine biomass valorization.
The raw data supporting the conclusions of this article will be made available by the authors, without undue reservation.
Material preparation, data collection, and analysis were performed by AK, HM, BH, and WG. The first draft of the manuscript was written by AK. All authors commented on previous versions of the manuscript. All authors contributed to the study conception and design. All authors read and approved the final manuscript.
This study was funded by research funds from the University of Namibia through an MSc study bursary to AK.
The authors declare that the research was conducted in the absence of any commercial or financial relationships that could be construed as a potential conflict of interest.
All claims expressed in this article are solely those of the authors and do not necessarily represent those of their affiliated organizations, or those of the publisher, the editors and the reviewers. Any product that may be evaluated in this article, or claim that may be made by its manufacturer, is not guaranteed or endorsed by the publisher.
Agri Laboratory Association of Southern Africa (AgriLASA) (2004). Soil Handbook. Pretoria: Agri Laboratory Association of Southern Africa.
Bernal, M. P., Alburquerque, J., and Moral, R. (2009). Composting of animal manures and biodiversity. Biodiver. Conserv. 7, 419–433. doi: 10.1016/j.biortech.2008.11.027
Bhat, S. A., Singh, J., and Vig, A. P. (2015). Potential utilization of bagasse as feed material for earthworm Eisenia fetida and production of vermicompost. SpringerPlus 4, 11. doi: 10.1186/s40064-014-0780-y
Chen, X., Zhao, Y., Zhang, C., Zhang, D., Yao, C., Meng, Q., et al. (2020). Speciation, toxicity mechanism and remediation ways of heavy metals during composting: a novel theoretical microbial remediation method is proposed. J. Environ. Manag. 272, 111109. doi: 10.1016/j.jenvman.2020.111109
Gondek, M., Weindorf, D. C., Thiel, C., and Kleinheinz, G. (2020). Soluble salts in compost and their effects on soil and plants: a review. Compost Sci. Utiliz. 28, 2, 59–75. doi: 10.1080/1065657X.2020.1772906
Hu, X., Huang, X., Zhao, H., Liu, F., Wang, L.u., Xin, Z., et al. (2021). Possibility of using modified fly ash and organic fertilizers for remediation of heavy-metal-contaminated soils. J. Clean. Prod. 284:124713. doi: 10.1016/j.jclepro.2020.124713
Jain, M. S., Rohit, J., and Ajay, S. K. (2018). Biochar amendment for batch composting of nitrogen rich organic waste: effect on degradation kinetics, composting physics and nutritional chemical criteria for compost maturity assessment. A review. Bioresour. Technol. 22, 5444–5453. doi: 10.1016/j.biortech.2018.01.038
Karwal, M., and Kaushik, A. (2021). Bioconversion of lawn waste amended with kitchen waste and buffalo dung in to value –added vermicompost using Eisenia foetida to alleviate landfill burden. J. Mater Cycles Waste Manag. 23, 358–370. doi: 10.1007/s10163-020-01101-7
Katakula, A. A. N., Gawanab, W., Itanna, F., and Mupambwa, H. A. (2020). The potential fertilizer value of Namibian beach-cast seaweed (Laminaria pallida and Gracilariopsis funicularis) biochar as a nutrient source in organic agriculture. Sci. Afr. 10, e00592. doi: 10.1016/j.sciaf.2020.e00592
Katakula, A. A. N., Handura, B., Gawanab, W., Itanna, F., and Mupambwa, H. A. (2021). Optimized vermicomposting of a goat manure-vegetable food waste mixture for enhanced nutrient release. Scient. Afr. 12, e00727. doi: 10.1016/j.sciaf.2021.e00727
Khan, M. B., Xiaoqiang, C., Ghulam, J., Ugit, L., Afsheen, Z., Yasir, H., et al. (2019). Eisenia fetida and biochar synergistically alleviate the heavy metals content during valorization of biosolids via enhancing vermicompost quality. Sci. Total Environ. 684, 597–609. doi: 10.1016/j.scitotenv.2019.05.370
Kizito, S., Luo, H., Lu, J., Bah, H., Dong, R., and Wu, S. (2019). Role of nutrient-enriched biochar as a soil amendment during maize growth: Exploring practical alternatives to recycle agricultural residuals and to reduce chemical fertilizer demand. Sustainability 11, 3211. doi: 10.3390/su11113211
Kuo, S. (1996). “Phosphorus,” in Methods of Soil Analysis. Part 3 Chemical Methods, eds D. L. Sparks, A. L. Page, P. A. Helmke, R. H. Loeppert, P. N. Soltanpour, M. A. Tabatabai, et al. (Madison: Soil Science Society of America), Book Series No. 5, 869–912.
Li, Z., Huang, G., Yu, H., Yang, Z., and Huang, W. (2015). Critical factors and their effects on product maturity in food waste Composting. Environ. Monit. Assess. 187:217. doi: 10.1007/s10661-015-4430-9
Lukashe, S. N., Mupambwa, H. A., Green, E., and Mnkeni, P. N. S. (2019). Inoculation of fly ash amended vermicompost with phosphate solubilizing bacteria (Pseudomonas fluorescens) and its influence on vermi-degradation, nutrient release and biological activity. Waste Manag. 83, 14–22. doi: 10.1016/j.wasman.2018.10.038
Makini, G. V., Ndukhu, H. O., Muraya, M., and Kirimi, I. M. (2020). Effects of goat manure-based vermicompost on soil chemical properties under garlic production in meru south and manyatta sub-counties. Int. J. Eng. Appl. Sci. Technol. 4, 91–99. doi: 10.33564/IJEAST.2020.v04i09.009
Mupambwa, H. A., Haulofu, M., Nciizah, A. D., and Mnkeni, P. N. S. (2022). “Vermicomposting technology: a sustainable option for waste beneficiation,” in Handbook of Waste Biorefinery, eds E. Jacob-Lopes, L. Queiroz Zepka, and M. Costa Deprá (Cham: Springer). doi: 10.1007/978-3-031-06562-0_21
Mupambwa, H. A., and Mnkeni, P. N. S. (2016). Eisenia fetida stocking density optimization for enhanced bioconversion of fly ash enriched vermicompost. J. Environ. Qual. 45, 1087–1095. doi: 10.2134/jeq2015.07.0357
Ravindran, B., and Mnkeni, P. N. S. (2016). Bio-optimization of the carbon-to-nitrogen ratio for efficient vermicomposting of chicken manure and waste paper using Eisenia fetida. Environ. Sci. Pollut. Resour. 23, 16965–16976. doi: 10.1007/s11356-016-6873-0
Sanchez-Monedero, M. A., Roig, A., Martinez-Pardo, C., Cegarra, J., and Paredes, C. (1996). A microanalysis method for determining total organic carbon in extracts of humic substances: Relationships between total organic carbon and oxidisable carbon. Bioresour. Technol. 57, 291–295. doi: 10.1016/S0960-8524(96)00078-8
Schoenau, J. J., and O'Halloran, I. P. (2006). “Sodium bicarbonate-extractable phosphorus,” in Soil Sampling and Methods of Analysis, 2nd Edn. ed M. R. Carter (Boca Raton, FL: Canadian Society of Soil Science, Canada), 89–95. doi: 10.1201/9781420005271.ch8
Sharma, K., and Garg, V. K. (2019). Recycling of lignocellulosic waste as vermicompost using earthworm Eisenia fetida. Environ. Sci. Pollut. Res. Int. 26, 14024–14035. doi: 10.1007/s11356-019-04639-8
Simms, T., Chen, H., and Mahato, G. (2020). Dope-depended effect of biochar as soil amendment on reducing copper phytotoxicty and mobility. Int. J. Environ. Resour. 14, 751–759. doi: 10.1007/s41742-020-00293-y
Wang, H., Tianbao, R., Yuqing, F., Kouzhu, L., Huilin, F., Guoshun, L., et al. (2020). Effects of the application of biochar in four typical agricultural soils in China. Agronomy 10, 351. doi: 10.3390/agronomy10030351
Were, S. A., Rama, D. N., Janice, E. T., Eunice, W. M., James, W., Muthomi, L. M., et al. (2019). Effect of vermicompost and biochars from different crop residues in management of root rot of common bean (Phaseolus vulgaris L.). Int. J. Res. Agric. Sci. 6, 2348–3997.
Zhang, J., Chen, G., Sun, H., Zhou, S., and Zou, G. (2016). Straw biochar hastens organic matter degradation and produces nutrient-rich compost. Bioresour. Technol. 200, 876–883. doi: 10.1016/j.biortech.2015.11.016
Keywords: biodegradation, compost maturity, Eisenia fetida, nutrient release, seaweed biochar
Citation: Katakula AAN, Gawanab W, Handura B, Itanna F and Mupambwa HA (2022) Seaweed (Gracilariopsis funicularis) biochar incorporation into a goat manure–food waste vermicompost for optimized vermidegradation and nutrient release. Front. Sustain. Food Syst. 6:1005740. doi: 10.3389/fsufs.2022.1005740
Received: 28 July 2022; Accepted: 15 November 2022;
Published: 06 December 2022.
Edited by:
Marzia Ingrassia, Università degli Studi di Palermo, ItalyReviewed by:
Marga Lopez, Universitat Politecnica de Catalunya, SpainCopyright © 2022 Katakula, Gawanab, Handura, Itanna and Mupambwa. This is an open-access article distributed under the terms of the Creative Commons Attribution License (CC BY). The use, distribution or reproduction in other forums is permitted, provided the original author(s) and the copyright owner(s) are credited and that the original publication in this journal is cited, in accordance with accepted academic practice. No use, distribution or reproduction is permitted which does not comply with these terms.
*Correspondence: Hupenyu Allan Mupambwa, aG11cGFtYndhQHVuYW0ubmE=; aGFtdXBhbWJ3YUBnbWFpbC5jb20=
Disclaimer: All claims expressed in this article are solely those of the authors and do not necessarily represent those of their affiliated organizations, or those of the publisher, the editors and the reviewers. Any product that may be evaluated in this article or claim that may be made by its manufacturer is not guaranteed or endorsed by the publisher.
Research integrity at Frontiers
Learn more about the work of our research integrity team to safeguard the quality of each article we publish.