
95% of researchers rate our articles as excellent or good
Learn more about the work of our research integrity team to safeguard the quality of each article we publish.
Find out more
ORIGINAL RESEARCH article
Front. Sustain. Food Syst. , 27 September 2022
Sec. Land, Livelihoods and Food Security
Volume 6 - 2022 | https://doi.org/10.3389/fsufs.2022.1000156
This article is part of the Research Topic Evaluating the Adoption and Impacts of Agricultural Technologies View all 13 articles
 Maria L. Malabayabas1
 Ashok K. Mishra2*
In the eastern India region, due to the dominance of fragmented and smaller land holdings and lack of irrigation facilities, the adoption of green revolution technologies has progressed slowly. Economic growth, income, and land fragmentation have induced families to allocate labor to non-farm jobs. In the absence of male decision-makers, spouses are responsible for making farming-related decisions jointly with their husbands. This study examines the inverse relationship between farm size and rice productivity in joint farm decision-making among married couples. The study uses survey data from four eastern states of India. The finding confirms the inverse relationship between cultivated rice area and rice yields. The inverse relationship holds but weakens when we control for farm and household characteristics and land quality. Smallholders in India tend to have dual employment, and as a result, more farm management decisions are being made jointly with spouses. Findings indicate that joint farming decision-making may have an adverse effect on rice productivity. Socially advantaged farmers have a lower yield. Finally, the study reveals that off-farm income from off-farm employment increases rice productivity. Policymakers can strengthen extension services to disseminate farming knowledge (agronomic practices and technology) to socially disadvantaged farmers and off-farm job opportunities for smallholders.
Sustaining food security in developing countries is one of the major roles of smallholder producers1. In India, most smallholders are located in rural areas and depend on agriculture as their primary source of livelihood. Among the staple crops, rice is primarily produced by smallholder farmers. Smallholder rice farms comprise 75% of the total rice farms covering 37% of the total rice area [Government of India (GoI), 2016]. The significance of these smallholder rice producers became apparent during the1 height of the Green Revolution in the 1970's, where greater emphasis on crop genetic improvement through plant breeding programs. According to Pingali et al. (2019), Green Revolution technologies were effectively designed and implemented for smallholders. These technologies were scale-neutral, and adequate institutional support was given through input subsidies.
Despite the development of new technologies, rice productivity has witnessed a slow growth rate in recent years compared to the early periods of the Green Revolution (Khush, 1999). This is particularly true for eastern Indian states. In 2015, eastern India accounted for 66% of the total rice area in the country and produced more than half (52 million tons) of India's total rice production [Government of India (GoI), 2016]2. The eastern region is mainly composed of unfavorable rice areas (rainfed), prone to abiotic stress (flood, drought, and salinity), and low levels of education among farming households. Additionally, the region depends on single cropping during monsoon, a major reason for comparatively low and uncertain yields (Barah and Pandey, 2005). For instance, in 2015, the region's average rice productivity was 2.25 t/ha, well below the national average of 3.35 t/ha [International Rice Research Institute (IRRI), 2019]. Higher rice consumption and lower production growth rates can lead to food shortages. The eastern India region primarily comprises the rural population (80% of the total population), and a high percentage are in poverty [22–35%, Government of India (GoI), 2016]. Thus, a sudden decrease in rice production may substantially reduce food security, loss of livelihood, and higher market prices in the region and India in general.
Another factor affecting the region is non-farm employment. Most farmers have dual employment—farm and non-farm. The non-farm jobs are located in urban and semi-urban areas. The movement from farm to non-farm sectors is further facilitated by government programs like the Mahatma Gandhi National Rural Employment Guarantee Act (MGNREGA).3 As a result, the agricultural sector has witnessed labor shortages, higher farm wage rates, and increased production costs for smallholders (Bhattarai et al., 2014). Secondly, as more male household members (farming decision makers) engage in non-farm employment, anecdotal evidence suggests that spouses make farming decisions jointly. Finally, as Niroula and Thapa (2005) noted, land-related issues (such as the law of paternal land inheritance, lack of progressive tax on inherited land, and underdeveloped land market) such as land fragmentation will continue in India and eastern Indian4 in particular. However, the importance of small farms in Indian farming cannot be discounted due to high productivity compared to larger farms—also known as the inverse relationship (IR) between farm size and productivity. Additonally, smallholders are the major food producers, and several development organizations have used IR in most development strategies by promoting and supporting smallholder production through land reform laws (IFAD, 2013; Gollin, 2019).
Studies in Indian agriculture show strong evidence of IR between farm size and productivity (Khusro, 1964; Sen, 1964; Rao, 1966; Bhattacharya and Saini, 1972; Srinivasan, 1973; Ghose, 1979). Smallholders are more productive than large farms, suggesting that small farms would help address equity and poverty reduction (Hazell et al., 2010). However, Deininger et al. (2017) point out that land fragmentation beyond the threshold farm size would be detrimental to farm productivity—due to the difficulty of using machines as a substitute for farm labor. Chakravorty et al. (2016) found that an Indian farmer's monthly income with < 0.5 ha of land can barely cover monthly expenditures. Thus, understanding the relationship between smallholders' farm size and rice productivity is essential in identifying smallholders' significant constraints in eastern India. Several studies found an inverse relationship between farm size and productivity caused by imperfect factor markets, land quality, and measurement errors. When analyzing the IR at the household level, it assumes that farming decisions (such as selecting crops, technology, and labor) are made by male household heads (Orr et al., 2016). However, gender-differentiated preferences on farming decisions such as crop choice and labor use (Bourdillon et al., 2007) may affect managerial skills and thus crop yields. Joint decision-making is gaining significant traction in the literature (Damisa and Yohanna, 2007; Aregu et al., 2011; Ibrahim et al., 2012). Similarly, it is no surprise that joint farming decision-making is taking roots in India (Paris et al., 2010).
Thus, this study analyzes the relationship between farm size and productivity among rice farmers in eastern India. Specifically, the study examines the impact of joint farm decision-making among married couples on rice productivity. The study uses the 2016 Rice Monitoring Survey, a nationally representative household-level survey by the International Rice Research Institute (IRRI). This study contributes to the literature in two ways. First, the study tests for the IR between farm area and productivity. The common explanations based in the literature (such as market imperfection and soil quality omission) that support IR will be tested to determine if the same factors explain the existence of IR. Second, the study considers intrahousehold farming decision-making5 by married couples in analyzing IR between farm size and productivity.
The inverse relationship (IR) between farm size and productivity has been one of the recurring topics in rural development, which has sparked the interest of most policymakers and rural development practitioners. The IR phenomenon has been appealing among developing countries, justifying the implementation of land reform programs that promote efficiency and equity among poor farmers (Rada and Fuglie, 2019; Helfand and Taylor, 2021). In India, the existence of IR was first identified by Sen (1962) in defining Indian agriculture using the Farm Management data produced by the Ministry of Food and Agriculture. The author found that increasing farm size reduced farm productivity. The high productivity among small farms could be associated with the intensive use of family labor which assumed no outside employment opportunity resulting in surplus labor. In assessing the profitability in production, the family labor was often valued by imputing the current wage rate, resulting in losses among small farms compared to large farms. Similar findings were found by Khush (1999) using the same data but noticed that the family labor explanation only holds in specific landholding sizes. The author showed that full employment of family labor holds when the landholdings range from 10 acres to 15 acres and hire additional laborers once landholdings go beyond 15 acres. Since there is a threshold of landholdings area, family labor can be fully employed. Indeed, Rao (1966) pointed out that the size of the landholdings cannot be ignored in the analysis because it can affect labor and managerial aspects of production. The author further suggested that mechanization would be the best option for large farms to intensify inputs and avoid managerial difficulties. An additional study by Sen (1966) shows that IR exists due to an imperfect labor market. The Indian peasant farm sector tends to have a labor surplus and wage gap. The wage gap exists when production seasonality and a proposed institutional minimum wage rate exist.
Most of the studies mentioned above depend on aggregated data from the Farmer Management survey, which concludes that an IR exists due to an imperfect labor market. However, aggregated Farm Management data may not necessarily capture the real reasons for the inverse farm-productivity relationship. Rudra (1968) used data from Agro-Economic Research Center, which uses village-level information from Punjab and Uttar Pradesh. The study shows that the intensity of irrigation and inputs used in relation to productivity is constant regardless of the landholding sizes, contrary to the Farm Management data results. A follow-up study by Rudra (1968) analyzed the IR using correlation analysis of 20 villages. The study shows that only two villages show significant and inconsistent results among the villages. Results of one village show that the IR only holds up to 20 acres while the other village shows no systematic pattern. On the other hand, Deolalikar (1981) found that IR exists in India with low agricultural technology and diminishes with farms using a high level of technology.
Several studies used disaggregated data to find alternative reasons to explain the IR phenomenon in Indian agriculture. For example, Saini (1971) analyzed Farm Management data (1954–1957) using the imputed current market wage rate, which explains the profit losses among small farms. The author suggested that instead of using the imputed value of the family labor that leads to market distortion, one should also consider placing a rental value on owned land. Results showed positive profits even in the smallest landholdings when the value of owned land was included in the model. On the other hand, village-level variations can be one of the reasons for IR. For example, Bhattacharya and Saini (1972) included a dummy variable for an Indian village in testing IR. Using data from 1955 to 1968, the authors found that the inverse relationship varies per village. Regarding weather variations, Srinivasan (1973) found out that even though farmers apply the optimal inputs in production, farmers experience yield uncertainties due to weather variations. To capture the full effect of weather on productivity, Srinivasan (1973) suggested dividing the stages of production, such as the early stage (sowing and early growing stage) and the late stage (flowering and harvesting stage).
However, the IR in Indian agriculture mentioned above is based on the pre-Green Revolution period. The period is characterized by underdeveloped areas with diverse climatic conditions, landholding structures, and cropping conditions (Ghose, 1979). In introducing Green Revolution technologies, it is essential to know their impact on small and large farmers since Green Revolution technologies are considered scale-neutral.6 Saini (1971) pointed out that the IR phenomenon is expected to change or disappear, particularly in Green Revolution areas. Green Revolution technologies require complementary inputs (such as fertilizer and irrigation) to achieve full yield potential. Thus, dependence on purchased inputs and capital goods is easily available for large farmers with access to credit and savings (Heltberg, 1998). Several studies show that Green Revolution's introduction in Asia lessens or removes the IR. For example, Deolalikar (1981) examined the fertilizer application among Indian farms using district-level data. The study found that IR exists when fertilizer is excluded in the estimation and reversed once fertilizer usage intensifies and size increases. The finding suggests that large farms benefited more from the technological change through fertilizer than small farms. Increased fertilizer use was found to explain the IR among rice and wheat producers (Subbarao, 1983) in eastern India.
However, the study by Bhalla (1979) found that the IR persisted even during the Green Revolution. Larger farms increased their output per acre and proportion of area under modern varieties (MV) due to their accessibility to cheaper credit. In addition, Birthal et al. (2016) examined crop performance in 20 Indian states. The authors found that small farmers benefitted from technological development by allocating more high-yielding crops and applying more fertilizer and pesticides than larger farms. However, the IR is only prominent in high-value crops (e.g., fruits, plantation crops, and sugar crops) than in food crops such as rice and wheat. The high mechanization increased efficiency, particularly among large rice and wheat farmers. A similar explanation was found by Otsuka et al. (2016) regarding the lessening of the farm-size productivity relationship. Otsuka et al. (2016) pointed out that with the development of non-rural farm sectors and increasing wage rates, larger farms prefer to use labor-saving technologies (such as farm machinery), enabling them to be efficient and reverse IR. Despite weakening the farm-productivity relationship in Green Revolution technologies, the standard explanations in the literature that support IR include market imperfection, land quality, intensive production, error in estimation, and household characteristics.
Market imperfection was identified by Sen (1966) as one of the reasons for the existence of inverse farm size and productivity. An extensive part of literature focused on IR found that the interplay of different sectors causes market imperfections. For example, Feder (1985) pointed out that inverse farm size-productivity exists when imperfect labor, credit, and land markets exist. Interestingly, Lamb (2003) found that when assessing the labor by gender and controlling for village labor and land imperfections, the IR is wholly removed only in male labor demand but not in female labor. This suggests that increasing own production is one way to address market failure in the female labor market. On the other hand, Barrett (1996) found that an IR exists if there are differences in household marketed surplus and price risk-averse farmers. The cost of supervision can also be the reason for IR to exist. For example, Heltberg (1998) found that IR exists where supervision constraints exist since outside labor is an imperfect substitute for family labor. In addition, Feder (1985) pointed out that the efficiency of the hired labor depends on the intensity of the family labor supervision. Deininger et al. (2018) examined the changes in IR in 17 Indian states over 25 years. The authors showed that increasing wages in the 2000's led to more intensive capital, lessening the supervision cost among family labor.
However, IR is not solely explained by market imperfections. Only a small portion of the IR can be explained by the market imperfection when using a yield approach method. For example, Barrett et al. (2010) analyzed 17 villages in Madagascar in 2002, including multi-plot level information, and found IR. The authors note that imperfect markets contribute only one-third of the inverse relationship. The same is true in the study of Ali and Deininger (2015), which found an inverse relationship between farm size and shadow profit when analyzing rural households in several villages in Rwanda. A reversed relationship happens when family labor is valued based on village market rates. On the other hand, a comparison between rice farmers in China and India by Wang et al. (2015) found that land crop yield increases with machine use in both countries. However, there were contrasting results when analyzing the IR. The authors showed that China has a positive plot size-productivity relationship, while India still follows the conventional IR. China's results may be due to the development of the land rental market, family labor outmigration, and high-quality farmland construction policy.7 However, Assunção and Braido (2007) rejected the market imperfection explanation when plot-level data from India. The IR still exists even after controlling for unobserved household characteristics.
Land quality is another common alternative that most studies used to explain the farm-size productivity inverse relationship. Often, these variables are omitted due to the unavailability of plot-level quality measures. However, given the availability of more plot-level data, several studies included land quality indicators. Bhalla (1988) and Bhalla and Roy (1988) make use of extensive national farm-level data in India with land quality information from the Fertilizer and Demand Survey (FDS) 1975–1976. Results show a negative relationship between land quality and productivity. Bhalla and Roy (1988) added that if the land quality is considered, the IR weakens but still exists. However, Bhalla (1988) also pointed out that although there was an IR when land quality was included, the results may lead to large specification errors if it follows the conventional production function that negligently treats land quality.
Some studies that analyzed the IR also used panel data. For example, Carter (1984) analyzed panel data from Haryana (India) during 1969–1970. The author found that the intervillage soil difference partly explains the farm size-productivity relationship and that small farms are inefficient since they use more inputs than large farms. On the other hand, Lamb (2003) estimated the effect of land quality measures in the IR using panel data by International Crops Research in Semi-Arid and Tropics (ICRISAT), covering several crops. The author used random and fixed effects in estimating the relationship between land quality and profits. The study found that the land quality difference explains the IR between farm size and profits when applying random effects. Aside from soil quality, Assunção and Braido (2007) used longitudinal village-level studies by ICRISAT (1975–1985) and found that IR is also related to land value. However, Barrett et al. (2010) rejected soil quality as the main reason for the IR relationship. The authors show that even if the specific soil quality (e.g., soil carbon, nitrogen, and potassium content, soil pH, clay, silt, and sand shares) was accounted for, the estimation did not suffer from no omitted variable.
Measurement errors that would lead to statistical modeling issues are some of the new evidence challenging the existence of IR. For example, Lamb (2003) found that measurement errors may explain most of the inverse relationship, which is more pronounced when using fixed effects. The author also cautioned researchers in applying fixed-effects models to estimate the relationship between farm size and productivity. Barrett et al. (2010) found the same results when they examined the IR relationship in Madagascar using fixed effects to know if household and village market imperfections trigger the results. They found that imperfect markets only contribute to one-third of the IR. Other literature tries to control for farm attributes to remove the measurement error. For example, Assunção and Braido (2007) control for plot attributes, irrigation status, and land value shows no effect for large farms. In addition, Ali and Deininger (2015) controlled the time-variant and invariant characteristics of the plot (soil quality and unfavorable productivity shocks) in estimating IR. Foster and Rosenzweig (2017) found that area measurement error in Indian farms is small and does not explain the observed. However, most land size information depends on farmers self-reporting land area resulting in imprecise land measurement.
Recent studies use a global positioning system (GPS) to measure land area accurately to remove land area measurement error. GPS estimated land area is becoming popular since it can provide more accurate land measures, particularly in larger household surveys Carletto et al. (2013, 2015). The study by Carletto et al. (2013) shows that using GPS measured area indicated a stronger IR than using the self-reported area in Uganda. In addition, using the self-reported area measure shows that smaller farmers tend to over-report their land size while large farmers underestimate their land resulting in higher yields. Similarly, Desiere and Jolliffe (2018) addressed the measurement error issue using crop cut estimates in Ethiopia. It shows that IR exists using self-reported estimates and disappears when crop-cut area estimates. Carletto et al. (2013) found that overestimating or underestimating farm size drives the IR. Similar results were found by Dillon et al. (2019) when using three land measurement methods (farmer estimates, GPS, and compass-and-rope) that self-reported farm size leads to measurement error (overreporting for small farms and under-reporting for large farms). However, Bevis and Barrett (2019) rejected the measurement error that leads to IR. The author argued that crop yields along the perimeter might be higher than those in the interior due to less competition with nutrients and water, resulting in IR. In the Uganda study, the authors show that the IR disappears after controlling for the perimeter plots.
The characteristics of the household have an influence on the IR between farm size and productivity. For instance, Rada and Fuglie (2019) found that agricultural education among small farmers (0–5 ha) in Brazil positively impacts the total production factor by 16%. Carter (1984) argued that found the inverse relationship is not due to sampling bias resulting from farmer literacy but to a mode of production due to intensive use of inputs that generate higher income. Heterogeneity of skills also affects the inverse relationship. Assunção and Ghatak (2003) study shows heterogeneity regarding farmers' skills and imperfect credit market influenced the IR. The authors pointed out that skilled peasants are more likely to become farmers, which entails a higher opportunity cost to be a wage earner than an unskilled peasant.
Some studies attempt to show the existence of IR through an intrahousehold bargaining context. For example, Udry (1996) found that allocating land to women would reduce marginal productivity and suggested reallocating the land to men to increase output. Assunção and Braido (2007) also attempted to study the effect of intrahousehold resource allocation by analyzing managerial resources and crop mix in India. However, the results did not support that intrahousehold issues result in IR. Thus, based on the existing literature, there are mixed explanations for the existence of IR. Most studies assumed that only the household head is responsible for all farming decisions and represents all the household members. In the increasing number of studies about intrahousehold bargaining, each household member may have their preference which can affect the productivity of the household. Though few attempted to incorporate the intrahousehold issues in IR, most failed to explain the relationship. This study will attempt to revisit the IR debate by incorporating a joint farming decision-making strategy among married couples in India.
The study's theoretical framework shows the linkage between farm area and productivity, following Assunção and Braido (2007). I assume a Cobb-Douglas production function with household i is expressed as
where Yi is the yield; Ti is the total cultivated area; Li and Ki are the amount of labor and non-labor inputs used; Ai represents observable household and land characteristics associated with different factors like village and caste; and εi is the error term. It is also assumed that there is constant returns to scale and a competitive market. For the household to know the optimal amount of labor and non-labor inputs, one should solve the profit maximization problem given as
where yi = pYi is the value of the output; p, w, and r are prices of Yi, Li, and Ki , respectively; ki = rKi is the value of the non-labor inputs; li = wLi is the value of the labor inputs; and ai is a price adjusted technological term (. After solving the maximization problem, the optimal inputs for labor and non-labor inputs would be:
In this analysis, Assunção and Braido (2007) further assume that the yield should be independent of the area of the farm, following the assumption that ai and error term εi and can be written as
where
The study uses the 2016 Rice Monitoring Survey conducted by IRRI. A rice-producing household is defined as a household that produced rice during the past 12 months. The study uses the 2016 Rice Monitoring Survey conducted by IRRI. The survey targeted the rural population of eastern India by randomly selecting rural areas based on the 2011 Census of India. Four states in the eastern part of India are considered for this study: eastern Uttar Pradesh, Odisha, Bihar, and West Bengal. A multi-stage sampling technique was adopted in selecting the respondents. In the first stage, the number of districts was randomly selected in each state using the Census of 2011.8 On the other hand, the second stage involves determining the number of villages based on the proportion of each state's total rice area, keeping the total number of villages at 720. Among the selected villages, household samples are randomly selected using the household census village data. A total of 101 districts and 1,931 rice-producing households are included in the survey (Table 1).
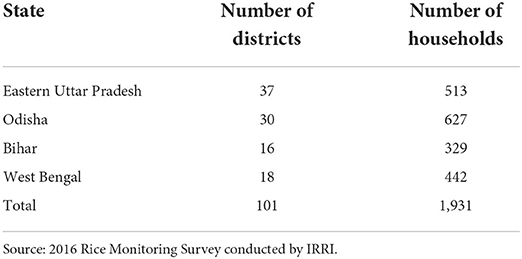
Table 1. Sample districts and smallholder households in eastern India, 2016.
A structured questionnaire was used to interview the household's primary male and female decision-makers. Information regarding household and rice production was collected from male respondents, while information about livestock and household assets were collected from the female respondents. The survey employed male and female enumerators to elicit unbiased responses in the interview process. The male enumerator interviewed the male respondents, while the female enumerator interviewed the female respondents. The study focused on information regarding the 2015 wet season, the primary rice-growing season in eastern India. A computer-assisted personalized interview (CAPI) program, Surveybe, was used to collect the data. To capture the joint farm decision-making, the study considered only married couples and simultaneously identified the male and female decision-makers. Choosing the married couple as a major criterion is necessary since it is common for Indian households to have an extended family living in one house. Farmers and spouses were queried about seven farm production-related decisions. For the current study, we only considered joint farm decision-making regarding the selection of rice seed varieties. Thus, the joint farming decision-making takes a value of 1 if the husband and wife made the decision jointly and 0 otherwise.
Table 2A provides the summary statistics of the variables used in the analysis. Due to space and brevity, the definition of the variables is presented in Table 2B. The sample households can be categorized based on the rice productivity: low-performing (yield <1,297.28 kg/ha); mid-performing farms (yields between 1,297.28 to 1,662.09 kg/ha); and high-performing farms (yield >1,662.09 kg/ha). The table shows that more than half of the sample households are high-performing groups, followed by low performing (40%) and mid-performing (8%). Rice yield in the sample has an average of 1,788 kg/ha, which is lower than the national average of 3,700 kg/ha [International Rice Research Institute (IRRI), 2019]. The dominance of the marginal farms can be observed in the average cultivated area of the whole sample, which reached 0.41 ha. Regarding land ownership, most of the cultivated rice areas in the sample have ownership land titles.
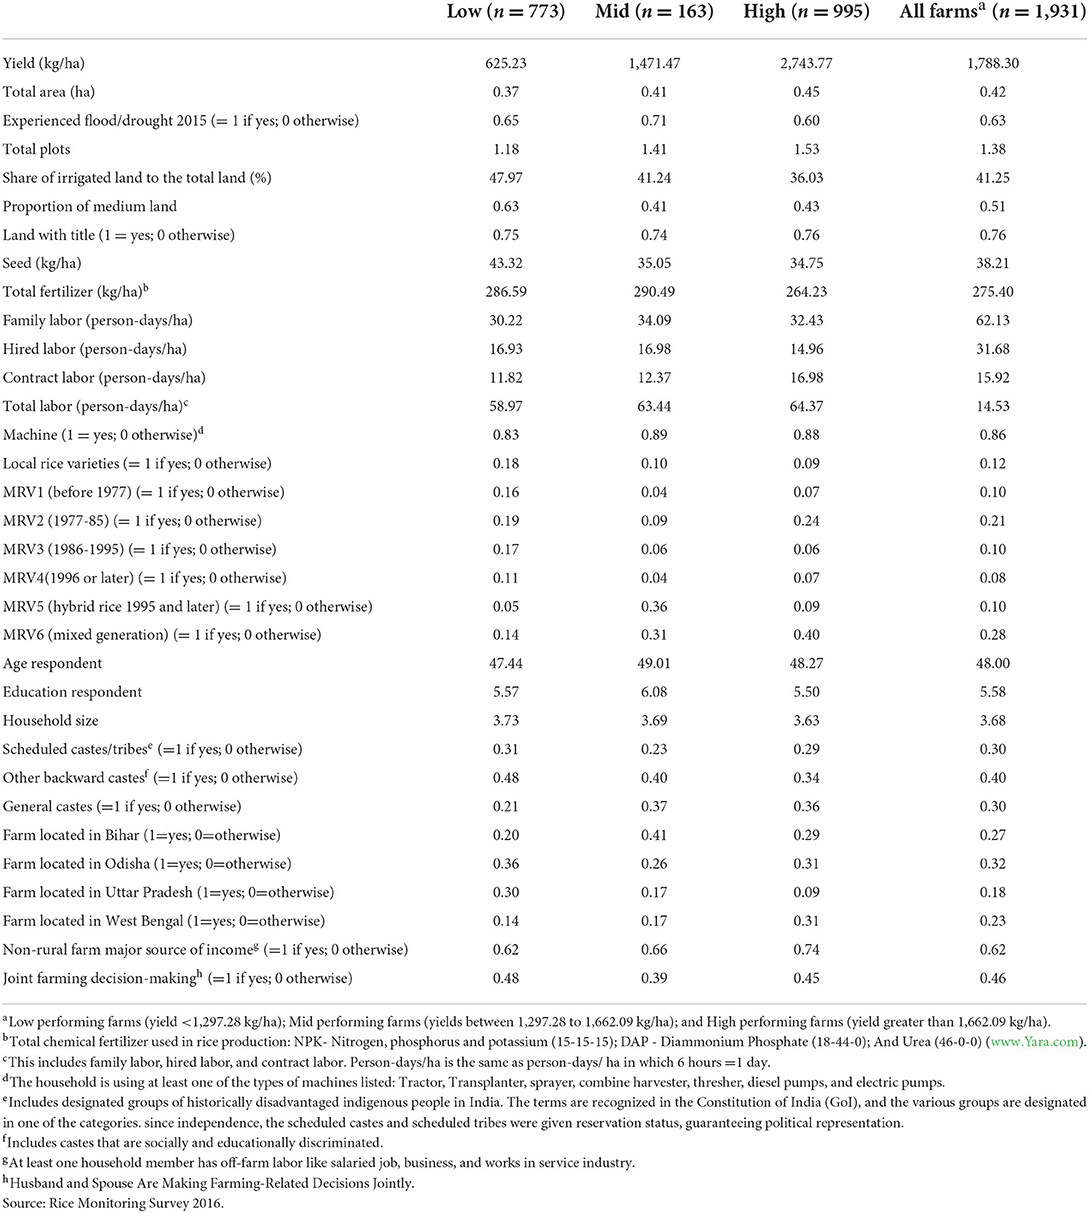
Table 2A. Summary statistics of the variables used in the estimation, Eastern India, 2016.
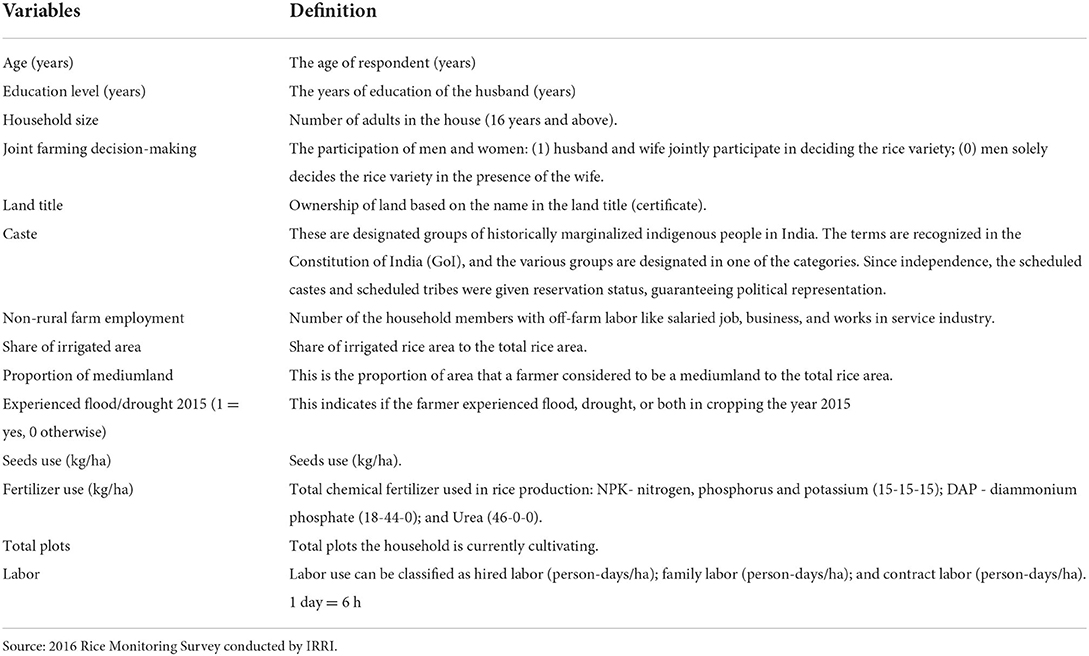
Table 2B. Variable definition used in the analysis, eastern India, 2016.
Rice is mainly planted in nearly half of the households' medium part of the land. Among the farm groups, around 62% of these low-performing farms used most of this medium land compared to the other groups. In terms of irrigation, more than 40% of the cultivated rice area is irrigated through supplemental irrigation (such as deep or shallow tube well, canals, and ponds). The low and mid-performing groups have a high percentage of irrigated areas compared to high performing group. This suggests that many farmers still rely on rainfall for water sources. However, rainfed areas are prone to water-related problems like floods and drought, which can be one reason for the slow growth in productivity in the area (Pandey et al., 2007; Dar et al., 2013). In the study done by Gumma et al. (2011), it was estimated that an average of 8–40% and 17–22% of the total rice area in eastern India are prone to flood and drought, respectively. Table 2A shows that 63% of the rice producers in the sample were affected by flood and drought, with mid-performers affected the most.
The major inputs used in rice production are seeds, labor, and fertilizer (NPK, DAP, Urea). The table shows that low-performing farms apply the highest amount of seeds, reaching 43.32 kg/ha. The use of fertilizer is highest in the mid-performing group, which reached 290.49 kg/ha. On the other hand, the labor used in rice production comprises three types: family, hired, and contract labor. Family labor provided the highest day worked on the farm (32 person-day/ha) and followed by contract labor (17 person-day/ha) and hired labor (15 person-day/ha). It also shows that the participation of family labor is constant across the group. Among the farm groups, low-performing groups required the lowest labor in rice production (60 person-day/ ha) compared to the two farm groups.
Table 2A also reveals that nearly half of rice producers use MRV6 (mixed generation) and MRV2 (1977–1985). The farm group shows that almost 71% of low-performing farms still use old rice varieties9 and local rice varieties. Using these local varieties may explain the low productivity of the group. The study of Bagchi and Emerick-Bool (2012) found that local varieties in West Bengal generate a lower yield than modern varieties by 1.63 kg/ha. It also shows high performing groups preferred the MRV2 (rice varieties released between 1977 and 1985) and MRV6 (mixed). The hybrid rice varieties (MRV5) and MRV6 (mixed) are preferred in the mid-performing group. According to Behura et al. (2012), combining different varieties is one of the practices in flood/drought-prone areas to ensure production. This is not surprising since a high percentage of farmers experienced flood/drought during 2015.
It shows that the average operator is 48 years old with an average of 6 years of education in household characteristics. There is also a narrowing difference in education between husband and wife, which increases as productivity increases. However, the age difference is constant across farm groups. Most farmers belong to other backward castes (40%), followed by general caste and scheduled tribe/ caste (30%). Among the farm group, low and mid groups constitute primarily Scheduled tribes/Scheduled castes, while the high-performing group is composed mainly of general castes. In terms of farm location, most of the rice producers are found in Odisha (17%), followed by Bihar (44%), West Bengal (42%), and Uttar Pradesh (39%). More than 60% of the household has at least one member with non-farm employment in terms of sources of income. It shows that high-performing groups have the highest percentage of households with non-rural farm employment. Finally, in deciding on rice varieties, Table 2A shows that nearly half of low and high-performing groups jointly participate in farming decision-making in determining the rice variety.
Following a Cobb-Douglas production function, the farm size-productivity relationship is usually tested using an ordinary linear regression (OLS):
where i is the ith household; Y is the yield; L is the cultivated land; β is the intercept, and ε is the error term with constant variance and mean zero . Equation (6) is an example of a naïve regression that only includes one independent variable. To know if there is a correlation between the cultivated area and productivity, we can test the null hypothesis H0:δ1 = 0 that there is no relationship against the alternative relationship in which there exists an inverse relationship H1:δ2 < 0. However, Equation (6) estimates likely to suffer from omitted variables. Thus, we need to estimate a less restrictive model by adding potential explanatory variables. Equation 7 shows an expanded version of Equation (6) where household variables (e.g., age and years of the respondent, family size, non-rural farm income), joint farming decision-making (selecting rice variety), and farm variables (e.g., occurrence stress, percentage of irrigated land, the quantity of seeds, the quantity of fertilizer (NPK), total labor, and rice varieties) were added.
where β2 represents all associations between productivity and vector of household and farm variables; and νi an error term. If there is an existence of IR, then we fail to accept the null hypothesis H0:δ2 = 0 in favor of the alternative relationship in which there exists an inverse relationship H2:δ2 < 0.
Following Gaurav and Mishra (2015) and Barrett et al. (2010), including additional control variables would help me establish the inverse productivity relationship in rice production based on major explanations discussed in the literature, such as household-specific market imperfections and soil quality. The household-specific market imperfections can be one of the reasons for the existence of IR. In this case, shadow prices of inputs (such as land and labor) and outputs often create heterogeneity between households. According to Feder (1985), farm area is correlated to unobserved household-specific shadow prices, which may cause IR. The household-specific variables used are dummies for state and caste where the household belongs. Thus, accounting for the unobserved household-specific market imperfections, the specification becomes:
where λ3 represents state and caste controls and ωi is an error term. If the household-specific failure is the reason for an IR, controlling for the household-specific effect (λ3) would lead to failure to reject H0:γ3 = 0. Soil quality is another standard variable omitted due to data unavailability but is considered one of the major reasons for IR existence. However, Barrett et al. (2010) pointed out that soil quality affects farm size and yield differently, resulting in biased estimates if ignored. To account for this issue, I included the variable proportion of medium land,10 which can be a proxy for topography. The specification is given as follows:
where ϕ3 is coefficients for soil quality and ηi is the error term.
Table 3 shows the results of the four specifications for testing the relationship between farm size and rice productivity using rice yields (kg/ha): (1) naïve; (2) farm and household factors fixed; (3) household fixed effects; and (4) soil quality fixed effects. Results of the naïve specification (Model 1, Table 3) show a negative but insignificant relationship between cultivated rice area and rice productivity. The estimate suggests that doubling the cultivated rice area decreases rice yield by 3%. However, the above estimate only predicts a 0.1% variation in rice yields, and the estimates may be more likely to suffer from omitted variables bias. Model 2 (Table 3) includes farm and household characteristics variables in the empirical estimation. The coefficient of cultivated rice area (farm size) is negative and statistically significant at the 1% level of significance. The estimate suggests that doubling the cultivated rice area decreases rice yield by 22%. Notice that the estimates, in absolute terms, increased and became significant in Model 2 than in Model 1 (Table 3). Our estimate between farm size and yields is higher (22% vs. 10%) than those obtained by Desiere and Jolliffe (2018).
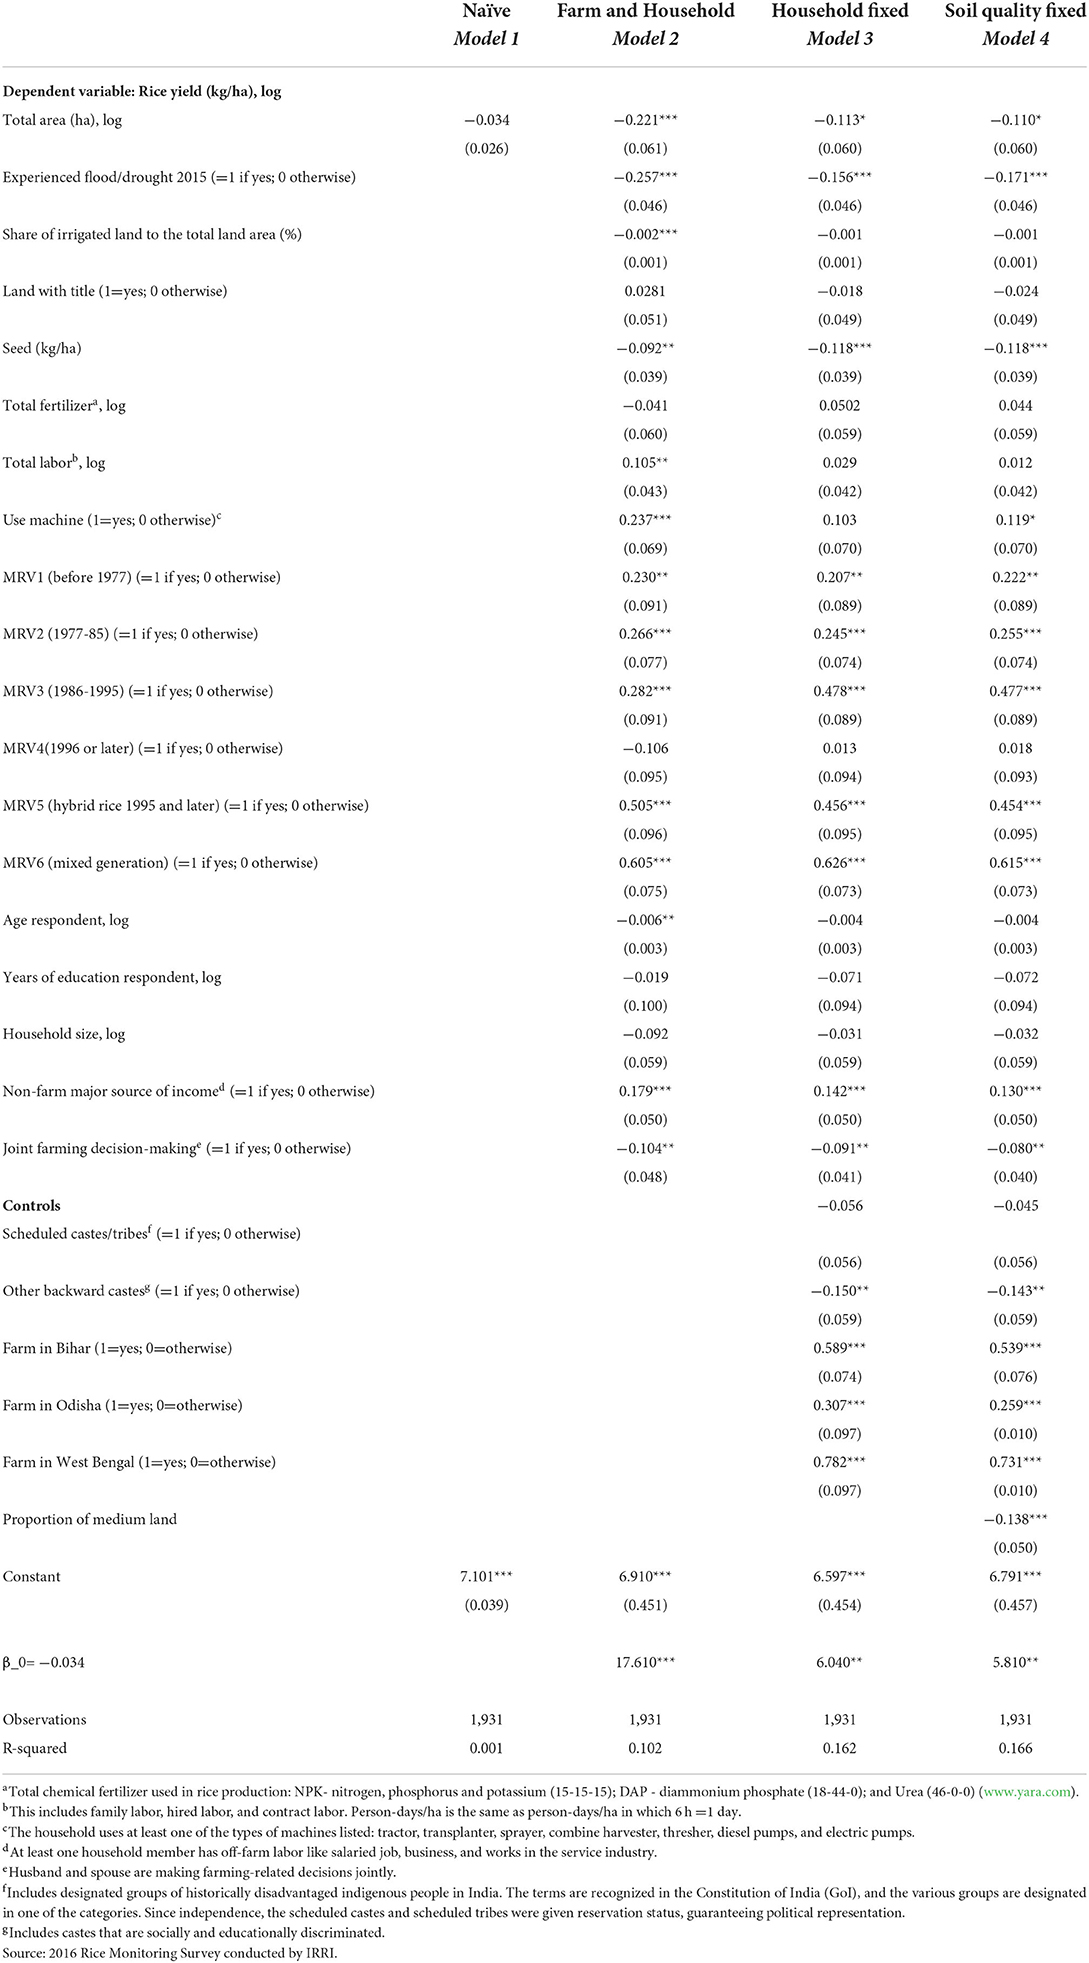
Table 3. Rice productivity estimation with household-specific and soil quality control, eastern India, 2016.
Additional variables in Model 2 (Table 3) show that major inputs like total labor, use of machines, and modern rice varieties, compared to local rice varieties, increase rice yields in the sampled four states of India. For instance, Model 2 shows doubling labor use increases rice productivity by 10 percent. On the other hand, the coefficient of rice seeds is negative and significant at the 5% significance level. This finding is consistent with Mishra et al. (2015), who found a negative and significant relationship between the quantity of seeds and rice output in Bangladesh. However, the above finding contrasts with Mishra et al. (2018) and Mariano et al. (2011), who found a positive and significant relationship between the quantity of seeds and rice output. In sum, the above findings reveal that rice farmers in the four states can increase rice productivity by lowering the amount of rice seeds and raising labor and machinery usage on their farms. Regarding the household variables, Model 2 (Table 3) shows that having non-farm employment income increases rice yields. Thus, income from non-farm sources could help smallholder families to relax their credit constraints.11 Additional income from non-farm employment could be used for farm investments (buying land machinery etc.), additional inputs, quality inputs, and new technology, thus increasing rice productivity. Our finding is consistent with Evans and Ngau (1991), who found a positive relationship between off-farm participation and agricultural investment.
The coefficient of joint farming decision-making is negative and statistically significant at the 1% level of significance. The coefficient is also significantly negative in Models 3 and 4. Result suggests that farming decisions made jointly in married farm households negatively affect rice yields. A plausible explanation could be untimely, miscommunication, and missing information when making the final decision. For example, decisions may change if the conditions on the ground change, and the spouse cannot get in touch with the farmer—thus using her capabilities to pivot. Another reason, as pointed out by Acosta et al. (2020), is the perception of joint decision-making in farming.12 The authors test gender differences in perceptions of joint decision-making in farming in Uganda. Decisions like ‘what and where to plant' and ‘to sell land' were more frequently perceived as joint by women than men. Indeed, Mottaleb et al. (2017) argue that women like the intrinsic qualities of rice varieties (e.g., taste, cooking qualities, and grain shape) more than those with the highest yield. Our findings underscore the importance of rice quality when farmers choose rice variety, especially during the joint-decision-making process.
Following Barrett et al. (2010) and Gaurav and Mishra (2015), two common explanations for IR are household-specific market imperfections and soil quality. Our study addresses market imperfections by including household-specific fixed in Model 3. Model 3 of Table 3 shows that IR still holds, and the coefficient of farm size is negative and statistically significant at the 10 percent level of significance. Testing the joint household-specific controls shows significant (p = 0.000 at the 1% level of significance), thus rejecting the null hypothesis (H0:λ3 = 0). The magnitude of the farm area coefficient, compared to Model 2, also decreased by almost half. Our finding is consistent with Barrett et al. (2010), showing that controlling for household-specific weakens the explanation of the existence of IR. Model 4 (Table 3) shows the results when soil quality control when included in the estimation. Again, the coefficient of farm size is negative and statistically significant at the 10 percent level of significance. Testing the joint soil quality specific controls shows significant (p = 0.000 at the 1% level of significance), thus rejecting the null hypothesis (H0:λ4 = 0). Also, the magnitude of the coefficient, in absolute terms, is similar to Model 3. The inclusion of soil quality controls decreased the magnitude of the coefficient of farm area (cultivated rice area) by nearly half as compared to Model 2. Our finding is consistent with Bhalla and Roy (1988) regarding the weakening of the relationship when controlling for land quality. The authors argued that ignoring the land quality may result in specification errors, leading to an artificial impact on productivity.
Overall, the inputs show almost identical signs and significance in the three models (Model 2, 3, and 4) in Table 3. The occurrence of flood and drought has a negative and significant impact on rice productivity in the three models. However, the magnitude of the coefficient (in absolute terms) decreases once more controls are included in the empirical model. The adverse effect of flood and drought on rice yields is consistent with Mishra et al.'s (2015) findings, who found that abiotic stresses (drought and flood) reduced rice production among rice farmers in Bangladesh. Thus, controlling for soil quality seems to emphasize the effect of flood and drought. In terms of caste, households belonging to other backward castes (OBC) have a negative impact on rice yield when added to the model. This finding is not surprising because OBC's farms are usually located in poor water conditions, prone to flooding, lower land fertility, and low productivity. Additionally, farmers from socially disadvantaged castes like OBCs, have a lower probability of accessing farming information, public extension services, and inferior resource endowments. Our finding is consistent with Dar et al. (2013).
Smallholders are one of the major players in the Indian rice sector. With the continuously increasing number of small and fragmented land, inevitably, this sector will remain. However, with the slow growth in rice production for the past decades in India, understanding the relationship between smallholders and rice productivity is essential in identifying the major constraints. The existence of IR in farm size and productivity is a common justification for implementing land reform programs that promote efficiency and equity among poor farmers. Hence, this paper analyzed the farm size and productivity relationship among rice farmers in eastern India. Specifically, the study focused on how intrahousehold joint farming decision-making impacted rice productivity. The study used the 2016 Rice Monitoring Survey, a nationally representative household-level survey by the International Rice Research Institute (IRRI). The current study showed two significant findings. First, the study found an inverse relationship (IR) between farm size and rice productivity, and the IR weakens when controlling household effects and soil quality. Second, the study provided evidence of joint farming decision-making on rice productivity. The study found that joint farming decision-making had an adverse impact on rice productivity, at least in the sampled rice farms in eastern Indian states of Uttar Pradesh, Bihar, Odisha, and West Bengal.
There are several implications of this study. First, the existence of IR among the smallholder does not warrant land reform programs. Instead, policymakers should focus on policies addressing the causes of structural land fragmentation, including policies for enhancing the rural infrastructures, modifying inheritance laws, and reviewing land reform enactments. Secondly, policymakers need to provide greater support to small farms. Policymakers need to focus efforts on improving crop production, yield, farm investment, and extension services. Thirdly, since the joint farming decision-making in choosing the rice variety penalizes rice productivity, enhancing the couple's knowledge regarding rice varieties should be a priority for policymakers, researchers, and extension agents. Broadcasting information about rice variety characteristics (planting duration, pest resistance, and ecosystem) and consumer traits (aroma, grain length, and taste) should be in order. The couples could help develop new rice varieties by providing rice breeders information on their preferred rice traits through Participatory Varietal Selection (PVS). A PVS study by Manzanilla et al. (2014) regarding submergence tolerant varieties in Southeast Asia shows that female farmers are as knowledgeable as male farmers in evaluating the lines/variety visible characteristics.
Fourth, developing a robust private farm machinery market with private entrepreneurs can support the demand and supply of farm machinery. In fact, rice farming at a smaller scale could be achieved by hiring machinery services. Fifth, to support marginalized and socially disadvantaged farmers government can engage in information and technology diffusion and farming practices through extension agents and other agricultural advisory services. To this end, the government can use Krishi Vigyan Kendra or Agricultural Science Center) to provide agricultural extension services to reach not only socially disadvantaged farmers but smallholders in rural India.
Lastly, findings underscore the non-farm sector's importance in increasing rice yields. As a result, government policies that influence general economic conditions profoundly impact smallholder households. Policies aimed at increasing off-farm job opportunities should be enacted carefully. Off-farm employment opportunities require higher human capital. Policymakers can facilitate access to education and job opportunities is of paramount importance in determining off-farm employment and the transformation of smallholder agriculture.
Publicly available datasets were analyzed in this study. This data can be found at: https://doi.org/10.7910/DVN/0VPRGD.
Conceptualization, statistical data analysis methodology and investigation, and writing—original draft preparation: MM. Writing—review and editing, supervision, and project administration: AM. Both authors contributed to the article and approved the submitted version.
We would like to thank all the farmers who agreed to be interviewed in the 2016 Rice Monitoring Survey conducted by IRRI.
The authors declare that the research was conducted in the absence of any commercial or financial relationships that could be construed as a potential conflict of interest.
All claims expressed in this article are solely those of the authors and do not necessarily represent those of their affiliated organizations, or those of the publisher, the editors and the reviewers. Any product that may be evaluated in this article, or claim that may be made by its manufacturer, is not guaranteed or endorsed by the publisher.
1. ^Smallholder less than 1ha [Government of India (GOI), 2020].
2. ^We use 2015 rice statistics here for two reasons. First, these are most recent statistics available to us for the eastern India region. Secondly, we use the 2016 Rice Monitoring Survey conducted by IRRI to test our hypothesis. Thus, we wanted to present rice statistics that was closer to the data collection period.
3. ^Enacted as the National Rural Employment Guarantee Act of India, 2005 is a public policy in India that pays people to seek employment. The wage rate is higher than the daily wages of agricultural workers [Ministry of Rural Development (MORD), Government of India, 2019].
4. ^The average farm size in eastern India decreased from 2.03 ha in 1971 to 1.15 in 2010 [Government of India (GoI), 2016].
5. ^Most studies examining intra-household decision-making are from sub-Saharan Africa (SSA) and Latin America.
6. ^These are technologies that can be divided and distributed at no extra cost (Pingali et al., 2019).
7. ^This policy encourages farmers to increase operational farm sizes through development of public infrastructure (e.g. irrigation facilities and roads).
8. ^This data set contains information about all the districts, villages, towns, and cities in urban and rural India.
9. ^Old varieties as rice varieties that were released 1995 and earlier which excludes local varieties.
10. ^Rice farms in India can be categorized as upland, medium land, and lowland. The lowlands are located in the lower top sequence of the fields while uplands are located in the upper part of the field with less moisture availability and poor soil quality (sandy soils with less water retention capacity). Lastly, medium land is intermediate between lowland and upland (Gauchan et al., 2012).
11. ^Rizov et al. (2001) note that in transitional economies off-farm income may be more important than farm assets in reducing capital constraints.
12. ^Alwang et al. (2017) found that men claimed sole responsibilities over the decisions while the spouses claimed the decisions were made jointly.
Acosta, M., Wessel, M., Bommel, S., Ampaire, E., Twyman, J., Jassogne, L., et al. (2020). What does it mean to make a ‘joint' decision? Unpacking intra-household decision making in agriculture: implications for policy and practice. J. Dev. Stud. 56, 1210–1229 doi: 10.1080/00220388.2019.1650169
Ali, D. A., and Deininger, K. (2015). Is there a farm-size productivity relationship in African agriculture? Evidence from Rwanda. Land Econ. 91, 317–343. doi: 10.3368/le.91.2.317
Alwang, J., Larochelle, C., and Barrera, V. (2017). Farm decision making and gender: Results from a randomized experiment in ecuador. World Dev. 97, 117–129. doi: 10.1016/j.worlddev.2016.11.015
Aregu, L., Puskur, R., and Bishop-Sambrook, C. (2011). The Role of Gender in Crop Value Chains in Ethiopia. A Presentation Was Prepared for the Gender and Market Oriented Agriculture (AgriGender 2011) Workshop, Addis Ababa, Ethiopia, January 31st January-2nd February 2011. Nairobi: ILRI.
Assunção, J. J., and Braido, L. H. (2007). Testing household-specific explanations for the inverse productivity relationship. Am. J. Agric. Econ. 89, 980–990. doi: 10.1111/j.1467-8276.2007.01032.x
Assunção, J. J., and Ghatak, M. (2003). Can unobserved heterogeneity in farmer ability explain the inverse relationship between farm size and productivity? Econ. Lett. 80, 189–194. doi: 10.1016/S0165-1765(03)00091-0
Bagchi, B., and Emerick-Bool, M. R. (2012). “Patterns of adoption of improved rice varieties and farm-level impacts in stress-prone rainfed areas in West Bengal India,” in: Patterns of Adoption of Improved Rice Varieties and Farm-Level Impacts in Stress-Prone Rainfed Areas in South Asia, eds S. Pandey, D. Gauchan, M. L. Malabayabas, M. R. Emerick-Bool, B. Hardy (Los Baños: International Rice Research Institute).
Barah, B. C., and Pandey, S. (2005). Rainfed rice production systems in Eastern India: An on-farm diagnosis and policy alternatives. Ind. J. Agri. Econ. 60:110. doi: 10.22004/ag.econ.204391
Barrett, C. B. (1996). On price risk and the inverse farm size-productivity relationship. J. Dev. Econ. 51, 193–215. doi: 10.1016/S0304-3878(96)00412-9
Barrett, C. B., Bellemare, M. F., and Hou, J. Y. (2010). Reconsidering conventional explanations of the inverse productivity–size relationship. World Dev. 38, 88–97. doi: 10.1016/j.worlddev.2009.06.002
Behura, D., Naik, D., Samal, P., Koshta, A., and Malabayabas, M. (2012). “Patterns of adoption of improved rice varieties and farm-level impacts in stress-prone rainfed areas in Odisha and Chhattisgarh India,” in: Patterns of Adoption of Improved Rice Varieties and Farm-Level Impacts in Stress-Prone Rainfed Areas in South Asia, eds S. Pandey, D. Gauchan, M. L. Malabayabas, M. R. Emerick-Bool, and B. Hardy ( Los Baños: International Rice Research Institute).
Bevis, L., and Barrett, C. (2019). Close to the edge: High productivity at plot peripheries and the inverse size-productivity relationship. J. Dev. Econ. 143:102377. doi: 10.1016/j.jdeveco.2019.102377
Bhalla, S. S. (1979). Farm size productivity and technical change in indian agriculture. Agr. Struct. Product. Dev. Count. 1979:141.
Bhalla, S. S. (1988). Does land quality matter?: Theory and measurement. J. Dev. Econ. 29, 45–62. doi: 10.1016/0304-3878(88)90070-3
Bhalla, S. S., and Roy, P. (1988). Mis-specification in farm productivity analysis: the role of land quality. Oxf. Econ. Pap. 40, 55–73. doi: 10.1093/oxfordjournals.oep.a041846
Bhattacharya, N., and Saini, G. R. (1972). Farm size and productivity: A fresh look. Econ. Polit. Week. 1972, A63–A72.
Bhattarai, M., Ravi, K., Sandhya, S., and Bantilan, C. (2014). Whether MGNREGS has Affected Agricultural Wage Rate in Andhra Pradesh? A Panel Modeling Across 23 Districts From 2000 to2011. Discussion Paper Series 27. International Crops Research Institute for the Semi-Arid and Tropics (ICRISAT).
Birthal, P. S., Chand, R., Joshi, P. K., Saxena, R., Rajkhowa, P., Khan, M., et al. (2016). Formal versus informal: Efficiency, inclusiveness, and financing of dairy value chains in India. Intl. Food Policy Res. Inst. 1513:e5957. doi: 10.1007/978-981-10-5957-5_4
Bourdillon, M. F., Hebinck, P. A. U. L., Hoddinott, J. O. H. N., Kinsey, B., Marondo, J., Mudege, N., et al. (2007). “Assessing the impact of high-yield varieties of maize in resettlement areas of Zimbabwe,” in Agricultural Research, Livelihoods, and Poverty Studies of Economic and Social Impacts in Six countries, eds M. Adato and R. Meinzen-Dick (Baltimore, MD: Johns Hopkins University Press).
Carletto, C., Gourlay, S., and Winters, P. (2015). From guesstimates to GPStimates: Land area measurement and implications for agricultural analysis. J. Afr. Econ. 24, 593–628. doi: 10.1093/jae/ejv011
Carletto, C., Savastano, S., and Zezza, A. (2013). Fact or artifact: The impact of measurement errors on the farm size–productivity relationship. J. Dev. Econ. 103, 254–261. doi: 10.1016/j.jdeveco.2013.03.004
Carter, M. R. (1984). Identification of the inverse relationship between farm size and productivity: an empirical analysis of peasant agricultural production. Oxf. Econ. Pap. 36, 131–145. doi: 10.1093/oxfordjournals.oep.a041621
Chakravorty, S., Chandrasekhar, S., and Naraparaju, K. (2016). Income Generation and Inequality in India's Agricultural Sector: The Consequences of Land Fragmentation. Mumbai: Indira Gandhi Institute of Development Research (IGIDR).
Damisa, M. A., and Yohanna, M. (2007). Role of rural women in farm management decision. World J. Agri. Sci. 3, 543–546. doi: 10.3923/tasr.2007.241.245
Dar, M. H., De Janvry, A., Emerick, K., Raitzer, D., and Sadoulet, E. (2013). Flood-tolerant rice reduces yield variability and raises expected yield, differentially benefitting socially disadvantaged groups. Sci. Rep. 3:3315. doi: 10.1038/srep03315
Deininger, K., Jin, S., Liu, Y., and Singh, S. K. (2018). Can labor-market imperfections explain changes in the inverse farm size–productivity relationship? Longitudinal evidence from rural India. Land Econ. 94, 239–258 doi: 10.3368/le.94.2.239
Deininger, K., Monchuk, D., Nagarajan, H. K., and Singh, S. K. (2017). Does land fragmentation increase the cost of cultivation? Evidence from India. J. Dev. Stud. 53, 82–98. doi: 10.1080/00220388.2016.1166210
Deolalikar, A. B. (1981). The inverse relationship between productivity and farm size: a test using regional data from India. Am. J. Agric. Econ. 63, 275–279. doi: 10.2307/1239565
Desiere, S., and Jolliffe, D. (2018). Land productivity and plot size: Is measurement error driving the inverse relationship?. J. Dev. Econ. 130, 84–98. doi: 10.1596/28786
Dillon, A., Gourlay, S., McGee, K., and Oseni, G. (2019). Land measurement bias and its empirical implications: Evidence from a validation exercise. Econ. Dev. Cult. Change 67, 595–624. doi: 10.1086/698309
Evans, H., and Ngau, P. (1991). Rural-urban relations, household income diversification and agricultural productivity. Dev. Change 22, 519–545. doi: 10.1111/j.1467-7660.1991.tb00424.x
Feder, G. (1985). The relation between farm size and farm productivity: The role of family labor, supervision and credit constraints. J. Dev. Econ. 18, 297–313. doi: 10.1016/0304-3878(85)90059-8
Foster, A., and Rosenzweig, M. R. (2017). Are there too many farms in the world? Labor-market transaction costs, machine capacities and optimal farm size. Cambridge, MA: NBER Working Paper 23909.
Gauchan, D., Panta, H. K., Gautam, S., and Nepal, M. B. (2012). “Patterns of adoption of improved rice varieties and farm-level impacts in stress-prone rainfed areas in Nepal,” in Patterns of Adoption of Improved Rice Varieties and Farm-Level Impacts in Stress-Prone Rainfed Areas in South Asia, eds S. Pandey, D. Gauchan, M. L. Malabayabas, M. R. Emerick-Bool, and B. Hardy (Los Baños: International Rice Research Institute), 318.
Gaurav, S., and Mishra, S. (2015). Farm size and returns to cultivation in India: Revisiting an old debate. Oxford Dev. Stud. 43, 165–193. doi: 10.1080/13600818.2014.982081
Ghose, A. K. (1979). Farm size and land productivity in Indian agriculture: A reappraisal. J. Dev. Stud. 16, 27–49. doi: 10.1080/00220387908421742
Gollin, D. (2019). Farm size and productivity: Lessons from recent literature. IFAD Res. Series 34, 1–35.
Government of India (GoI) (2016). All India Report on Agricultural Census 2015-16. Available online at: http://agcensus.nic.in/document/agcen1516/ac_1516_report_final-220221.pdf (accessed March 30, 2021).
Government of India (GOI) (2020). Agricultural Statistics at a Glance 2020. Directorate of Economics and Statistics, Department of Agriculture and Cooperation and Farmers Welfare, Ministry of Agriculture, New Delhi.
Gumma, M. K., Nelson, A., Thenkabail, P. S., and Singh, A. N. (2011). Mapping rice areas of South Asia using MODIS multitemporal data. J. Appl. Remote Sens. 5:053547. doi: 10.1117/1.3619838
Hazell, P., Poulton, C., Wiggins, S., and Dorward, A. (2010). The future of small farms: trajectories and policy priorities. World Dev. 38, 1349–1361. doi: 10.1016/j.worlddev.2009.06.012
Helfand, S. M., and Taylor, M. P. (2021). The inverse relationship between farm size and productivity: Refocusing the debate. Food Policy 99:101977. doi: 10.1016/j.foodpol.2020.101977
Heltberg, R. (1998). Rural market imperfections and the farm size—productivity relationship: Evidence from Pakistan. World Dev. 26, 1807–1826. doi: 10.1016/S0305-750X(98)00084-9
Ibrahim, H. I., Saingbe, N. D., and Abdulkadir, Z. A. (2012). Gender participation in economic activities and decision making in Keffi Area of Nigeria. Asian J. Agri. Rural Dev. Econ. Finan. Rev. 2, 10−16. doi: 10.22004/ag.econ.197936
IFAD (2013). Smallholders, Food Security and the Environment. Rome: International Fund for Agricultural Development.
International Rice Research Institute (IRRI) (2019). World Rice Statistics. Available online at: http://ricestat.irri.org:8080/wrsv3/entrypoint.htm (accessed February, 2019).
Khush, G. S. (1999). Green Revolution: preparing for the 21stcentury. Genome 42, 646–655. doi: 10.1139/g99-044
Khusro, A. M. (1964). Returns to scale in Indian agriculture. Indian J. Agric. Econ. 19, 51–80. doi: 10.22004/ag.econ.231744
Lamb, R. L. (2003). Inverse productivity: Land quality, labor markets, and measurement error. J. Dev. Econ. 71, 71–95. doi: 10.1016/S0304-3878(02)00134-7
Manzanilla, D., Paris, T., Tatlonghari, G., Tobias, A., Chi, T. T., Phuong, N. T., et al. (2014). Social and gender perspectives in rice breeding for submergence tolerance in Southeast Asia. Experi. Agri. 50, 191–215. doi: 10.1017/S0014479713000409
Mariano, M. J., Villano, R., and Fleming, E. (2011). Technical efficiency of rice farms in different agroclimatic zones in the Philippines: An application of a stochastic metafrontier model. Asian Econ. J. 25, 245–269. doi: 10.1111/j.1467-8381.2011.02060.x
Ministry of Rural Development (MORD) Government of India. (2019). The Mahatma Gandhi National Employment Guarantee Act 2005. Available online at: https://nrega.nic.in/netnrega/mgnrega_new/Nrega_home.aspx
Mishra, A. K., Kumar, A., Joshi, P. K., Dsouza, A., and Tripathi, G. (2018). How can organic rice be a boon to smallholders? Evidence from contract farming in India. Food Policy 75, 147–157. doi: 10.1016/j.foodpol.2018.01.007
Mishra, A. K., Mottaleb, K. A., Khanal, A. R., and Mohanty, S. (2015). Abiotic stress and its impact on production efficiency: The case of rice farming in Bangladesh. Agric. Ecosyst. Environ. 199, 146–153. doi: 10.1016/j.agee.2014.09.006
Mottaleb, K. M., Rahut, D. B., and Mishra, A. K. (2017). Modeling rice graintype preferences in Bangladesh. Br. Food J. 119, 2049–2061 doi: 10.1108/BFJ-10-2016-0485
Niroula, G. S., and Thapa, G. B. (2005). Impacts and causes of land fragmentation, and lessons learned from land consolidation in South Asia. Land Use Policy 22, 358–372. doi: 10.1016/j.landusepol.2004.10.001
Orr, A., Homann Kee-Tui, S., Tsusaka, T., Msere, H., Dube, T., and Senda, T. (2016). Are there ‘women's crops'? A new tool for gender and agriculture. Dev. Pract. 26, 984–997. doi: 10.1080/09614524.2016.1226264
Otsuka, K., Liu, Y., and Yamauchi, F. (2016). Growing advantage of large farms in Asia and its implications for global food security. Global Food Security 11, 5–10. doi: 10.1016/j.gfs.2016.03.001
Pandey, S., Bhandari, H., and Hardy, B. (2007). Economic Costs of Drought and Rice Farmers' Coping Mechanisms: A Cross-Country Comparative Analysis. Los Baños: International Rice Research Institute.
Paris, T., Rola-Rubzen, M. F., Luis, J., Chi, T., Wongsamun, C., and Villanueva, D. (2010). Interrelationship Between Labor Outmigration, Livelihood, Rice Productivity, and Gender Roles. Occasional Paper.
Pingali, P., Aiyar, A., Abraham, M., and Rahman, A. (2019). Transforming Food Systems for a Rising India. Springer Nature. doi: 10.1007/978-3-030-14409-8
Rada, N. E., and Fuglie, K. O. (2019). New perspectives on farm size and productivity. Food Policy 84, 147–152. doi: 10.1016/j.foodpol.2018.03.015
Rao, C. H. (1966). Alternative explanations of the inverse relationship between farm size and output per acre in India. Indian Econ. Rev. 1, 1–12.
Rizov, M., Maathijs, E., and Swinnen, J. (2001). The Role of Human Capital and Market Imperfections in Labor Allocation in Transition Economies: Evidence From Rural Hungary. Policy Research Group Working Paper No. 21, Katholieke Universiteit Leuven.
Saini, G. R. (1971). Holding size, productivity, and some related aspects of Indian agriculture. Econ. Polit. Week. 1971, A79–A85.
Sen, A. K. (1966). Peasants and dualism with or without surplus labor. J. Polit. Econ. 74, 425–450. doi: 10.1086/259198
Srinivasan, T. N. (1973). Farm size and productivity: implications of choice under uncertainty. Sankhya 34, 409–420.
Subbarao, K. (1983). Technology Gap and the Emerging Size-Productivity Relationships Following the Adoption of New Technology: An Analysis of Evidence from Northwest and Eastern India.
Udry, C. (1996). Gender, agricultural production, and the theory of the household. J. Polit. Econ. 104, 1010–1046. doi: 10.1086/262050
Keywords: rice varieties, farm size, productivity, spouse, green revolution, soil quality, non-farm income
Citation: Malabayabas ML and Mishra AK (2022) Assessing inverse relationship in joint farm decision-making households: An empirical evidence from Eastern India. Front. Sustain. Food Syst. 6:1000156. doi: 10.3389/fsufs.2022.1000156
Received: 21 July 2022; Accepted: 26 August 2022;
Published: 27 September 2022.
Edited by:
Francisco Areal, Newcastle University, United KingdomReviewed by:
Pablo Pérez-Akaki, Monterrey Institute of Technology and Higher Education (ITESM), MexicoCopyright © 2022 Malabayabas and Mishra. This is an open-access article distributed under the terms of the Creative Commons Attribution License (CC BY). The use, distribution or reproduction in other forums is permitted, provided the original author(s) and the copyright owner(s) are credited and that the original publication in this journal is cited, in accordance with accepted academic practice. No use, distribution or reproduction is permitted which does not comply with these terms.
*Correspondence: Ashok K. Mishra, YXNob2suay5taXNocmFAYXN1LmVkdQ==
Disclaimer: All claims expressed in this article are solely those of the authors and do not necessarily represent those of their affiliated organizations, or those of the publisher, the editors and the reviewers. Any product that may be evaluated in this article or claim that may be made by its manufacturer is not guaranteed or endorsed by the publisher.
Research integrity at Frontiers
Learn more about the work of our research integrity team to safeguard the quality of each article we publish.