
95% of researchers rate our articles as excellent or good
Learn more about the work of our research integrity team to safeguard the quality of each article we publish.
Find out more
ORIGINAL RESEARCH article
Front. Sustain. Food Syst. , 10 December 2021
Sec. Crop Biology and Sustainability
Volume 5 - 2021 | https://doi.org/10.3389/fsufs.2021.781158
This article is part of the Research Topic Identification and Control of the Geographic Origin of Plant Materials: Investigation of Ambient Influences and Environmental Selection View all 10 articles
 Micha Horacek*†
 Wolfgang Papesch‡
Vegetable food stuff produced under controlled and identical conditions from one farm of identical “age” (batch) has a similar isotopic composition. This fact can be used to control the origin of vegetables. This question is of special relevance when food-contaminations have to be traced back to the producer, or certain production claims have to be controlled. However, as vegetables are harvested, brought to whole-sale merchants and to retail shops, where they remain until being bought by the consumer, one has to consider possible changes in isotopic composition during this transfer period, when comparing vegetables of questioned origin with reference samples taken directly from the field/producer. We investigated changes in the isotope composition of vegetables during storage by studying as an example cucumbers from one batch. We stored the cucumbers in a vegetable storage under controlled conditions and removed one sample every day and analyzed its isotopic composition. We found changes in the δ15N and δ18O isotope values over the investigated period of 21 days, with both parameters showing positive linear correlations, and maximum enrichments with time of more than 1.5‰ for δ15N and more than 2‰ for δ18O. However, within the interval the samples remained in a saleable condition the isotope variations remained more or less within the variability of the sample batch. Our study demonstrates that changes in the isotopic signature in vegetables might occur after harvest during storage and have to be taken into account when (commercial) samples collected in a market are investigated.
The control of the declaration of origin of food becomes a topic of increasing importance. One reason is the willingness of consumers to pay more for products from a certain region or of a certain brand. As this might lead to incorrect labelling of goods to increase the profit, there exists the need to control declared origins. A special relevance has the control of geographic origin of food, when products with contaminations are found in the market. Then it is absolutely essential to be able to trace these products back to the respective producers. In 2011 there was an outbreak of a new strain of Escherichia coli in Germany and western Europe and the suspicion of having been caused by contaminated Spanish cucumbers (among other fresh vegetables as tomatoes and lettuce) which lateron proved incorrect and organic sprouts were regarded as source of contamination instead (https://en.wikipedia.org/wiki/2011_Germany_E._coli_O104:H4_outbreak, last accessed 24.6.2021). Other, requests and needs for (back-) tracing of authenticity of vegetables (and generally food) are control of the geographical and agricultural origin of food, fertilization strategies and type of production system (organic/conventional). Such incidents require the means for quick back-tracing of food for the protection of consumer health and the control of accusations and claims.
Research about the geographic origin of food products has been carried out on a wide variety of food products, as wine (e.g. Christoph et al., 2004, 2015; Griboff et al., 2021; Horacek et al., 2021; Leder et al., 2021), meat (e.g., Boner and Förstel, 2004; Camin et al., 2007; Horacek and Min, 2010), coffee (e.g., Serra et al., 2005; Rodrigues et al., 2009), vegetables and crops (e.g., Horacek et al., 2010, 2015; Bontempo et al., 2011; Goitom Asfaha et al., 2011; Opatić et al., 2018; Kongsri et al., 2021) among many others.
Usually, stable isotope analysis is the preferred method of choice for the control of geographic origin of food (see references mentioned above). However, to be able to reliably track back the geographic origin, or to control the fertilization strategy, production system, or other declared qualities, one has to know if storage of a product after the harvest can significantly alter the isotope signature, or if the isotope pattern remains unchanged within the period the respective food commodity is in a saleable condition. A few studies on this topic have been carried out for meat by investigating the meat water of meat samples. Thiem et al. (2005) report an increase in δ18O of meat samples stored in a refrigerator, while Horacek et al. (2009) report no significant changes in δ18O and δD with time for meat samples stored in a slaughter house cool storage. However, to our knowledge, no such investigations have been carried out for plant food materials. Therefore, in the present study we investigate the changes in the isotope composition of cucumbers (Cucumis sativus) during storage. Botanically, cucumbers belong to the Cucurbitaceae family (gourd plants), conventionally/culinary they are regarded as vegetables (https://fruitorvegetable.science/cucumber, last accessed 24.6.2021). We test the hypothesis, that during storage under controlled conditions the cucumbers will not change their isotopic composition significantly.
Fifty cucumbers from one batch from one greenhouse have been weighed and put into a vegetable storage under controlled ideal storage conditions at temperature of 10°C and humidity above 90%. Every day over period of 21 days two cucumbers were taken, weighed again, sealed in a plastic bag and freeze-stored at −16°C until processing and analysis. (Weight differences are given in Supplementary Table 1).
During sample processing cucumber water was extracted from the cucumbers using a kitchenware juice extractor. In the extractor the entire cucumber is minced and falls into a rotating cylindrical sieve, through which the juice passes due to the centrifugal force and is caught in a glass. The duration for a sample depends on its size but usually lasts <10 seconds. The cucumber water was then pipetted into a glass flask and quickly transferred to the oxygen isotope analysis, while the residue of the cucumber was collected in a sample container.
Oxygen isotope values of the cucumber water samples were measured using an isotope ratio mass spectrometer Finnigan Delta+XL, coupled to an automatic equilibration device equipped with pneumatic valves (Papesch and Horacek, 2009). For analysis an aliquot of 3 ml is put into the glass vessel and attached to the equilibration device at a bath temperature of 20°C. Each vessel is equipped with a magnetic stirrer to speed up initial degassing of the water sample and to attain isotope equilibrium within 4 h. The evaluation of the raw data of ratios of mass 46 to 44 to oxygen isotope values is accomplished by two laboratory standards (Adriatic sea water and Vienna tap water) which are measured alike with each batch of samples. These standards have been calibrated by means of the international standards V-SMOW and SLAP distributed by the IAEA.
The residue of the cucumber was dried at 40°C in a dry-oven and homogenized. Each sample is then weighed into a tin capsule (ca. 2 mg) for δ15N and δ13C analyses. The samples were introduced into an elemental analyser (Elementar) where the samples are combusted and the evolving gases transferred via a ConFlo IV (Thermo) into a Thermo/Finnigan DeltaplusXP mass spectrometer. The isotope ratio is expressed in the conventional δ-value:
with
Long-term reproducibility of our instruments using in-house laboratory standards was better than 0.1‰ for δ18O and 0.2‰ for δ15N and δ13C (1σ) (Horacek et al., 2008). In this paper δ18Owater refers to the oxygen isotope values of the extracted cucumber water samples, and δ15Npulp and δ13Cpulp refers to the carbon and nitrogen isotope values of the cucumber pulp samples.
All isotope results are reported as per mil (‰) deviation vs. international standards. The δ13Cpulp, δ15Npulp and δ18Owater values are calibrated vs. the VPDB standard, air standard and VSMOW standard, respectively.
Calculation of the population standard deviation was carried out using a web-tool (https://miniwebtool.com/population-standard-deviation-calculator/ last accessed 08.11.2021).
The data are statistically evaluated by the determination coefficient (R2) and significance (p-value) of a simple linear regression using the Microsoft program Excel, which shows the strength of correlation of the respective parameters. R2-values range between 0 and 1 with values close to 0 indicate a very weak or no correlation between the evaluated parameters and values close to 1 a very high correlation between the evaluated parameters. Significance above the 95%-level is indicated by a p < 0.05.
The cucumbers from the storage experiment yield the following results (Supplementary Table 2): The initial isotope composition was −6.8‰ for δ18Owater,−0.3‰ for δ15Npulp and−28.7‰ for δ13Cpulp (Figures 1A–C). The δ13Cpulp values show a slight increase in the averaged trend of about 0.7‰, however, the values are scattered and range from −29.9 to −25.8‰ (Figure 1A). The δ15Npulp values show an increase from the initial value within the observed period to a maximum value of +1.3‰ (Figure 1B). The values are scattered and partially deviate from the averaged trend. It is interesting to note that we observed in δ15Npulp a jump from day 0 to day 1 of ~0.6 to 0.3‰. However, when we repeated this experiment by storing another batch of cucumber for 2 days, no such jump could be observed (Supplementary Table 3). For δ18Owater the values increase within the 21 days of storage to a maximum value of −4.8‰ (Figure 1C). Also for this system, the increase is not steady but with some scatter, even showing some values within the first days that are depleted with respect to the initial value, with a minimum of −7.2‰. The weight loss with time is almost completely continuous and without much deviations from the averaged trend (Figure 1D; heavier cucumbers do not necessarily have a lower weight loss than lighter ones, see Supplementary Table 1). Only in the third week the scattering increases to some extent. A maximum weight loss of 19.7% was found. The weight loss correlates very well with the increase in δ18Owater, evidencing a direct link. The cucumbers were in saleable condition (based on the appearance of the cucumbers) until day 10 of the experiment (pers. comm. J. Hobiger). The Population Standard Deviation for δ13C, δ15N and δ18O for the first ten days are very close to the standard deviation with +/– 0.62, 0.34 and 0.3‰, respectively.
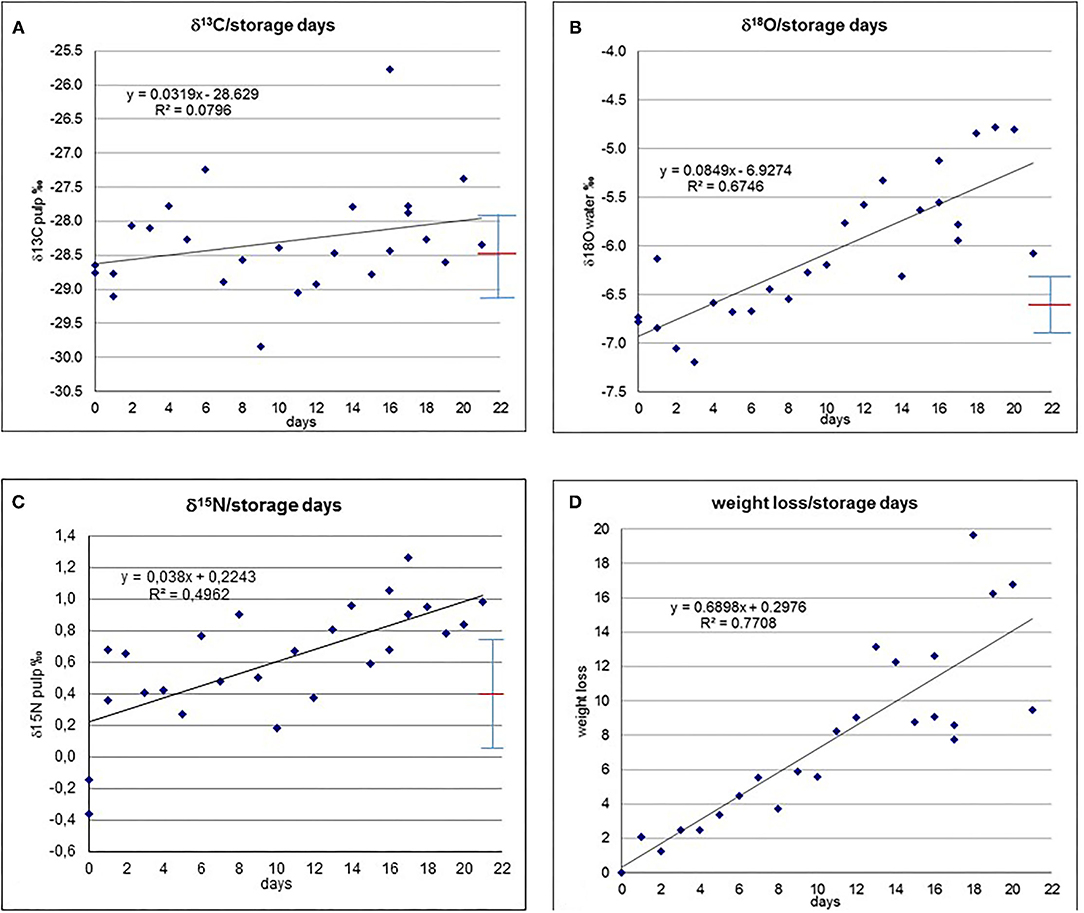
Figure 1. (A) δ13Cpulp vs. storage days. (B) δ15Npulp vs. storage days. (C) δ18Owater vs. storage days. (D) Weight loss (weight %) vs. storage days. Red line denotes average, whiskers show population standard deviation.
The determination coefficient is shown for the isotope parameters with respect to time and weight loss for the entire storage duration and its first 10 days (Figures 1A–D, 2A–C and Supplementary Tables 4A,B). For the entire period the highest strength in correlation exists for δ18Owater and weight loss, and weight loss with time (with an R2 of ca. 0.8) and δ18Owater and time (R2 is ca. 0.7). Strength of correlation of δ15Npulp and time is ca. 0.5, δ15Npulp and weight loss ca. 0.4, and strength of correlation of δ13Cpulp with time and weight loss is below 0.1. Strength in correlation of the investigated isotope parameters vs. time and weight loss are notably lower for the first 10 days of the experiment (Supplementary Table 4B), but weight loss vs. time is already quite high.
The determination of the p-value (significance) shows (Table 1) significant correlations of δ15N and δ18O with time (days) and weight loss over the entire experiment duration of 21 days, but no significance during the first 10 days, when the cucumbers remained in saleable condition. Weight loss shows a significant correlation with time for the 10 and 21 days intervals. δ13C has neither a significance during the 21 nor the first 10 days interval.
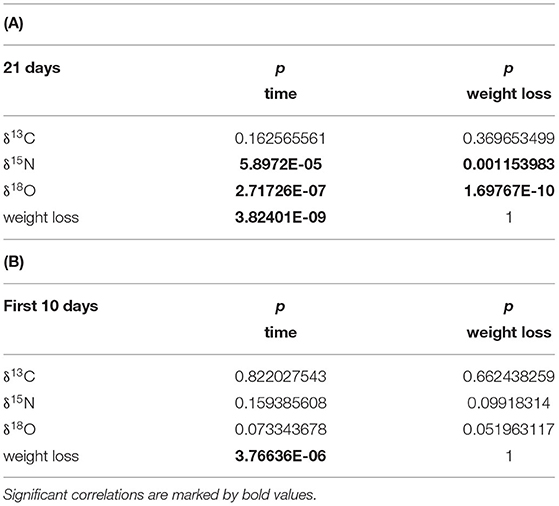
Table 1. (A) p-value for the investigated parameters δ13Cpulp, δ15Npulp, δ18Owater and cucumber weight loss correlated with time (days), and weight loss for the entire duration of the experiment (21 days); (B) for the first 10 days, during which the cucumbers remained in saleable condition.
Which effects can influence the isotopic composition of the investigated cucumbers during storage and thus time? We assume photosynthetic processes, degradation and ripening processes and water loss. Photosynthetic processes should influence the 13C-signal, as the samples are cut-off from a water supply (Farquhar et al., 1982, 1989). Degradation and ripening processes should influence the 15N-value with time (O'Deen, 1989; Unkovich, 2013), and water loss results in weight reduction and change in δ18O, due to evaporation/transpiration processes (Dansgaard, 1964; Roden et al., 2000; Yakir and Sternberg, 2000).
The R2-values of δ13Cpulp with respect to weight loss (Figure 2A) and time (Figure 1A) remain below 0.1, indicating that there is only a very minor correlation (if at all), or that any correlation is masked by the batch heterogeneity. Theoretically, in the harvested cucumbers photosynthetic processes might continue, which should be evidenced by an increase in δ13C (Farquhar et al., 1982, 1989; Horacek et al., 2015) due to closure of the stomata because of drought stress, as the harvested cucumbers are cut off from any water supply. However, the absence of δ13Cpulp correlating with storage time demonstrates that this process did not occur, and all variations can be regarded as dominantly due to the sample batch heterogeneity.
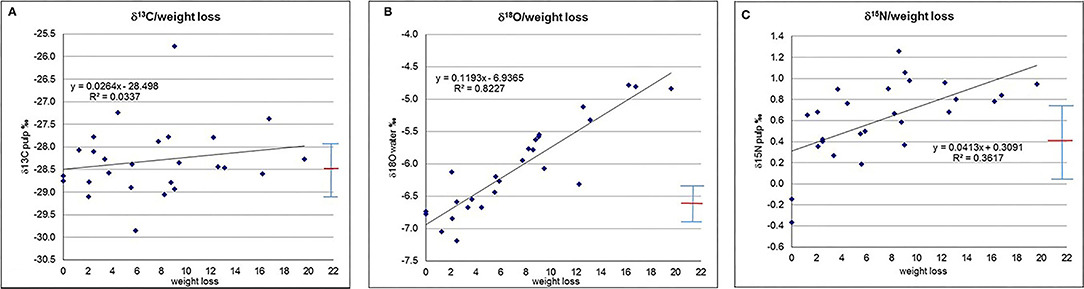
Figure 2. (A) δ13Cpulp vs. weight loss. (B) δ15Npulp vs. weight loss. (C) δ18Owater vs. weight loss. Red line denotes average, whiskers show population standard deviation.
The δ18Owater-values show a clear trend towards higher values with time (Figure 1C, Supplementary Table 4A) and, even better correlated (evidenced by a higher R2-value), with weight/water loss (Figure 2C), indicating a plausible explanation of passive enrichment in 18Owater of cucumber water by evaporation/transpiration (Dansgaard, 1964; Roden et al., 2000; Yakir and Sternberg, 2000). During evaporation/transpiration the light water isotopes (1H, 16O) preferably go into the gaseous phase and evaporate (a process which is temperature dependent and gets stronger the lower the ambient temperature), thus passively enriching the remaining water with time. However, within the first ten storage days (Supplementary Table 4B), which was the period of saleable condition for the investigated cucumbers, evaporation/transpiration only accounts for ca. 30% of the variation in δ18Owater (R2 around 0.3). As within these 10 days transpiration resulted in a weight loss of <6%, this value is, on the one hand a limit for the saleable condition of the cucumbers, and a kind of threshold for transpiration having a minor, insignificant effect (Table 1B) on the isotope pattern with respect to the isotope variability of the batch. One might speculate that the change in δ18O might be due to equilibration with the ambient water vapour. Two reasons speak against this possibility: (I) the cucumber water is confined within the cucumber and thus separated from the water vapour (and therefore this also does not happen during the time the cucumber is still attached to the plant), and (II) the almost perfect fit of δ18O with weight loss (Figure 2C).
The δ15Npulp-values demonstrate a trend towards increasing values with time (Figure 1B). As the correlation of δ15N with time is better than with weight loss (Figure 2B), as the respective R2-value is higher, the responsible degradation and ripening processes (O'Deen, 1989; Rodrigues et al., 2009) do not seem to be connected with transpiration. Similar to δ18Owater, within the period of saleable condition of the cucumber samples the degradation and ripening processes only account for a minor part of the variations in 15Npulp (R2 ~ 0.2).
Generally, within a storage period under ideal storage conditions of 10 days, during which the cucumbers remained in saleable conditions, the isotopic changes within the cucumber with storage remained insignificant (Table 1). Water loss, however, shows a significant correlation with time from the beginning of the experiment. After passing a threshold of ca. 10 days under ideal conditions, storage has a notable influence on the isotope pattern of cucumbers. If the storage conditions are less favourable, which most likely will be the case in most supermarkets and food stores, this threshold will be significantly shorter.
Cucumbers that are stored in plastic foil will have a longer shelf life, as the saleable condition mainly depends on the weight loss, which is reduced in foiled cucumbers. However, it will be necessary to investigate the behaviour of the N-isotopes, as the ripening and degradation processes should not be hampered by the foil.
During saleable condition (10 days, based on the appearance of the cucumber, approximately limited to a weight loss of <6% under ideal storage conditions in a cool-house) the variations in the isotope composition remain insignificant and approximately within the initial range. Samples exceeding this weight loss limit get notably enriched in δ18Owater due to transpiration. δ15Npulp also tends towards higher values, but the scattering also is larger and erratic. The variation in δ13Cpulp of the cucumber samples investigated in the present study are almost exclusively related to batch variability. Thus, our hypothesis of cucumbers remaining isotopically almost unchanged and thus can be used for control of declared provenance is correct for cucumbers in saleable condition, which means <6% weight loss, and a maximum of ten days from harvest under ideal conditions (cool-house). Under less favourable conditions shelf life will be shorter and thus the period of isotope patterns unchanged by storage. Thus, when investigating cucumbers or other vegetables for the control of (declared) geographic origin, the condition of the investigated samples have to be closely inspected and taken into account to avoid incorrect conclusions.
Cucumbers shrink-wrapped in plastic foil will have to be investigated separately to control the extent to which the correlation of δ15N and weight loss will be decoupled, together with potential other influencing factors.
The original contributions presented in the study are included in the article/Supplementary Material, further inquiries can be directed to the corresponding author.
MH developed the project design, acquired funding, performed project, and wrote the manuscript. WP analyzed the cucumber water samples and contributed to the manuscript. All authors contributed to the article and approved the submitted version.
This study received funding from LGV GmbH. The funder was not involved in the study design, analysis, interpretation of data, and the writing of this article or the decision to submit it for publication. M. Hobiger, employee of LGV GmbH determined the weight loss of the cucumbers by weighing.
MH and WP were employed by company Austrian Institute of Technology GmbH.
All claims expressed in this article are solely those of the authors and do not necessarily represent those of their affiliated organizations, or those of the publisher, the editors and the reviewers. Any product that may be evaluated in this article, or claim that may be made by its manufacturer, is not guaranteed or endorsed by the publisher.
This study has been partially financed by the LGV GmbH, Vienna, Austria, which is gratefully acknowledged. We thank Karl Herret and Johanna Hobiger from the LGV GmbH for their support and enthusiasm. Preparation of the samples has been done by Gerhard Spitzer and Erwin Tschank. Measurement of samples has been carried out by Karl Blochberger and Peter Kostecki. This study was funded under the Independent Research Program of the Austrian Institute of Technology GmbH – AIT. We thank the two reviewers for valuable recommendations.
The Supplementary Material for this article can be found online at: https://www.frontiersin.org/articles/10.3389/fsufs.2021.781158/full#supplementary-material
Boner, M., and Förstel, H. (2004). Stable isotope variation as a tool to trace the authenticity of beef. Anal. Bioanal. Chem.. 378, 301–310. doi: 10.1007/s00216-003-2347-6
Bontempo, L., Camin, F., Manzocco, L., Nicolini, G., Wehrens, R., Ziller, L., et al. (2011). Traceability along the production chain of Italian tomato products on the basis of stable isotopes and mineral composition. Rapid Commun Mass Spectrom. 25, 899–909. doi: 10.1002/rcm.4935
Camin, F., Bontempo, L., Heinrich, K., Horacek, M., Kelly, S. D., Schlicht, C., et al. (2007). Multi-element (H, C, N, S) stable isotope characteristics of lamb meat from different European regions. Analytical and Bioanalytical Chemistry. 389, 309–320. doi: 10.1007/s00216-007-1302-3
Christoph, N., Baratossy, G., Kubanovic, V., Kozina, B., Rossmann, A., Schlicht, C., et al. (2004). Possibilities and limitations of wine authentication using stable isotope analysis and traceability. Part 2: Wines from Hungary, Croatia and other European countries. Mitteilungen Klosterneuburg. 54. 155–169.
Christoph, N., Hermann, A., and Wachter, H. (2015). 25 Years authentication of wine with stable isotope analysis in the European Union – review and outlook. BIOWeb Conferences. 5, 02020. doi: 10.1051/bioconf/20150502020
Dansgaard, W. (1964). Stable isotopes in precipitation. Tellus. 16, 436–468. doi: 10.3402/tellusa.v16i4.8993
Farquhar, G. D., Ehleringer, J. R., and Hubick, K. T. (1989). Carbon isotope discrimination and photosynthesis. Annu. Rev. Plant Physiol. Plant Mol. Biol. 40, 503–537. doi: 10.1146/annurev.pp.40.060189.002443
Farquhar, G. D., O'Leary, M. H., and Berry, J. A. (1982). On the relationship between carbon isotope discrimination and the intercellular carbon dioxide concentration in leaves. Aust. J. Plant Physiol. 9, 121–137. doi: 10.1071/PP9820121
Goitom Asfaha, D., Quetel, C. R., Thomas, F., Horacek, M., Wimmer, B., Heiss, G., et al. (2011). Combining isotopic signatures of N(87Sr)/(86Sr) and light stable elements (C, N, O, S) with multi-elemental profiling for the authentication of provenance of European cereal samples. Journal of Cereal Sciences. 53, 170–177. doi: 10.1016/j.jcs.2010.11.004
Griboff, J., Horacek, M., Wunderlin, D. A., and Monferrán, M. V. (2021). Differentiation between argentine and austrian red and white wines based on isotopic and multi-elemental composition. Front. Sustain. Food Syst. 5:657412. doi: 10.3389/fsufs.2021.657412
Horacek, M., Eisinger, E., and Papesch, W. (2009). Using d18O from meat juice for the determination of the meat origin. Food Chemistry. 118, 910–914. doi: 10.1016/j.foodchem.2009.03.090
Horacek, M., Hansel-Hohl, K., Burg, K., Soja, G., Okello-Anyanga, W., and Fluch, S. (2015). Control of origin of sesame oil from various countries by stable isotope analysis and DNA based markers– a pilot study. PLOS ONE. 10, e0123020. doi: 10.1371/journal.pone.0123020
Horacek, M., and Min, J.-S. (2010). Discrimination of Korean beef from beef of other origin by stable isotope measurements. Food Chemistry. 121, 517–520. doi: 10.1016/j.foodchem.2009.12.018
Horacek, M., Min, J.-S., and Soja, G. (2010). Discrimination between ginseng from Korea and China by light stable isotope analysis. Analytica Chimica Acta. 682, 77–81. doi: 10.1016/j.aca.2010.09.046
Horacek, M., Min, J. S., and Papesch, W. (2008). The application of Isotope Ratio Mass Spectrometry (IRMS) for discrimination and comparison of adhesive tapes. Rapid Commun. Mass Spectrom. 22, 1763–1766. doi: 10.1002/rcm.3575
Horacek, M., Ogrinc, N., Magdas, D. A., Wunderlin, D., Sucur, S., Maras, V., et al. (2021). Isotope analysis (13C, 18O) of wine from central and eastern europe and argentina, 2008 and 2009 vintages: differentiation of origin, environmental indications, and variations within countries. Front. Sustain. Food Syst. 5:638941. doi: 10.3389/fsufs.2021.638941
Kongsri, S., Sricharoen, P., Limchoowong, N., and Kukusamude, C. (2021). Tracing the geographical origin of thai hom mali rice in three contiguous provinces of thailand using stable isotopic and elemental markers combined with multivariate analysis. Foods. 10, 2349. doi: 10.3390/foods10102349
Leder, R., Petric, I. V., Jusup, J., and Banovic, M. (2021). Geographical discrimination of Croatian wines by stable isotope ratios and multielementalcomposition analysis. Front. Nutr. 8, 625613. doi: 10.3389/fnut.2021.625613
O'Deen, W. A. (1989). Wheat volatolized ammonia and resulting nitrogen isotopic fractionation. Agronomy J. 81, 980–985. doi: 10.2134/agronj1989.00021962008100060027x
Opatić, A. M., Nečemer, M., Lojen, S., Masten, J., Zlatić, E., Šircelj, H., et al. (2018). Determination of geographical origin of commercial tomato through analysis of stable isotopes, elemental composition and chemical markers. Food Control. 89, 133–141. doi: 10.1016/j.foodcont.2017.11.013
Papesch, W., and Horacek, M. (2009). Forensic applications of stable isotope analysis: Case studies of the origins of water in mislabeled beer and contaminated diesel fuel. Sci. Just. 49, 138–141. doi: 10.1016/j.scijus.2009.02.005
Roden, J. S., Lin, G., and Ehleringer, J. R. (2000). A mechanistic model for interpretation of hydrogen and oxygen isotope ratios in tree-ring cellulose. Geochim. Cosmochim. Acta. 64, 21–35. doi: 10.1016/S0016-7037(99)00195-7
Rodrigues, C. I., Maia, R., Miranda, M., Ribeirinho, M., Nogueira, J. M. F., and Máguas, C. (2009). Stable isotope analysis for green coffee bean: A possible method for geographic origin discrimination. J. Food Compost. Anal. 22, 463–471. doi: 10.1016/j.jfca.2008.06.010
Serra, F., Guillou, C. G., Reniero, F., Ballarin, L., Cantagallo, M. I., Wieser, M., et al. (2005). Determination of the geographical origin of green coffee by principal component analysis of carbon, nitrogen and boron stable isotope ratios. Rapid Commun Mass Spectrom. 19, 2111–2115. doi: 10.1002/rcm.2034
Thiem, I., Lüpke, M., and Seifert, H. (2005). Extraction of meat juices for isotopic analysis. Meat Science. 71, 334–341. doi: 10.1016/j.meatsci.2005.04.023
Unkovich, M. (2013). Isotope discrimination provides new insight into biological nitrogen fixation. New Phytologist. 198, 643–646. doi: 10.1111/nph.12227
Keywords: shelf life, oxygen isotopes, carbon isotopes, nitrogen isotopes, transpiration, maturation processes
Citation: Horacek M and Papesch W (2021) Storage Changes Stable Isotope Composition of Cucumbers. Front. Sustain. Food Syst. 5:781158. doi: 10.3389/fsufs.2021.781158
Received: 22 September 2021; Accepted: 19 November 2021;
Published: 10 December 2021.
Edited by:
Matteo Balderacchi, Independent Researcher, Piacenza, ItalyReviewed by:
Weiguo Liu, Institute of Earth Environment, Chinese Academy of Sciences (CAS), ChinaCopyright © 2021 Horacek and Papesch. This is an open-access article distributed under the terms of the Creative Commons Attribution License (CC BY). The use, distribution or reproduction in other forums is permitted, provided the original author(s) and the copyright owner(s) are credited and that the original publication in this journal is cited, in accordance with accepted academic practice. No use, distribution or reproduction is permitted which does not comply with these terms.
*Correspondence: Micha Horacek, bWljaGEuaG9yYWNla0Bqb3NlcGhpbnVtLmF0
†Present address: Micha Horacek, HBLFA Francisco-Josephinum - BLT Wieselburg, Austria, and Department of Lithospheric Research, Vienna University, Vienna, Austria
‡Retired
Disclaimer: All claims expressed in this article are solely those of the authors and do not necessarily represent those of their affiliated organizations, or those of the publisher, the editors and the reviewers. Any product that may be evaluated in this article or claim that may be made by its manufacturer is not guaranteed or endorsed by the publisher.
Research integrity at Frontiers
Learn more about the work of our research integrity team to safeguard the quality of each article we publish.