
94% of researchers rate our articles as excellent or good
Learn more about the work of our research integrity team to safeguard the quality of each article we publish.
Find out more
ORIGINAL RESEARCH article
Front. Sustain. Food Syst., 03 December 2021
Sec. Land, Livelihoods and Food Security
Volume 5 - 2021 | https://doi.org/10.3389/fsufs.2021.737528
This article is part of the Research TopicAgile Data-Oriented Research Tools to Support Smallholder Farm System TransformationView all 17 articles
 Robert Andrade1*
 Sergio Urioste1,2
 Tatiana Rivera1
 Benjamin Schiek1
 Fridah Nyakundi3Jose Vergara2,3Leroy Mwanzia3Katherine Loaiza4Carolina Gonzalez1
Globally, there has been an explosion of data generation in agriculture. With such a deluge of data available, it has become essential to create solutions that organize, analyze, and visualize it to gain actionable insights, which can guide farmers, scientists, or policy makers to take better decisions that lead to transformative actions for agriculture. There is a plethora of digital innovations in agriculture that implement big data techniques to harness solutions from large amounts of data, however, there is also a significant gap in access to these innovations among stakeholders of the value chains, with smallholder's farmers facing higher risks. Open data platforms have emerged as an important source of information for this group of producers but are still far from reaching their full potential. While the growing number of such initiatives has improved the availability and reach of data, it has also made the collection and processing of this information more difficult, widening the gap between those who can process and interpret this information and those who cannot. The Crop Observatories are presented in this article as an initiative that aims to harmonize large amounts of crop-specific data from various open access sources to build relevant indicators for decision making. Observatories are being developed for rice, cassava, beans, plantain and banana, and tropical forages, containing information on production, prices, policies, breeding, agronomy, and socioeconomic variables of interest. The Observatories are expected to become a lighthouse that attracts multi-stakeholders to avoid “not see the forest for the trees” and to advance research and strengthen crop economic systems. The process of developing the Observatories, as well as the methods for data collection, analysis, and display, is described. The main results obtained by the recently launched Rice Observatory (www.riceobservatory.org), and the about to be launched Cassava Observatory are presented, contextualizing their potential use and importance for multi-stakeholders of both crops. The article concludes with a list of lessons learned and next steps for the Observatories, which are also expected to guide the development of similar initiatives. Observatories, beyond presenting themselves as an alternative for improving data-driven decision making, can become platforms for collaboration on data issues and digital innovations within each sector.
Currently, many consider data what oil was for the industrial revolution (Economist, 2017), a valuable resource and organizational asset (Lake and Crowther, 2013; Birch et al., 2021). For many companies (e.g., Amazon, Facebook, Google, Microsoft, Tesla), data are their most valuable commodity, an asset that has generated billions of dollars for the world economy. The current disruption around data and digital innovations has led to what some have called the fourth industrial revolution (Schwab, 2017). Technologies such as a blockchain, the Internet of Things, artificial intelligence, and immersive reality are rapidly changing the dynamics of various economic sectors. The agricultural sector and food sector are not an exception to this revolution; nonetheless, their transformation process compared with that of other sectors has a long journey ahead as agriculture trails most sectors in digitalization (Manyika et al., 2015). Although some countries have quickly moved toward digital transformation thanks to the spread of information technologies (IT), most developing countries still have several barriers to overcome before tapping into the potential benefits of this revolution. There is a general warning to avoid the rise of a digital divide1 as it could leave behind the most vulnerable actors of the agricultural sector (i.e., smallholders), who may not be prepared to easily adopt new technologies (Trendov et al., 2019; Zhai et al., 2020). Most developing countries still have weak technological infrastructure, low levels of e-literacy, and restricted access to and high costs of digital services that can limit the digital revolution benefits in agriculture (Trendov et al., 2019). Nevertheless, diverse international development agencies and multiple research initiatives are working to open data access and ensure that all actors in this critical sector benefit in the long term from this new revolution.
Open data provide a unique opportunity to strengthen agriculture, with benefits such as encouraging collaboration between institutions to answer global research questions of relevance. Besides supporting researchers and policymakers, open-access data provide a unique opportunity to improve agricultural management decisions and influence the entire food supply chain. For example, farmers can improve their decision-making processes by receiving site-specific recommendations about sowing times, best-available varieties, and adequate input use and timing. They can also receive recommendations from early warnings of pests and diseases and obtain access to financial services, among other management-related decisions or services (Wolfert et al., 2017; FAO, 2021c). Meanwhile, consumers could benefit from information on how to find farmers' markets, crop nutritional information, and the use of blockchain technology to ensure food safety, among other benefits (Allemang and Bobbin, 2016). These are just a few of the multiple benefits that exist to encourage the digitalization of agriculture, which can reach other stakeholders within the food systems and further expand their impact. However, this requires thinking outside the box and carefully considering its implementation to avoid leaving the most vulnerable out of reaping potential benefits.
Although several ongoing initiatives are making significant efforts to advance digital agriculture, data use in agriculture has a long history, even before the digital revolution began. The Food and Agriculture Organization of the United Nations (FAO) created FAOSTAT (formerly known as AGROSTAT) in 1986, which up to now is the most comprehensive repository of national agricultural statistics for 245 countries with more than 12 domains that go from production to trade, prices, food security, emissions, investments, forestry, and other topics (FAO, 2021a). Other international institutions such as the World Bank have been compiling macro indicators that track development progress nationally, several of which are related to the agricultural sector (World Bank, 2021). In addition, multiple national or regional initiatives collect and present relevant agricultural data. Antognoli et al. (2017), Piestrak (2020), and Michigan State University (2021) have compiled comprehensive inventories of open information repositories in agriculture.
Nonetheless, data is only one part of the equation. Analyzing and disseminating data-driven recommendations are essential to strengthen the agricultural sector, and with such amount of data, it is important to implement technologies that make the most of the available information. Big data tools have been at the forefront of the digital revolution, with a handful of initiatives developed in agriculture. However, access to these tools and other technologies is disparate, leaving the most vulnerable behind. Global platforms such as the CGIAR Big Data Platform (CGIAR, 2021a), G.E.M.S.® (UMN, 2021), and GODAN (GODAN, 2021), have been unraveling Big Data's potential to solve agricultural development problems, while advocating for more equitable access and openness of data. Nonetheless, these and other efforts are far from reaching their potential. While access to this information is improving, the gap between those who can take advantage of the available data and those who cannot is persistent.
Under this new revolution and sea of data and platforms, and stakeholders with very diverse capabilities and needs, how can efforts be integrated to make the most of the data available and leave no one behind? This article introduces the Crop Observatories, not as a unique answer to the question posed, but as one of the many alternatives needed to solve it. These Observatories were born from the need to have relevant indicators for specific crops (e.g., rice, cassava, common beans, banana and plantain, and tropical forages), providing data-driven insights to scientists, policymakers, farmers, and consumers. The Observatories merge diverse datasets that help to contextualize the importance of the crop of interest within the agricultural sector from diverse points of view, with the main objective of generating data-driven decisions.
To achieve this, the Observatories do not only rely on international open-access datasets, as they have also made a significant effort to compile nationally relevant data sources (e.g., data from national censuses and government or research institutions). Apart from the commonly used country-level indicators, these nationally relevant data sources provide granular levels of information. Likewise, the Observatories are merging farmer household surveys, integrating and improving dataset ontologies and providing relevant crop-specific indicators. Furthermore, they are built upon large networks of public-private partners, who constitute not only a source of information but also a broad network of users who engage with the data, thus helping to reach a wider audience. Finally, the Observatories are integrating the scientific evidence of available innovations for each crop, by linking information from gene bank accessions and adoption of improved varieties from breeding programs to farmers' fields.
The article presents an overview of open-access data initiatives in agriculture, highlighting the use of big data to leverage this information and the limitations it presents for smallholders. The Observatories are then introduced, presenting its data management and the structure, and subsequently providing examples of its potential use in decision making, as well as the corresponding development of collaborative multi-stakeholder networks that has been achieved within the initiative. The article concludes by listing lessons learned that are contrasted with findings of other authors, and next steps to contribute to the development and improvement of the Observatories and similar initiatives in agriculture.
Open-access data have a long tradition in agriculture, starting with the legacy of AGROSTAT, the first agricultural information platform developed by FAO in 1986, and renamed in the mid-1990s as what is known today as FAOSTAT. This initiative has moved through a series of programming languages and operating systems, and has grown in data quantity, coverage, and type of information collected (Mori, 2018). FAOSTAT is now the most comprehensive repository of national agricultural statistics and undoubtedly the main, and in many cases the only, source of open information nationally for a wide range of agricultural indicators.
Beyond FAOSTAT are a plethora of initiatives aimed at collecting and providing access to open datasets related to the field of agriculture. Antognoli et al. (2017) make a comprehensive inventory of public online databases and repositories containing agricultural data up to 2017, in which datasets of journals, ontologies, and other ag-specific open-data resources are found. Also, catalogs such as those of Piestrak (2020) and Michigan State University (2021) present more limited but more up-to-date inventories2.
International organizations (e.g., CGIAR, OECD, United Nations, World Bank) that compile national statistical information from many countries are the main leaders of initiatives that provide general indicators, trade, or agricultural databases. National statistical agencies are their main sources of information, and they often contain more detailed information than that presented in the global or regional databases. However, the information is dispersed, and its management hinders accessibility, interoperability, and comparability of data between different sources of information at disaggregated levels. In some cases, depending on the leading institutions presenting the information, there may be sources presenting different values for the same variable. There is still a need to improve metadata reporting among data providers and collectors to have consistent statistical information that can be replicable and interoperable for making better decisions.
In the categorized databases (Supplementary Table S1), two particularly excel in presenting genomic information that standardizes different crop species for comparative purposes (McCarthy et al., 2007; Tello-Ruiz et al., 2021), corresponding to more specific information with a smaller audience than the other databases. Similar resources also exist for a wide range of crop groups and species. Examples include the open-data genetic resources available for legumes in the Pulse Crop Database (Humann et al., 2019), or RIKEN, which has established a genomic platform for cassava (Utsumi et al., 2012). Correspondingly, the Rice Annotation Project database has been providing a comprehensive set of gene annotations for the rice genome sequence that can be freely accessed (Sakai et al., 2013). Furthermore, Thudi et al. (2021) review similar resources for 12 kinds of cereals and legumes.
Other databases such as AgIncentives, the Agri-food Data Portal, and the Policy Support and Governance Gateway, concentrate on policy-oriented information to guide policy implementation (IFPRI, 2019; European Commission, 2021). The International Food Policy Research Institute (IFPRI) has also developed the COVID-19 Policy Response Portal, a tool for monitoring policy responses to COVID-19 in 33 countries and nine policy response areas, tracking to date more than 2,800 policies implemented worldwide since the onset of the pandemic (IFPRI, 2021).
Regarding price information, FAO (2017) presents a review on price systems globally and Magesa et al. (2014) analyze these price systems in developing countries. Futures and cash prices of the main commodities in the stock exchange markets are additional market information freely available. Although each market has its real-time information system, initiatives such as Streak,3 Trade Station,4 and TradingView,5 offer free information for commodities traded on the main markets. These platforms also offer a set of tools for creating, analyzing, and testing trading strategies, some of which are open source and interoperable with other platforms.
The functionalities offered by most platforms to access them are as diverse as the types of databases: from simple visualization and downloading of the data presented on most platforms (Supplementary Table S1), to powerful search engines and functionalities that allow greater user interaction with the data. Such are the examples of the United States Department of Agriculture (USDA) Economic Research Services Data Visualization Platform (USDA, 2021), and FAO's comparison tool for food prices (FAO, 2021d) and FAOSTAT indicators (FAO, 2021b).
Other tools allow more dynamic interaction by visualizing data using maps. An example is the FAO Water Productivity Open-access portal (WaPOR), a publicly accessible near real-time database using satellite data that allows the monitoring of water productivity in agriculture in some African countries (FAO, 2020b). Other initiatives combine different types of data as input for the generation of more complex analysis systems. For example, the Global Information and Early Warning System (GIEWS) developed by FAO integrates price data with cartographic information from crop monitoring and agricultural inventories to provide early warnings on food supply, demand, and price problems (FAO, 2020a). Another initiative that integrates data from multiple sources is the Hand-in-Hand geospatial platform, a support tool for geospatial modeling and analysis to identify opportunities for and vulnerabilities of rural populations by integrating data and human capital from more than 20 multi-domain technical units across FAO (2021e).
Moreover, the USDA, FAO, and the CGIAR have made significant efforts to create agriculture-related dataset repositories on a wide range of topics. One of the oldest initiatives is AGRIS, which officially started in 1974, but decades later was brought into a more advanced repository with millions of bibliographic records (publications and datasets in diverse languages) available online. It is also in this group that we identified specialized repositories with more specific topics such as genomics and geospatial information of relevance for agriculture, and more general repository initiatives such as the Harvard Dataverse repository, which compiles thousands of datasets that go beyond agriculture and supports data management for its users (King, 2007; Yang et al., 2021).
Finally, several global platforms aim to unravel big data's potential to solve agricultural development problems; some selected examples presented in Supplementary Table S1 are the CGIAR Big Data Platform; G.E.M.S®, an international agro-informatics alliance; and the Global Open Data for Agriculture and Nutrition, a network with more than 1,000 innovators around the globe, all of them with the objective of providing research tools for better decision-making and strengthening of the agricultural sector. However, the inventory presented here and in Supplementary Table S1 is just a glimpse of all the initiatives that seek to tap the potential benefits of open data and digital agriculture, as there are many more, ranging from small initiatives generating microdata at the farm level, to large ventures collecting large amounts of data.
While the growing number of open data initiatives has improved the availability and reach of data, it has also made it more difficult to analyze this information, widening the gap between those who can process and interpret this information and those who cannot. Big data has emerged as a potent digital tool for harnessing the potential of open data in agriculture. However, despite the huge expectations around the benefits that big data innovations or analysis could provide to farmers (WEF, 2012; Porciello et al., 2021), concerns remains as to whether these benefits could be equally acquired or at least reached to most farmers and other stakeholders in the value chains. Fully attaining these benefits is further exacerbated by a large digital divide between big and small holders, with the latter facing major constraints to fully grasp these expected benefits (Protopop and Shanoyan, 2016; van Etten et al., 2017).
Factors contributing to this gap are as diverse as the contexts in which big data innovations are implemented. Some of the most common constraints faced by smallholders relative to other producers (e.g., medium and large holders) are weak digital infrastructure, affordability, and low levels of e-literacy, and digital skills (Wolfert et al., 2017; Trendov et al., 2019; Porciello et al., 2021). This lack of basic conditions to embark into the digital transformation accentuate differences between producers, but also among countries, since many developing countries still struggle with underlying economic problems that further exacerbate the aforementioned constrains, limiting the expected benefits that the digital revolution can have on agriculture (Trendov et al., 2019). Even at the household level, there is evidence of significant gender gaps in access to these solutions and their benefits (Porciello et al., 2021).
These disparities in access to innovations and the expected benefits from their adoption will accentuate the already existing gap in productivity, access to market information, or other competitiveness factors whose unequal access may translate into greater social and economic disparities between groups of producers (Trendov et al., 2019). As big-data solutions become more relevant in agriculture, major shifts are expected in the roles and power relations between different actors in food chains (Wolfert et al., 2017), and developers and researchers should be responsible to avoid leaving some of the vulnerable actors behind. Significant barriers to entry may arise for the most vulnerable groups, as there is an increased concentration of technology in a limited group of producers, limiting the role of smallholder farmers in the digital transformation process (Trendov et al., 2019). On the other hand, the limited capacity of smallholders to deal with the complexity of data, coupled with their double role as producers and potential users of big data, prevents the institutionalization of this innovations at the producer level, leaving room for other actors in value chains to control this information (Lioutas et al., 2019).
Besides the risk and unfavorable conditions faced by smallholders, they are responsible for cultivating around 40% of global agricultural land and represent nearly 570 million famers (Burra, 2019), so ensuring that they benefit from the digital revolution is of paramount importance. Cost of inaction to support smallholders could further increase inequalities (Sylvester, 2019). This adds to the imminent risk of smallholders losing confidence in big data solutions. An extensive review of impact studies of digital innovations for middle and low-income countries compiled 312 studies of which 288 (92% of all studies) evaluated innovations targeting smallholders, and for 126 of those studies the authors found significant positive results for income, yield, knowledge, or resilience, among other outcomes (Porciello et al., 2021). This wealth of evidence has fueled national and global coalitions that aim to help developing countries collect and analyze data on smallholder farmers as a strategy to achieve the Sustainable Development Goals by providing them with big data solutions (Tollefson, 2018; Sylvester, 2019).
Porciello et al. (2021) review shows that the main modality for disseminating digital innovations is cellphones, mainly using text-messages, phone calls, or smartphone apps to provide guidance to farmers (in 62% of the studies). Other relevant digital modalities used are videos (23%) and websites (12%). This shows that most digital innovations attempt to benefit from the latest expansion of mobile communications in rural areas to reach the majority of farmers (Trendov et al., 2019). It is also noted that most of the innovations evaluated are in Sub-Saharan Africa (specifically Kenya, Nigeria, Uganda, Ghana, Tanzania, and Ethiopia), accounting for almost half of all studies analyzed, and India, with a surprising 27%. Clearly, it is necessary to continue to expand the scope of digital solutions to other regions of importance, such as the rest of Asian countries, given that the region concentrates the largest number of poor people worldwide (World Bank, 2021), or Latin America which has a complex biodiverse system that can still improve its productivity and become a net food exporter (Andrade et al., 2021).
In addition to this current concentration in the modality and geographical distribution of the innovations listed, there is a heterogenous set of value chains where these innovation have been implemented, with cereals (19%) and livestock (8%) having the largest shares. Finally, there is an extensive list of multiple factors that facilitate the adoption and scaling of innovations (Porciello et al., 2021), which helps to have a broader idea of those key factors to take into account in relation to the use of digital technologies with smallholders, but also warns about the heterogenous context that is required in each specific condition when disseminating these innovations. Despite the direct benefits for smallholder farmers, big data solutions generate positive spillover effects that link farmers to other stakeholders in the value chains, such as the financial sector through credit access production insurances, or digital banking that facilitates transactions and strengthens production. Other actors that can benefit of these spillovers are service, logistics and transport providers (Narayan et al., 2019), as well as consumers themselves (Allemang and Bobbin, 2016; Porciello et al., 2021). In some cases, these solutions, through their benefits, can come to act as factors that articulate stakeholders within a value chain, but long-term investments and multi-stakeholder coordination is needed (Wolfert et al., 2017).
Big data solutions represent an important alternative to leverage the use of open data and benefit smallholders and other stakeholders of the value chains by generating knowledge that contributes to timely decision making (Protopop and Shanoyan, 2016). While the potential of these tools for improving the lives of smallholder farmers and other stakeholders is enormous, it is important to address several concerns around these initiatives. Big data limitations include data availability, representativeness, and quality. Boyd and Crawford (2012) present a critical view on this topic, arguing that despite the radical change big data is creating in how we think about research, we should consider that data is useless when it separates from researchers' interpretations, methodology, and context. Further, aspects related to data ownership and control, data security, privacy, and ethical issues are a primary concern for stakeholders and evidence of the need for adequate policies to leverage big data tools (Kamilaris et al., 2017; Rotz et al., 2019). It is also necessary to develop appropriate incentives to create bi-directional data-output sharing relationships between farmers, especially smallholders, and private ventures (WEF, 2012; Zhang et al., 2021), thus providing value-added alternatives to producers. Generating relationships of trust between and in the big data solutions and agricultural actors as such. Moreover, access to these solutions and the interpretation of their results remain a major constraint to overcome.
One solution does not fit all, as there are a multitude of alternatives that are already addressing some of the above-mentioned issues. In this article, Crop Observatories are presented as one of these alternatives, with the aim to guide the decision-making process around specific crops and the needs of different types of stakeholders in these value chains. They also aim to address the issue of access to reliable data, which remains a constraint for many smallholder farmers. Moreover, while many digital solutions have proven to be successful and have a positive impact on smallholder farmers in developing countries, there is an over-concentration of these solutions in a handful of selected countries (Porciello et al., 2021), whereas Observatories have a broader scope by not only having a global reach, but also by presenting the importance of contextualizing a user's reality in relation to the rest of the world. In addition, Observatories respond to the need to synthesize information by integrating data sources and making it not only more accessible, but also more understandable to a wider audience. While the potential of platforms among impactful digital solutions remains limited, as does the reach of big data products and their benefits to small producers, there is great growth in digital coverage and services in the developing world (Trendov et al., 2019), representing a great potential to drive these innovations and ensure that the most vulnerable are not left behind in this revolution.
These Observatories were established from a demand-driven request to provide relevant indicators for specific crops, with the initial intention to guide scientists and disseminate the scientific knowledge gathered by the Alliance Bioversity-CIAT. Nonetheless, their scope grew continuously by adding new modules and components of interest to other stakeholders (e.g., policymakers, smallholder and large farmers, intermediaries, industry, and consumers) that demand and benefit from more specific and data-driven information. The main objectives of the Observatories are to (i) merge and manage diverse open-access datasets that disaggregate relevant indicators to lower administrative units, and contextualize the economic importance of the crop regionally and nationally; (ii) combine and display specific datasets from multiple research areas (i.e., gene banks, breeding programs, socioeconomic units, food quality and sensory laboratories) under standardized ontologies for analysis; and (iii) link and share this information with an extensive network of partners related to the crops of interest for the Alliance Bioversity-CIAT (e.g., rice, cassava, common beans, banana and plantain, and tropical forages). Each observatory concentrates only on a particular crop or group of crops to provide a complete overview of its relevance regionally and nationally from multiple points of view.
Many crop scientists rely on open-access datasets to contextualize their crop's importance nationally or regionally. For decades, FAOSTAT has provided relevant official agricultural indicators to fulfill these needs. Although this source of information is useful, and in most cases the only source of information, the level of aggregation and availability of crop-specific variables is often limited. Our Observatories therefore attempt to overcome this limitation by continuously harvesting from various open-access datasets, which, although not exhaustive, complement more disaggregated sub-national information to better understand the context of the crop in each country and thus guide more tailored intervention decisions that could diminish the digital divide and benefit large and smallholder farmers. In the supplementary material, we detail an inventory of datasets that feed the rice and cassava Observatories (Supplementary Table S2), and for each we have estimated a quantitative FAIR measure6 that evidences a lack of FAIRness among certain agricultural databases (Supplementary Figure S2), which could limit their access and usage. Datasets coming from international datasets present higher scores than most national dataset initiatives, showing an opportunity to strengthen their management. It is worth noting the great variability among information sources, as some are limited to statistical tables or reports without metadata that do not even come close to being considered open-data information platforms such as those international databases described earlier in this section.
Although access to disaggregated agricultural data indicators is a first step, to answer more specific or complex research questions, there is a need to strengthen the interoperability between datasets that come from diverse research areas and have heterogeneous objectives. The observatories emulate the proposed approach by generating interoperable datasets that connect data from different units and sources, with the objective of providing a comprehensive view for research, development and scaling of technologies. For example, by connecting data from gene banks, breeding programs, extension units, and socioeconomic datasets, a complete overview of research, development, and scaling-up of innovations, such as improved varieties, can be created. This will aid in tailoring specific breeding targets that generate the greatest possible impact, contributing to increasing producers' and consumers' welfare while coping with the uncertainty of climate change. Some of the main sources of this information are institutional records, expert opinions, and more detailed household surveys that require standardization procedures to maintain consistent ontologies that allow us to generate insightful lessons. Building datasets of this nature usually requires major logistical efforts and expenditures, and often is not fully exploited unless the datasets are findable, accessible, interoperable, and reusable (FAIR) enough to generate insightful analysis.
Besides dataset disaggregation and interoperation, the final piece of the Observatories is to generate and display data-driven analysis that becomes valuable for diverse users. Users play an important role in guiding a demand-driven observatory, while helping to disseminate observatory information and outcomes throughout their networks. We build each observatory upon a network of relevant actors in the crop value chain. This network is composed of stakeholder from international organizations, farmers associations and public and private institutions interested in developing lessons from the information they compile and incorporate into the observatory. Currently, the Rice Observatory network mainly relies on the institutions belonging to the Latin American Fund for Irrigated Rice (FLAR, its acronym in Spanish), while the Cassava Lighthouse mainly relies on the Cassava Breeding Program of the Alliance Bioversity-CIAT, which has an extended network of industrial cassava processors, research and government institutions from Southeast Asia and Latin America. Another example is the Common Bean Observatory, currently under construction, which will rely on the Pan-African Bean Research Alliance (PABRA), one of the largest research networks in sub-Saharan Africa for common beans.
The first observatory launched was the Rice Observatory (www.riceobservatory.org), which attracted attention from other research areas that decided to establish their own web-based open-access platforms. The Cassava Lighthouse (www.cassavalighthouse.org) is expected to be functional by the end of December 2021, while the Common Bean, Musa (banana and plantain), and Tropical Forages Observatories are in the initial stages of establishment and are expected to be released by mid-2022.
The Observatories follow a non-rigid standard set-up procedure that allows us enough flexibility to adapt them according to users' needs. The Observatories begin with a general contextualization process led by multidisciplinary researchers from breeding, agronomic management, and socioeconomic programs in the Alliance Bioversity-CIAT, who identify relevant data sources, prioritize topics of interest, and define a target audience and network of partners for the appropriate observatory. Consequently, each observatory has unique characteristics associated with the particularities of each crop, the profiles of the end-users, and the needs of the sector. Nonetheless, a baseline structure with standard indicators and similar data visualization facilitates cross-analysis when necessary as well as knowledge sharing and collaboration between researchers and developers of the initiatives.
Once each observatory is conceptualized and relevant data sources are identified, the next stage is to select and compile data from these sources of information (see the example in Supplementary Table S2). Although the data sources used are usually referred to as official sources of information, they undergo a rigorous review, cleaning, and analysis process before being published in an observatory, a process that is sometimes complemented with the help of strategic partners in order to identify the most relevant sources of information according to the topic or country of interest. Their structure, accessibility, interoperability, and replicability vary and represent a critical factor to consider when selecting the sources of information.
The observatories are complemented by information from their network of partners. A specific example of this complementarity in data collection is the yearly Monitoring and Follow-up Survey for the Latin American Rice Sector (EMSAL, its acronym in Spanish), distributed among members of FLAR since 2014 to collect sectorial information. Although the response rate and continuity in answering the survey vary among members, the tool is constantly revised, and the observatories continue to seek strategies to improve the quantity and quality of the information collected through key informants of the network. Furthermore, the institutions belonging to the observatories' networks follow a specific Data Management Policy (see Supplementary Material S3 for a complete version) based on international property rights principles and the CGIAR Open Access and Data Management Policy (CGIAR, 2013), ensuring confidentiality of the provided data when necessary and establishing the precepts for the proper handling and safeguarding of shared data.
The next steps are related to data management, processing, cleaning, standardization on variable units, and structure of the datasets. The most comprehensive sources of information, such as FAOSTAT, have an Application Programming Interface (API) service, which facilitates data downloading and updating processes. Currently, observatories are developing an automated service in R software that makes it possible to extract data from the FAOSTAT API, relate the information to local databases, select the data for the crops of interest and calculate the indicators to be displayed in the observatory. This is a process that stems from the lessons learned in the development of this article and that we hope to scale to other sources of information (e.g., price and market information databases), with the objective of not only maximizing efficiency in data downloading and updating, but also in the standardization of processes and the implementation of novel analytical techniques for large volumes of data.
Datasets have a tall-narrow system, with standardized single units of measurement. In general, national-level databases have nine mandatory variables (e.g., region, country, ISO-country, element, year, value, unit, sources, and observations). The sub-national-level databases include additional mandatory variables to identify sub-national administrative levels within a country (e.g., state, province, department, municipality). Geospatial identification is of importance in each dataset for data visualization. Data management is facilitated by storing datasets by topic of interest within each observatory.
Then, the observatories generate and display specific interactive graphical charts and figures for data visualization, intended to provide a better understanding of the crop and its context for a more accurate decision-making process, encouraging the identification of relevant research questions for scientists in a simple way. The Alliance's Foresight and Applied Economics for Impact unit carries out these processes throughout its observatory focal points, through which each researcher meets with the team of developers from the Data Management and Research Methods unit to share the databases and any other information relevant for presenting their data visualization ideas.
After receiving the data with the analysis results, the development teams use a workflow that standardizes the data into a single format that will conform to the structure of each platform. The developer translates the variables for each dataset into JavaScript objects. An object-relational mapper (ORM) converts the objects into the corresponding relational database structure and generates database extraction, translation, and loading (ETL) scripts in the Structured Query Language (SQL) to add the new data. Finally, the developer uses the ETL scripts to add the new data into the database. When an observatory user wants to visualize the data on the client side (web or mobile browser), GET method7 requests of Hyper-Text Transfer Protocol (HTTP) are made with native JavaScript to retrieve the data. On the server side, the platform's business logic, contained in program constructs referred to as “controllers,” loads data from the database and transfers the data to the client using JavaScript Object Notation (JSON). The client then executes functions that visualize the data in the desired way.
We construct the Observatories' websites using open-source technology. We use MySQL as the database engine and we develop the web applications using the Laravel web application framework, a free and open-source PHP (general-purpose script language) framework. The look and feel of the platform use Bootstrap, a free and open-source CSS (Cascading Style Sheets) framework. We also use open-source libraries such as mapbox.js (Gundersen, 2017), Chart.js (Downie et al., 2021), Plotly.js (Johnson et al., 2021), and TradingView widget (Ivanov et al., 2021) for data visualization of maps or charts tailored to end-user needs. Furthermore, the Observatories implement Programmable Google Search Engines to filter the most relevant and up-to-date news, categorized among various topics of interest.
Finally, the development team performs various tests to verify that everything is working correctly. Every new functionality is initially uploaded to the test server for verification by a multidisciplinary team of researchers. Once changes are approved, they become part of the production server, in both the database server and the web application server containing the observatory. It is essential to emphasize that this whole process is cyclical. Researchers and developers verify and update the visualized data to ensure the best end-user experience. This complete effort depends upon a multidisciplinary team that includes economists, software and data engineers, agronomists, food scientists, plant breeders, and communication experts.
The Observatories are structured to contain the topics prioritized by all relevant actors, and they continue to evolve as new sections are incorporated. The Observatories offer data visualization products categorized into different topics of interest. These tools integrate data from different sources with further analysis to provide insightful views of the crop context nationally, and thus orient decision-making processes and research among all types of actors. Some practical examples of these applications are described next.
The economic context section of the Observatories aims to merge information from diverse sources at various levels to contextualize the crop's economic importance in each region or country, a primary and essential input for scientists and policymakers to prioritize research and investment to address the real needs of farmers (large and smallholder), and other stakeholders. As mentioned before, we extract these inputs mainly from open datasets that, although helpful, still require extensive work to merge the needed information and could misguide certain conclusions unless a clear understanding of the crop context is given.
Cassava was considered the fourth most important primary product and diet component of more than one billion people around the world (Aristizábal and Sánchez, 2007), as well as the third most important source of dietary energy for developing regions of the world (Ceballos et al., 2012). Furthermore, the so-called Rambo Root has been listed as a crop with high potential to fight hunger and cope with climate change variability (Villarino et al., 2020). Nonetheless, available data rank cassava as the 13th most crucial crop according to area harvested in 2019 worldwide (27 million hectares), well below the three top-ranked crops (i.e., wheat: 216; maize: 197; and rice: 162 million hectares), a place it has held with slight variation in the last decades. However, the crop's importance is underestimated, since we are comparing a crop that is suitable for the tropics against agricultural production in both temperate and tropical regions, diminishing the importance of the crop and affecting its prioritization for development. In agriculture, the relevance of the crop location matters when we assess its economic importance (Joglekar et al., 2016).
The literature that discusses cassava's economic relevance and evolution is limited. Previous studies go back to the late 1980s, when De Bruijn and Fresco (1989) identified a decline in cassava's global importance. Nowadays, assumptions and knowledge are acquired through the experience of crop researchers on the major contributions that cassava could provide; however, this information is not often accessible for the public nor necessarily grounded in data. Hence, the Cassava Lighthouse gives insights into the role of this crop, being an opportunity to demonstrate its relevance for tropical agriculture. When we restrict the analysis to tropical areas, cassava is ranked ninth, not that far from the top-ranked crops.
If we factor in different regions, we observe that cassava was the third most important crop for sub-Saharan Africa (SSA) in 2019, competing with millet, the crop having that place in past years (Figure 1). Meanwhile, in South and Southeast Asia and the Pacific (SSEA&P), cassava was the 18th crop in 2019, but, for Thailand, Cambodia, Laos, and Vietnam, it is of major importance, ranking fourth, second, and sixth (in both Laos and Vietnam), respectively. If we consider the value of production, the position of the crop improves substantially, reaching fifth place for the tropics for 2018, first for SSA, and tenth for SSEA&P, thus showing the potential of this crop compared with others to produce higher value in less area. However, it is important to consider that the FAO dataset for value of production is restricted to a limited number of countries for the tropics (70 out of the 103 countries in the tropics had information available for 2018).
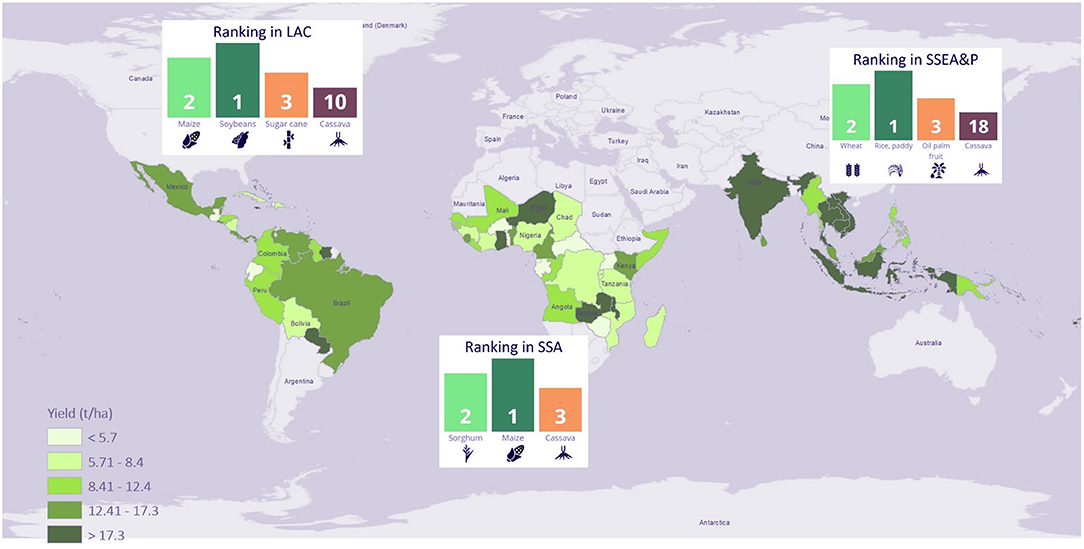
Figure 1. Yield map per country and regional rankings on cassava relevance by hectares harvested 2019. SSA, Sub-Saharan Africa; SSEA and P, South and Southeast Asia and the Pacific; LAC, Latin America and the Caribbean.
Another factor to consider besides area and production value relates to the relevance the crop has within root and tuber crops. According to available statistics for all roots and tubers produced in the tropics, cassava consistently represents more than half of the area harvested (Figure 2). In importance, it is followed by yams (19%), sweet potatoes (11%), and potatoes (9%). When compared regionally, 59% of the planted area with roots and tubers in LAC corresponds to cassava, with 57% in SSA and 52% in SSEA&P in 2019 (Figure 2). Despite the importance of cassava in SSA, the region had the lowest yield (8.9 tons/ha on average) in 2019, though huge variation exists from one country to another (Figure 1). For example, Niger, Ghana, and Zambia present a high yield (more than 20 tons/ha), whereas Burkina Faso, Central African Republic, Equatorial Guinea, and Uganda present yields below 4 tons/ha. These countries could be prioritized areas considering the local importance of the crop, especially for the large share of smallholder cassava producers around the world.
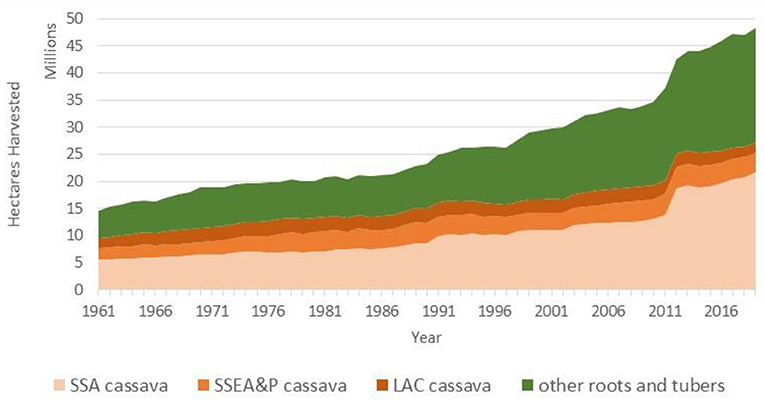
Figure 2. Historical total root and tuber area harvested and cassava area harvested by region. SSA, Sub-Saharan Africa; SSEA and P, South and Southeast Asia and the Pacific; LAC, Latin America and the Caribbean. Other roots and tubers include everything else besides cassava.
The information displayed in the cassava observatory will facilitate the process of identifying, evaluating, and targeting the above aspects according to the research objectives, and by shifting between levels of analysis (regions, countries, and departments) depending on data availability. Furthermore, disaggregated information will be more likely found for the countries where cassava plays a significant role, one of the advantages of the “crop approach” followed by the Observatories.
Beyond being an open information platform on specific crops, the Observatories have focused on generating research products derived from data collection and strategic alliances with partners. Thus, in the context of the health crisis, the Rice Observatory conducted a quick participatory assessment on the effects of the COVID-19 pandemic across the Latin America and the Caribbean rice sector (Urioste et al., 2020). The objective was to evaluate the impact of the pandemic on the rice sector regionally during the first 2 months of confinement (March and April 2020).
Unlike other agricultural commodities such as soybeans, meat, and maize, whose prices fell due to the drastic drop in demand for meat and biofuels, the main international reference prices increased considerably for rice. This increase was mainly because of export restriction policies implemented by some of the world's major exporters (Cambodia, Myanmar, India, Thailand, Vietnam) amid fears of a decrease in stocks due to the sharp increase in demand. In the case of Latin America, rice imports from these origins are limited. Despite the increase in demand for non-perishable foods and the consequent effect on prices, it was not possible to visualize the effects of the pandemic on the rice sector regionally by that time (Figure 3).
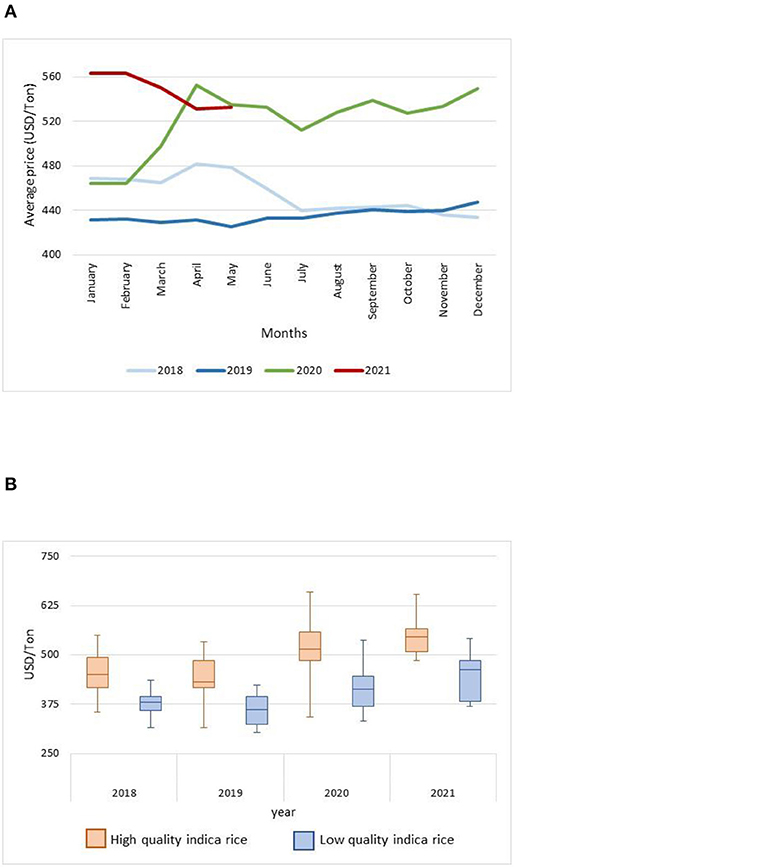
Figure 3. Price trend for all kinds of rice products during COVID-19. (A) Yearly trend of average high-quality indica rice price before and after COVID-19. Average international price of reference (monthly) for selected High-Quality Indica Rice (United States Long grain 2.4%, Uruguay Long grain 5%, Thailand 5% broken, Thailand Parboiled 100%, Thai 100% B, Vietnam 5% broken). After COVID is considered past 2020. (B) International reference range of prices for high- and low-quality indica rice before and after COVID-19. Graph-box presents maximum and minimum prices at the end of the box and median at the center accompanied by percentiles 25 and 75% for the upper and lower box boundary. Average international price of reference (monthly) for selected High-Quality Indica Rice (United States Long grain 2.4%, Uruguay Long grain 5%, Thailand 5% broken, Thailand Parboiled 100%, Thai 100% B, Vietnam 5% broken) and Low-Quality Indica Rice (Vietnam 25% broken, India 25% broken, Pakistan 25% broken, Thailand 25% broken, and Thai A1 Super). After COVID is considered past 2020.
A total of 40 surveys were collected from opinion leaders and stakeholders from the rice sector in 20 countries. Most countries reported some effect on the sector, with restrictions on the movement of people and transportation of products being the most recurrent problems, although the agricultural sector was exempt from these restrictions in most countries. In contrast, countries also reported positive effects throughout the period, with increased demand and prices being the main drivers. At the same time, major exporters benefited not only from higher prices but also from the opening of new markets left unattended following the restrictions imposed by Asian exporters. Furthermore, the pandemic became an opportunity to highlight the importance of the sector and encourage governments to implement a series of policies to support the sector, which we also compiled and analyzed in the framework of this work (Urioste et al., 2020).
These results were disseminated through two regional webinars, one focused on the presentation of preliminary results and complemented by the opinions of three regional rice experts, with almost 600 participants from 25 different countries. A final report was prepared and disseminated through FLAR and the Alliance network and displayed in a specific section of the Rice Observatory, the COVID-19 Information Hub for the Rice Sector. In fact, the good acceptance of this initiative prompted FLAR partners to request a second survey of information 1 year after its publication in order to capture the impacts that the pandemic has had over the past year and to be able to contrast the information with official statistics on production and commercialization, which to date are already available for most of these countries. We also intend to scale up this sectorial monitoring initiative as an annual exercise for the updating and presentation of data by the Rice Observatory. The objective is to produce an annual report that addresses specific topics, a methodology that is also expected to be scaled up to the other Observatories to generate research products that can be useful at different levels.
The Observatories have worked as a platform to display and link research conducted by multidisciplinary teams within FLAR and the Alliance Bioversity-CIAT. The Rice Observatory presents information exclusively generated by FLAR researchers interested in measuring grain quality. Thanks to their collaborative research network, it was possible to collect samples of the different improved varieties of rice in the region. These samples were analyzed by FLAR's Rice Quality Laboratory to determine their main attributes in terms of appearance, grain quality, and indirect rice culinary quality. Those results are displayed in the consumption section, presenting a catalog of 125 varieties from 16 countries.
For the sampled varieties, there are multiple quality indicators such as grain size and shape (length-width ratio), chalkiness, gelatinization temperature, and amylose content, variables that have their own scale of interpretation and contribute to understanding the quality of the rice consumed in the region and comparing improved varieties among the different countries. The variety comparator allows the comparison of grain quality attributes between two varieties in the catalog, not only for comparing categories of variables but also between variables. In addition, scientists collected an extensive repository of quality norms and standards that each member country has for rice. This information is helpful to identify consumer preferences and understand the quality of improved varieties to help producers, consumers, and industry select varieties with higher quality.
Meanwhile, units such as Foresight and Applied Economics for Impact constantly update adoption information on improved varieties. Data collected through our monitoring survey (EMSAL) and diverse open-access datasets are presented through national Rice Briefs that characterize the rice sector nationally. They consider seven key aspects: context of the crop and economic relevance at the national level, production, industry, consumption, policies, technologies, and the most relevant institutions for the rice sector (Urioste et al., 2018; Andrade et al., 2019; Marín et al., 2019a).
Juxtaposing the improved quality of varieties and adoption indicators helps to link producer and consumer preferences to bring lessons for rice breeding programs. This information is usually difficult to collect and access from public information sources. However, the Rice Observatory works to bring valuable information to multiple actors in order to interconnect the grain quality characteristics of the most adopted varieties for Colombia, Peru, and Uruguay for which we have information published in the Rice Observatory (Figure 4). From this, it is evident that a transition exists from adopted varieties and quality indices. In the span of 5 years (from 2014 to 2019), Colombian farmers migrated from Fedearroz 174 and 473 toward Fedearroz 67 and 68, which have higher quality indices for appearance and culinary attributes.
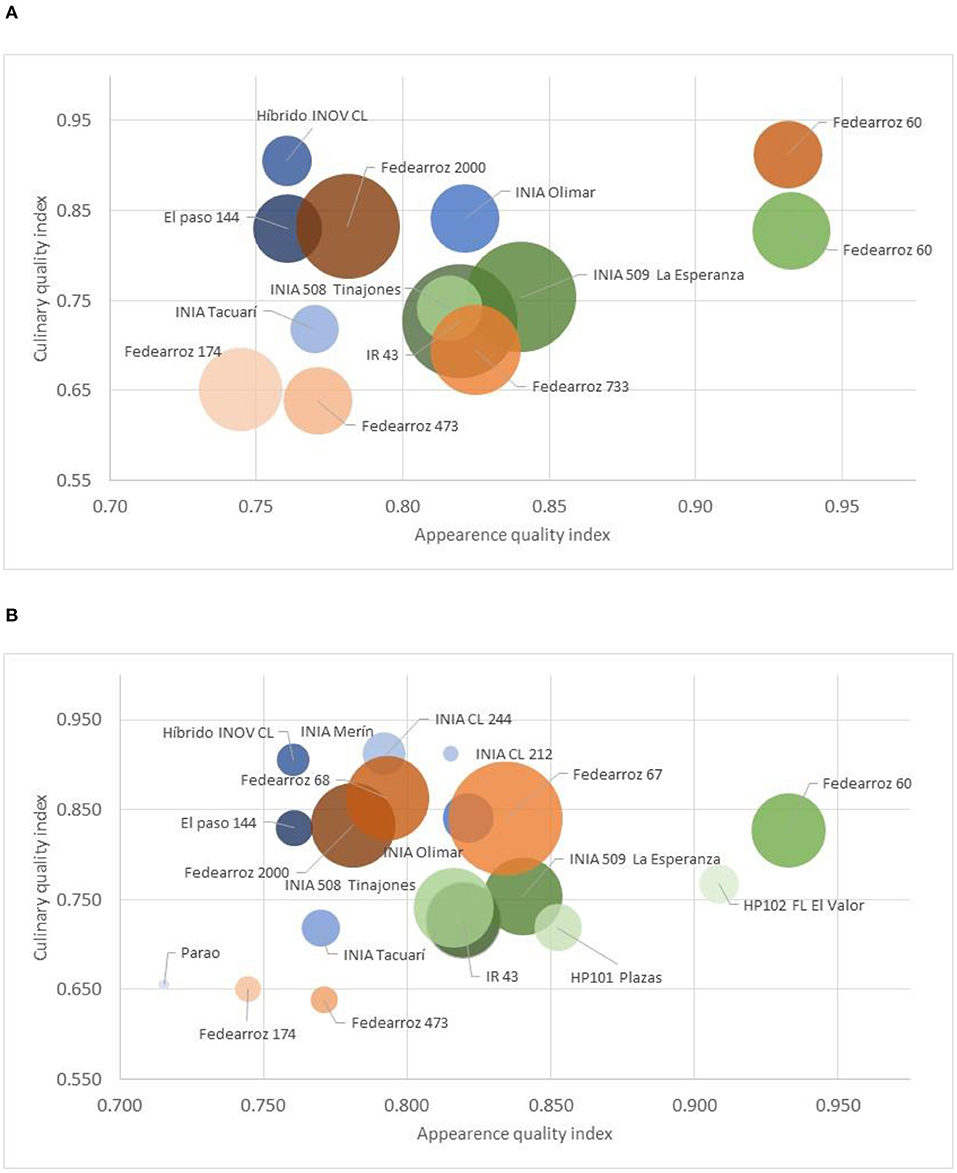
Figure 4. Quality and adoption of improved varieties in Peru, Uruguay, and Colombia, 2014 and 2019. (A) Improved varieties adopted in 2014 and grain qualitya. (B) Improved varieties adopted in 2019 and grain qualitya. a Grain quality is calculated in two indices: (i) culinary quality and (ii) appearance quality. Culinary quality is the combination from amylose content and gelatinization temperature. Appearance index is the result of combining chalkiness index, length, and length-width relation. Bubble size represents hectares planted by each variety. Varieties used in Colombia are coded orange, those in Uruguay are coded blue, and those in Peru are coded green.
Moreover, the Observatories are built upon large networks of public-private-international partners, which are not only a source of information but also extend the network of final end-users that become involved in the data analysis presented by the Observatories, hence helping to reach a wider audience, including all types of stakeholders of the different value chains. The duality of the observatory members is relevant, and we are continuously promoting the inclusion of new partners. Currently, the main body of active partners is located in LAC thanks to the support of FLAR, while we expect to add new members in other regions as the other Observatories gain traction and become established. We are exploiting the network strengths that the CGIAR has built for decades. For instance, for the Common Bean Observatory, we expect to link all the PABRA network, one of the largest research networks in sub-Saharan Africa for common beans. Furthermore, we expect to connect the Cassava Lighthouse with all the strategic partners of the Cassava Breeding Program (Figure 5).
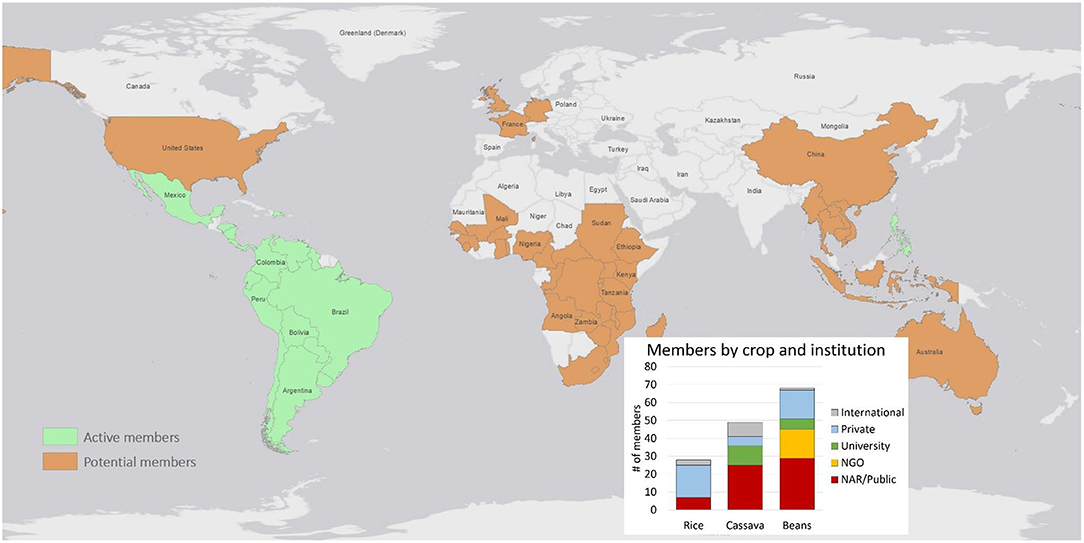
Figure 5. Countries where active and potential observatory partners are located by crop and type of institution, 2021.
For the specific example of rice, FLAR brings together diverse organizations (28) that represent 16 countries. All members of this observatory are interested in improving the competitiveness and sustainability of rice production systems by providing technologies to their partners, mainly advanced lines of improved germplasm. These objectives align with the interest of the Observatories and contribute to establishing a yearly rice monitoring initiative in the region, with the intent to monitor and help to identify relevant research topics that can contribute to rice producers. The monitoring survey was implemented the first time in 2014 and, up to now, it has helped to collect a set of 34 variables.
In addition to the monitoring strategy across the members' network, the observatory is working hard to display more in-depth information on rice production through diverse household survey datasets that have been collected through diverse efforts. One particular example was the collaborative effort between the Ministry of Agriculture and the National Agricultural Research Institute (INIAP, its acronym in Spanish) of Ecuador to characterize rice production in Ecuador using diverse dataset resources to evaluate whether crop management was changing (Marín et al., 2019b). The Observatory in some cases are consolidated as the only sources of open-access information on rice cultivation nationally with that level of aggregation. The Observatory became the axis of these data collection efforts to display and deploy relevant information. Some members are currently interested in implementing large initiatives to have monitoring systems at the producers' level that can provide rapid lessons from what is happening in farmers' fields.
Thus, the Observatory aims at not only showing the information that has been collected among all the sources, but also at producing additional analyses with this information that can be translated into better information for users, including farmers. This is how the Rice Observatory became a web platform managed and funded by the Alliance, RICE-CRP, and FLAR. It relies on diverse member organizations with a wide range of stakeholders and open-data sources containing crop-specific information, and multidisciplinary teams that include economists, software engineers, agronomists, food scientists, plant breeders, and communication experts.
The Crop Observatories became an experimental laboratory in which data and analysis fuse to provide multiple data-driven lessons for diverse stakeholders for each crop sector, from scientists to policymakers, and from farmers to consumers. The Observatories, aim to identify the relevance of crops in relation to diets, markets, research agendas, climate change, or in relation to other crops. There is a lot of room for further strengthening, since these are just examples of the potential that the Observatories have. Nonetheless, multiple lessons still require work and further discussion.
Amid the large number of open-data initiatives, discrepancies may arise between databases presenting the same information. For example, Liu et al. (2018) compared country-level cropland areas between FAOSTAT estimates and European Space Agency Climate Change Initiative data, finding substantial differences for many countries between sources. Similar conclusions were found by (Pérez-Hoyos et al. 2017), who compared different land cover datasets to examine their potential and accuracy in providing results suitable for monitoring crop areas. Therefore, the question arises as to how to assess the quality of the data presented in the Observatories and, in cases in which differences arise between databases, to know how to choose the best available data.
The Observatories still need to build a digitally enabled environment, meaning the development of data and application infrastructure, thus platforms and standards that could facilitate the integration and interoperability of initiatives (Porciello et al., 2021). Consequently, existing infrastructure should be harnessed by making it more collaborative and open (Janssen et al., 2017; Wolfert et al., 2017; Porciello et al., 2021), with improved data management practices that increase the value of data properly stored, described, integrated, and shared (Harper et al., 2018). Although the Observatories have now entered into a process of automation and harmonization of information to make it FAIRer, there are still many opportunities for improvement.
It is important to generalize the best data management practices as standard operating procedures in the Observatories to ensure clear dissemination of the delivered analysis (Janssen et al., 2017; Majumdar et al., 2017), along with periodic communication and transparency between all actors involved (Harper et al., 2018). These actions could be leveraged and further supported by existing global platforms for open data in agriculture, such as the CGIAR Big Data Platform, GODAN, G.E.M.S.®, and Agricultural Innovation Systems (Klerkx et al., 2010).
Moreover, to reach these objectives, it is essential to have human capital with excellent data management skills (Lindblom et al., 2017; Harper et al., 2018). Herein lies the need to provide spaces for updating and transferring the knowledge generated in these processes. On the other hand, the same need to integrate data from diverse sources of information and nature requires concerted work with a transdisciplinary and participatory approach. This to encompass methods for collaborative development and reach a consensus that can translate the data into applications with an impact on society at different levels.
This collaboration should take place not only between scientists of different disciplines but also by integrating other stakeholders such as farmers' associations, industry, service developers, and, more importantly, the final users, particularly smallholders. The authors stressed this multi-stakeholder integration as an essential factor to unleash the full potential and intensification of open data in agriculture, suggesting their participation, not only as passive recipients of technologies but also as co-shapers of these (Janssen et al., 2017; Lindblom et al., 2017; Harper et al., 2018; van der Burg et al., 2019). Thus, it is important to prioritize smallholders, who are the most vulnerable and least likely to benefit from the spillovers of these initiatives if not properly designed and scaled.
Another important lesson relates to funding for the Observatories. Although the Observatories are fed with open data and even support their infrastructure on open-source platforms, their development and maintenance require resources, which implies the need to find sustainable funding models that allow for their long-term sustainability. The scientists behind the development of these platforms have to develop products and functionalities that respond to the current interests of the funders and, more importantly, the end-users. This is in addition to the crossroads of providing information that is as open as possible, which limits funding schemes with which the cost of the observatory development falls, in part, on the end-users (pay-per-view information).
It is relevant to bear in mind that the existence of the Observatories is based on data, so guaranteeing a constant supply of this information is key. Developing business models that are attractive enough for solution providers but that also enable a fair share between the different stakeholders, highlighting the openness of platforms as a tool to empower farmers in their position in supply chains, is really important (Wolfert et al., 2017). Big potential also exists in building business models through producers' associations, considering them as an important source of data and a considerable share of potential users, in addition to the development of public-private-international partnerships to build and maintain national databases that facilitate data sharing, with software products with simple ownership licenses to avoid curtailing initiatives by bureaucracy and other limitations (Janssen et al., 2017; Porciello et al., 2021).
The Observatories need to ensure their operability, thus increasing analytical capability and the possibility of integrating with other data initiatives, in addition to implementing big data analytics for data management and processing. For this end, it is important to define clear and complete ontologies for better data integration (e.g., AGROVOC from FAO, CABI's Thesaurus, and the CGIAR crop ontology). The use of visual analytics, a branch of computer science that blends analytical algorithms with data management, visualization, and interactive visual interfaces, is also recommended. Furthermore, it is important to increase forecasting capabilities and integration with agroclimatic advisory services for early warning systems, instead of many ex-post analyses that are currently performed on historical data. The content and interface of the Observatories need to become increasingly pragmatic and actionable, with clear relevance to public and private sector incentives.
In summary, this article presents a brief review of open data initiatives and the use of big data for agricultural development, as well as their limitations in terms of access among the various actors in the value chains, with emphasis on the limitations faced by small producers. Crop Observatories are presented as one alternative, among many, where diverse efforts are integrated with a transdisciplinary approach, taking into account a wide variety of stakeholders in the process. The results of this collaboration translate not only into the construction of relevant indicators to contextualize the importance of the crop, but go beyond that by integrating diverse initiatives, sources of information and actors to achieve results that would otherwise be difficult to articulate. The list of opportunities is as long as the list of challenges to be faced, but this means room for improvement. Similar initiatives can learn from the experience, and it is hoped that it will serve as a basis for attracting the interest of decision-makers in other crops.
Where is my crop? Perhaps the answer to this question is not limited to a location in space. Harnessing the power of open data and collaborative, multidisciplinary research can give us a better perspective on answers to it. By avoiding missing the forest for the trees, Observatories have the potential to become a data-fueled beacon of information, a space where diverse stakeholders come together to share, learn, and create, always with an eye toward making better data-driven decisions. Despite the crossroads of challenges agriculture faces in catching up to this digital revolution, the potential benefits of this new wave can change food systems forever, and for the better. The great challenge lies in how to make these benefits reach the most vulnerable.
The datasets presented in this study can be found in online repositories. The names of the repository/repositories and accession numbers can be found in the article/Supplementary Material.
RA conceptualized the study. SU, TR, BS, and FN contributed to conception and design of the study. RA, SU, and TR organized data used. RA, SU, and TR organized data used, perform analysis, and wrote the first draft of the manuscript. BS, FN, JV, LM, KL, and CG wrote sections of the manuscript. All authors contributed to manuscript revision, read, and approved the submitted version.
The observatories result from financial support from the Alliance Bioversity-International Center for Tropical Agriculture (CIAT), the Latin American Fund for Irrigated Rice (FLAR), and the CGIAR Research Programs on Rice Agri-Food Systems (RICE-CRP) and Roots, Tubers and Bananas (RTB-CRP). The authors of this article acknowledge key support from an extended multidisciplinary team that has contributed to conceptualizing and developing the Crop Observatories.
The authors declare that the research was conducted in the absence of any commercial or financial relationships that could be construed as a potential conflict of interest.
All claims expressed in this article are solely those of the authors and do not necessarily represent those of their affiliated organizations, or those of the publisher, the editors and the reviewers. Any product that may be evaluated in this article, or claim that may be made by its manufacturer, is not guaranteed or endorsed by the publisher.
We acknowledge Jean Carlo Balanta, Luis Augusto Becerra, Byron Campaz, Ximena Escobar, Carolina Garcia, Jeffrey Garcia, Elisabetta Gotor, Eduardo Graterol, Daniel Gutierrez, Ricardo Labarta, Derlyn Lourido, Diego Marin, Alejandro Marulanda, Andrea Mona, Jonathan Newby, Victoria Rengifo, David Rodriguez, Joe Tohme, and Ruben Vargas for their continuous support to bringing to life the Crop Observatories.
The Supplementary Material for this article can be found online at: https://www.frontiersin.org/articles/10.3389/fsufs.2021.737528/full#supplementary-material
1. ^Digital divide is the term used to refer to the risk of having potential benefits unequally distributed between sectors and actors of the agricultural sector (e.g., rural vs. urban areas, gender inequality, youth population) (Trendov et al., 2019).
2. ^In the supplemental section (Supplementary Table S1), we present a list of selected open-data sources, repositories, and platforms for agriculture, which we categorized using the main types of initiatives (i.e., databases, repositories, and platforms) and the leading institutions (Supplementary Figure S1).
3. ^The corresponding link to the site is https://www.streak.tech/.
4. ^The corresponding link to the site is https://www.tradestation.com/.
5. ^The corresponding link to the site is https://www.tradingview.com/.
6. ^FAIR measures are defined from the principles of Findable, Accessible, Interoperable, and Reusable (Wilkinson et al., 2016, 2018). The specific measurement procedure is described in detail in GARDIAN Fair metrics available at CGIAR (2021b).
7. ^This method allows consulting information between the server and client to retrieve the information requested.
Allemang, D., and Bobbin, T. (2016). A Global Data Ecosystem for Agriculture and Food. Wallingford: F100Research.
Andrade, R., Lopera, D., Rivera, T., Urioste, S., Tohme, J., and Gonzáles, C. (2021). Investing Wisely to End Hunger and Strengthen Agriculture, With No Region Left Behind. Cali: Latin America Policy.
Andrade, R., Marín, D., Graterol, E., Mogollón, P., Sánchez, R., and Labarta, R. (2019). Boletín informativo del Sector Arrocero Colombia 2005–2018. Cali: CIAT.
Antognoli, E., Sears, J., and Parr, C. (2017). Inventory of Online Public Databases and Repositories Holding Agricultural Data in 2017. Beltsville: Ag Data Commons.
Aristizábal, J., and Sánchez, T. (2007). Guía técnica para producción y análisis de almidón de yuca. Rome, Italy: Food and Agriculture Organization of the United Nations (FAO).
Birch, K., Cochrane, D. T., and Ward, C. (2021). Data as asset? The measurement, governance, and valuation of digital personal data by Big Tech. Big Data Soc. 8:20539517211017308. doi: 10.1177/20539517211017308
Boyd, D., and Crawford, K. (2012). Critical questions for big data: Provocations for a cultural, technological, and scholarly phenomenon. Inf. Commun. Soc. 15, 662–679. doi: 10.1080/1369118X.2012.678878
Burra, D. D (2019). “Unpacking the data driven digital revolution,” in E-Agriculture in Action: Big Data for Agriculture, ed G. Sylvester (Bangkok: Food and Agriculture Organization of the United Nations and the International Telecomunicacion Union), 25–35.
Ceballos, H., Hershey, C., and Becerra-López-Lavalle, L. A. (2012). New approaches to cassava breeding. Plant Breed. Rev. 36, 427–504. doi: 10.1002/9781118358566.ch6
CGIAR (2021a). About the Platform—Using Big Data to Solve Problems Faster, Better and at Greater Scale. Montpellier: Platform Big Data Agriculture, 1.
De Bruijn, G. H., and Fresco, L. O. (1989). The importance of cassava in world food production. Netherlands J. Agric. Sci. 37, 21–34. doi: 10.18174/njas.v37i1.16651
Downie, N., Timberg, E., Kurkela, J., McCann, B., Linsley, T., Brunel, S., et al. (2021). Chart.js Version 2.8.0. Chart.js GitHub.
European Commission (2021). Agri-food data portal. Policies Inf. Serv. Available online at: https://agridata.ec.europa.eu/extensions/DataPortal/home.html (accessed June 22, 2021).
FAO (2017). Building Agricultural Market Information Systems: A Literature Review. Rome: Food and Agriculture Organization of the United Nations—Policy Support and Governance Gateaway Available online at: http://www.fao.org/policy-support/tools-and-publications/resources-details/en/c/1105289/ (accessed June 21, 2021).
FAO (2020a). Global Information and Early Warning System on Food and Agriculture (GIEWS). Available online at: http://www.fao.org/giews/background/en/ (accessed June 21, 2021).
FAO (2020b). WaPOR V2 Quality Assessment: Technical Report on the Data Quality of the WaPOR FAO Database Version 2. Rome: FAO.
FAO (2021b). FAO STAT. Rome: FAO. Available at: http://www.fao.org/faostat/en/#data (accessed June 22, 2021).
FAO (2021c). Farm Data Management, Sharing and Services for Agriculture Development. Rome, Italy: Food and Agriculture Organization of the United Nations (FAO).
FAO (2021d). Food Price Monitoring and Analysis (FPMA) Tool 3—User Manual. Rome: FAO. Available online at: https://fpma.apps.fao.org/giews/food-prices/tool/public/#/home (accessed June 22, 2021).
FAO (2021e). Hand-in-Hand Geospatial Platform. Rome: Food Agriculture Organisation, United Nations—Hand Hand Initiat. Available online at: http://www.fao.org/hih-geospatial-platform/en/about/index (accessed June 22, 2021).
Harper, L., Campbell, J., Cannon, E. K. S., Jung, S., Poelchau, M., Walls, R., et al. (2018). AgBioData consortium recommendations for sustainable genomics and genetics databases for agriculture. Database 2018:bay088. doi: 10.1093/database/bay088
Humann, J. L. S., Jung Cheng, C.-H., P, Z., M, F., D, M., et al. (2019). “Cool season food legume genome database: a resource for pea, lentil, faba bean and chickpea genetics, genomics and breeding,” in Proceedings of the International Plant and Animal Genome Conference: January 2019 (San José, CA). Available online at: https://plan.core-apps.com/pag_2019/event/ae69bfc5ae79642295415d7eb494b0f3 (accessed June 17, 2021).
IFPRI (2021). COVID-19 Policy Response (CPR) Portal. Montpellier: Food Security Portal, International Food Policy Research Institute. Available online at: https://www.foodsecurityportal.org/tools/COVID-19-policy-response-cpr-portal (accessed June 22, 2021).
IFPRI FAO IDB, OECD, The World Bank. (2019). International Organisations Consortium for Measuring the Policy Environment for Agriculture. Ag Incent. Available online at: http://www.ag-incentives.org/content/about-us (accessed June 22, 2021).
Janssen, S. J. C., Porter, C. H., Moore, A. D., Athanasiadis, I. N., Foster, I., Jones, J. W., et al. (2017). Towards a new generation of agricultural system data, models and knowledge products: information and communication technology. Agric. Syst. 155, 200–212. doi: 10.1016/j.agsy.2016.09.017
Joglekar, A. B., Pardey, P. G., and Sichra, U. W. (2016). Where in the World are Crops Grown? Saint Paul, United States: Harvest-Choice.
Johnson, A., Jack, P., Parmer, C., and Sundquist, M. (2021). Plotly JavaScript Open Source Graphing Library. Plotly.js GitHub, 1.
Kamilaris, A., Kartakoullis, A., and Prenafeta-Boldú, F. X. (2017). A review on the practice of big data analysis in agriculture. Comput. Electron. Agric. 143, 23–37. doi: 10.1016/j.compag.2017.09.037
King, G (2007). An introduction to the dataverse network as an infrastructure for data sharing. Sociol. Methods Res. 36, 173–199. doi: 10.1177/0049124107306660
Klerkx, L., Aarts, N., and Leeuwis, C. (2010). Adaptive management in agricultural innovation systems: the interactions between innovation networks and their environment. Agric. Syst. 103, 390–400. doi: 10.1016/j.agsy.2010.03.012
Lake, P., and Crowther, P. (2013). “Data, An Organisational Asset,” in Concise Guide to Databases: A Practical Introduction, eds P. Lake and P. Crowther (London: Springer), 3–21. doi: 10.1007/978-3-030-42224-0_1
Lindblom, J., Lundström, C., Ljung, M., and Jonsson, A. (2017). Promoting sustainable intensification in precision agriculture: review of decision support systems development and strategies. Precis. Agric. 18, 309–331. doi: 10.1007/s11119-016-9491-4
Lioutas, E. D., Charatsari, C., La Rocca, G., and De Rosa, M. (2019). Key questions on the use of big data in farming: An activity theory approach. NJAS Wageningen J. Life Sci. 90–91:100297. doi: 10.1016/j.njas.2019.04.003
Liu, X., Yu, L., Li, W., Peng, D., Zhong, L., Li, L., et al. (2018). Comparison of country-level cropland areas between ESA-CCI land cover maps and FAOSTAT data. Int. J. Remote Sens. 39, 6631–6645. doi: 10.1080/01431161.2018.1465613
Magesa, M. M., Michael, K., and Ko, J. (2014). Agricultural Market Information Services in Developing Countries: A Review. Available online at: www.ACSIJ.org (accessed June 21, 2021).
Majumdar, J., Naraseeyappa, S., and Ankalaki, S. (2017). Analysis of agriculture data using data mining techniques: application of big data. J. Big Data 4, 1–15. doi: 10.1186/s40537-017-0077-4
Manyika, J., Ramaswany, S., Khanna, S., Sarrazin, H., Pinkus, G., and Sethupathy, G. (2015). Digital America: A Tale of Haves and Have-Mores. Washington D.C., United States: McKinsey Global Institute.
Marín, D., Terra, J., Ibarra, L., Urioste, S., Lago, F., Sanguinetti, M., et al. (2019a). Boletín Informativo del Sector Arrocero Uruguay 2005–2017. Cali, Colombia.
Marín, D., Urioste, S., Celi, R., Castro, M., Perez, P., Aguilar, D., et al. (2019b). Caracterización del sector arrocero en Ecuador 2014–2019 : ‘Está cambiando el manejo del cultivo? Cali, Colombia.
McCarthy, F. M., Bridges, S. M., Wang, N., Magee, G. B., Williams, W. P., Luthe, D. S., et al. (2007). AgBase: a unified resource for functional analysis in agriculture. Nucleic Acids Res. 35, D599–D603. doi: 10.1093/nar/gkl936
Michigan State University (2021). Database List: Agriculture. MSU Library Database List. Available online at: https://libguides.lib.msu.edu/az.php?s=21413 (accessed June 21, 2021).
Narayan, A., Eskandar, H., and Biggs, P. (2019). “Big data: a shift in paradigm towards digital agriculture,” in E-Agriculture in Action: Big Data for Agriculture, ed. G. Sylvester (Bangkok, Thailand: Food and Agriculture Organization of the United Nations and the International Telecomunicacion Union), 11–24.
Pérez-Hoyos, A., Rembold, F., Kerdiles, H., and Gallego, J. (2017). Comparison of global land cover datasets for cropland monitoring. Remote Sens. 9:1118. doi: 10.3390/rs9111118
Piestrak, J (2020). “Data Sources,” in Agriculture Data Users Guide. Available online at: https://guides.library.cornell.edu/ag-food-data-guide/ag-food-data-sources (accessed June 21, 2021).
Porciello, J., Coggins, S., Otunba-Payne, G., and Mabaya, E. (2021). A Systematic Scoping Review: How are farmers using digital services in low-and middle-income countries? Available online at: https://agricultureinthedigitalage.org/ (accessed May 24, 2021).
Protopop, I., and Shanoyan, A. (2016). Big data and smallholder farmers: big data applications in the agri-food supply chain in developing countries. Int. Food Agribus. Manag. Rev. 19, 173–190. doi: 10.22004/ag.econ.240705
Rotz, S., Duncan, E., Small, M., Botschner, J., Dara, R., Mosby, I., et al. (2019). The politics of digital agricultural technologies: a preliminary review. Sociol. Ruralis 59, 203–229. doi: 10.1111/soru.12233
Sakai, H., Lee, S. S., Tanaka, T., Numa, H., Kim, J., Kawahara, Y., et al. (2013). Rice annotation project database (RAP-DB): an integrative and interactive database for rice genomics. Plant Cell Physiol. 54:e6. doi: 10.1093/pcp/pcs183
Sylvester, G (2019). “Data driven agriculture: the big data phenomenon,” in E-Agriculture in Action: Big Data for Agriculture, ed G. Sylvester (Bangkok, Thailand: Food and Agriculture Organization of the United Nations and the International Telecomunicacion Union), 1–9.
Tello-Ruiz, M. K., Naithani, S., Gupta, P., Olson, A., Wei, S., Preece, J., et al. (2021). Gramene 2021: harnessing the power of comparative genomics and pathways for plant research. Nucleic Acids Res. 49, D1452–D1463. doi: 10.1093/nar/gkaa979
Thudi, M., Palakurthi, R., Schnable, J. C., Chitikineni, A., Dreisigacker, S., Mace, E., et al. (2021). Genomic resources in plant breeding for sustainable agriculture. J. Plant Physiol. 257:153351. doi: 10.1016/j.jplph.2020.153351
Tollefson, J (2018). Big-data project aims to transform farming in world's poorest countries. Nature 3:57. doi: 10.1038/d41586-018-06800-8
Trendov, N. M., Varas, S., and Zeng, M. (2019). Digital technologies in agriculture and rural areas. Rome: FAO.
UMN (2021). About Us GEMS Data-Driven Agricultural Innovation. St. Paul: College of Food, Agricultural and Natural Resource Sciences (CFANS), Minnesota Supercomputing Institute, Computer Science Engineering, p
Urioste, S., Marín, D., Andrade, R., Graterol, E., and Labarta, R. (2018). Boletín informativo del sector arrocero Peru 2005–2018. Cali, Colombia.
Urioste, S. A., Graterol Matute, E., Álvarez, M. F., Tohme, J., Escobar, M. X., and González, C. (2020). Efecto de la pandemia del COVID-19 en el sector arrocero de América Latina y El Caribe : Un diagnóstico participativo. Palmira, Colombia.
USDA (2021). Data Visualizations. U.S. Department Agriculture—Economical Research Service. Available online at: https://www.ers.usda.gov/data-products/data-visualizations/ (accessed June 22, 2021).
Utsumi, Y., Sakurai, T., Umemura, Y., Ayling, S., Ishitani, M., Narangajavana, J., et al. (2012). RIKEN Cassava initiative: establishment of a cassava functional genomics platform. Trop. Plant Biol. 5, 110–116. doi: 10.1007/s12042-011-9089-y
van der Burg, S., Bogaardt, M. J., and Wolfert, S. (2019). Ethics of smart farming: current questions and directions for responsible innovation towards the future. NJAS Wageningen J. Life Sci. 90–91:100289. doi: 10.1016/j.njas.2019.01.001
van Etten, J., Steinke, J., and van Wijk, M. (2017). How can the Data Revolution contribute to climate action in smallholder agriculture? 30, 44–48. Available online at: https://hdl.handle.net/10568/81375
Villarino, M. E. J., Da Silva, M., Becerra Lopez-Lavalle, L. A., and Castro-Nuñez, A. (2020). “Rambo root” to the rescue: How a simple, low-cost solution can lead to multiple sustainable development gains. Conserv. Sci. Pract. 2020, 1–5. doi: 10.1111/csp2.320
Wilkinson, M. D., Dumontier, M., Aalbersberg, I. J., Appleton, G., Axton, M., Baak, A., et al. (2016). Comment: The FAIR Guiding Principles for scientific data management and stewardship. Sci. Data 3, 1–9. doi: 10.1038/sdata.2016.18
Wilkinson, M. D., Sansone, S. A., Schultes, E., Doorn, P., Da Silva Santos, L. O. B., and Dumontier, M. (2018). Comment: A design framework and exemplar metrics for FAIRness. Sci. Data 5, 7–10. doi: 10.1038/sdata.2018.118
Wolfert, S., Ge, L., Verdouw, C., and Bogaardt, M. J. (2017). Big data in smart farming—a review. Agric. Syst. 153, 69–80. doi: 10.1016/j.agsy.2017.01.023
World Bank (2021). The World Bank. World Bank, p 1. Available online at: www.worldbank.org (accessed June 23, 2021).
Yang, Z., Zhang, C., Zhao, H., and Sun, Z. (2021). Crop-CASMA user's guide. Available online at: https://nassgeo.csiss.gmu.edu/Crop-CASMA-User/user/introduction/ (accessed June 22, 2021).
Zhai, Z., Martínez, J. F., Beltran, V., and Martínez, N. L. (2020). Decision support systems for agriculture 4.0: survey and challenges. Comput. Electron. Agric. 170, 1–16. doi: 10.1016/j.compag.2020.105256
Keywords: agricultural indicators, open-access datasets, cassava, rice, Crop Observatories
Citation: Andrade R, Urioste S, Rivera T, Schiek B, Nyakundi F, Vergara J, Mwanzia L, Loaiza K and Gonzalez C (2021) Where Is My Crop? Data-Driven Initiatives to Support Integrated Multi-Stakeholder Agricultural Decisions. Front. Sustain. Food Syst. 5:737528. doi: 10.3389/fsufs.2021.737528
Received: 07 July 2021; Accepted: 11 November 2021;
Published: 03 December 2021.
Edited by:
Tim Pagella, Bangor University, United KingdomReviewed by:
Elena Lioubimtseva, Grand Valley State University, United StatesCopyright © 2021 Andrade, Urioste, Rivera, Schiek, Nyakundi, Vergara, Mwanzia, Loaiza and Gonzalez. This is an open-access article distributed under the terms of the Creative Commons Attribution License (CC BY). The use, distribution or reproduction in other forums is permitted, provided the original author(s) and the copyright owner(s) are credited and that the original publication in this journal is cited, in accordance with accepted academic practice. No use, distribution or reproduction is permitted which does not comply with these terms.
*Correspondence: Robert Andrade, ci5zLmFuZHJhZGVAY2dpYXIub3Jn
Disclaimer: All claims expressed in this article are solely those of the authors and do not necessarily represent those of their affiliated organizations, or those of the publisher, the editors and the reviewers. Any product that may be evaluated in this article or claim that may be made by its manufacturer is not guaranteed or endorsed by the publisher.
Research integrity at Frontiers
Learn more about the work of our research integrity team to safeguard the quality of each article we publish.