 Monica Chaudhry
 Lindsay M. Jaacks
 Monu Bansal
 Palak Mahajan
 Ayushi Singh
 Shweta Khandelwal
- 1Public Health Foundation of India, Gurugram, India
- 2Global Academy of Agriculture and Food Security, The University of Edinburgh, Midlothian, United Kingdom
Data on food environments in India and other low- and middle-income countries are scarce. The objective of this study was to assess the four dimensions of the external domain of food environments (availability, price, vendor and product properties, and marketing) in food establishments in the National Capital Region of India. The assessment focused on fruits, vegetables, and ultra-processed foods. The 60 food establishments surveyed were categorized as stores, restaurants, or mobile food vendors. Only 13.3% of food establishments sold fruits and vegetables. Stores were more likely to sell vegetables than mobile food vendors (14.8 vs. 6.2%, respectively) and sold a greater variety of both fruits and vegetables as compared to mobile food vendors [mean (SD) of 8.6 (3.2) fruits and 18.6 (9.2) vegetables available at stores vs. 5.5 (5.7) fruits and 25 vegetables available at the one mobile food vendor who sold vegetables]. However, these healthy food items were more expensive at stores. The availability (100% of stores, 12.5% of mobile food vendors, and 12.5% of restaurants) and variety (156 types) of ultra-processed foods across food establishments were higher than fruits and vegetables. A greater percentage of food establishments displayed advertisements for ultra-processed foods as compared to unprocessed or minimally processed foods such as fruits and vegetables. The National Capital Region of India has an unhealthy food environment. Regulations that limit the availability of ultra-processed foods and improve the availability and affordability of fruits and vegetables are needed to reverse the rising tide of chronic non-communicable diseases in this setting.
Introduction
Healthy dietary changes, including increasing consumption of fruits, vegetables, legumes, and nuts, and reducing consumption of added sugars and red meat, could prevent an estimated 19% of deaths globally (EAT-Lancet Commission on Healthy Diets From Sustainable Food Systems, 2019). However, global dietary patterns are trending in the opposite direction, especially in many low- and middle-income countries (LMICs) such as India (Ronto et al., 2018). As a result of these unhealthy dietary patterns, while undernutrition has declined over the past decade in India, overweight has increased and is emerging as a significant public health challenge (Ministry of Health and Family Welfare Government of India, 2017).
Detailed, nationally representative dietary intake data in India and elsewhere are scarce (Green et al., 2016). Nonetheless, available data suggest that the Indian diet is becoming more calorically dense with a larger share of calories coming from unhealthy foods high in fat and sugar (Shetty, 2002; Green et al., 2016). While carbohydrates still constitute 64% of total energy intake (Ramachandran and Kalaivani, 2018), the proportion of cereals that are coarse cereals has declined from 23 to 6% in rural areas over the past 30 years (Defries et al., 2018). There has also been an increase in dietary salt intake to an average of 11 g per day, far exceeding the World Health Organization's 5 g per day upper limit (Johnson et al., 2017).
Even less is known about the factors influencing these consumption patterns. Given that a majority of food (>80%) is purchased from market sources in India (National Sample Survey Office, 2014), the food environment is likely to play a key role. Turner et al. define the food environment as “the interface that mediates people's food acquisition and consumption within the wider food system” (Turner et al., 2018). They divide the food environment into two domains: external and personal. The personal domain includes the accessibility, affordability, convenience, and desirability of food. The external domain includes the availability, price, vendor and product properties, and marketing of food. Changes in these external food environment characteristics in particular have been implicated as primary drivers of unhealthy dietary patterns in LMICs (Popkin et al., 2012; Ronto et al., 2018). The current paper, therefore, focuses on the external domain of the food environment, specifically market food sources in and around Delhi.
Research on food environments has been conducted in only 22 of 136 LMICs (Turner et al., 2020). Turner et al.'s systematic review of food environment research in LMICs identified six studies from India (Turner et al., 2020). Four of these six studies used qualitative methods (Finzer et al., 2013; Maxfield et al., 2016; Rathi et al., 2016, 2017) and two of the six used quantitative methods (Gupta et al., 2016; Patel et al., 2018). With regards to the latter, one of the studies found high levels of saturated fat in items sold by mobile food vendors in Delhi (Gupta et al., 2016). The other found that adults in Delhi who lived closer to full-service and fast-food restaurants were less likely to consume fruit and more likely to consume refined grains than those who lived further away from these restaurants (Patel et al., 2018).
Since Turner et al.'s systematic review was conducted, four additional studies on food environments in India have been published (Li et al., 2019; Bassi et al., 2020; Ganpule-Rao et al., 2020; Surendran et al., 2020). A cross-sectional study of adolescents in rural Pune found that those living in villages with the highest density of food vendors had a higher body mass index (BMI), waist circumference, and percent body fat (Ganpule-Rao et al., 2020). Similarly, a cross-sectional study of adults living in peri-urban villages of Hyderabad in south India found that adults who lived in neighborhoods with a higher density of highly processed/takeaway food vendors had a higher BMI, waist circumference, and blood pressure (Li et al., 2019). They also found that adults who lived in neighborhoods with a higher density of fruit/vegetable vendors had lower blood pressure (Li et al., 2019). A qualitative study in that same population found that affordability and availability were the most important drivers of fruit and vegetable intake (Surendran et al., 2020). Finally, a study in Delhi found that there is a greater density of unhealthy food vendors outside private schools and colleges compared to public schools and that marketing of foods high in fat, sugar, and salt is more common around private schools compared to public schools (Bassi et al., 2020).
In summary, most previous research on the external food environment in India has focused on availability. However, other aspects including price, vendor and product properties, and marketing are likely to play a role in food choice. The aim of this research was to pilot a more comprehensive assessment of the external food environment including availability, price, vendor and product properties, and marketing. We focused on the capital city region of India and market sources of food given this was a highly urbanized area where own-production and wild harvesting of food are uncommon.
Materials and Methods
Study Setting
The study was conducted in Delhi National Capital Region (NCR) India, which is an inter-state region comprised of the entire National Capital Territory of Delhi and adjoining districts from the surrounding states of Haryana, Rajasthan, and Uttar Pradesh (National Capital Regional Planning Board, 2014). The NCR's total population is about 46 million which is spread over an area of 53,817 km2 (National Capital Region Planning Board Government of India, 2017). Data from the National Family Health Surveys have highlighted a rise in the double burden of malnutrition not only in India but also the National Capital Territory of Delhi where the prevalence of underweight is 17.7% for men and 14.9% for women and the prevalence of overweight is 24.6% for men and 33.5% for women (Ministry of Health and Family Welfare Government of India, 2016). Four NCR areas were selected per convenience for this study: two from Delhi and two from Gurugram in Haryana.
Sampling
The catchment area for survey administration was defined as the circle surrounding the central market with a 1-km radius. For each of the four catchment areas, a comprehensive list of food establishments was generated using Google and other online platforms available for ordering and delivery (Swiggy, https://www.swiggy.com/; Zomato, https://www.zomato.com/; and Food Panda, https://www.foodpanda.com/), and was updated via physical verification. The process of physical verification involved field investigator visits to the four catchment areas to confirm the location and functionality of the food establishments listed online.
Food establishments for this study were defined as facilities that sell food directly to consumers. Food establishments not having any food items, located in access-restricted or inaccessible areas, and those falling outside the selected radius for the respective catchment area were excluded from the list (Figure 1). The total number of food establishments in the final lists (one for each of the four areas) ranged from 146 to 274. Of these, 15 total food establishments were selected from each area via simple random sampling. This sampling was stratified according to the type of food establishment (e.g., stores, restaurants, and mobile food vendors). Given the increased frequency of eating out and consumption of street food from mobile food vendors and convenience food from stores in Asia (Winarno and Allain, 1991), we selected a sample of seven stores, four restaurants, and four mobile food vendors in each area. Thus, 60 food establishments (28 stores, 16 restaurants, and 16 mobile food vendors) out of a total of 796 were selected for surveying across the four areas. The surveying was completed around the monsoon season over a period of 3 months (June, July, and August, 2018).
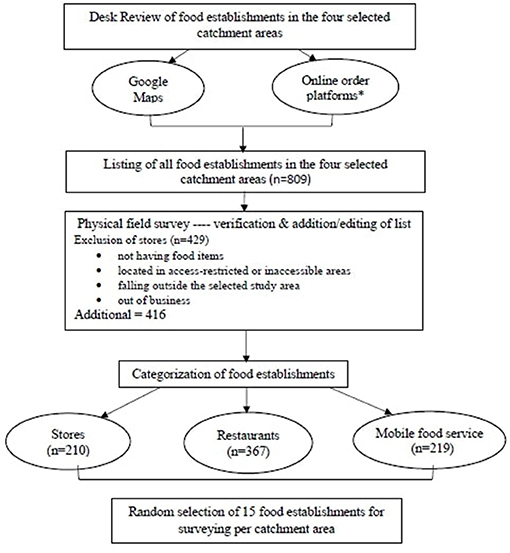
Figure 1. Study sampling. *Online order platforms included Swiggy, Zomato, and Food Panda.
Food establishments surveyed were categorized as stores, restaurants, or mobile food vendors based on a modified version of definitions from the 1997 North American Industrial Classification System (Classification Development Branch, 1997) and the World Bank (International Comparison Program, 2011) (Table 1). Stores were further classified as supermarket chains, large grocery stores, convenience stores, dairies, or pharmacies. Restaurants were further classified as full-service or limited-service.
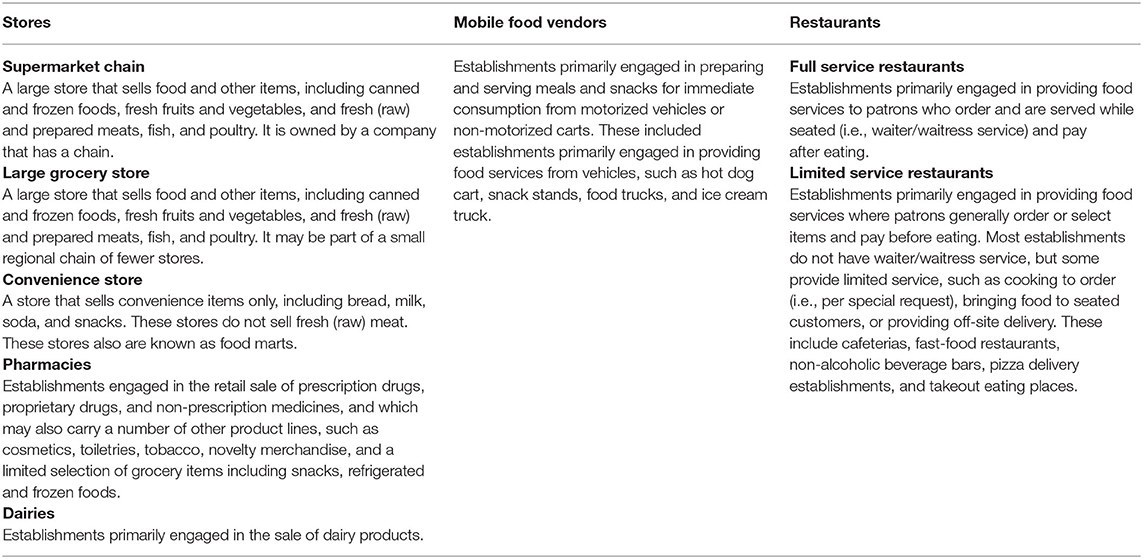
Table 1. Categorization and definition of surveyed food establishments (adapted from North American Industrial Classification System and the World Bank).
Audit Tool
The development of the audit tool involved reviewing the literature on audit tools used to assess the external domain of the food environment. We found no audit tools that had been adapted for use in India. Thus, we started by adapting the most commonly used tool, Glanz et al.'s (2007) Nutrition Environment Measures Survey in Stores, to measure the external food environment factors proposed by Turner et al. (2018) in stores, restaurants, and mobile food vendors in India. Additional questions were taken from other studies conducted by Glanz et al. (2005) and Hua et al. (2014). It took approximately 15 min to complete the survey for small-scale convenience stores, limited-service restaurants, and mobile food vendors, and 25–30 min for supermarket chains, large grocery stores, and full-service restaurants.
Table 2 describes the components of the final version of the audit tool. The first section of the form recorded details on vendor properties, namely, the type of store, and days and timings of operation. The content of the second section differed for stores vs. restaurants and mobile food vendors. For stores and restaurants, we collected information on marketing and promotional messages used outside and inside the food establishment. These included any advertising of food items in the form of images, posters, banners, or paintings displayed outside near the entrance of the establishment or anywhere inside near the cash counter, on the floor, or hanging from the ceiling; the type of foods and beverages near the cash counters in stores and billing area in self-service restaurants; and any promotional offers on foods and beverages.
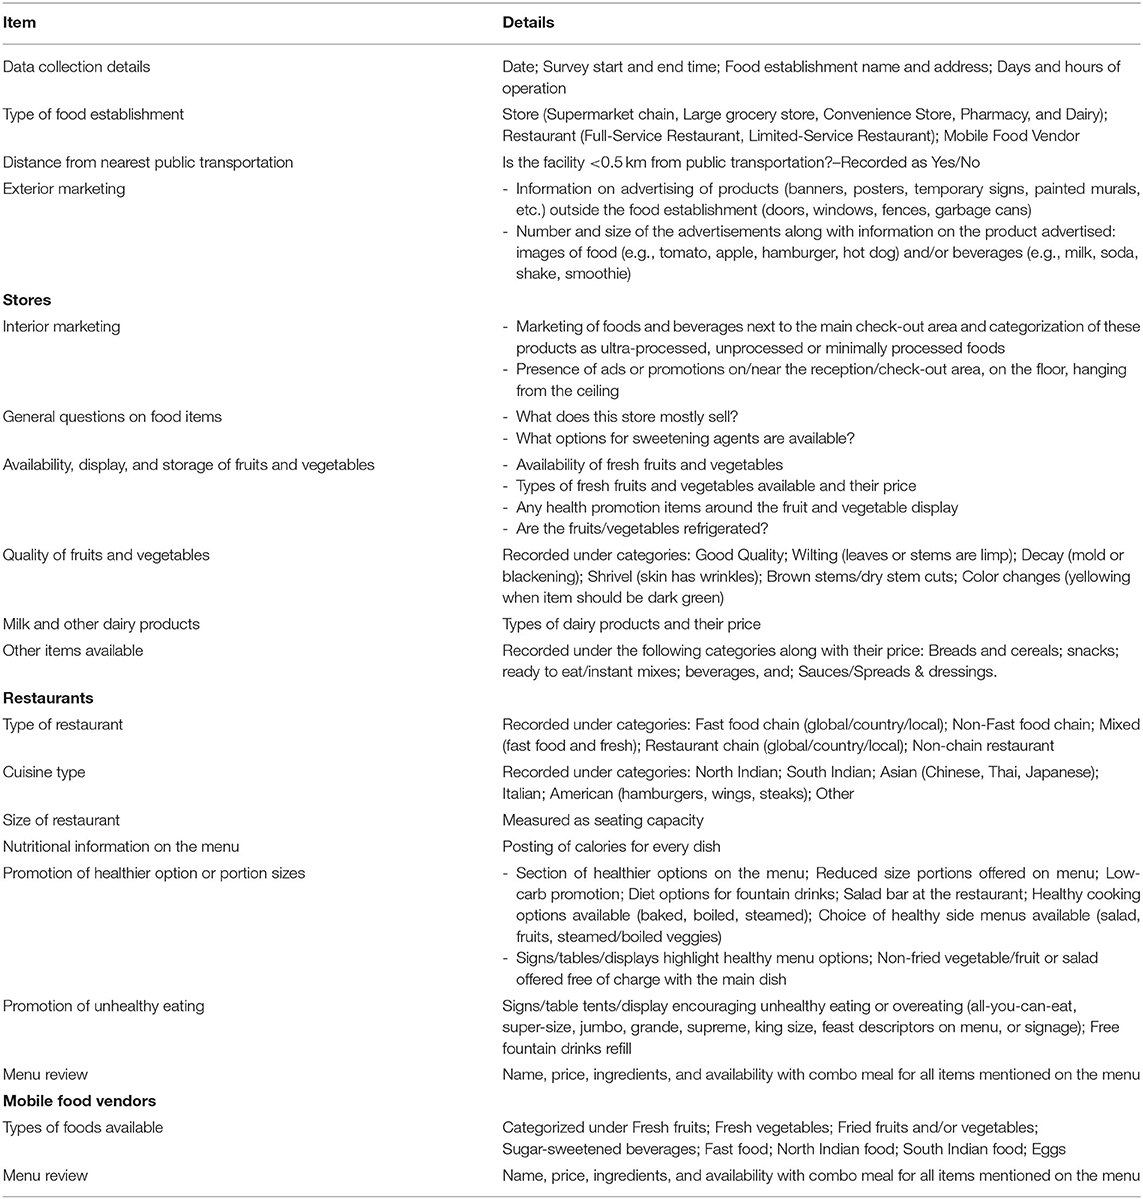
Table 2. Items captured by the survey instrument.
We assessed the level of processing for different foods and categorized them into three groups as defined by Monteiro et al. (2018): (1) unprocessed and minimally processed foods, (2) processed foods, and (3) ultra-processed foods (Table 3). According to Monteiro et al. (2018), “Methods used in the culinary preparation of food at home or in restaurant kitchens are not industrial, by definition.” Thus, for example, a package of frozen samosas produced by industrial processes and purchased from a store was classified as “ultra-processed” but a samosa made from culinary ingredients in a restaurant kitchen was classified as “processed.” Pre-packaged, industrially produced paneer was classified as “ultra-processed” whereas paneer made from scratch was classified as “processed.” Restaurants and mobile food vendors were asked about the preparation technique for cooked items in order to appropriately classify them as “ultra-processed” or “processed.” For all food establishments, we collected availability and price of fruits, vegetables, and ultra-processed foods. In addition, for restaurants and mobile food vendors, we collected the availability and price of processed foods.
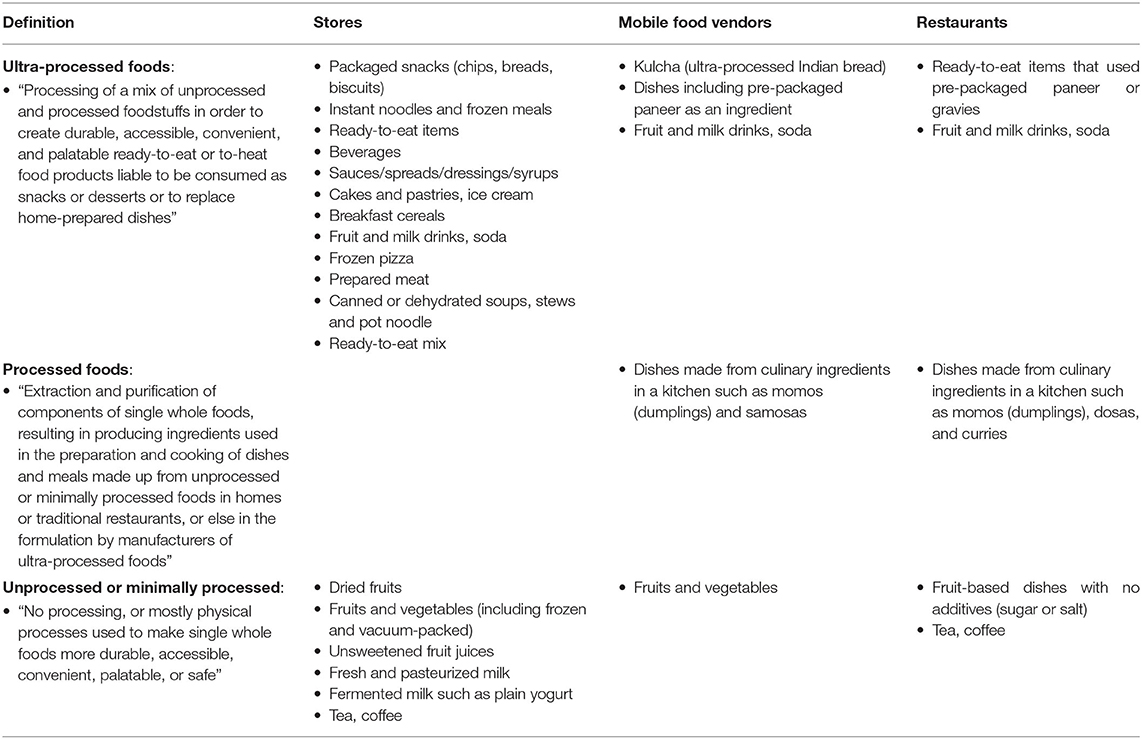
Table 3. Categorization of foods according to level of processing (adapted from Monteiro et al., 2018).
Field Testing
The initial questionnaire was pilot tested in food establishments located around each study area by four trained field investigators (one for each of the four areas). These field investigators were interns with a college education in nutrition, who were trained to record these data as a part of the study. The field testing was carried out in eight stores (in two stores by each field investigator). The testing identified missing details in the survey, the need for correction of wording and content, survey scheduling issues, and concerns raised by clerks at stores during observations. These findings helped in revising the study protocol, the audit tool, and the training materials. The data collected during piloting was not included in the analysis.
Ethical Considerations
Ethical clearance to conduct the study was obtained from the Institutional Ethics Committee of the Public Health Foundation of India (TRC-IEC-375/18). Since the research team only surveyed via direct observation (e.g., no interaction with human subjects), consent was not obtained. However, in situations where items were not on display in stores and menus were not available in restaurants, a letter was presented to the manager of the food establishment to explain the purpose of the study, and his/her verbal consent was obtained.
Statistical Analysis
Descriptive statistics were used to summarize the availability, price, vendor and product properties, and marketing of food items according to food establishment type. All statistics were calculated using SPSS version 21 (IBM Corp, Armonk, NY).
Results
Availability
Only 13.3% of sampled food establishments sold fruits and vegetables (excluding pharmacies because they do not sell fruits and vegetables in Delhi). Fruits were available in only 11.1% of stores and 25.0% of mobile food vendors whereas vegetables were available in 14.8% of stores and 6.2% (only 1) of mobile food vendors (Table 4). Cumulatively, 27 types of fruits (27 in stores, 14 in mobile food vendors) and 43 types of vegetables (35 in stores, 24 in mobile food vendors) were available with a mean (SD) of 8.6 (3.2) fruits and 18.6 (9.2) vegetables available at stores and 5.5 (5.7) fruits and 25 vegetables available at the one mobile food vendor who sold vegetables. The types of fruits and vegetables available varied between stores and mobile food vendors (Supplementary Table 1).
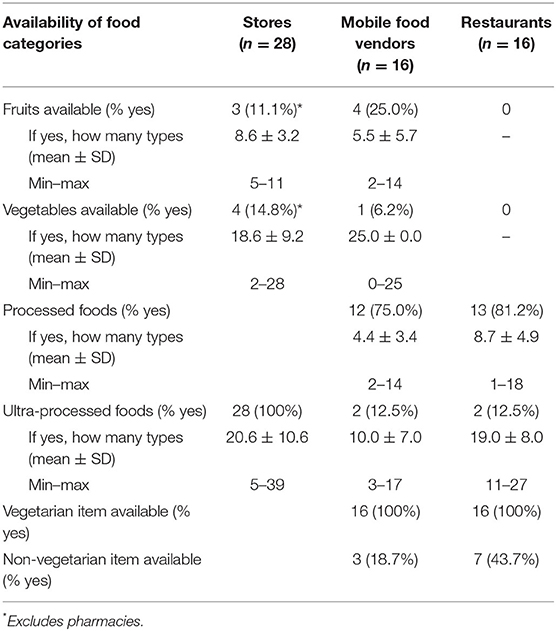
Table 4. Availability and variety of food items according to level of processing across surveyed food establishments (n = 60) of Delhi National Capital Region, India.
Price
Watermelon was the cheapest fruit available in stores [9.9 INR (~0.14 USD) per 500 g] and cherries the most expensive [125 INR (~1.70 USD) per 500 g] (Supplementary Table 1). At mobile food vendors, mango was the cheapest fruit available [19 INR (~0.26 USD) per 500 g] and green apple the most expensive [100 INR (~1.36 USD) per 500 g]. There was substantial variability in price between the stores and mobile food vendors for certain fruits and vegetables with the price being higher in stores for a majority of the items.
The price of ultra-processed food items ranged from 1 INR (~0.014 USD) for candy to 745 INR (~10.16 USD) for desserts such as red velvet cake (Supplementary Table 2). In terms of comparison of price between ultra-processed foods and fruits and vegetables, it was observed that the relative prices between the two varied with the type of item. For instance, an apple (100 g) costing 17.5 INR (~0.25 USD) was found to be cheaper than a 100 g bag of chips (average cost, 36.7 INR, ~0.53 USD) but more expensive than cookies, which cost, on average, 13.6 INR (~0.1 USD) for the same amount (100 g).
Vendor Properties
Of the 60 food establishments surveyed, 46.6% were stores, 26.7% were restaurants, and 26.7% were mobile food vendors. Within the category of stores, the majority were classified as large grocery stores and convenience stores (39.3% each), followed by dairies (14.2%), one supermarket chain, and one pharmacy. Full-service and limited-service restaurants comprised 37.5 and 62.5% of all restaurants, respectively. Stores were open for a mean (SD) of 13.1 (2.6) hours per day. The opening hours for restaurants and mobile food vendors were 11.4 (2.2) and 9.8 (3.1) hours per day, respectively. A majority of the food establishments (96.4% of stores, 100% of restaurants, and 88.8% of mobile food vendors) were open 7 days a week.
Product Properties
The quality of fruits and vegetables at stores (where available) was reported to be “Good.” Processed food items were sold at 75.0% of mobile food vendors and 81.2% of restaurants. A total of 104 different types of processed foods were available in restaurants and 53 in mobile food vendors (Supplementary Table 3). Ultra-processed food items were sold at 100% of stores, 12.5% of mobile food vendors, and 12.5% of restaurants. A total of 156 different types of ultra-processed food items were recorded across all food establishments (105 in stores, 36 in restaurants, and 17 in mobile food vendors) (Supplementary Table 2). Candy, chocolate, cookies, potato chips, namkeen (a savory snack), and fruit juice were the most commonly found ultra-processed food items in stores whereas pizza was the most common in mobile food vendors. There was greater variability in the number of different types of ultra-processed foods available in stores compared to mobile food vendors and restaurants, with greater availability of flavored drinks, packaged snacks, ready-to-eat mixes, and syrups/sauces.
Marketing
Nearly half of all food establishments displayed advertisements as a part of external marketing (42.8% of stores, 50.0% of restaurants, and 43.7% of mobile food vendors, Table 5). Only 7.1% of stores and 6.2% of restaurants had painted murals of healthy foods and beverages. 39.2% of stores had processed food products near the checkout counter. Table 6 depicts the greater advertising of processed and ultra-processed food items than unprocessed or minimally processed foods across the three types of food establishments surveyed. None of the restaurants mentioned nutritional information or total calories for the dishes on the menu. Also, the menus did not promote any low-carb dishes. Non-fried vegetables or salad were not offered free of charge with the main dish in any of the restaurants. However, 62.5% of restaurants provided reduced portion sizes and 25% had healthier options on their menu. Only 12.5% of restaurants had a salad bar and only 18.7% had healthier cooking options (baked, steamed, boiled) available.
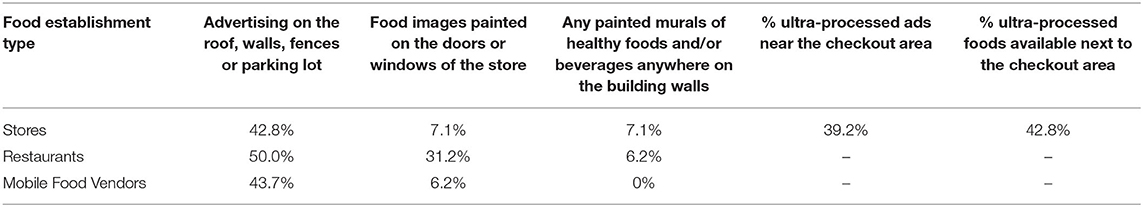
Table 5. Types of advertisement used for marketing and promotion of food across surveyed food establishments (n = 60) of Delhi National Capital Region, India.
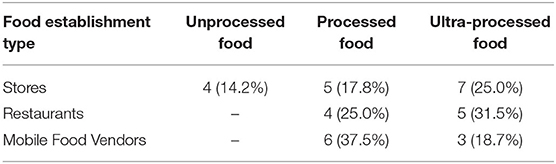
Table 6. Percentage advertisements displayed according to category of processing of the food item on display across surveyed food establishments (n = 60) of Delhi National Capital Region, India.
Discussion
Few studies have evaluated food environments in LMICs (Turner et al., 2020). Up-to-date descriptive studies of food environments such as the one presented herein for urban India provide an important benchmark against which future programs and policies can be measured. We found that stores were more likely to sell vegetables and sold a greater variety of both fruits and vegetables as compared to mobile food vendors, but that these healthy food items were generally more expensive at stores. In addition, the availability and variety of ultra-processed foods across all food establishments were higher than that for fruits and vegetables. Similar findings have been reported in Brazil–where university food services offer limited fruit and vegetable options, but starchy vegetables, sugary beverages, desserts, and candies are widely available (Pulz et al., 2017). And also in South Africa, where less than half of surveyed schools in one study served fruits and vegetables (Faber et al., 2013), and Ghana, where fruits and vegetables were found to be the least common type of food in one study of urban poor communities (Dake et al., 2016). Research conducted in 12 cities in China also found that a majority of food stores did not sell fresh/frozen vegetables or fruits (Liao et al., 2016). Regulations that limit the availability of cheap, ultra-processed foods and increase the availability of cheap, high-quality fruits, and vegetables are needed to improve food environments in urban LMICs.
The Food Safety and Standards Authority of India (FSSAI) has recently introduced regulations that prohibit the sale and advertising of foods high in saturated fats, trans fats, added sugar, or sodium in schools (FSSAI, 2020). However, such regulations have not been implemented in market areas where most people procure their food. In this study, a majority of the food establishments advertised unhealthy food items in the form of posters and painted murals. Similar findings were reported in Guatemala, where 37% of the advertisements in food stores around preschools and schools promoted sugary beverages (Chacon et al., 2015). With regards to providing nutrition information, a study at a Brazilian university found <20% of restaurants provided such information (Pulz et al., 2017), similar to our study in India wherein none of the restaurants provided nutritional information on their menus.
India has great horticultural diversity (Ministry of Statistics and Program Implementation, 2017). Statistics on Indian horticulture report the production of more than 25 species of fruits and 40 species of vegetables and spices (Horticulture Statistics Division, 2017). This was close to the findings from our market-based survey, which identified 23 species of fruits and 48 species of vegetables for sale in NCR. This diversity of fruits and vegetables was not uniformly available across food establishments. For example, only one mobile food vendor sold vegetables and only 15% of stores sold vegetables. The Government of India has taken a number of measures to increase access to fruits and vegetables including investment in production, infrastructure for storage, marketing reforms, and increased distribution and surveillance (Khandelwal et al., 2019). However, a study conducted in south Delhi found that affordability, not accessibility, is the main barrier to increasing fruit and vegetable intake (Finzer et al., 2013). Affordability was also reported as the primary barrier to increasing fruit and vegetable intake in a study conducted in peri-urban villages of Telangana, a state in south India (Surendran et al., 2020). Repeated market-based surveys of the food environment can be used to evaluate the long-term impact of government initiatives on availability, affordability, and marketing of fruits and vegetables.
A major barrier to increasing the availability and affordability of fruits and vegetables, particularly in dense, urban areas such as NCR, is the high price of transportation and lack of cold chain systems in India–which contribute to food waste. The involvement of intermediaries in the supply chain makes this even more difficult for the people involved in agriculture (Biswas, 2016; Thow et al., 2018; Khandelwal et al., 2019). It has been estimated that 35–40% of India's total fruit production perishes before reaching consumers (Bung, 2012; Kumar et al., 2017). In contrast, ultra-processed foods have long shelf lives and do not require expensive, cold transport, or storage. This may be one reason that ultra-processed foods are more commonly available than fruits and vegetables.
Increased sales of ultra-processed foods accompanied with the expansion of modern grocery retails is occurring rapidly in Asia's middle-income countries (Baker and Friel, 2016). In the current study, 100% of the stores had ultra-processed foods available and mobile food vendors were more likely to sell processed foods than fruits and vegetables. Variability in the availability of healthy foods has also been assessed in other LMICs such as Brazil, which measured the food environment using a healthy food store index and a healthy restaurant index. That study revealed greater availability of healthy food items at open-air food markets compared to local grocery stores and convenience stores (Duran et al., 2008).
A few studies have been conducted in India for assessment of the food environment. Three of these studies assessed the food environment surrounding private schools and colleges (Rathi et al., 2016, 2017; Bassi et al., 2020). Another two assessed the opinions of adolescents toward different categories of foods (Maxfield et al., 2016; Rathi et al., 2018) and the effect of the rural food environment and access to food on their nutritional status (Ganpule-Rao et al., 2020). The fat content of mobile food vendors in rural areas and urban slums of NCR has also been previously described, supporting that food prepared by mobile food vendors is high in saturated fats (Gupta et al., 2016), consistent with our study, which found fried snacks (e.g., samosa, kachodi, bhatura, bread pakoda, and golgappe) were available at 87.5% of mobile food vendors. Finzer et al. (2013) found that mobile food vendors and markets are the dominant sources of fruits and vegetables in South Delhi. Another study that assessed the food environment in Delhi found that people with higher socioeconomic statuses live in neighborhoods that have a higher density of unhealthy foods (fast food and full-service restaurants), and are less likely to consume fruits and more likely to consume refined grains (Patel et al., 2018).
In the current study, only 14.2% of stores advertised unprocessed or minimally processed foods. Advertisements and promotional messages play a crucial role in influencing consumers' food choices. In a controlled experiment with 351 adult participants in the United States, Zimmerman and Shimoga (2014) found that food advertising resulted in an increase of 84% in the number of unhealthy snacks chosen. Children and adolescents are especially vulnerable to advertising of ultra-processed foods and beverages (Mallarino et al., 2013). In the Indian scenario, food marketing has been found to have a significant impact on the food choices made by adolescents (Sivathanu, 2017). Apart from regulating the nutritional content of foods, governments should consider regulating the food environment at schools. A study conducted in Kolkata found that the food environment in schools was characterized by an oversupply of unhealthy foods and relatively inadequate availability of healthy foods (Rathi et al., 2017). The food environment at home was found to be much more conducive to healthy eating wherein fruits and vegetables were always available in 91.6 and 95.7% of homes, respectively (Rathi et al., 2018).
Over the past few years, the Government of India has taken steps to improve the food environment by introducing various mandates. In 2016, it set a regulation limit of 5% on trans fats in partially hydrogenated vegetable oils. The recent release of Food Safety and Standards (Labeling and Display) Regulations in 2018 by FSSAI is a step toward better labeling of food (especially packaged foods including most ultra-processed foods) with the introduction of “high fat, sugar, salt food” labels along with other nutritional information (FSSAI, 2018). However, mobile food vendors who sell unpackaged food directly to consumers, which is usually higher in trans fat (Gupta et al., 2016), are exempt from this regulation, as are small-scale local sweet shops. Filling these regulatory gaps will require innovative approaches unique to the LMIC context.
The studies conducted on the food environment in LMICs so far have focused on two domains: external and personal food environment. The assessment of the external food environment domain has predominantly involved the evaluation of availability, vendors and their products, prices, and marketing. The assessment of personal food environment on the other hand involves accessibility, desirability, convenience, and affordability. While more than 60% of the studies conducted in LMIC settings have included multiple dimensions as described above, less than half of these have assessed both the external and personal food environment domains (Turner et al., 2020). The current study covers all domains of the external food environment, however, the personal food environment was not evaluated. Moreover, the sample size of food establishments was too small to conduct multivariate analyses to understand the complex interactions between dimensions of the external food environment domain. This is one of the key limitations of this study: we did not collect data on purchasing and consumption patterns that were prevalent at the study site or the profile of the consumers at the surveyed food establishments. To the best of our knowledge, there is no up-to-date data on where people in cities such as Delhi get their food. For example, in the United States in 2003–2006, children (2–18 years) got 69% of their calories from stores, 5% from full-service restaurants, 13% from fast food restaurants, 8% from schools, and 5% from other sources (Poti and Popkin, 2011). Similar information will be necessary to improve upon future food environment surveys. Also, seasonality plays an important role in the availability and affordability of fruits and vegetables, but we collected data at a single time point, in July-August, which is monsoon season in India, and it was unusually warm in the year of collection and thus mango was the most widely available seasonal fruit at that point in time. While food environment audits based on direct observation as conducted in our study are considered the “gold standard” against which other sources of data on the food environment are validated–for example, government data or commercially available business data–it would have been informative to assess the convergent validity of our tool with other food environment audit tools. We also did not assess inter-rater or test-retest reliability due to similar resource constraints. These are important next steps for future research.
The current study highlights not only the low availability of fruits and vegetables in food establishments but also their limited promotion. It also contributes to growing evidence on the pervasiveness of ultra-processed foods. To our knowledge, this is the first food environment survey that focuses on the assessment of the external food environment factors including food availability, price, vendor and product properties, and marketing in India. Continued monitoring of the external food environment in India is needed to assess the nutrition transition and to examine the longitudinal association of these changes with nutrition and health outcomes.
Data Availability Statement
The raw data supporting the conclusions of this article will be made available upon request by the authors, without undue reservation.
Ethics Statement
The studies involving human participants were reviewed and approved by the Institutional Ethics Committee of the Public Health Foundation of India (TRC-IEC-375/18). Written informed consent for participation was not required for this study in accordance with the national legislation and the institutional requirements.
Author Contributions
MC analyzed the data and wrote the first draft. LJ helped in writing the draft and provided critical feedback. MB, PM, and AS collected data. SK designed and supervised the study and provided feedback in revising the manuscript draft. All authors have read and approved the final manuscript.
Funding
This research was supported in part by the Medical Research Council/UK Research and Innovation (Grant Ref: MR/T044527/1).
Conflict of Interest
The authors declare that the research was conducted in the absence of any commercial or financial relationships that could be construed as a potential conflict of interest.
Publisher's Note
All claims expressed in this article are solely those of the authors and do not necessarily represent those of their affiliated organizations, or those of the publisher, the editors and the reviewers. Any product that may be evaluated in this article, or claim that may be made by its manufacturer, is not guaranteed or endorsed by the publisher.
Supplementary Material
The Supplementary Material for this article can be found online at: https://www.frontiersin.org/articles/10.3389/fsufs.2021.726819/full#supplementary-material
References
Baker, P., and Friel, S. (2016). Food systems transformations, ultra-processed food markets and the nutrition transition in Asia. Global. Health 12:80. doi: 10.1186/s12992-016-0223-3
Bassi, S., Bahl, D., Arora, M., Tullu, F. T., and Gupta, R. (2020). Food environment in and around schools and colleges of Delhi and National Capital Region (NCR) in India. BMC Public Health 27:1767. doi: 10.21203/rs.3.rs-126812/v1
Biswas, P. S. (2016). Pune: traders on strike, fruits and vegetable supply goes dry | Cities News, The Indian Express. The Indian Express. Available online at: https://indianexpress.com/article/cities/pune/pune-traders-on-strike-fruits-and-vegetable-supply-goes-dry-2908058/ (accessed May 13, 2019).
Bung, P. (2012). Indian fruit processing industry: import and export analysis. Informatics J. 6, 72–86. Available online at: http://www.informaticsjournals.com/index.php/dbijb/article/view/16116/13519
Chacon, V., Letona, P., Villamor, E., and Barnoya, J. (2015). ‘Snack food advertising in stores around public schools in Guatemala’. Crit. Public Health 25, 291–298. doi: 10.1080/09581596.2014.953035
Classification Development Branch (1997). North American Industry Classification System (NAICS). US Census Bureau, Economic Statistical Methods Divison. Available online at: https://www.census.gov/eos/www/naics/reference_files_tools/1997/sec72.htm (accessed December 13, 2018).
Dake, F. A. A., Thompson, A. L., Ng, S. W., Agyei-Mensah, S., and Codjoe, S. N. A. (2016). The local food environment and body mass index among the urban poor in Accra, Ghana. J. Urban Health 93, 438–455. doi: 10.1007/s11524-016-0044-y
Defries, R., Chhatre, A., Davis, K. F., Dutta, A., Fanzo, J., Ghosh-Jerath, S., et al. (2018). Impact of historical changes in coarse cereals consumption in India on micronutrient intake and anemia prevalence. Food Nutrit. Bull. 39, 377–392. doi: 10.1177/0379572118783492
Duran, A. C., Diez, R. A. V., Latorrec, M., do, R. D. O., and Jaime, P.C. (2008). Neighborhood socioeconomic characteristics and differences in the availability of healthy food stores and restaurants in São Paulo, Brazil. Health Place 23, 1–7. doi: 10.1016/j.healthplace.2013.05.001
EAT-Lancet Commission on Healthy Diets From Sustainable Food Systems (2019). Healthy Diets From Sustainable Food Systems Summary Report of the EAT-Lancet Commission. Available online at: https://eatforum.org/content/uploads/2019/01/EAT-Lancet_Commission_Summary_Report.pdf (accessed February 20, 2019).
Faber, M., Laurie, S., Maduna, M., Magudulela, T., and Muehlhoff, E. (2013). Is the school food environment conducive to healthy eating in poorly resourced South African schools? Public Health Nutrit. 17, 1214–1223. doi: 10.1017/S1368980013002279
Finzer, L. E., Ajay, V. S., Ali, M. K., Shivashankar, R., Goenka, S., Pillai, D., et al. (2013). Fruit and vegetable purchasing patterns and preferences in South Delhi. Ecol. Food Nutr. 52, 1–20. doi: 10.1080/03670244.2012.705757
FSSAI (2018). Notice Calling for Suggestions, View, Comments etc From Stakeholders on the Draft Food Safety and Standards (Labelling and Display) (New Delhi).
FSSAI (2020). Food Safety and Standards (Safe food and healthy diets for School Children) Regulations. Notification. F. No. 15(1)2016/School Children Regulation/Enf/FSSAI. New Delhi: The Gazette of India: Extraordinary, III-Section, 1–9.
Ganpule-Rao, A. V., Roy, D., Karandikar, B. A., Yajnik, C. S., and Rush, E. C. (2020). Food access and nutritional status of rural adolescents in India: Pune maternal nutrition study. Am. J. Prev. Med. 58, 728–735. doi: 10.1016/j.amepre.2019.10.017
Glanz, K., Sallis, J. F., Saelens, B. E., and Frank, L. D. (2005). Healthy nutrition environments: concepts and measures. Am. J. Health Promot. 19, 330–333. doi: 10.4278/0890-1171-19.5.330
Glanz, K., Sallis, J. F., Saelens, B. E., and Frank, L. D. (2007). Nutrition environment measures survey in stores (NEMS-S), development and Evaluation. Am. J. Prev. Med. 32, 282–289. doi: 10.1016/j.amepre.2006.12.019
Green, R., Milner, J., Joy, E. J. M., Agrawal, S., and Dangour, A. D. (2016). Dietary patterns in India: a systematic review. Br. J. Nutr. 116, 142–148. doi: 10.1017/S0007114516001598
Gupta, V., Downs, S. M., Suparna Ghosh-Jerath, L.ock, K., and Singh, A. (2016). Unhealthy fat in street and snack foods in low-socioeconomic settings in India: a case study of the food environments of rural villages and an urban slum. J. Nutr. Educ. Behav. 48, 269–279. doi: 10.1016/j.jneb.2015.11.006
Horticulture Statistics Division (2017). Horticultural Statistics at a Glance 2017. New Delhi: Horticulture Statistics Division. Available online at: www.agricoop.nic.in (accessed June 18, 2019).
Hua, J., Seto, E., Li, Y., and Wang, M. C. (2014). Development and evaluation of a food environment survey in three urban environments of Kunming, China. BMC Public Health 14:235. doi: 10.1186/1471-2458-14-235
International Comparison Program (2011). Outlet Definition. Available online at: http://en.wikipedia.org/wiki/Grocery_store (accessed December 13, 2018).
Johnson, C., Praveen, D., Pope, A., Raj, T. S., Pillai, R. N., Land, M. A., et al. (2017). Mean population salt consumption in India. J. Hypertens. 35, 3–9. doi: 10.1097/HJH.0000000000001141
Khandelwal, S., Verma, G., Shaikh, N. I., Siegel, K. R., Soni, D. Soni, D., et al. (2019). Mapping of policies related to fruits and vegetables accessibility in India. J. Hunger Environ. Nutr. 15, 1–17. doi: 10.1080/19320248.2019.1595254
Kumar, N., Bhardwaj, B., and Ahmad, S. (2017). A survey: to estimate food wastage periodically. Int. J. Eng. Res. Technol. 5, 1–5. Available online at: https://www.ijert.org/research/asurvey-to-estimate-food-wastage-periodically-IJERTCONV5IS11064.pdf
Li, Y., Mallinson, P. A. C., Bhan, N., Turner, C., Bhogadi, S., Sharma, C., et al. (2019). Neighborhood physical food environment and cardiovascular risk factors in India: cross-sectional evidence from APCAPS. Environ. Int. 132, 105–108. doi: 10.1016/j.envint.2019.105108
Liao, C., Tan, Y., Wu, C., Wang, S., Yu, C., Cao, W., et al. (2016). City level of income and urbanization and availability of food stores and food service places in China. PLoS ONE 11:e0148745. doi: 10.1371/journal.pone.0148745
Mallarino, C., Gomez, L., González-Zapata, L., Cardena, Y., and Parra, D. C. (2013). Advertising of ultra-processed foods and beverages: children as a vulnerable population. Rev Saúde Pública 47, 1006–1010. doi: 10.1590/S0034-8910.2013047004319
Maxfield, A., Patil, S., and Cunningham, S. A. (2016). Globalization and food prestige among Indian adolescents. Ecol. Food Nutr. 55, 341–364. doi: 10.1080/03670244.2016.1181064
Ministry of Health Family Welfare Government of India (2016). National Family Health Survey - 4. State Fact Sheet NCT Delhi. Available online at: http://rchiips.org/nfhs/pdf/NFHS4/Maharashtra.pdf (accessed July 17, 2020).
Ministry of Health and Family Welfare Government of India (2017). India - National Family Health Survey (NFHS-4) 2015-16. Mumbai: Ministry of Health and Family Welfare GOI.
Ministry of Statistics Program Implementation (2017). ‘Chapter 9: horticulture’, in Statistical Year Book. Government of India. Available online at: http://www.mospi.gov.in/sites/default/files/Statistical_year_book_india_chapters/Ch_9_SYB2017.pdf (accessed June 18, 2019).
Monteiro, C. A., Cannon, G., Moubarac, J. C., Levy, R. B., Louzada, M. L. C., and Jaime, P. C. (2018). The UN decade of nutrition, the NOVA food classification and the trouble with ultra-processing. Public Health Nutr. 21, 5–17. doi: 10.1017/S1368980017000234
National Capital Region Planning Board Government of India (2017). NCR Annual Report 2016-17. New Delhi: National Capital Region Planning Board Government of India.
National Capital Regional Planning Board (2014). Study on Counter Magnet Areas to Delhi & NCR. Available online at: ncrpb.nic.in/pdf_files/04_Chapter1_cma.pdf (accessed July 17, 2020).
National Sample Survey Office (2014). Household Consumption of Various Goods and Services in India 2011-12. New Delhi: National Sample Survey Office.
Patel, O., Shahulhameed, S., Shivashankar, R., Tayyab, M., Rahman, A., Prabhakaran, D., et al. (2018). Association between full service and fast food restaurant density, dietary intake and overweight/obesity among adults in Delhi, India. BMC Public Health 18:36. doi: 10.1186/s12889-017-4598-8
Popkin, B. M., Adair, L. S., and Ng, S. W. (2012). NOW AND THEN: the global nutrition transition: the pandemic of obesity in developing countries. Nutr. Rev. 70, 3–21. doi: 10.1111/j.1753-4887.2011.00456.x
Poti, J. M., and Popkin, B. M. (2011). Original research trends in energy intake among US children by eating location and food source. J. Am. Diet Assoc. 111, 1156–1164. doi: 10.1016/j.jada.2011.05.007
Pulz, I. S., Martins, P. A., Feldman, C., and Veiros, M. B. (2017). Are campus food environments healthy? A novel perspective for qualitatively evaluating the nutritional quality of food sold at foodservice facilities at a Brazilian university. Persp. Public Health 137, 122–135. doi: 10.1177/1757913916636414
Ramachandran, P., and Kalaivani, K. (2018). Nutrition transition in India: challenges in achieving global targets. Proc. Indian Natl. Sci. Acad. 84, 821–833. doi: 10.16943/ptinsa/2018/49450
Rathi, N., Riddell, L., and Worsley, A. (2016). What influences urban Indian secondary school students' food consumption? – A qualitative study. Appetite 105, 790–797. doi: 10.1016/j.appet.2016.07.018
Rathi, N., Riddell, L., and Worsley, A. (2017). Food environment and policies in private schools in Kolkata, India. Health Promot. Int. 32, 340–350. doi: 10.1093/heapro/daw053
Rathi, N., Riddell, L., and Worsley, A. (2018). Indian adolescents' perceptions of the home food environment. BMC Public Health 18:169. doi: 10.1186/s12889-018-5083-8
Ronto, R., Wu, J. H., and Singh, G. M. (2018). Commentary: the global nutrition transition: trends, disease burdens and policy interventions. Public Health Nutr. 21, 2267–2270. doi: 10.1017/S1368980018000423
Shetty, P. S. (2002). Nutrition transition in India. Public Health Nutr. 5, 175–182. doi: 10.1079/PHN2001291
Sivathanu, B. (2017). Food marketing and its impact on adolescents' food choices. Indian J. Market. 47:46. doi: 10.17010/ijom/2017/v47/i8/117432
Surendran, S., Selvaraj, K., Turner, C., Addanki, S., Kannuri, N. K., Debbarma, A., et al. (2020). Characterising the fruit and vegetable environment of peri-urban Hyderabad, India. Global Food Security 24:100343. doi: 10.1016/j.gfs.2019.100343
Thow, A. M., Verma, G., Soni, D.eepa, Soni, Divya, Beri, D. K., Kumar, P., et al. (2018). How can health, agriculture and economic policy actors work together to enhance the external food environment for fruit and vegetables? A qualitative policy analysis in India. Food Policy 77, 143–151. doi: 10.1016/j.foodpol.2018.04.012
Turner, C., Aggarwal, A., Walls, H., Herforth, A., Drewnowski, A., Coates, J., et al. (2018). Concepts and critical perspectives for food environment research: a global framework with implications for action in low- and middle-income countries. Global Food Security 18, 93–101. doi: 10.1016/j.gfs.2018.08.003
Turner, C., Kalamatianou, S., Drewnowski, A., Kulkarni, B., Kinra, S., and Kadiyala, S. (2020). Food environment research in low- and middle-income countries: a systematic scoping review. Am. Soc. Nutr. 11, 387–397. doi: 10.1093/advances/nmz031
Winarno, F., and Allain, A. (1991). Street Foods in Developing Countries: Lessons From Asia. Food and Agriculture Organization. Available online at: http://www.fao.org/3/u3550t/u3550t08.htm (accessed June 25, 2019).
Keywords: nutrition, food supply, food acquisition, fruits and vegetables, ultra-processed food, food price, built environment, nutrition transition
Citation: Chaudhry M, Jaacks LM, Bansal M, Mahajan P, Singh A and Khandelwal S (2021) A Direct Assessment of the External Domain of Food Environments in the National Capital Region of India. Front. Sustain. Food Syst. 5:726819. doi: 10.3389/fsufs.2021.726819
Received: 17 June 2021; Accepted: 01 November 2021;
Published: 30 November 2021.
Edited by:
Celine Termote, Alliance Bioversity International and CIAT, FranceReviewed by:
Selena Ahmed, Montana State University, United StatesTuyen Thi Thanh Huynh, International Center for Tropical Agriculture (CIAT), Vietnam
Copyright © 2021 Chaudhry, Jaacks, Bansal, Mahajan, Singh and Khandelwal. This is an open-access article distributed under the terms of the Creative Commons Attribution License (CC BY). The use, distribution or reproduction in other forums is permitted, provided the original author(s) and the copyright owner(s) are credited and that the original publication in this journal is cited, in accordance with accepted academic practice. No use, distribution or reproduction is permitted which does not comply with these terms.
*Correspondence: Shweta Khandelwal, c2h3ZXRhLmtoYW5kZWx3YWxAcGhmaS5vcmc=
†These authors have contributed equally to this work and share first authorship