 Daniel A. Mekonnen
 Dare Akerele2,3
 Thijs de Lange
95% of researchers rate our articles as excellent or good
Learn more about the work of our research integrity team to safeguard the quality of each article we publish.
Find out more
ORIGINAL RESEARCH article
Front. Sustain. Food Syst. , 13 September 2021
Sec. Nutrition and Sustainable Diets
Volume 5 - 2021 | https://doi.org/10.3389/fsufs.2021.726773
This article is part of the Research Topic Beyond the Food Systems Framework: Food System Transitions towards Sustainable Healthy Diets in Low and Middle-Income Countries View all 9 articles
This study examines the cost and affordability of healthy diets in Nigeria. Using the 2015/16 and 2018/19 waves of Nigeria General Household Surveys, we find that, generally, the least-cost options to meet dietary recommendations for vegetables, dairy, and protein-rich foods are more expensive to meet than that of other food groups. Despite improvements during the survey years, the challenges of affordability of healthy diets appear more pronounced in rural than urban, among poorest household groups, and in northern than southern Nigeria. Results suggest that it will be more expensive to meet the dietary recommendation for dairy foods if priority will be given for food systems sustainability over concerns for food preferences of the households. It will however be cheaper to achieve dietary recommendations for vegetables, fruits and starchy staples even when households give more consideration to food systems sustainability than tastes and preferences in their choice of healthy foods. Relative affordability of protein-rich foods are less affected by whether (or not) tastes/preferences or food systems sustainability drives healthy food choices. Key implication is that interventions targeting on affordability of healthy diets should give greater attention to the poorest of the poor, to rural than urban, and to northern than southern Nigeria. Implications relevant for research, policy, and other actors that focus on transformation of the food systems toward achieving healthier diets in a sustainable food systems are discussed.
Diet quality as a critical link between food security and nutrition was put on a spotlight in the latest report of the State of Food Security and Nutrition in the World (FAO, 2020). The report concludes that unaffordability of a healthy diet is strongly associated with food insecurity and different forms of malnutrition. While there is vast literature on nutrition and food security issues, empirical studies focusing on affordability of healthy diets in lower- and middle-income countries are only emerging. Key findings of recent studies suggest that cost of healthier foods and nutrient adequacy is out of reach for the world's poorest people (see for e.g., Chastre et al., 2007; Busquet, 2010; Bachewe et al., 2017; Masters et al., 2018; Dizon et al., 2019; Heady and Alderman, 2019; Hirvonen et al., 2019; Mahrt et al., 2019; Bai et al., 2020; Herforth et al., 2020; Raghunathan et al., 2020). Consequently, global progress toward achieving the hunger, food security and nutrition targets of SDG 2 is off track (FAO, 2020).
While existing studies have improved our understanding of the links between unaffordability of healthy diets and various forms of malnutrition, affordability of healthier foods and causal factors might be country specific, and may vary even within country across seasons, geographic locations, and local food systems. For example, based on monthly national average prices in Ghana (2009–2014) and Tanzania (2011–2015), Masters et al. (2018) find seasonality to have much stronger influence on the cost of dietary diversity and nutrient adequacy in Ghana than in Tanzania. These imply country-specific analysis of the cost and affordability of healthier foods are needed to inform both local interventions and systemic changes (Hirvonen et al., 2019). Further, Nigeria is the most populous country in Africa and the seventh largest population in the world, with appreciable population growth (National Bureau of Statistics (NBS), 2017). Hence, just like the rest of lower income countries, providing a growing Nigerian population with healthy diets from sustainable food systems is an immediate challenge (Willett et al., 2019).
In Nigeria, previous studies examined food consumption patterns and certain aspects of food security and nutrition (e.g., Babatunde and Qaim, 2010; Akerele, 2015; Akerele et al., 2017; Ecker and Hatzenbuehler, 2021; Mekonnen et al., 2021). According to Ecker and Hatzenbuehler (2021), there has been no general trend toward a transition into the consumption of more nutritious foods, despite increased availability of per capita calories at national level over the previous three decades in Nigeria. During 2012–2016, the daily consumption of calories averaged between 2,936 and 3,422 kcal (Shittu et al., 2018). This shows the average consumption of calories was in excess of the healthy reference intake of 2500 kcal/day1. Even though this does not necessarily mean that all people had access to sufficient calories from balanced sources, the average figures appear to signal room for improving dietary consumption by reducing excess calories, given income, and hence potential role for nutrition education. Such intervention, however, would require information on the consumption patterns of healthy and unhealthy food groups, as well as the cost and affordability of a healthy diet in Nigeria. Similarly, identifying the prevalence and extent of shortfalls in affordability of healthy diets can shed some light on other potential policy options.
To date, with the exception of a case study in Katsina State (Busquet, 2010), there is little empirical assessment of the cost and affordability of healthy diets across time and space in Nigeria. In this context, this study adds to the emerging literature and especially to Nigeria. In this study, we refer to “healthy” diets as those which meet a set of dietary recommendations intended to provide nutrient adequacy (i.e., both calorie and nutrients) and long-term health (Herforth et al., 2020), and reference diets capable of sustaining health and protecting the planet, as in the case of the EAT-Lancet reference diet (Willett et al., 2019). It should be noted that the EAT-Lancet diet is a visionary diet that is sustainable (within global planetary boundaries) only under the assumption that global food systems have advanced with greater productivity and reduced food loss and waste. Understanding the current food consumption patterns in Nigeria within the EAT-Lancet dietary recommendations can offer some important insights regarding the extent of affordability of healthy diets when households are taken as sustainable consumers seeking to meet dietary recommendations for optimal health and from a sustainable food systems. Sustainable reference diets for Nigeria are yet to be developed. Consequently, we adopt the EAT-Lancet diets reference for Nigeria in assessment of affordability of diets within the sustainable consumers context. Although not a country specific dietary recommendations, using the EAT-Lancet (global) reference diets in the local settings may be helpful for a country in evaluating how its food systems perform and/or compares with other nations across the world in terms of affordability of sustainably healthy diets and efforts toward attaining the sustainable development goals (SDGs) on food security, health and nutrition.
The main objective of this study is to examine the cost and affordability of healthy diets across time and place in Nigeria. Specifically, we examine: (1) the cost of healthy diets that meet dietary recommendations as defined above; (2) affordability of healthy diets with respect to household food expenditures; and (3) the extent of affordability shortfalls (both prevalence and extent of the gap). Further, the study compares the cost and affordability of least-cost reference diet against those that take into account consumer tastes and preferences and food systems sustainability (the EAT-lancet diet recommendation). The remainder of this study is structured as follows. Data is described in Data section. The methods are described in Method of Analysis section, including description of reference diets and the construction of cost of diets. Discussion of results and concluding remarks are presented in Results and Discussion and Conclusion sections, respectively.
We use the latest two waves of the Nigeria General Household Surveys (NGHS) (2015/16 and 2018/19). Each wave consisted of two seasonal visits, post-planting and post-harvest, and targeted about 5,000 households. Final sample with complete information and used in this study was 3,575 households for post-planting and 3,419 households for post-harvest for the 2015/16 wave; and 3,853 households post-planting and 3,696 households post-harvest for 2018/19 wave. The NGHS was designed to be representative of the population at the zonal level, which includes three Northern and three Southern zones as well as by rural and urban areas within these zones (Nigerian National Bureau of Statistics (NBS), 2019). The NGHS contains extensive household expenditure modules (both food and non-food expenditures) in each round of the survey. The section on food consumption asked respondents up to 120 different food items consumed in the household in the previous week, by food source including own production and purchases. The consumption value for each food item from own production was calculated based on the median prices generated from reported expenditures and reported quantities for purchased foods from within the primary sampling unit (EA) with at least five observations, or at the smallest possible geographic level above that if a price was not available at EA level. To minimize outlier prices, we ensure that the median prices per food item were within the range of plus or minus three times the interquartile range of corresponding national level median prices, following Filzmoser et al. (2016). While these prices may deviate from those collected in market monitoring surveys, they could be understood as crowdsourced prices which have been found useful in recent studies (e.g., Adewopo et al., 2021).
We calculate the daily total household food expenditures by adding together the household expenditures on foods consumed at home and those consumed outside of home in the past week divided by 7 days. We calculate daily expenditures on foods consumed at home by multiplying total quantity consumption per day with median unit prices of each food item. Further, we convert household's food consumption and total food expenditures in adult female equivalent (AFE) unit. The AFE allows for a division of the household consumption to an individual household members' consumption as a proportion of energy requirements of an adult, non-pregnant, non-lactating woman (20–30 year). All other age and gender groups receive an AFE value by dividing their energy requirement by the energy requirement of 1 AFE per day. The household AFE is calculated by summing up the AFEs of individual household members. Note, however, that even though we use per AFE values to proxy for intra-household distribution of food (Coates et al., 2017; Sununtnasuk and Fiedler, 2017), actual food distribution may differ from that implied by the AFE scale, which is one of the limitations. The analysis of cost and affordability of healthy diets presented hereafter are in terms of AFE per day. However, for ease of presentation, we ignore the term AFE per day from the text in what follows.
The cost and affordability of healthy diets could be examined using either food based or nutrient adequacy based approach, depending on purpose of the study and availability of relevant data, dietary references, and other analytical tools (Cost of Nutritious Diets Consortium, 2018). In this study, we preferred food based assessment for the following reasons. First, previous studies suggest that “nutrients alone do not explain the relationship of food to health, as there are many non-nutrient components of food, including but not limited to fiber, phytochemicals, the food matrix, and interactions between these” (Herforth et al., 2020, p. 4). Second, food based dietary guidelines (FBDGs) are designed to meet cultural food preferences and hence analysis of affordability of such diets may capture actual food preferences (Herforth et al., 2020). Third, consumers are engaged in making food choices and there is limited evidence that nutrient adequacy of food or diets is a strong determinant of choice among consumers in Nigeria (e.g., Raaijmakers et al., 2018). Hence, key messages of food based assessment are likely to be easier to get across different groups (e.g., communities, policy, and advocacy groups). In fact, for the above and related reasons, the 2001 Nigeria dietary guideline favors the food based approach to “quantitative goals and recommendations for nutrient intakes” (see Nigeria Federal Ministry of Health (FMoH), 2006, p. 5).
We examine the cost of healthy diets using three indicators developed in recent studies (for a summary of existing indicators, see the Cost of Nutritious Diets Consortium, 2018)2, including: the cost of recommended diet (CoRD) (Dizon et al., 2019), the CoRD with food preferences (CoRD-FP) (Mahrt et al., 2019), and the EAT-Lancet reference diet (Willett et al., 2019). Calculation of the CoRD uses prices of commonly available, least-cost foods within each food group identified in food based dietary guideline (FBDG). The CoRD is a straightforward arithmetic: it is the sum of the products of recommended quantities from each food group and the average price of two least-cost foods from each food group (with the exception of vegetables group that uses three food items requiring leafy green vegetables as a third food item in the group). Because of its reliance on only few, least-cost foods, previous studies noted that the CoRD is likely to underestimate the cost of healthy diet, and also it may fail to take into account local tastes and food preferences. This gave rise to the CoRD-FP, which uses prices of all foods items identified in the food based dietary guideline, adjusted by the expenditure shares of each food item within each food group (Mahrt et al., 2019). In both the CoRD and CoRD-FP calculations, quantity of food from each food group is determined according to the FBDG. Similarly, the cost of the EAT-Lancet reference diet calculation uses the least expensive items within each EAT-Lancet food group (Willett et al., 2019). Note that Mahrt et al. (2019) and Herforth et al. (2020) find it appropriate to reduce the potential influence of atypically costly and/or rarely consumed foods on affordability of healthy diets. That is, more expensive foods, for example, may be purchased by only wealthier households and hence including those food items in the calculation of the cost of healthy diets may exaggerate the cost or the minimum budget that would be needed to consume healthy diets. This may lead to “inaccurate” conclusions for the average consumer. Thus, following Mahrt et al. (2019) and Herforth et al. (2020), we take two steps before calculating the average price of food items: 1st, we remove households in the upper expenditure quintiles, 2nd we limit recommended diet food baskets to items within the top 85% of total food expenditures within each food group.
We calculate the CoRD in 6 steps summarized below, following Dizon et al. (2019), Raghunathan et al. (2020), and Herforth et al. (2020).
1. Classify each food item into one of the food group categories identified in the FBDG.
2. Eliminate duplicate food varieties (e.g., local rice and imported rice), where the lowest cost item is retained.
3. Convert all item prices into price per edible serving using conversion factor given by:
• price conversion factor = / edible portion
4. Select the two cheapest items in the food group with the lowest price per serving, and calculate the average price per serving for the food group.
5. Multiply the average price per serving of each food group by the recommended number of servings per food group. This yields the cost of that food group.
6. Sum the cost of all food groups. This gives the CoRD.
Calculation of the CoRD-FP and the cost of the EAT- Lancet diet closely follow similar steps with slight differences on steps 2 and 4 for the CoRD-FP and on steps 1 and 4 for the EAT-Lancet diet. As mentioned above, all item prices, not just cheapest ones, weighted by corresponding expenditure shares of each food item within food group enter the calculation of CoRD-FP (Mahrt et al., 2019; Herforth et al., 2020). Since no food is eliminated here, the weighted price now represent the price (index) for the food group which is used to multiply the (recommended) food group quantities (to obtain the cost of the food group). For the EAT-Lancet diet, classification of food items in step 1 is made according to the EAT-Lancet food group, instead of the FBDG categories; and the average price per edible serving of the least expensive item within each EAT-Lancet food group is used in step 4 (Willett et al., 2019).
Clearly, the cost of healthy diet calculations described above require quantified dietary references. The Nigerian FBGD published in 2001 (Nigeria Federal Ministry of Health (FMoH), 2006) identifies five food groups to healthy eating, including bread, grains and tubers; vegetables and fruits; eggs, fish, meat and dairy; and oils and fats; and confectionery. 3 The Nigerian food guide provides mainly qualitative recommendations specific to various groups including age, sex, pregnancy and breast feeding status (of women), physical activity level and life style. The guide recommends adequate consumption of food from diversified sources, with limited intakes of certain food items such as salt, bouillon cubes and sugar, and fat from animal foods. However, the Nigerian food guide does not specify reference quantities. Hence, for the calculation of the CoRD and CoRD-FP, in this study we use a quantified FBDG from a neighboring country, Benin, as presented in Herforth et al. (2020). Our choice of Benin's FBDG was driven by availability since it is the most recent and only quantitative choice available in Sub-Saharan Africa, according to Herforth et al. (2020). Since the two countries belong to the same west Africa region and share borders, they may have similar foods and food systems compared to other regions of the world. Hence, Benin's FBDG could be a better proxy for Nigeria than FBDGs from other parts of the world. With the exception of confectionery food group, whose recommended consumption is limited to rare occasions, the remaining food groups in Nigeria's FBDG are further classified into 6 food groups in Benin's FBDG (see Table 1 for summary of recommended diets according to Benin's FBDG and that of the EAT-Lancet reference diet).
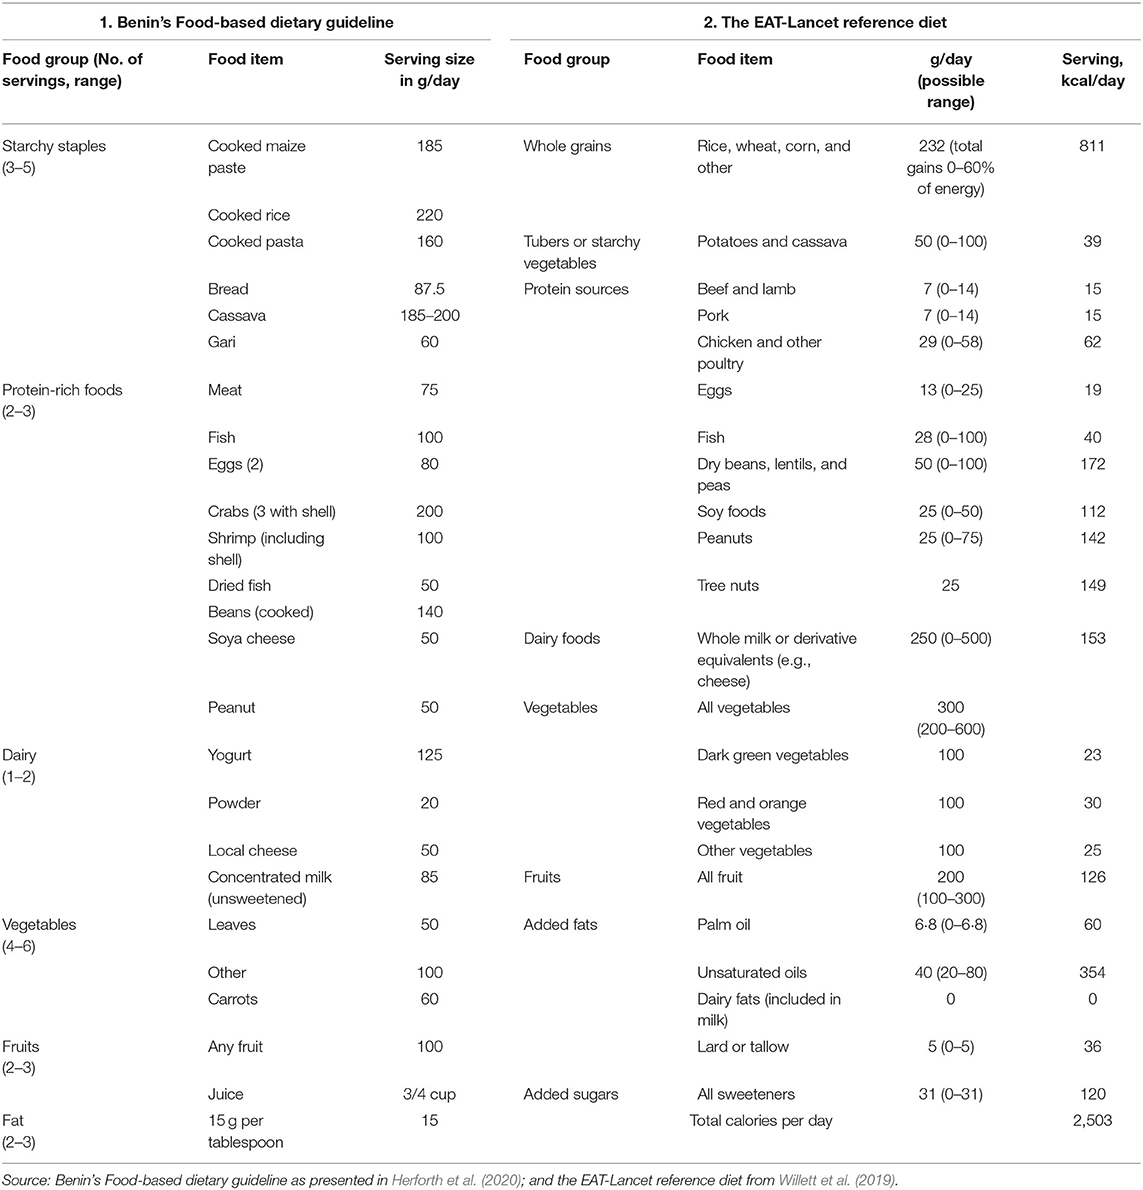
Table 1. Healthy reference diets.
Once the cost of foods is calculated, affordability can be evaluated with respect to incomes or household expenditures. In this study, we evaluate affordability of healthy diets with respect to total expenditures on food. We describe affordability in terms of: (1) the cost of diet as percent of total food expenditures, (2) the prevalence of households that cannot afford the cost of the recommended diet, (3) the extent of affordability shortfalls, for those who cannot meet the cost of the reference diet. We describe affordability of the CoRD-, CoRD-FP-, and the EAT-Lancet diets, as well as affordability of each food group.
Table 2 summarizes the average number of food items per food group and the average cost of reference diets during 2015/16 and 2018/19. To ensure comparability of the cost of diet over time, nominal values are adjusted for inflation using the Nigerian consumer price index (cpi) (base year December 2009 = 100). Hence, the cost of diets is reported in 2009 Nigerian Naira4. On average, both protein-rich and starchy staples food groups have more than 10 food items each compared to vegetables and fruits with 5 items each and dairy, fat, and sugar with 2 items each. The mean cost of the three reference diets range between 139 Naira and 182 Naira, with the EAT-Lancet being the most expensive of the three followed by CoRD-FP. More specifically, the EAT-lancet costs of starchy staples, fruits and vegetables are the least expensive while that of CoRD-FP for fruits, starchy staples, and protein-rich foods are the most expensive of all the three reference diets examined.
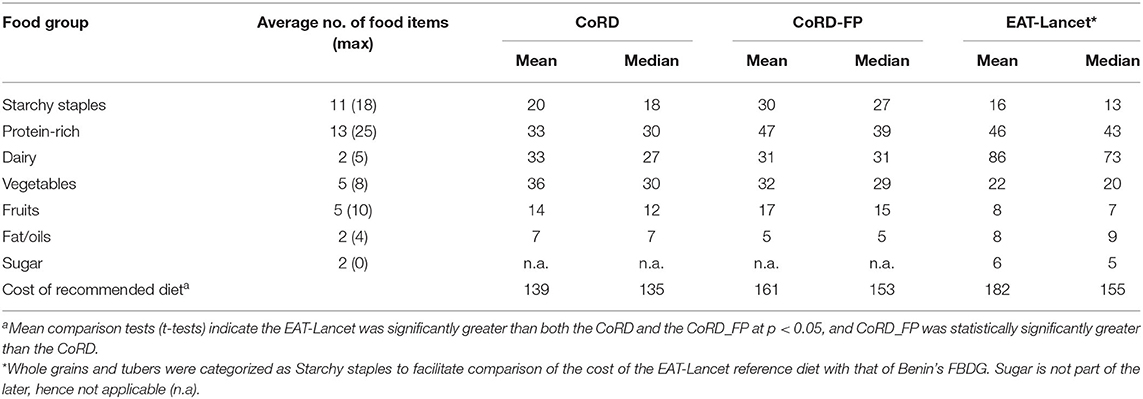
Table 2. The average cost of recommended diet in 2009 Nigerian Naira, pooled data (2015/16–2018/19).
We examined the three reference diets for total costs per food group. With respect to CoRD, vegetables, dairy and protein-rich foods are the first three groups of food items with relatively higher percentage contribution to the cost of diets that meet the dietary recommendations without consideration for taste and preferences (Figure 1). The percentage contribution of each of the three food groups is fairly close (23–25%). The implications are that it is costlier to meet dietary recommendations for vegetables, dairy and protein-rich foods than for other food groups. The combined contributions of the three food groups is approximately 72% of the minimum total cost of diets. Where healthier food consumption is to consider tastes and food preferences (CoRD-FP), the cost of meeting the recommended level of protein-rich foods is highest, accounting for about 28% of the minimum total cost of diets. This suggests a food group for which dietary recommendations is financially the most expensive to meet. Next to this are vegetables, dairy and starchy staples, the contribution of each of which is between (19–20%). Furthermore, protein-rich foods, vegetables and dairy also account for about 67% of the CoRD-FP. Starchy staples account for 14% of CoRD and 19% of CoRD-FP, suggesting that meeting the dairy requirements of this food group is more expensive when tastes and preferences are accommodated in healthy diets consumption considerations. Considering the case in which consumers (households) are more concerned about food systems sustainability in the choice of foods that meet their dietary recommendations (as in the EAT-Lancet diet recommendation), dairy foods account for the highest percentage (38%) of the minimum total cost of diets, followed by protein-rich foods, and vegetables which account for 28% and 13% of the minimum total cost of diets respectively. Starchy staples also account for 10% of the EAT-lancet minimum cost of diets.
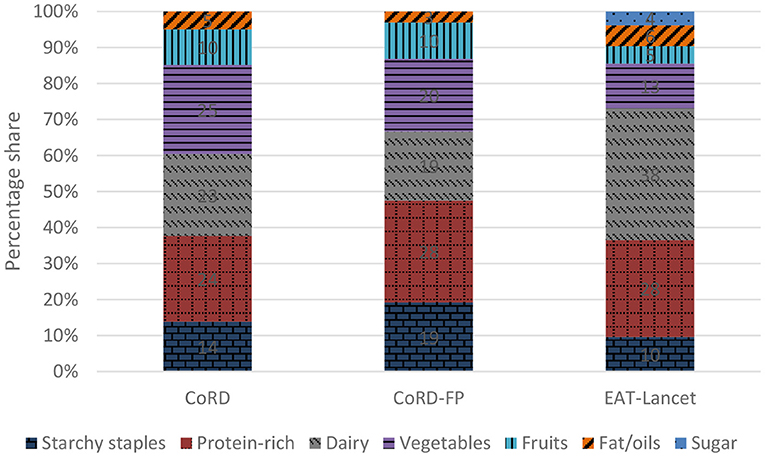
Figure 1. Cost share of food group from total cost of the reference diet, pooled data (2015/16–2018/19).
Figure 2 compares the costs of recommended diets estimated using a particular cost of diet approach over times (by survey years). Results show that the costs of dietary recommendations (both CoRD and CoRD-FP) for each of the food groups declined over time between 2015/16 and 2018/19 respectively except for dairy for which CoRD-FP increased. Similarly the cost shares associated with CoRD and CoRD-FP for each of the food groups declined over the time periods with the exception of dairy (Figure 3). For example, between the periods 2015/16 and 2018/19, the CoRD and CoRD-FP for dairy food groups rose by 6 and 4% points respectively. All else equal, this rise in costs may compromise the affordability of the recommended level of dairy consumption. This calls for attention on strategies to enhance affordability of dairy in the country. Although the seeming decline in the costs of achieving the dietary recommendations of some food groups (based on CoRD and CoRD-FP) may ostensibly (on one hand) connote an improvement in economic ability to buy more of such food groups, it may (on the other hand) also showcase a coping response/strategy that is reflective of an intra-food group substitution toward relatively cheaper foods as certain food items (within the food groups) become more expensive.
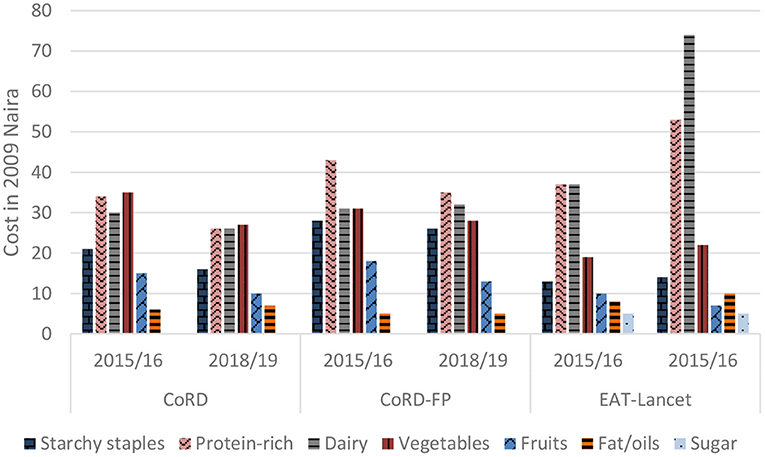
Figure 2. Median cost of reference diet by food group and year of survey.
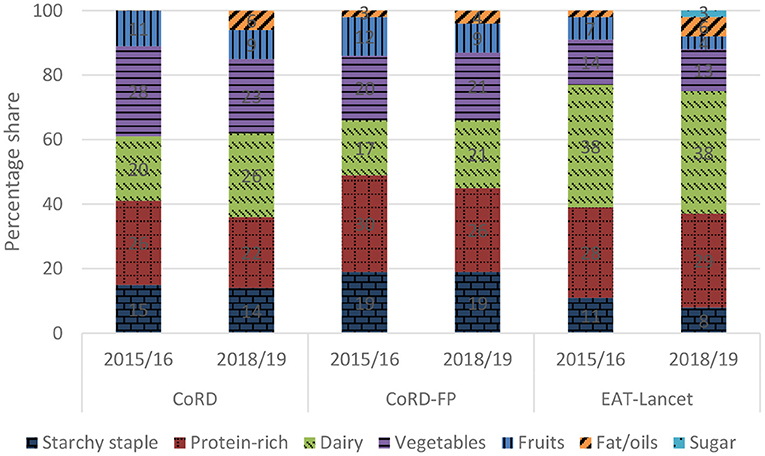
Figure 3. Cost share of food group from total cost of the reference diet, by year of survey.
Whereas the costs of dietary recommendations (CoRD-FP and CoRD) for nearly all the food groups decreased over the periods (between 2015/16 and 2018/19), the costs shares (CoRD-EATL) for most food groups however remain fairly the same over time except for fruits and starchy staples which fell slightly by 3–4% points. This also may connote an improvement in household economic ability to buy more starchy staples and fruits between the two periods or strategies to optimize cost of dietary recommendations by re-allocating already available food group budgets among the food items within the groups. On the overall, the costs of dietary recommendations for dairy, protein-rich foods and vegetables are consistently and considerably higher than that of other food groups over time, and for all the dietary reference costs examined. Costs of diets based on the EAT-Lancet recommendations for dairy and protein-rich foods are even higher than that of CoRD and CoRD-FP. It becomes imperative to ensure that at least a minimum selection of food items that contribute to healthy and sustainable diets is available at affordable prices.
The estimated costs of diets based on CoRD-FP and CoRD are not radically different in South-west and South-east zones (Figure 4). Some variation exits between the two cost estimates in the other zones. As would normally be expected, cost estimate based on CoRD is lower than CoRD-FP across the zones. This is because CoRD places more emphasis on cheaper and relatively less preferred foods (that meets dietary recommendations) compared to CoRD-FP which tends to account for the more preferred but expensive foods in household choice of healthy diets. Hence, findings would suggest the need for consumers to shift to other low cost foods that can meet their dietary recommendations. Achieving this would entail providing information that would guide consumer's choice on such low cost foods. Policy actions that would help keep down cost of food production and escalated food prices are also crucial to enable consumption of preferred foods at affordable prices. Apart from North-west and North-east zones, estimates based on CoRD-EATL is higher than CoRD-FP.
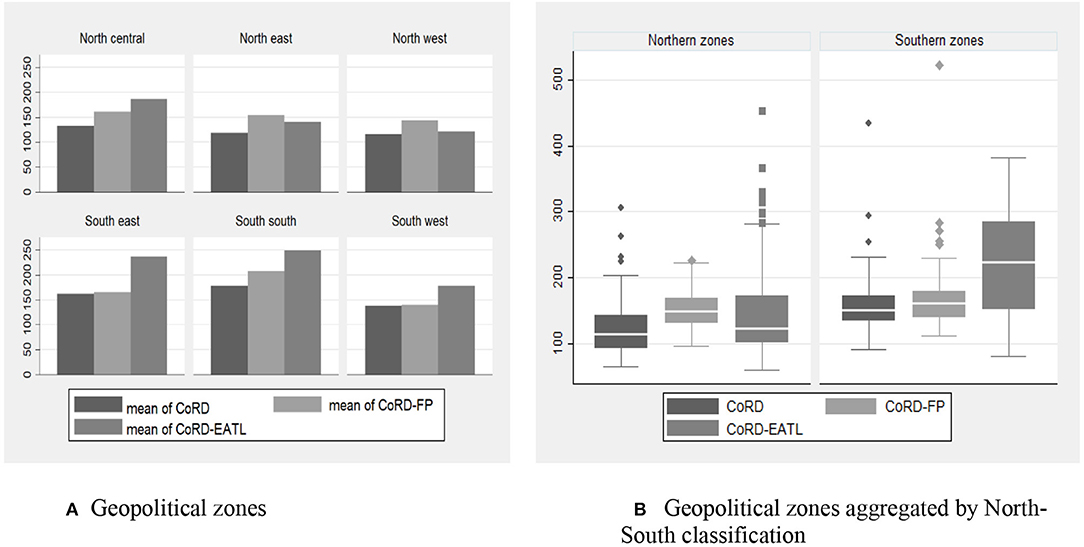
Figure 4. Median cost of diet by Nigerian zones, pooled data (2015/16–2018/19). In (B), for each reference diet, the length of the box indicates the interquartile range (IQR); the upper marker indicates the largest value within 1.5 IQR of the upper quartile; and the lower marker indicates the smallest value within 1.5 IQR of the lower quartile. The line subdividing each box shows the median cost of each reference diet during the study period.
The results would mean higher cost of meeting dietary recommendations for sustainable consumers in the region. The key issues here is to be able to reconcile the tradeoffs between pursuing sustainable food systems goals and enhancing affordability of foods in line with household preferences, especially giving the financial burdens of meeting dietary recommendations and other non-food welfare needs/obligations in the face of rising level of poverty among many households.
If the goal is purely toward meeting dietary recommendations in line with tastes and preferences, achieving dietary recommendations will be less expensive in South-west and North-west zones, compared to other zones (with South-south zone having the highest financial cost of meeting recommendations, addressing the challenge of affordability in the South-south region should be of top priority). However, if emphasis is toward meeting dietary recommendation from a sustainable food systems, more serious attention should be given to the issues of food affordability in the North-central and Southern zones of the country.
At the national level, results show that affordability of diets have improved over the years from 2015/16 to 2018/19, particularly for CoRD and CoRD-FP (Table 3). Nonetheless the challenge seems to be more in the rural area than urban sector, and in the northern part of Nigeria than the southern region (especially for CoRD-FP). One reason may be due to issues of poverty which is more pronounced in the rural area and northern part of Nigeria (National Bureau of Statistics (NBS), 2020). Besides, some complexities exist in the pattern of rural-urban food prices that may precipitate greater affordability of diets in urban than in rural areas. For example, prices of processed packaged foods (such as imported rice, pasta, canned milk, juices, and so on) which are usually transported from urban centers are expected to be higher on getting to the rural areas (due to transportation costs) while the raw (unprocessed) foodstuffs produced in rural area may be cheaper (in the region of production). In a study on rural-urban food price gap in Nigeria, Nakamura et al. (2016) documented higher prices of some processed foods in rural than in urban area. In addition, rural households are also being confronted with challenge of higher cost of food especially in the lean season. Even though most rural households do produce and consume food from self-production, they are not all the year round net-producers of the foods they consume. The perishability of agricultural produce in the face of inadequate storage and processing facilities often compel them to sell/dispose the “excess/surplus production” almost immediately after harvest in order to meet other household needs and come back later in the year (during lean season) to buy in the market at higher prices. Thus, affordability of dietary recommendations becomes more of a challenge in the rural areas especially when relatively costlier processed packaged foods, with longer shelve lives, are the more readily available options for dwellers. This calls for periodic examination of seasonal variation in food prices (cost of diets) in the rural area. There are needs for investment in value chain interventions (for example in food processing) and other innovations that could help lower costs and improve affordability of diets especially in rural Nigeria. In northern Nigeria where CoRD-FP is higher, there are implications for innovation in healthy food products that are affordable and in harmony with culture (social concerns) and preferences in the region.
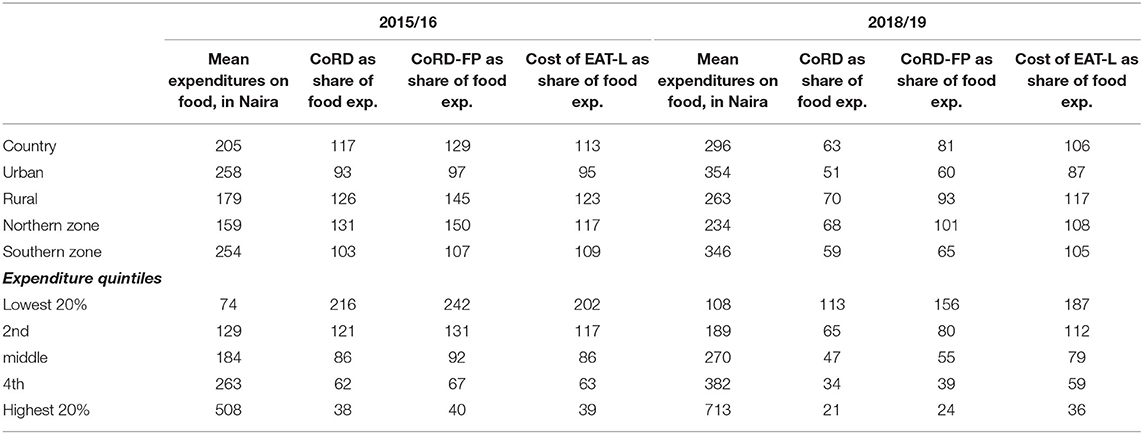
Table 3. Cost of diet as percent of total food expenditures.
Results (on the overall average) also show that affordability of diets based on EAT-Lancet dietary recommendations remains low and without any considerable improvement over time. Analysis based on 2018/19 data indicates that the EAT-Lancet dietary recommendation is the most expensive to meet of all the costs of diets examined. The challenge of affordability also seems more in the rural area. To be able to drive consumption behavior in the country toward achieving the EAT-Lancet dietary recommendations, it is important to incorporate (among others) ecological principles and sustainable protein mixes in the Nigeria's FBDG, improve welfare and raise awareness on the need to be more inclined toward food systems sustainability (ecological consideration) while making dietary choices, more especially in the rural areas.
A disaggregated analysis by expenditure (income) quintiles also reveal that affordability of foods tends to increase with improvement in economic status. This is because the share of cost of diets to total food spending declined with higher level of income. The percentage share is highest (standing consistently above 110% over the years) among households in the lowest income quintile, indicating a household group with the least economic capability to afford healthy foods. Thus interventions targeting on affordability of healthy diets should give greater priority to the poorest of the poor in the population. This can be in form of safety net measures for the poorest income group. Although affordability of diets still remains very low among households at the base of income quintiles, their food expenditures over time tends to keep on a par with the costs of dietary recommendations, especially the CoRD. The CoRD in 2015/16 costed more than twice as much as the poorest (lowest income group) could spend on food. However, in 2018/2019, similar household group would only have to increase food spending by a paltry (of about 13%) to meet cost. Again, such improvement in affordability may be associated with efforts (government or non-governmental organizations) to improve livelihoods among the poorest of the poor and/or substitution (in response to lower or higher prices of selected food items). Much may be unpacked about affordability of diets among this group by looking at the prevalence of households that cannot afford the reference diet over time (Figure 5), and through further research examining how many were left behind in this progress as well as the variation around the mean among the poor(est). Nonetheless, we stress the need to test (monitor) the robustness of affordability, and promote policies that will guarantee sustained affordability for the most vulnerable.
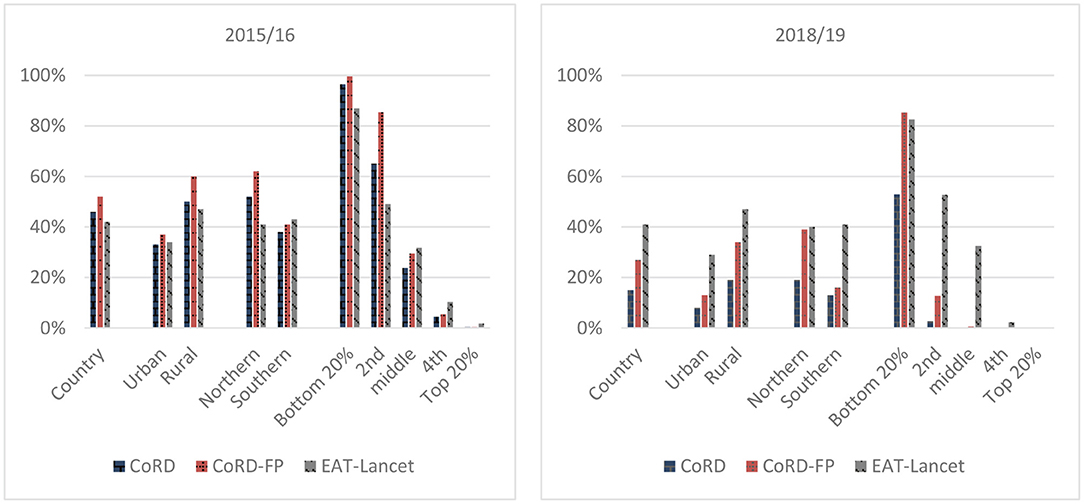
Figure 5. Share of households that cannot afford the reference diet, by year of survey.
At the national level, the food budgets of greater proportion (52%) of households are inadequate to enable them afford enough foods that meet their dietary recommendations and food preferences (Figure 5). Even if households are to compromise their dietary preferences for food systems sustainability, considerable percentage (42–46%) of households are still unable to meet dietary recommendations. Concerted efforts have to be put in place to forestall situations in which more households will be unable to afford enough healthy foods The problem of food affordability (captured in terms of the prevalence of households whose food budget is inadequate to meet cost of reference diets) seems to be more pronounced in rural than urban area and in northern region than in southern region of Nigeria. The challenge is more among households in the lowest income groups. The foregoing suggests that greater attention be given to the rural sectors and the poorest of the poor of the society with respect to interventions targeting toward enhancing affordability of healthy diets.
Results show that the extents of the shortfall in the expenditures required to meet dietary recommendations are higher among households in rural areas, and those in the lowest income group compared to other households groups. The pattern is consistent over the years and for almost all the various cost of reference diets examined (Figure 6). However, in 2019, the extent of the food budget shortfall required to meet up the least cost of achieving dietary recommendations (with food preferences) is higher in urban than in the rural area. It is not unthinkable that this rural–urban swings in the financial burden (shortfall in the cost) of meeting dietary recommendations could re-occur in the future as food preferences changes with time. There is therefore the need for periodic monitoring of cost of food affordability across locations and over time. This is important for better (more efficient) targeting of potential interventions aimed at enhancing food affordability across rural-urban divide of the country. The results would also mean that reducing inequality across socioeconomic groups will reduce the overall prevalence of food insecurity in terms of food affordability in the population.
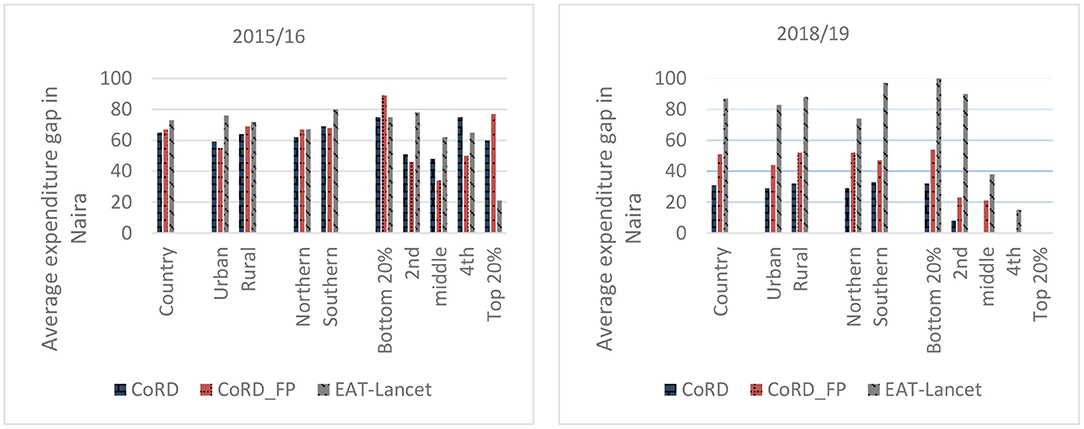
Figure 6. Extent of expenditure gap of households that cannot afford the reference diet, pooled data.
Based on the existing expenditure patterns on each food group over the years, the results indicate that budgetary allocation to dairy and vegetables are still largely inadequate to meet the minimum cost of diets for the food groups (Table 4 and Figure 7). However, the expenditure of starchy staples, protein-rich foods and fats and oils are respectively higher than the minimum cost needed to achieve dietary recommendations for the food groups. The results point to the potential gains from reallocating the “excess” spending on different food groups (such as starchy staples, protein-rich foods and fats and oils) to other nutrient-dense foods. There is the need to nudge and educate households on the cost of foods for healthy diets for each food groups, the dietary recommendations and the need to reallocate food spending more toward meeting the minimum cost of dietary recommendations, especially for vegetables and dairy.
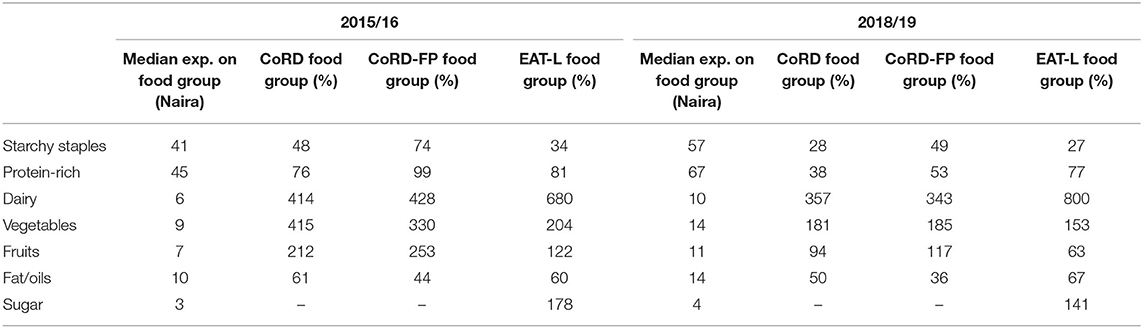
Table 4. Median cost of food group as percent of household expenditures on food group.
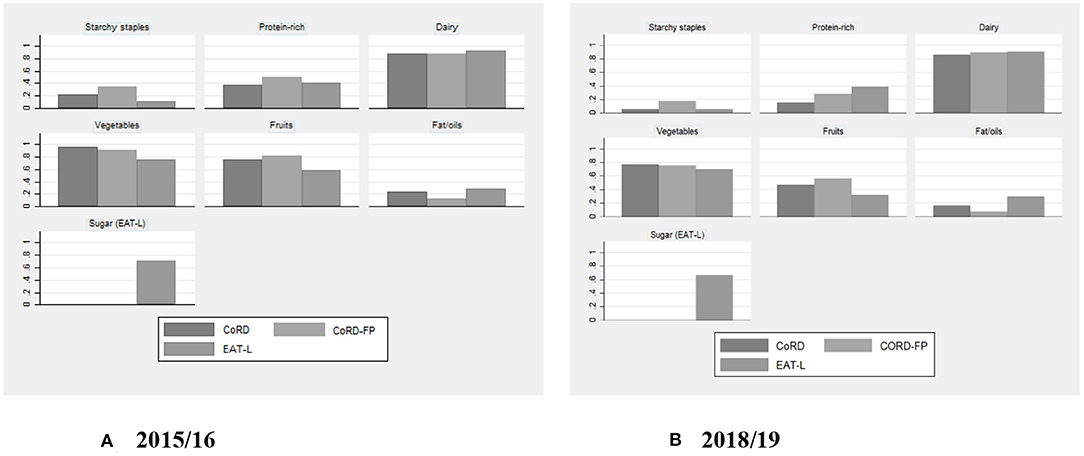
Figure 7. Fraction of households whose expenditures per food group were below cost of the food group by survey year.
One huge challenge confronting the world today is how to provide healthy diets for all in a manner that guarantees sustainability of the food systems. Achieving this task can be more daunting for low- and middle-income countries (such as Nigeria) where the food systems are weaker and unable to deliver healthier diets for the population in a sustainable manner, a situation that has resulted in unaffordability of healthy foods for many and exclusion of majority of the poor to hunger and malnutrition. To optimally address these challenges, approaches must be context specific, giving considerations to local and regional realities and reconciling, among others, the costs of the diets for achieving dietary recommendations considering the variability in food preferences at subnational levels and inclinations of household consumers toward food systems' sustainability in their food choices. Knowledge of the minimum costs and affordability of diets for achieving dietary recommendations with or without recourse to the habitual food preferences of the households and the costs of dietary recommendations if households were to consider sustainability of the food systems in their food choices is lacking in Nigeria and many other countries in Africa. Such information is crucial for the development of policy options and interventions that can accelerate attainment of SDGs on health and nutrition in Nigeria. Motivated by the concerns, this study empirically assessed the cost and affordability of healthy diets across time and space in Nigeria, and the prevalence and extent of shortfalls in affordability of healthy diets when compared with minimum costs of dietary recommendations.
On the overall (national level), we found generally that is more expensive to meet the costs of dietary recommendations for vegetables, dairy and protein-rich foods than that of the other food groups. The challenges of affordability (situation of households food expenditures are inadequate to meet the minimum costs of diets) appear more pronounced in rural than urban, among the poorest household groups, and in northern than southern Nigeria. It can be inferred from the findings that it will be more expensive to meet the dietary recommendation for dairy foods if priority will be given for food systems sustainability over concerns for food preferences in the food consumption baskets of the households. It will however be cheaper to achieve dietary recommendations for vegetables, fruits and starchy staples even when households give more consideration to food systems sustainability than tastes and preferences in their choice of healthy foods. Relative affordability of protein-rich foods are less affected by whether (or not) tastes/preferences or food systems sustainability drives healthy food choices.
To ensure affordability of healthy foods that meet dietary recommendations and that are consumed with sustainability of the food systems in perspectives, interventions should focus more on rural and northern Nigeria and among the poorest of the poor in the population. There is the need to step up actions toward promoting affordability of nutrient-rich foods, especially vegetables, dairy and protein-rich foods without comprising environmental sustainability. There are implications for research, policy, and other actors that focus on transformation of the food systems toward achieving healthier diets in a sustainable food systems. The government should intensify efforts on boosting food production and maintain sound macroeconomic policy environment that would calm escalated food prices. Traders and private sector investors should be encouraged to invest in, and embrace innovations that could drive down the cost of diets and ensure stable availability of foods affordable to the poor. Educational/research institutes, the Nutrition Society of Nigeria, the media, non-governmental organizations and other relevant government functionaries have enormous roles to play. This could be in terms of nutrition education, awareness on the minimum costs that meet dietary recommendations across different localities, promoting ecological principles in food production and consumption, periodic food prices monitoring and consumption studies to capture possible fluctuations in costs (and affordability) of diets and changes/shifts in food consumption/dietary patterns across time and space, need for consumer orientated safety nets for the ultra-poor on vegetables and dairy products. Consumers, producers, traders and other key market actors should be willing to embrace practices that enhance sustainable food systems. It should be noted that recommendations are all else equal, other interventions that will address the fragile economic environments in the country, enhance production, supply and distribution of foods, reduce post-harvest losses, promote resilience and capacity of the food systems to deliver affordable healthy foods in a sustainable manner are advocated.
Last, despite our attempt to optimally exploit available information for the research, this study has several limitations. Our analysis of food consumption relies on a 7-days estimate of household's food consumption converted to per adult female equivalent (AFE) unit per day. While this is common practice in related research in the absence of information about daily, individual-level food consumption, the distribution of food during the 7 days among family members may not be the same as that implied by the AFE scale. In addition, our use of median prices generated from self-reported expenditures and self-reported quantities for purchased foods may deviate from food prices generated by market monitoring surveys. Further, for lack of quantified food based dietary guideline specific to Nigeria, our use of dietary guideline from neighboring country, Benin, and that of the EAT-Lancet references may not fully reflect the food culture and consumption behavior of Nigerian consumers. Hence, future studies should overcome these limitations with availability of—quantified Nigerian dietary guideline, individual level consumption data, and better food prices data. Further, the cost and affordability of healthier foods are likely to vary across States in Nigeria depending on local food production capacity, market connectivity, infrastructural development, and other components of food systems. Since data used in this study is not representative at States level, further research that uses more representative data taking into account the above heterogeneities is necessary to help identify subnational level policies and targeted interventions that may improve affordability of healthy diets and food systems change in Nigeria.
Publicly available datasets were analyzed in this study. This data can be found here: https://microdata.worldbank.org/index.php/catalog/2734
TA and DM originated the idea. DM developed methodology for data analysis. TL managed the data. DM analyzed the data. DM and DA wrote the first draft. TA and ET proofread and contributed to the discussion. All authors improved the discussion of results and write-up of the manuscript. All authors contributed to the article and approved the submitted version.
This work was undertaken as part of the CGIAR Research Program on Agriculture for Nutrition and Health (A4NH). The opinions expressed here belong to the authors, and do not necessarily reflect those of A4NH or CGIAR.
The authors declare that the research was conducted in the absence of any commercial or financial relationships that could be construed as a potential conflict of interest.
All claims expressed in this article are solely those of the authors and do not necessarily represent those of their affiliated organizations, or those of the publisher, the editors and the reviewers. Any product that may be evaluated in this article, or claim that may be made by its manufacturer, is not guaranteed or endorsed by the publisher.
1. ^While daily energy requirements vary by age, sex, body size, physical activity level, etc., in this study we use threshold of 2,500 kcal/day for an adult of a 70-kg man aged 30 years and a 60-kg woman aged 30 years whose level of physical activity is moderate to high, following Willett et al. (2019).
2. ^Indicators that have been developed for the cost of a nutritious diet calculation include: Cost of Recommended Diet (CoRD); Cost of Nutrient Adequacy (CoNA); Cost of the Diet (CotD) and Fill the nutrient gap (FNG); Optifood; Nutritious-food Price Index (NPI); and, Cost of Diverse Diet (CoDD).
3. ^The Nigerian food guide identify five food groups into a food pyramid, indicating that food groups at the bottom two levels of the pyramid (i.e., bread, grains and tubers, followed by vegetables and fruits) to be eaten at every meal; foods on the third level (including eggs, fish, meat and dairy) to be eaten in moderation; foods on the fourth level (i.e., oils and fats) to be eaten sparingly; and food group at the top most of the pyramid (i.e. confectionery) to be eaten in rare occasions. The Nigerian food pyramid is available at the following link: http://www.fao.org/nutrition/education/food-dietary-guidelines/regions/countries/Nigeria/en (accessed April 7, 2021).
4. ^The average cpi during the post-planting and post-harvest surveys respectively was 176 and 190 in 2015/16, and 266 and 278 in 2018/19. The cost of diet in current prices (nominal value) can be obtained by multiplying the real value by the cpi and dividing the result by 100. For example, if the mean cpi during the study period was 228 naira, the mean CoRD (i.e., 139 Naira) in current prices would be (139*228)/100 = 316 Naira.
Adewopo, J. B., Solano-Hermosilla, G., Colen, L., and Micale, F. (2021). Using crowd-sourced data for real-time monitoring of food prices during the COVID-19 pandemic: insights from a pilot project in northern Nigeria. Global Food Secur. 29:100523. doi: 10.1016/j.gfs.2021.100523
Akerele, D. (2015). Household food expenditure patterns, food nutrient consumption and nutritional vulnerability in nigeria: implications for policy. Ecol. Food Nutr. 54, 546–571. doi: 10.1080/03670244.2015.1041136
Akerele, D., Sanusi, R. A., Fadare, O. A., and Ashaolu, O. F. (2017). Factors influencing nutritional adequacy among rural households in Nigeria: how does dietary diversity stand among influencers? Ecol. Food Nutr. 56, 187–203. https://doi.org/10.1080/03670244.2017.1281127
Babatunde, R. O., and Qaim, M. (2010). Impact of off-farm income on food security and nutrition in Nigeria. Food Policy 35, 303–311. doi: 10.1016/j.foodpol.2010.01.006
Bachewe, F., Hirvonen, K., Minten, B., and Yimer, F. (2017). The rising costs of nutritious foods in Ethiopia. ESSP Research Note 67, IFPRI/EDRI.
Bai, Y., Alemu, R., Block, S. A., Headey, D., and Masters, W. A. (2020). Cost and affordability of nutritious diets at retail prices: evidence from 177 countries. Food Policy 99:101983. doi: 10.1016/j.foodpol.2020.101983
Busquet, E. (2010). Cost of Diet Assessment: Daura LGA, Katsina State, Nigeria. Nigeria: Save the Children.
Chastre, C., Duffield, A., Kindness, H., LeJeune, S., and Taylor, A. (2007). The Minimum Cost of a Healthy Diet: Findings From Piloting a New Methodology in Four Study Locations. London: Save the Children.
Coates, J., Rogers, B. L., Blau, A., Lauer, J., and Rob, A. (2017). Filling a dietary data gap? Validation of the adult male equivalent method of estimating individual nutrient intakes from household-level data in Ethiopia and Bangladesh. Food Policy 72, 27–42. doi: 10.1016/j.foodpol.2017.08.010
Cost of Nutritious Diets Consortium (2018). Indicators and Tools for the Cost of Nutritious Diets. Boston, MA: Tufts University.
Dizon, F., Herforth, A., and Wang, Z. (2019). The cost of a nutritious diet in Afghanistan, Bangladesh, Pakistan, and Sri Lanka. Global Food Secur. 21, 38–51 doi: 10.1016/j.gfs.2019.07.003
Ecker, O., and Hatzenbuehler, P. L. (2021). Food consumption–production response to agricultural policy and macroeconomic change in Nigeria. Appl. Econ. Perspect. Policy 2021, 1–21. doi: 10.1002/aepp.13161
FAO IFAD, UNICEF and WFP, and WHO. (2020). The State of Food Security and Nutrition in the World 2020. Transforming Food Systems for Affordable Healthy Diets. Rome: FAO.
Filzmoser, P., Gussenbauer, J., and Templ, M. (2016). Detecting Outliers in Household Consumption Survey Data. Vienna. Austria: Vienna University of Technology.
Heady, D. D., and Alderman, H. H. (2019). The relative caloric prices of healthy and unhealthy foods differ systematically across income levels and continents. J. Nutr. 149, 2020–2033. doi: 10.1093/jn/nxz158
Herforth, A., Bai, Y., Venkat, A., Mahrt, K., Ebel, A., and Masters, W. A. (2020). Cost and Affordability of Healthy Diets Across and Within Countries. Background Paper for The State of Food Security and Nutrition in the World 2020. Rome: FAO.
Hirvonen, K., Bai, Y., Heady, D., and Masters, W. A. (2019). Affordability of the EAT–Lancet reference diet: a global analysis. Lancet Glob. Health 8, e59–e66. doi: 10.1016/S2214-109X(19)30447-4
Mahrt, K., Mather, D., Herforth, A., and Headey, D. (2019). Household dietary Patterns and the Cost of a Nutritious Diet in Myanmar. IFPRI Discussion Paper 1854. Washington, DC: IFPRI.
Masters, W. A., Bai, Y., Herforth, A., Sarpong, D., Mishili, F., Kinabo, J., et al. (2018). Measuring the affordability of nutritious diets in Africa: price indexes for diet diversity and the cost of nutrient adequacy. Am. J. Agric. Econ. 100, 1285–1301. https://doi.org/10.1093/ajae/aay059
Mekonnen, D. A., Trijsburg, L., Achterbosch, T., Brouwer, I. D., et al. (2021). Food consumption patterns, nutrient adequacy and the food systems in Nigeria. Agric. Food Econ. 9, 1–21. doi: 10.1186/s40100-021-00188-2
Nakamura, S., Harati, R., Lall, S. V., Dikhanov, Y. M., Hamadeh, N., Oliver, W. V., et al (2016). Is Living in African Cities Expensive? Policy Research Working Paper 7641. Word Bank Group. Available online at: https://documents1.worldbank.org/curated/en/429961468185035012/pdf/WPS7641.pdf (accessed August 1, 2021).
National Bureau of Statistics (NBS) (2020). 2019 Poverty and Inequality in Nigeria: Executive Summary. May 2020. Nigeria: NBS.
Nigeria Federal Ministry of Health (FMoH) (2006). Food based dietary guidelines for Nigeria. Nigeria: FMoH.
Nigerian National Bureau of Statistics (NBS) (2019). LSMS Integrated Surveys on Agriculture, Nigeria General Household Survey-Panel Wave 4. A Survey Report by the Nigerian National Bureau of Statistics in Collaboration with the World Bank. Available online at: https://microdata.worldbank.org/index.php/catalog/3557/related-materials
Raaijmakers, I., Snoek, H., Maziya-Dixon, B., and Achterbosch, T. (2018). Drivers of vegetable consumption in Urban Nigeria: food choice motives, knowledge, and self-efficacy. Sustainability 10, 1–14. doi: 10.3390/su10124771
Raghunathan, K., Headey, D., and Herforth, A. (2020). Affordability of nutritious diets in rural India. Food Policy 99:10192. doi: 10.2499/p15738coll2.133638
Shittu, A. M., Akerele, D., and Haile, M. (2018). Effects of food price spikes on household welfare in Nigeria. ZEF-Discussion Papers on Development Policy No. 248. doi: 10.2139/ssrn.3156939
Sununtnasuk, C., and Fiedler, J. L. (2017). Can household-based food consumption surveys be used to make inferences about nutrient intakes and inadequacies? A Bangladesh case study. Food Policy 72, 121–131. doi: 10.1016/j.foodpol.2017.08.018
Willett, W., Rockström, J., Loken, B., Springmann, M., Lang, T., Vermeulen, S., et al. (2019). Food in the Anthropocene: the EAT–Lancet Commission on healthy diets from sustainable food systems. Lancet 393, 447–492. https://doi.org/10.1016/S0140-6736(18)31788-4
Keywords: cost, affordability, healthy diets, sustainability, Nigeria
Citation: Mekonnen DA, Akerele D, Achterbosch T, de Lange T and Talsma EF (2021) Affordability of Healthy and Sustainable Diets in Nigeria. Front. Sustain. Food Syst. 5:726773. doi: 10.3389/fsufs.2021.726773
Received: 17 June 2021; Accepted: 11 August 2021;
Published: 13 September 2021.
Edited by:
Danny Hunter, Alliance Bioversity International and CIAT, FranceReviewed by:
Marisa Porrini, University of Milan, ItalyCopyright © 2021 Mekonnen, Akerele, Achterbosch, de Lange and Talsma. This is an open-access article distributed under the terms of the Creative Commons Attribution License (CC BY). The use, distribution or reproduction in other forums is permitted, provided the original author(s) and the copyright owner(s) are credited and that the original publication in this journal is cited, in accordance with accepted academic practice. No use, distribution or reproduction is permitted which does not comply with these terms.
*Correspondence: Daniel A. Mekonnen, ZGFuaWVsLm1la29ubmVuQHd1ci5ubA==
Disclaimer: All claims expressed in this article are solely those of the authors and do not necessarily represent those of their affiliated organizations, or those of the publisher, the editors and the reviewers. Any product that may be evaluated in this article or claim that may be made by its manufacturer is not guaranteed or endorsed by the publisher.
Research integrity at Frontiers
Learn more about the work of our research integrity team to safeguard the quality of each article we publish.