 Ciniro Costa Jr.1,2*
 Gillian L. Galford3
 Michael T. Coe2
 Marcia Macedo2
 KathiJo Jankowski2,4Christine O'Connell5Christopher Neill2,6
- 1CGIAR Research Program on Climate Change, Agriculture and Food Security (CCAFS), Bogotá, Colombia
- 2Woodwell Climate Research Center, Falmouth, MA, United States
- 3University of Vermont, Burlington, VT, United States
- 4Upper Midwest Environmental Sciences Center, United States Geological Survey, Middleton, WI, United States
- 5Institute on the Environment, University of Minnesota, St Paul, MN, United States
- 6Marine Biological Laboratory (MBL), Woods Hole, MA, United States
Nitrogen (N) fertilizer use is rapidly intensifying on tropical croplands and has the potential to increase emissions of the greenhouse gas, nitrous oxide (N2O). Since about 2005 Mato Grosso (MT), Brazil has shifted from single-cropped soybeans to double-cropping soybeans with maize, and now produces 1.5% of the world's maize. This production shift required an increase in N fertilization, but the effects on N2O emissions are poorly known. We calibrated the process-oriented biogeochemical DeNitrification-DeComposition (DNDC) model to simulate N2O emissions and crop production from soybean and soybean-maize cropping systems in MT. After model validation with field measurements and adjustments for hydrological properties of tropical soils, regional simulations suggested N2O emissions from soybean-maize cropland increased almost fourfold during 2001–2010, from 1.1 ± 1.1 to 4.1 ± 3.2 Gg 1014 N-N2O. Model sensitivity tests showed that emissions were spatially and seasonably variable and especially sensitive to soil bulk density and carbon content. Meeting future demand for maize using current soybean area in MT might require either (a) intensifying 3.0 million ha of existing single soybean to soybean-maize or (b) increasing N fertilization to ~180 kg N ha−1 on existing 2.3 million ha of soybean-maize area. The latter strategy would release ~35% more N2O than the first. Our modifications of the DNDC model will improve estimates of N2O emissions from agricultural production in MT and other tropical areas, but narrowing model uncertainty will depend on more detailed field measurements and spatial data on soil and cropping management.
Introduction
Agriculture directly accounts for 10–12% of worldwide anthropogenic greenhouse gas emissions (GHG), so it is a major concern for climate change policy (Smith et al., 2014). In the 2015 Paris Agreement of the United Nations Framework Convention on Climate Change, about 120 countries pledged to reduce direct agricultural GHG emissions and some pledged to reduce indirect agricultural emissions from expansion of crop and grazing lands (Richards et al., 2016).
Information on GHG emissions and potential for mitigating emissions by changing management practices is badly need, particularly in regions of rapid cropland expansion, intensification and increased fertilizer use.
Nitrous oxide (N2O) has the greatest Global Warming Potential (GWP) of gases commonly produced by agriculture and 265 times higher than that of CO2 (100-year time horizon) according to a report of the Intergovernmental Panel on Climate Change (IPCC, 2013). Agricultural soils are the largest single source of total anthropogenic N2O emissions (Smith, 2017), contributing to approximately 60% of this total (IPCC, 2019a; Tian et al., 2020). N2O originates from the microbial processes of nitrification and denitrification and strongly depends on soil environmental conditions, biological nitrogen fixation, N fertilizer application, and aspects of crop management (Snyder et al., 2009; Butterbach-Bahl et al., 2013). The use of N fertilizers in agriculture is the major anthropogenic source of N2O emissions from soils (IPCC, 2019a). In global scale models, fertilizer induced N2O emissions are estimated to be approximately 1% of N fertilizer applied (Bouwman et al., 2002; IPCC, 2019b), but whether and how this relationship varies among regions of intensively fertilized agriculture globally is not well understood (Snyder et al., 2009; Huddell et al., 2020).
Most expansion and intensification of crop agriculture now occurs in tropical regions, with rapid expansion into forests and savannas where annual rainfall adequately supports at least one growing season (Gibbs et al., 2010). The effects of high N fertilizer applications on N2O production have been documented in many temperate croplands and the effects in humid tropical regions are much less well known, and assumptions that tropical soils will behave similarly to temperate analogs may not hold true (Hickman et al., 2017; Dorich et al., 2020; Global N2O Database, 2020; Tesfay et al., 2021). Tropical soils in regions where agriculture is expanding are typically deep and highly weathered and likely to differ mineralogically (Six et al., 2002), hydrologically (Wohl et al., 2012; Neill et al., 2013), biogeochemically (Vitousek, 1984), and microbiologically (Sul et al., 2013) compared to most temperate zone agricultural soils.
The state of Mato Grosso (MT) covers 90 million ha in the Brazilian Legal Amazon and has experienced rapid expansion of soybean cropland since 1990 (Morton et al., 2006; Galford et al., 2010; Macedo et al., 2012; MapBiomas, 2019). Agriculture now occupies ~40% of its total land area of MT and now produces ~10% of global soybean (IBGE, 2015; MapBiomas, 2019; FAO-STAT, 2021). Recently, soybean croplands in MT have been undergoing intensification by adding maize as a second crop during one growing season (Spera et al., 2014, 2016), and this has increased agricultural output threefold from 2000 to 2010. By 2010, soybeans were cultivated on almost 60% of MT's croplands, 90% of which were double cropped with maize (Spera et al., 2014). This expansion of double cropping with maize led MT to produce 1.5% of global maize in 2014 (IBGE, 2020; FAO-STAT, 2021).
The expansion of soybean-maize double cropping has potential implications for GHG emissions because maize requires N fertilizer whereas little to none is typically applied to soybean (Galford et al., 2010). As MT croplands intensified through double cropping, the amount of N fertilizer used has almost quadrupled during the last decade from about 0.1 to 0.4 million tons (ANDA, 2020). As a result, MT alone used the equivalent of ~5% of all N fertilizer applied in South American agriculture and 0.4% of global N fertilizer utilized (ANDA, 2020; FAO-STAT, 2021). Brazil now faces the challenge of balancing increased maize production against the potentially harmful effects of N2O emissions from increased cropland area and N fertilizer use.
Estimating N2O emissions from soils is challenging because measurement is time consuming, labor intensive and costly, and because emissions vary in space and time. To date there have been few field-based estimates of N2O emissions that correspond to varying levels of fertilization, especially from tropical croplands (Hickman et al., 2015, 2017; Meurer et al., 2016; Jankowski et al., 2018; Huddell et al., 2021). Process-based models that simulate biogeochemical activity involved in ecosystem C and N cycling while accounting for site characteristics (e.g., climate and soils) are useful to estimate N2O emissions. Several such process-based simulation models have been developed. These include DNDC (Li et al., 1992a,b), DayCENT (Del Grosso et al., 2001), MITERRA-EUROPE (Velthof et al., 2007) and Simile (Packham et al., 2006).
These models were developed for temperate croplands, so they are not always appropriate to analyze tropical conditions. Many highly-weathered tropical soils typically have clay content that ranges from 20 to 80%. In temperate climates, soils with more than about 60% clay are considered to have low permeability, which affects soil processes represented in models (Carsel and Parrish, 1988). Often tropical soils show different emergent properties compared with temperate soils of similar clay content, including low bulk density (0.7–1.2 Mg m−3), high permeability (Ksat ~10–1,000 mm h−1) and low available water capacity (70 mm m−1), all of which are explained by the micro-aggregated structure of tropical soils (Tomasella and Hodnett, 1996, 2005). These physical attributes of tropical soils contribute to differences in their relative low rates of nitrification and denitrification, as well as to the relative low quantity of N2O and nitric oxide (NO) produced when compared with temperate fertilized croplands (Kiese et al., 2005; Hickman et al., 2015; Meurer et al., 2016; Huddell et al., 2021). Accurate application of current process-based models to estimate N2O emissions from fertilized, cultivated tropical soils requires that these distinct soil physical characteristics be considered.
The DNDC biogeochemical model estimates GHG emissions from agricultural soils at site and regional scales, but has not previously been parameterized for tropical agriculture (Li et al., 2001; Smith et al., 2010; Haas et al., 2013; Global DNDC Network, 2018). The original soil hydraulic submodel in DNDC utilizes a matrix flow for 12 soil texture classes based on pedotransfer functions (PTF) derived from the van Genuchten (1980) equation. These PTFs may not be appropriate for tropical soils, because aggregate structure, and bioturbation can increase permeability in heavier texture classes. Most tropical soils have a lower bulk density (0.9–1.2 g cm−3) compared to temperate soils and are highly permeable because of their micro-aggregated structure (Werner et al., 2007).
Here we calibrated and validated the DNDC model for fertilized Mato Grosso croplands with field measurements of crop growth and N2O emissions and used the model to evaluate two scenarios by which Brazil could meet its future crop production goals while minimizing additional N2O emissions. Our main objectives were to: (1) Re-parameterize the DNDC model in order to accurately simulate N2O emissions and crop production from single (soybean) and double cropping (soybean-maize) systems in MT and (2) apply the model in order to explore scenarios that might meet future demand for maize production while minimizing N2O emissions in this region of rapid crop intensification.
Methods
DNDC Model: Description and Adaptation
The DNDC model is a process-based biogeochemical model that simulates crop growth, soil C, and N cycling and associated biosphere–atmosphere exchange of C and N trace gases, as well as N leaching (Li et al., 1992a,b; Li, 2000; Giltrap et al., 2010; Deng et al., 2013). The DNDC model runs at daily/subdaily time intervals using initial conditions such as soil properties (bulk density, pH, texture, and soil organic carbon [SOC]) and meteorological drivers (daily air temperature, precipitation, and radiation), as well as agricultural management (planting/harvest date, tillage, and fertilization). Based on interacting simulations of six submodules (soil climate; plant growth, mineralization, fermentation, nitrification, and denitrification) and input information, DNDC predicts soil layer-specific environmental conditions of substrate C and N availability, soil temperature and moisture. In addition, it predicts oxygen concentrations for partitioning of anaerobic/aerobic microsites, which drive microbial C and N turnover processes of mineralization, nitrification and denitrification as well as associated losses of N2O. The model can be run in either site or regional mode (Lugato et al., 2010; Giltrap et al., 2013).
The DNDC model was initially developed to predict soil C and N biogeochemistry in temperate agroecosystems (Li, 2000) but has largely been untested in tropical regions. Recent work has shown that the very deep soils (reaching 8 m or more) in the Mato Grosso region have high hydraulic conductivity and large pores despite fine soil textures (Scheffler et al., 2011; Dias et al., 2015). We developed new DNDC parameterizations to account for the hydraulic properties of tropical soils by adjusting soil hydraulic conductivity and soil porosity (Supplementary Table 1) and recalculating soil hydraulic parameters for all texture classes based on pedotransfer functions (PTFs) for Brazilian soils (Medrado and Lima, 2014) in equations for water-filled pore space (WFPS) and wilting point, respectively:
Site Specific Model Calibration
We compared both the standard and local parameterizations models against field observations (O'Connell, 2015; Jankowski et al., 2018) in western MT (Figure 1, Tanguro Ranch, 12°59′S, 52°23′W). Tanguro Ranch has a humid tropical climate (Köppen's Aw, Kottek et al., 2006) with a rainy season from October to April and a severely dry season from May to September. Mean annual precipitation averages about 1,900 mm and the mean annual temperature is 25°C. At Tanguro Ranch, soils are medium textured, highly weathered, base-poor ustic Oxisols (Latossolo vermelho-amarelo distrófico in the Brazilian Classification System). Soils and the depth of the groundwater table are deep (10–30 m), very well drained on plateaus, and have a mean soil texture of 55% sand, 2% silt and 43% clay. Soil mean pH was 3.9 under native forest and 6.0 under established croplands (Scheffler et al., 2011; Riskin et al., 2013).
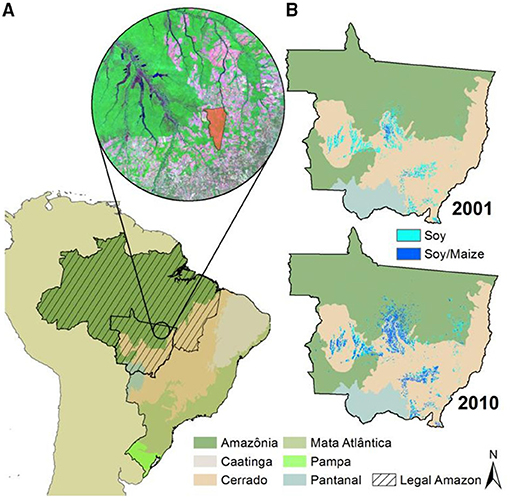
Figure 1. Study area including (A) Tanguro Ranch (red polygon), and (B) single (soybean) and double (soybean + maize) cropping systems in Mato Grosso State, Brazil, in 2001 and 2010.
Beginning in 2010, large areas of Tanguro Ranch were converted from single cropping of soybeans to double cropping of soybeans followed by maize in a single rainy season. At Tanguro, as in most of Mato Grosso, soybeans are planted at the start of the rainy season (Oct–Nov), fertilized with phosphorus (no nitrogen), and harvested in late January to early February. Maize is planted immediately following soybean harvest (late January) and harvested at the end of the rainy season (April). N fertilizer is typically applied to maize as urea or ammonium-nitrate at the time of seeding (~5 kg N ha−1). Roughly 20–30 days after planting, ~80 kg N ha−1 is broadcast as urea, for ~85 kg N ha−1 total N fertilizer plus any residual N from soybeans of previous years.
To validate DNDC estimates of N2O emissions, we used two distinct datasets of N2O emissions from soybean-maize fields. First, to estimate emissions from the soy phase of fields planted in soybean-maize, we measured N2O emissions from soybean-maize fields across Tanguro Ranch regularly from July 2013 through November 2014 (O'Connell, 2015). The precise amount and timing of N fertilization were not available for this dataset so only the measurements under soybean cropping were used for model validation, which involved no N fertilization. Emissions were measured using a closed chamber method (Venterea et al., 2005) where gas samples were drawn with a syringe four times after the chamber was closed. Nitrous oxide concentrations in the samples were determined using a gas chromatograph in the laboratory. The soil-to-atmosphere fluxes (dN2O/dt) were calculated using a linear regression of N2O concentrations against time. The fluxes were computed based on air temperature and air pressure at the time of the measurement and total volume and basal area of the chamber (O'Connell, 2015).
Next, to account for N fertilization effects on N2O emissions from maize, we used data collected from a field-level fertilizer manipulation experiment during the maize-growing phase of the cropping cycle in a single field at Tanguro Ranch (Jankowski et al., 2018). This experiment measured N2O emissions from established five fertilizer treatments (0, 80, 120, 160, and 200 kg N ha−1), laid out within five replicate blocks that consisted of 33 m2 plots (5.5 × 6 m) with 1 m buffers between plots. Maize was planted on 30 January 2015, the day after soybean harvest. All plots received 9 and 31 kg K ha−1 and all N-fertilized treatments received 5 kg N ha−1 as NH4NO3 with the maize seeds sowed by machine planters. A second dose of N was added by hand (urea) to the N-fertilized treatments 21 days after planting (concurrent with application date on the surrounding field) to create total N application rates of 80, 120, 160, and 200 kg N ha−1. All treatments and controls had five replicates randomly assigned within blocks.
The plots were sampled for N2O emissions with static chambers in the same manner as above and measurements were taken daily for 1 week following both planting and fertilization and weekly or bi-weekly until harvest on 2 June 2015. Fluxes were calculated based on O'Connell (2015). Data loggers were installed in each N fertilizer treatment to measure soil temperature and water content at a depth of 10 cm. Logger measurements were validated by field measurements of soil gravimetric moisture during gas flux measurements. We converted soil moisture content to percent of WFPS based on gravimetric moisture, bulk density and particle density. Maize biomass (dry weight from 10 maize plants per plot) was determined by harvest 125 days after seeding. Daily precipitation and average temperature were collected from a datalogger at the experimental plots (Jankowski et al., 2018).
The DNDC model performance was evaluated by the normalized root mean square prediction error (RMSE) and coefficient of determination (r2) based on the following equations (Moriasi et al., 2007):
where Xmea is the measured value and Xsim is the simulated value. is the average value of field measurements and is the average value of model simulations.
After the tests, the local parameterized DNDC model was used for a sensitivity test. DNDC was run for the same site but with varied climate, soil, and management conditions. The purpose of the sensitivity test was to identify the most sensitive factors that could influence the N2O emissions from the target ecosystem.
Regional Simulation
After site validation, DNDC was used to simulate crop yields and N2O emissions from single-cropping soybean and double-cropping soybean-maize for the entire state of Mato Grosso from 2001 to 2010 by compiling spatially distributed input data in a GIS database. To meet DNDC requirements for regional runs, the state was divided into 5 × 5 km grids of uniform agricultural management, soil, and climate. Each grid contained information about soil properties (clay content, initial SOC, pH, and bulk density), land use management (crops, tillage, fertilization, planting, and harvesting dates) and climate (precipitation, temperature, radiation, wind speed, and air humidity). Total N2O emissions and crop yields for the entire state were a result of the sum of the results from all grids.
Spatial data on croplands were provided by Spera et al. (2016). This data set delineated cropland areas, single and double cropping and specific crop types within each cropping pattern. The data set was derived from time series analysis of MODIS EVI with 250 meter resolution and provided a very high degree of accuracy (Galford et al., 2008; Spera et al., 2014).
We assumed all single soybean and double soybean-maize cropping systems were, respectively, cultivated under conventional tillage (plowing soil at 0–20 cm seven days before the planting date) and no-tillage systems called “plantio direto” that only disturbs the soil in sowing or planting and is widely adopted in MT (Galford et al., 2010; Arvor et al., 2012). In addition, planting, and harvesting dates were assumed to be the same as those carried out by Tanguro Ranch for the 2013/2014 crop cultivation (Table 1). Soybean crops usually receive an input of 7 kg N ha−1 in MT (Raucci et al., 2015). Soybeans typically do not require nitrogen additives, but most farmers in the region add this modest amount as “insurance” (Galford et al., 2010; Raucci et al., 2015).
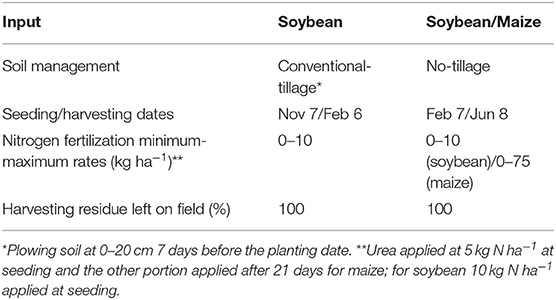
Table 1. Farming system inputs for regional simulation using the adapted DNDC model for Mato Grosso State (Brazil).
Maize crops do require nitrogen fertilization even when planted immediately following soybeans. Studies show that optimal maize productivity in this region may require up to 120 kg N ha−1 (Mar et al., 2003; Rezende Pereira et al., 2009), some of which may be provided by N fixed by soybeans grown as the first crop (Galford et al., 2010; Jankowski et al., 2018). At current productivity levels, maize crops in the Amazon and Cerrado regions need nitrogen fertilizer doses that range from 0 to 77 kg N ha−1 (Mar et al., 2003; Cruz et al., 2005; Souza and Soratto, 2006). Applied fertilizer doses ranging from 0 to 10 kg N ha−1 and 0 to 75 kg N ha−1 were tested in the DNDC model as minimum and maximum values of N-fertilizer rates for soybean and maize, respectively (Table 1).
Soil organic C concentration, pH, clay content and bulk density were obtained using the MT soil map (IBGE, 2015), which was divided into three categories: oxisol, ultisol, and sandy. Physical and chemical properties of these soil types were extracted from a database of soil sampling carried out in several cropping systems in MT (Belizario, 2011) (Table 2).
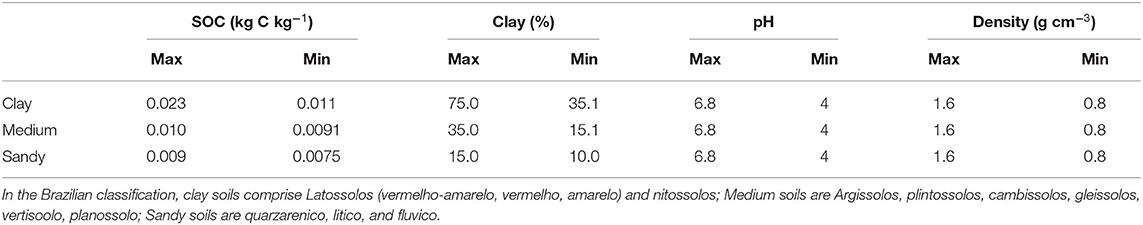
Table 2. Soil property inputs for regional simulation using the DNDC model for Mato Grosso State (Brazil).
Maximum and minimum air temperature, daily rainfall, wind speed, solar radiation and air humidity data from 2001 to 2014 were retrieved from the Brazilian National Institute of Meteorology (INMET, 2016). Because Mato Grosso had only 11 long-term meteorological stations over the study period (2001 to 2010) all retrieved products were spatially interpolated using the Voronoi diagram method to obtain 5 × 5 km gridded datasets (Supplementary Figures 1, 2).
Uncertainty Analysis in Regional Simulations
Superimposing climate, soil, and management characteristics resulted in a total of 1,298 homogenous simulation grid cells for the entire decade of regional inventory. As the soil C pools were not necessarily in equilibrium at the start of each simulation, each year was run as a separate simulation. This was done rather than running a single 10-year simulation to prevent long-term changes in soil C from affecting the results (Giltrap et al., 2010). In addition, each grid was run in DNDC in “site” mode. This is preferable to “regional” mode because its use is more transparent and flexible (Perlman et al., 2013).
The error in the calculated N2O emissions was taken as the sum of the variation in soil parameters and N fertilizer rate reported in the literature that addressed the region under analysis (Tables 1, 2). This produced the maximum error range for these two sources. The errors introduced by the assumptions made about farm management practices or the climate data sets were not included in this paper.
Results and Discussion
N2O Emissions
Measured N2O emissions of all N-fertilizer treatments of 2015 field experiment (Figure 2; Jankowski et al., 2018) increased only following the second (broadcast) N-fertilization of maize. Emissions peaked on the third day after fertilizer application (from 0.12 ± 0.10 to 0.36 ± 0.28 mg m−2 h−1), but by the seventh day emissions were similar to the control. No significant emissions were detected from seeding N-fertilization, probably because of the low rate of application (5 kg N ha−1).
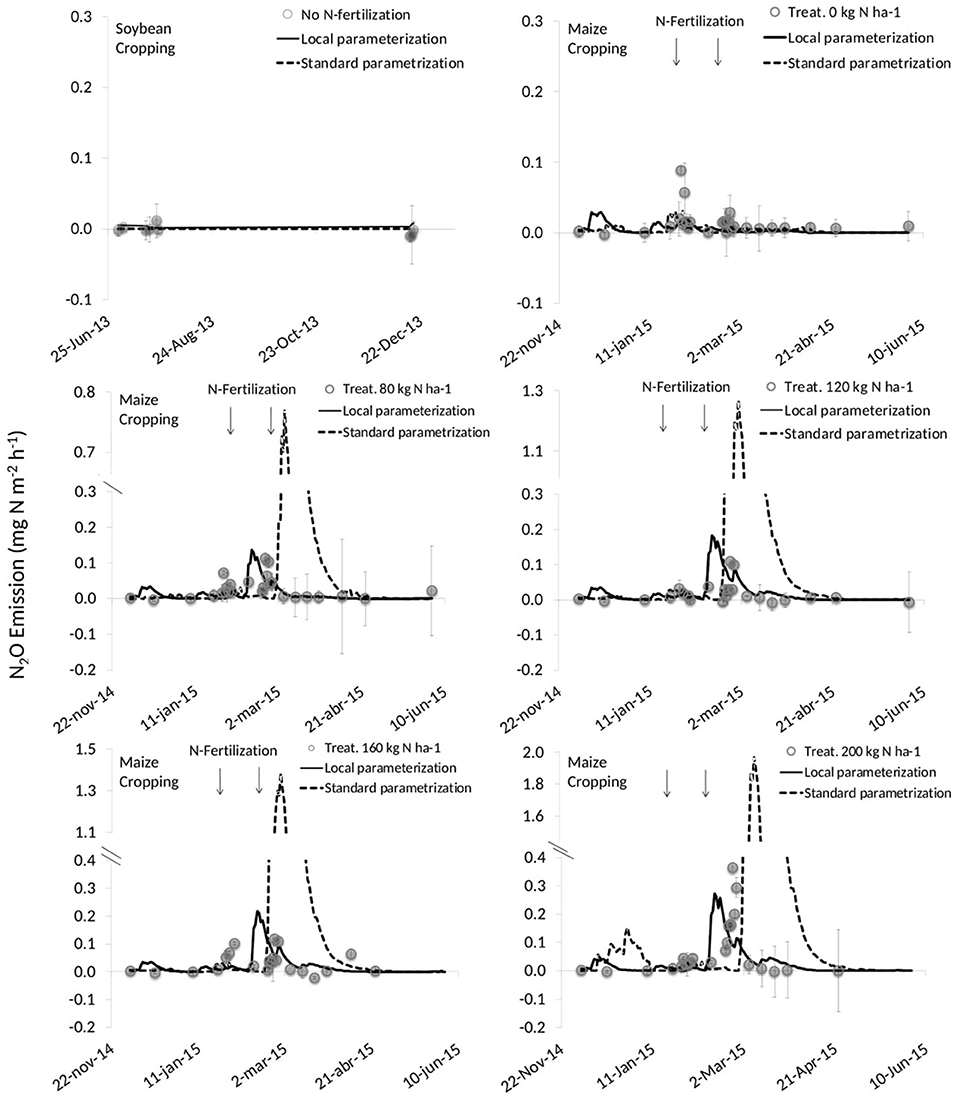
Figure 2. Measured (n = 5) and simulated N2O emissions (before and after local parameterization of the DNDC model) from double cropping soybean (2013) and maize (2014/2015) under different nitrogen fertilization rates (treat) in Mato Grasso State (Brazil).
Cumulative measured N2O emissions from the N fertilization experiment ranged from 0.27 to 0.75 kg N ha−1 and were consistent with findings that tropical soils tend to emit less N2O compared with temperate soils fertilized at similar rates (Hickman et al., 2015; Meurer et al., 2016; Jankowski et al., 2018). Estimates of fertilizer N lost as N2O-N during this period ranged from 0.10 to 0.24% (Table 3; Jankowski et al., 2018) and were well below the 1% Intergovernmental Panel on Climate Change default emission factor (IPCC, 2006). These results agreed with findings by Meurer et al. (2016), who reported that despite N fertilization increasing N2O emissions for short periods (3 to 7 days after application), the annual responses of N2O emissions to N application were negligible for application rates less than 100 kg N ha−1.
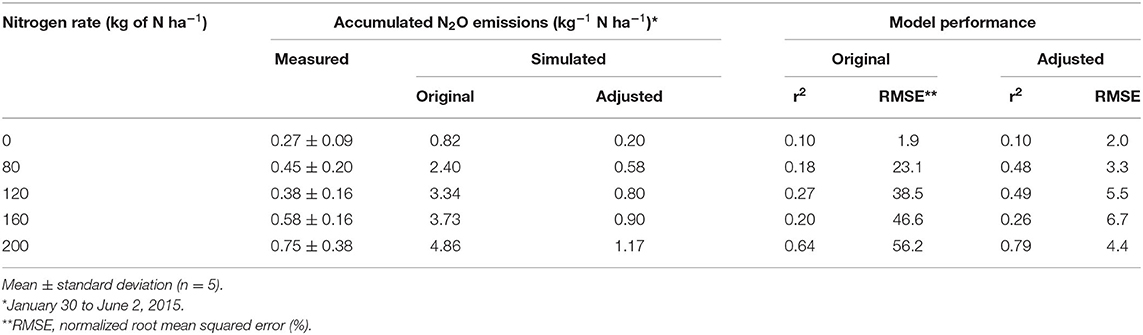
Table 3. Evaluation of model performance for simulation of N2O emissions from soil with maize planting and harvesting (double cropped with soybean) under application of different N urea fertilization rates in Mato Grosso State (Brazil).
In both the standard and local parameterized models, simulated N2O emissions followed the same pattern of measured values for all N-fertilizer treatments (Figure 2). Despite good agreement with the timing of N2O peak fluxes, the unmodified DNDC model overestimated the magnitude of emissions by up to 2.5 times until adjustments for soil physical properties were made (Figure 2). After parameterizing DNDC's hydrologic variables (see Soil Temperature and Moisture, Figure 3), modeled N2O emissions agreed closely in timing and magnitude with field measurements (Figure 2). After model calibration, r2 and the RMSE were substantially improved (Table 3). The values of RMSE between the standard and local parameterized models and observed N2O emissions ranged between 1.9–56.2% and 2.0–4.4%, respectively. Improved correlations between measured and simulated values showed that the hydrological modifications improved simulations of N2O emissions (Table 3).
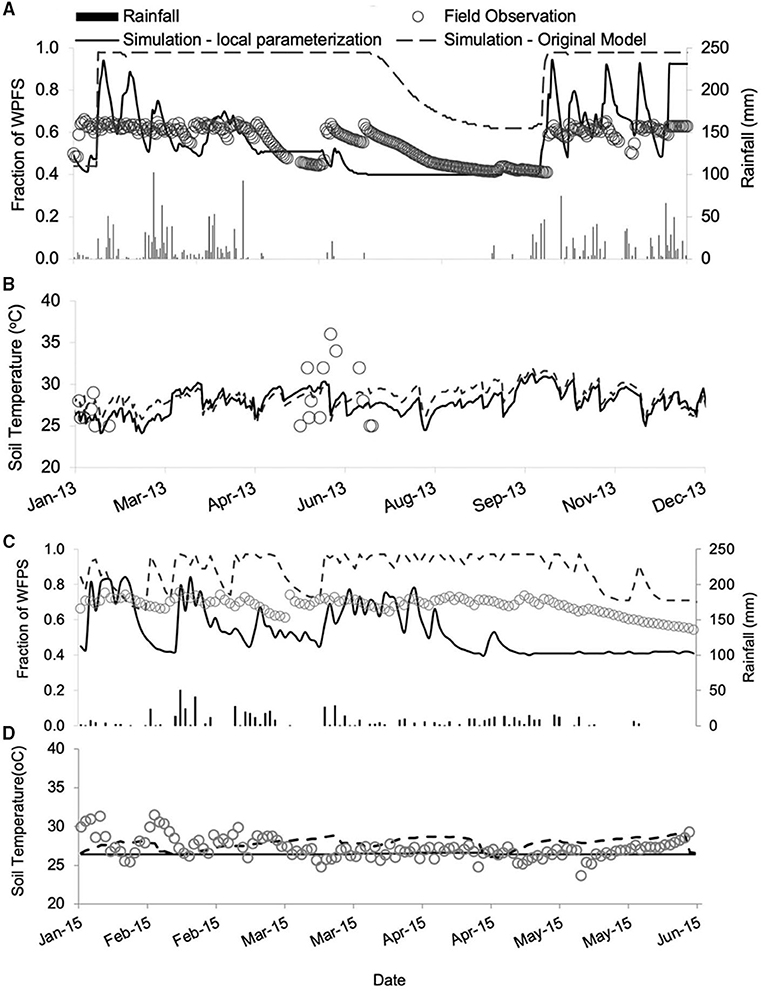
Figure 3. Comparison between measured and simulated (DNDC model) soil moisture (WFPS) and temperature (°C) in the 0–10 cm depth in two field experiments in a double cropping soybean + maize in Mato Grosso State, Brazil, in 2013 (A,B, respectively) and 2015 (C,D, respectively).
Simulations revealed two important insights. First, the model captured the temporal pattern of N2O emissions following both fertilization events. The inputs from biological N fixation by soybean and fertilizer application (5 kg N ha−1) at the time of maize seeding produced almost no measurable N2O emissions; both the standard and local parameterized models captured that dynamic. Next, the improvement in the model that occurred with calibration to soil conditions at Tanguro Ranch indicated that soil texture and physical properties were key factors for more accurately simulating N2O fluxes.
There are remaining uncertainties in how well the model estimates fluxes with increasing fertilizer application. Compared with measured values, simulated accumulated N2O emissions were close to the 1:1 line for the two lowest levels of fertilizer application but the model overestimated emissions for the higher fertilizer application levels (Table 3; Figure 4). Thus, the model was very accurate for the current regional application rates of ~70 kg/ha (Galford et al., 2010), but may overestimate emissions if application rates increase substantially. Regional crop types were mapped with 87% accuracy (Spera et al., 2016), introducing additional error to regional emissions estimates but perhaps countering slight over estimates of GHG emissions at high fertilization rates.
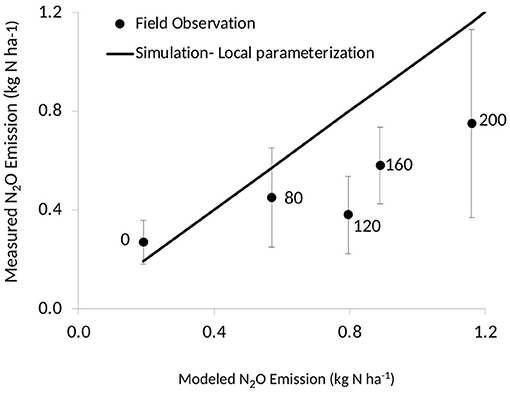
Figure 4. Comparison of measured and DNDC model simulated N2O emission for the five rates of N fertilizer application (squares/kg Nha−1) in maize cropping in Mato Grosso State (Brazil).
Soil Temperature and Moisture
Field surveys of soil WFPS (O'Connell, 2015) was greater between October and April (rainy season) than between July and September (dry season). Accumulated rainfall averaged 1779 and 264 mm over these seasons, respectively. Soil temperatures ranged from 20 to 30°C but showed no distinct seasonal pattern (Figure 3). Within the corn portion of the 2015 growing season, the soil WFPS in the second experimental field was higher in February-March (rainy season) than April-May (dry season). Accumulated annual rainfall averaged 360 and 98 mm during these periods, respectively. Soil temperature averaged 27°C and differed slightly from January to June 2015 (Figure 3).
DNDC originally overestimated measured WFPS in the study system (Figure 3), howerver adjusting parameterizations based on infiltration measured from Tanguro Ranch improved the ability to simulate average WFPS and r2 increased from 0.35 to 0.65 (Figure 3). The overestimation was consistent with a temperate-based parameterization for clay soils (55% clay in this case) as being very poorly drained. Many soils with high clay content in tropical croplands have increased permeability caused to the micro-aggregated structure of Oxisols (Tomasella and Hodnett, 1996, 2005).
Overall, model performance measures of simulated soil environmental conditions were comparable to other studies that simulated soil temperature and water dynamics (Li et al., 2006, 2012; Giltrap et al., 2010; Kim et al., 2014, 2015). Neither the original DNDC or standard and local parameterizations of DNDC captured diurnal temperature ranges observed in field data. We improved the ability of the DNDC to estimate WFPS, even though the soil temperature estimates were better than soil moisture estimates with the model adjustments for tropical conditions (Figure 3). Our study further confirms the finding that model performance in predictions of soil temperature is better than for soil moisture. Soil moisture simulations are more sensitive and dependent on a variety of inputs of physical characteristics (e.g., bulk density and saturated hydraulic conductivity) with high spatial variability that is challenging to capture. Both soil temperature and moisture deserve further refinement in future model development for Brazilian and other tropical cropland soils.
Grain Yield
Simulated maize yields generally matched the field measurements of grain production over a range of N fertilization (Figure 5). Modeled soybean yield averaged 3.3 t DW ha−1, which agreed well with Tanguro Ranch records and official statistics of MT state (CONAB, 2015) of 3.5 and 3.1 t DW ha−1 for 2015, respectively. As the field measurements and simulations both indicated, crop yields did not significantly increase once nitrogen application rates exceeded ~100 kg N ha−1 (Figure 5). This finding agreed with other nitrogen fertilizer trials for maize crops in Mato Grosso (Kappes, 2013; Kappes et al., 2013).
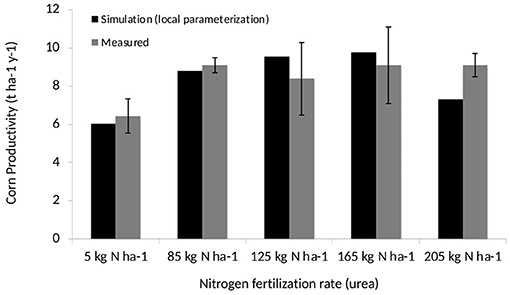
Figure 5. Comparison of measured and DNDC model simulated maize production for the five rates of N fertilizer application (kg Nha−1) in maize cropping in Mato Grosso State (Brazil).
Model Sensitivity
The sensitivity of DNDC simulated N2O emissions to variations in input parameters has been widely tested at both site (Li et al., 2010) and regional scales (Lugato et al., 2010; Giltrap et al., 2013). These studies indicated that simulated N2O emissions are most sensitive to input parameters of climate, soil texture, SOC, bulk density, pH and applied N rate. We examined effects on simulated N2O emissions by varying each of these inputs, while keeping all other attributes constant.
Results from the sensitivity tests indicated that among all the environmental factors we considered, SOC content and bulk density had the largest effects on N2O emission rates (Figure 6). When SOC increased from 1.8 to 2.3%, the annual N2O emission rate increased from 0.5 to 0.7 kg N ha−1y−1. The modeled data indicated that higher SOC produced more dissolved organic carbon (DOC) and inorganic N (ammonium and nitrate) through decomposition that led to higher rates of nitrification and denitrification, the two processes that produce N2O (Figure 6).
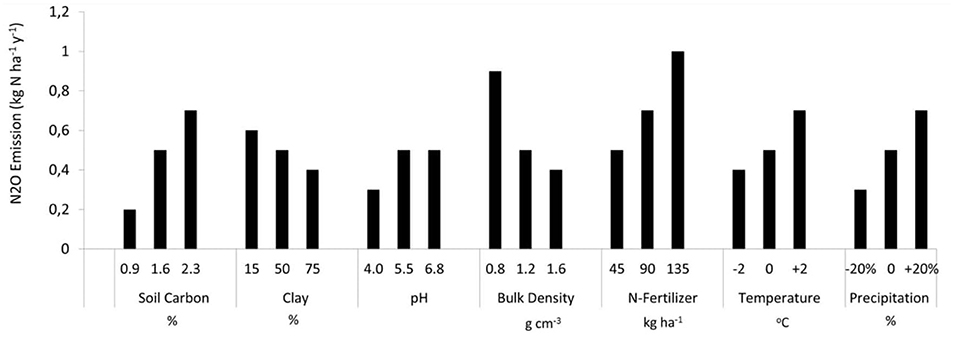
Figure 6. Sensitivity analyses using the DNDC model (local parameterization) for double cropping soybean maize in Mato Grosso State (Brazil). Baseline consists of crop and management parameters, and mean average soil properties for clay soil (shown in Tables 1, 2).
Soil texture and structure are relevant driving factors for N2O emissions, mainly because they control nutrient availability and water balances. In general, soils with finer texture have a higher availability of N (Luizão et al., 1989) and consequently tend to emit higher amounts of N2O than sandy soils (Matson et al., 1998). However, in our sensitivity analysis the model behaved just the opposite. This is likely a function of the local parameterization of the model that reflect rapid decrease of water content in fine soils, which makes them behave more like coarse-textured soils (Supplementary Table 1). As a result, the water holding capacity does not necessarily increase with an increase in clay content, and therefore nitrification is more likely to occur than denitrification. Tropical soils with high clay contents, formation of micro-aggregates, and high drainage can be expected to emit less N2O than is reported for temperate soils (Meurer et al., 2016).
Sensitivity of simulated N2O emissions to changes in bulk density was high. When soil density is doubled (from 0.8 to 1.6 g cm−3) N2O emissions declined by 65% (Figure 6). This was a consequence of the implicit dependency of nitrification and denitrification on oxygen availability, and thus on the extent of anaerobic zones in the soil profile. An increase in bulk density will decrease total pore volume and thus reduce oxygen diffusion into the soil. This is notable following rainfall when the anaerobic volume fraction of the soil increases more slowly in soils with high bulk density (Stange et al., 2000; Kiese et al., 2005).
The simulated N2O emissions were sensitive to both air temperature and precipitation (Figure 6) as these factors control the processes of decomposition, nitrification and denitrification in DNDC. In our case, the simulations suggested that higher precipitation induces higher rates of denitrification and higher temperatures stimulate microbial activity. However, the reverse effect can also occur. Higher precipitation may induce greater rates of nitrate leaching that compete with the denitrification process, together with elevated temperature that cause substantial reductions of soil moisture through increased transpiration. Nitrogen fertilizer application rates had a nearly linear effect on N2O emissions. An increase in fertilizer application rate from 45 to 135 kg N ha−1y−1 increased the N2O emission rate from 0.5 to 1.1 kg N ha−1y−1 (Figure 6).
Challenges of Model Validation
The local parameterized DNDC captured the trends in observed data much better than the original DNDC (Table 3) but validation of models operating at daily or subdaily time steps remains difficult. DNDC was developed for more data-rich temperare agricultural systems, but in emerging tropical cropping systems there are far fewer field-based measurements of GHG emissions with experimental design of multiple levels of fertilization for crops like maize (e.g., Hickman et al., 2017; Jankowski et al., 2018). The remote nature of many tropical sites and the requirements for gas chromatography including limitations on accessibility and high costs of standard gases contribute to this data scarcity.
Regional N2O Emissions
Model simulations showed that N2O emissions from MT single soybean and double soybean-maizecropping systems increased almost fourfold during 2001–2010, from 1.1 ± 1.1 to 4.1 ± 3.2 Gg N–N2O. Modeled average N2O emissions ranged from 0.1 ± 0.1 to 0.7 ± 0.7 kg N2O-N ha−1 for single soybean and from 0.7 ± 0.7 to 1.2 ± 1.2 kg N2O−N ha−1 for double crop soybean-maize areas over MT from 2001 to 2010 (Table 4; Figure 7). Higher average values for the double cropping system show that this recent change in cropping practice enhanced regional N2O emissions.
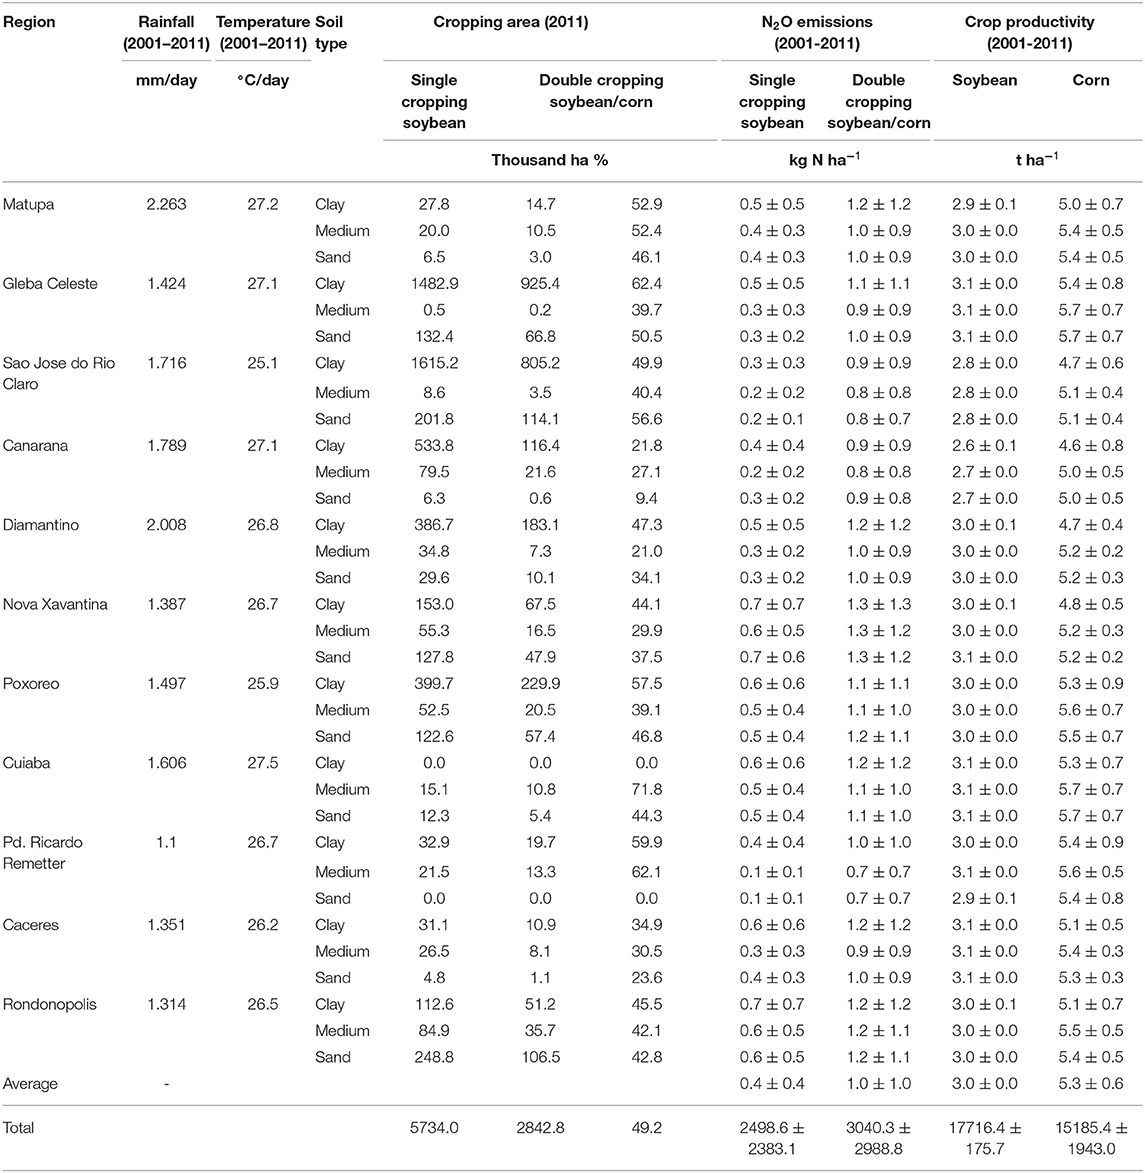
Table 4. Simulated long-term average N2O emissions and cropping productivity (soybean and maize) for 11 microregions of Mato Grosso State (Brazil).
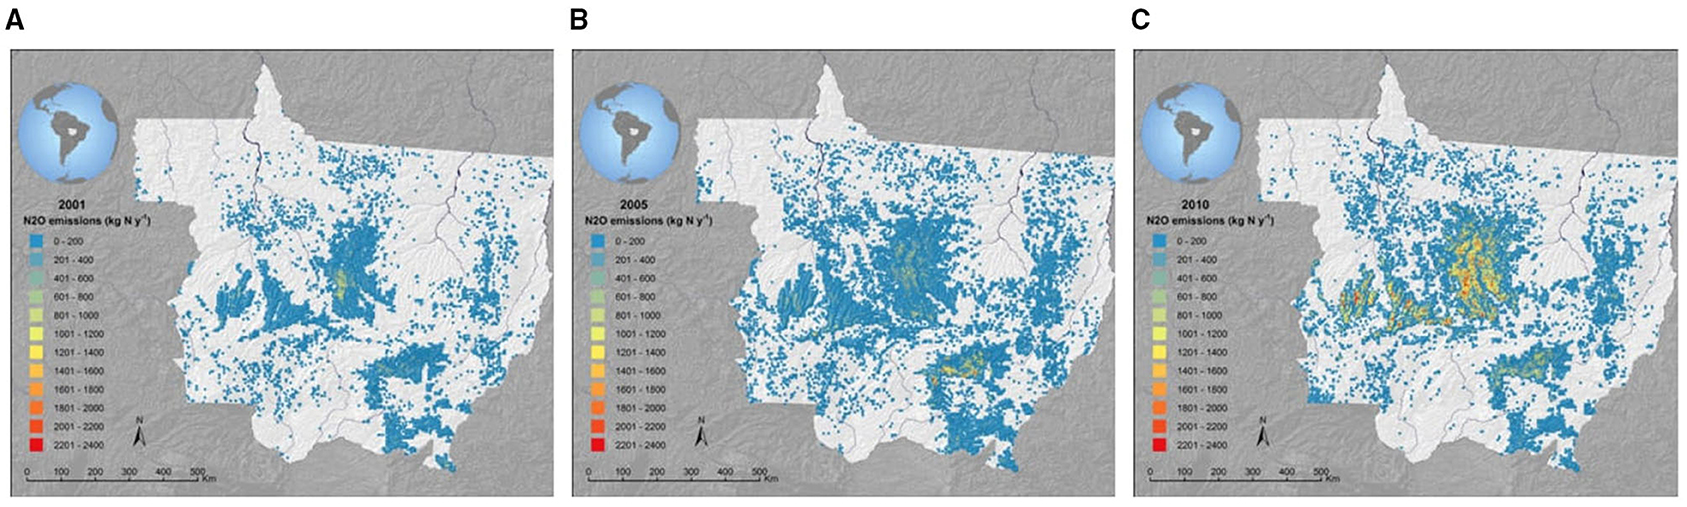
Figure 7. Spatial distribution of DNDC model simulated (with local parameterization) nitrous oxide emissions from single soybean and double soybean + maize cropping systems in 2001 (A), 2005 (B), and 2010 (C) in Mato Grosso State (Brazil).
Simulated regional production of maize and soybeans for 2010 varied from 5.2 ± 0.6 and 3.0 ± 0.0 t ha−1 (Table 4; Figure 8), which agreed well with values of 4.0 and 3.1 t ha−1, respectively, reported in national statistics (CONAB, 2015). Maize yields for 2001 to 2010 were probably underestimated because the model was parameterized with local data from a farm that has higher maize productivity when compared with the other simulated MT regions (Table 4; Figure 8).
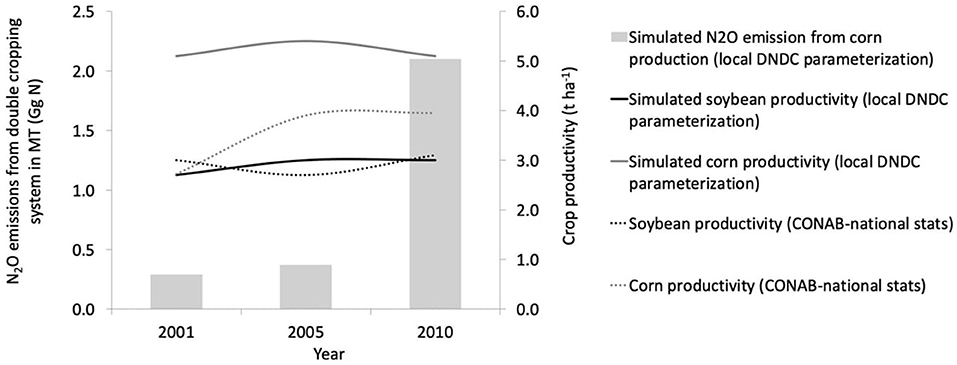
Figure 8. Simulated nitrous oxide emissions (bars) and crop productivity (lines) from double cropping soybean + maize cropping areas from 2001 and 2010, Mata Grosso State (Brazil).
The largest sensitivity in regional N2O estimates arises from uncertainty in fertilizer application rates applied to soil and soil parameters, especially soil density (Table 2). In this region, soil organic carbon, clay and density potentially vary from 10% to 130%. Rates of nitrogen application varied from 0 to 85 kg N ha−1 y−1 (Tables 1, 2). Combined, we estimated uncertainties on the amount of nitrogen fertilizer applied to soil that ranged from 42% to 80% of total uncertainties, depending on the region. Clearly, reducing the uncertainties relative to N fertilizer is a priority for reducing uncertainties in N2O emission estimates. In addition, the methodology applied in this work of using the maximum and minimum values of each soil property produces high uncertainties. If more data were available regarding the distribution of the soil properties within a soil class then a Monte Carlo method could be used to estimate the uncertainty in a probabilistic manner rather than using the extreme values (Giltrap et al., 2013).
Pathways to Meet Future Demands: Expanding Area vs. Increasing N Fertilization
Mato Grosso aims to increase maize production by 60% (to 38 million metric tons) to meet 2025 projected demands (IMEA, 2015). To accomplish this, the state is expected to expand its area planted to maize from 3 to 6 million ha over the next decade. With nearly three million ha currently under single soybean cultivation (plus three million ha double cropped with maize) and an additional five million ha expected to be added to support demand for soybeans that is estimated as requiring 14 million ha (IMEA, 2015). Our model results show that the area that currently exists as single-cropped soybean could easily accommodate double cropping systems to meet projected maize grain demand. Assuming no improvement in agronomic practices (and maintaining the current level of N fertilization), linearly extrapolating simulated results from 2001–2010 to 2025, to meet future demands of corn production by double cropping with corn three million ha of soybean fields currently single cropped would double N2O emissions compared with 2010 levels (Figure 9).
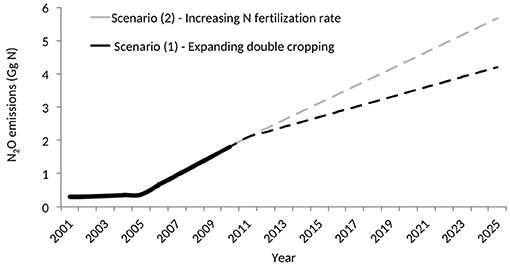
Figure 9. Regional N2O-N emissions projection for meeting 2025 demand for maize from Mata Grosso State (Brazil) through two scenarios: (1) expanding double cropping of maize to existing 3.0 million ha of soybean fields using current N-fertilization rate (35 kg N ha-1) and (2) expanding double cropping with maize fertilized at 180 kg N ha−1 to existing 2.7 million ha of soybean fields.
We also evaluated whether increased N-fertilization application rates would increase maize yield sufficiently to meet maize demand. According to technical experts in the region, maize in MT is currently underfertilized with N (Kappes, 2013; Kappes et al., 2013). This is a consequence of the history of maize cultivation as a second crop starting in the 1990s, mostly for soil cover with promotion of the plantio direto system, which eventually evolved to an income generating crop. Under such conditions, maize benefited from soybeans that fixed and left behind modest amounts of N after harvest so farmers did not fertilize maize to the extent recommended. As incomes from maize crops increased and soybean prices fluctuated, fertilization of maize increased.
We hypothesized that farmers are now more likely to increase fertilization rates, and evaluated how increasing N application would impact maize productivity. We simulated N-fertilizer application levels for maize from 0 to 300 kg N ha−1 and found that productivity peaked at 180 kg N ha−1, after which point yield stabilized or declined slightly (Figure 10). Although this N application rate (300 kg N ha−1) is almost six times greater than that currently average estimated for MT (Table 1), and therefore not likely to be applied, it is similar to maximum rates in other intensively fertilized regions. We found that a fertilizer application of 180 kg N ha−1 produced 25% more maize compared with current practices utilizing 35 kg N ha−1 (Figure 10). If this rate of fertilization were applied across all currently double cropped areas, however, N2O emissions would increase by 2.6 times per ha on average (Figure 10).
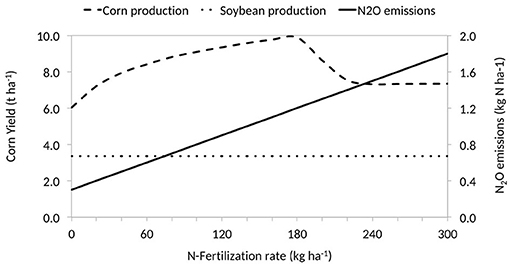
Figure 10. Simulations of the effect of different rates of nitrogen fertilizer application on the average N2O emissions and crop productivity in Mato Grosso State (Brazil).
Similar results have been found in experimental trials aiming at the evaluation of maize yield potential as a result of different N-fertilizer doses in Brazil. Mar et al. (2003); Jankowski et al. (2018) found maize productivity peaked at 120 kg N ha−1, with productivity reductions when doses were applied above this rate. The authors argued that the over fertilization may unbalance the plant ability to uptake other nutrients as well as it enhances N losses through leaching and volatilization (Jankowski et al., 2018).
These results suggest that for MT to meet estimated maize demands in the next decade, producers will have two alternatives: expand soybean-maize double cropping intensification to an additional 3.0 million ha currently used for single soybean cropping, or further intensify soybean-maize double cropping on 2.3 million ha of single cropping soybean fields and increase N fertilization in total soybean-maize double cropping area by five times (180 kg N ha−1). The second strategy would spare 0.7 million ha for other activities compared to the first alternative but may emit 35% more N2O than the first option (Figure 9) and would certainly be more costly for farmers because of the increased fertilizer use. If the target is to meet future maize demands together with reduced N2O emissions, our simulations suggest that to convert soybean areas currently producing a single crop to double cropping with maize, maintaining current N fertilizer application rates must be a priority over increasing the rate of N application. Furthermore, applying less N fertilizer has additional benefits, such as reducing N volatilization and leaching to water bodies that occur because of large and inefficient N fertilizer applications (Carpenter et al., 1998; Kim et al., 2015; Spera et al., 2016).
Conclusions
Reduction of emissions from agricultural lands is a priority for many countries, including Brazil, which has a commitment under the Paris Agreement. To understand current GHG emissions and opportunities for mitigation, research typically relies on models such as DNDC to simulate emissions. Therefore, the calibration and application of the DNDC model to fertilized tropical croplands to quantify N2O emissions is timely and relevant. Further, the parameterization of a robust process-based model empowers tropical countries, many of which most of which have mostly committed to reduce GHG emissions from agriculture under the Paris Agreement (United Nations, 2018) to move toward more accurate GHG emission estimates and can affect land use planning.
Our DNDC validations demonstrated, with a reasonable degree of accuracy, that a modified DNDC model is capable of simulating N2O emissions from a soybean and maize cropping system as well as under different N application rates in one of the most rapidly developing agricultural frontiers of the twenty-first century. The model sensitivity of the N2O emissions to climate conditions (temperature and rainfall) and soil properties, especially soil texture, indicates high model response to these parameters that are specific to the tropics. The local parameterized model is substantially different than the standard DNDC model in estimated magnitude and ability to match field measurements.
We see that N2O emissions from crop nitrogen fertilization are lower in this region than emissions from temperate systems. This underscores the importance of accounting for differences in soil and climate characteristics when planning future crop intensification for the tropics.
Model simulations also suggest intensification of soybean crops through double cropping with maize can be managed effectively to meet future demands for maize, while avoiding large and needless increases in nitrogen fertilization and, consequently, N2O emissions. In this context, expanding maize cropping in existing single soybean fields rather than increasing the rate of N fertilization in current maize areas would avoid 35% increase in N2O emissions by 2025.
This paper provides valuable information for decision-makers about the DNDC biogeochemical model and its potential applicability for evaluating and monitoring N2O emissions and crop productivity from large scale agriculture. However, in order to further increase the accuracy of DNDC predictions that target tropical regions and to build more robust recommendations, we need to improve and validate the model continuously in the coming years, with regard first, to N turnover processes and associated trace gas fluxes; next, to soil hydrology (which is one of the major governing processes involved in N trace gas emissions); and finally, to improved granularity of country level data on climate, soil type and agricultural management.
Data Availability Statement
The original contributions presented in the study are included in the article/Supplementary Material, further inquiries can be directed to the corresponding author.
Author Contributions
CC, GG, MC, and CN conceived of the study. CJ carried out the DNDC modeling. KJ, CO'C, MM, and CN contributed field validation data. CC led the writing of the paper. All authors contributed to the article and approved the submitted version.
Funding
This work was supported by National Science Foundation (NSF#1257944) and CNPq-Ciências Sem Fronteiras Post-Doctoral Fellowship (249380/2013-7).
Author Disclaimer
The views expressed in this document cannot be taken to reflect the official opinions of these organizations.
Conflict of Interest
The authors declare that the research was conducted in the absence of any commercial or financial relationships that could be construed as a potential conflict of interest.
Publisher's Note
All claims expressed in this article are solely those of the authors and do not necessarily represent those of their affiliated organizations, or those of the publisher, the editors and the reviewers. Any product that may be evaluated in this article, or claim that may be made by its manufacturer, is not guaranteed or endorsed by the publisher.
Acknowledgments
Invaluable logistical and field assistance was supported by employees of the Instituto de Pesquisa Ambiental da Amazônia (IPAM) in collecting data sets used from previous publications; we are thankful for their help and the willingness of other authors to share data. We thank Paul Lafebvre (Woodwell Climate Research Center) for supporting data processing and mapping. We acknowledge and thank Changsheng Li and Carlos C. Cerri (in memoriam) for their mentoring. This work was implemented as part of the CGIAR Research Program on Climate Change, Agriculture and Food Security (CCAFS), which is carried out with support from CGIAR Trust Fund and through bilateral funding agreements. For details please visit https://ccafs.cgiar.org/donors.
Supplementary Material
The Supplementary Material for this article can be found online at: https://www.frontiersin.org/articles/10.3389/fsufs.2021.701416/full#supplementary-material
References
ANDA (2020). Associação Nacional para Difusão de Adubos (Brazilian National Fertilizer Association). Anuário estatístico do setor de fertilizantes (Annual Report). São Paulo: ANDA, p 160.
Arvor, D., Meirelles, M., Dubreuil, V., Bégué, A., and Shimabukuro, Y. E. (2012). Analyzing the agricultural transition in Mato Grosso, Brazil, using satellite-derived indices. Appl. Geograph. 32, 702–713. doi: 10.1016/j.apgeog.2011.08.007
Belizario, M. H. (2011). Changes in soil carbon stocks due to agricultural land use in Southwest Amazonian (Portuguese), MS thesis (Escola Superior de Agricultura “Luiz de Queiroz. Piracicaba: Universidade de São Paulo.
Bouwman, A. F., Boumans, L. J. M., and Batjes N. H. (2002). Emissions of N2O and NO from fertilized fields. Summary of available measurement data. Global Biogeochem. Cycles 16, 6–13. doi: 10.1029/2001GB001811
Butterbach-Bahl, K., Baggs, E. M., Dannenmann, M., Kiese, R., and Zechmainster-Boltenstern, S. (2013). Nitrous oxide emissions from soils: how well do we understand the processes and their controls? Philosophic. Trans. Roy. Soc. B Biol. Sci. 368:20130122. doi: 10.1098/rstb.2013.0122
Carpenter, S. R., Caraco, N. F., Correll, D. L., Howarth, R. W., Sharpley, A. N., and Smith, V. H. (1998). Nonpoint pollution of surface waters with phosphorus and nitrogen. Ecol. Appl. 8, 559–568. doi: 10.1890/1051-0761(1998)008[0559:NPOSWW]].0.CO;2
Carsel, R. F., and Parrish, R. S. (1988). Developing joint probability distributions of soil water retention characteristics. Water Resourc. Res. 24, 755–769. doi: 10.1029/WR024i005p00755
CONAB (2015). Conpanhia Nacional de Abastecimento. Brasília. Available online at: http://www.conab.gov.br/ (accessed January 22, 2016).
Cruz, J. C., Pereira, F. T. F. P., Pereira Filho, I. A., and Coelho, A. M. (2005). Resposta de cultivares de milho à adubação nitrogenada em cobertura. Sete Lagoas: EMBRAPA. Dezembro, p 65.
Del Grosso, S. J., Parton, W. J., Mosier, A. R., Hartman, M. D., Brenner, J., Ojima, D. S., et al. (2001). “Simulated interaction of carbon dynamics and nitrogen trace gas fluxes using the DAYCENT model,” in Modeling Carbon and Nitrogen Dynamics for Soil Management, eds Shaffer, M.J., Ma, L. and Hansen, S. (Florida: CRC Press), 303–332
Deng, J., Zhou, Z., Zheng, X., and Li, C. (2013). Modeling impacts of fertilization alternatives on nitrous oxide and nitric oxide emissions from conventional vegetable fields in southeastern China. Atmosphere. Environ. 81, 642–650. doi: 10.1016/j.atmosenv.2013.09.046
Dias, L. C. P., Macedo, M. N., Costa, M. H., Coe, T. M., and Neill, C. (2015). Effects of land cover change on evapotranspiration and streamflow of small catchments in the Upper Xingu River Basin, Central Brazil. J. Hydrolo. Reg. Stud. 4, 108–122. doi: 10.1016/j.ejrh.2015.05.010
Dorich, C. D., Conant, R. T., Albanito, F., Butterbach-Bahl, K., Grace, P., Scheer, C., et al. (2020). Improving N2O emission estimates with the global N2O database. Curr. Opini. Environ. Sustain. 47, 13–20 doi: 10.1016/j.cosust.2020.04.006
Galford, G. L., Mellilo, J., Kicklighter, D. W., Cronin, T. W., Cerri, C. E. P., Mustard, J. F., et al. (2010). Greenhouse gas emissions from alternative futures of deforestation and agricultural management in the southern Amazon. Proceed. Nat. Acad. Sci. 107, 19649–19654. doi: 10.1073/pnas.1000780107
Galford, G. L., Mustard, J. F., Melillo, J., Gendrin, A., Cerri, C. C., and Cerri, C. E. P. (2008). Wavelet analysis of MODIS time series to detect expansion and intensification of row-crop agriculture in Brazil. Rem. Sens. Environ. 112, 576–587. doi: 10.1016/j.rse.2007.05.017
Gibbs, H. K., Ruesch, A. S., and Achard, F. (2010). Tropical forests were the primary sources of new agricultural land in the 1980s and 1990s. Proceed. Nat. Acad. Sci. 107, 16,732–16,737. doi: 10.1073/pnas.0910275107
Giltrap, D. L., Ausseil, A.-G. E., Thakur, K. P., and Sutherland, M. A. (2013). Investigating a method for estimating direct nitrous oxide emissions from grazed pasture soils in New Zealand using NZ-DNDC. Sci. Total Environ. 465, 7–16. doi: 10.1016/j.scitotenv.2013.03.053
Giltrap, D. L., Saggar, D., and Li, C. (2010). DNDC: A process-based model of greenhouse gas fluxes from agricultural soils. Agricult. Ecosyst. Environ. 136, 292–300. doi: 10.1016/j.agee.2009.06.014
Global DNDC Network (2018). DNDC Network. Publications. Available online at: http://www.globaldndc.net/information/publications-i-3.html (accessed September 07, 2018).
Global N2O Database (2020). CGIAR Research Program on Climate Change Agriculture and Food Security (CCAFS) - Global N2O Project. Proceed. Nat. Acad. Sci. Available online at: https://samples.ccafs.cgiar.org/n2o-dashboard/
Haas, E., Klatt, S., Fröhlich, A., Kraft, P., Werner, C., Kiese, R., et al. (2013). LandscapeDNDC: a process model for simulation of biosphere–atmosphere–hydrosphere exchange processes at site and regional scale. Landscape Ecol. 28, 615–636. doi: 10.1007/s10980-012-9772-x
Hickman, J. E., Huang, Y., Wu, S., Diru, W., Groffman, P. M., Tully, K. L., et al. (2017). Nonlinear response of nitric oxide fluxes to fertilizer inputs and the impacts of agricultural intensification on tropospheric ozone pollution in Kenya. Glob. Change Biol. 23, 3193–3204. doi: 10.1111/gcb.13644
Hickman, J. E., Tully, K. L., Groffman, P. M., Diru, W., and Palm, C. A. (2015). A potential tipping point in tropical agriculture: avoiding rapid increases in nitrous oxide fluxes from agricultural intensification in Kenya. J. Geophysic. Res. Biogeosci. 120:2015JG002913. doi: 10.1002/2015JG002913
Huddell, A. M., Galford, G. L., Tully, K. L., Crowley, C., Palm, C. A., Neill, C., et al. (2020). Meta-analysis on the potential for increasing nitrogen losses from intensifying tropical agriculture. Global Change Biol. 26, 1668–1680. doi: 10.1111/gcb.14951
Huddell, A. M., Neill, C., Maracahipes-Santos, L., Cerri, C. E. P., and Menge, D. N. L. (2021). Nitric and nitrous oxide fluxes from intensifying crop agriculture in the seasonally dry tropical Amazon-Cerrado border region. Agrosyst. Geosci. Environ. 4, 1–12. doi: 10.1002/agg2.20169
IBGE (2015). Instituto Brasileiro de Geografia e Estatistica (Brazilian Institute for Geography and Statistics). Brasília. Available online at: http://www.ibge.gov.br/ (accessed May 18, 2015).
IBGE (2020). Instituto Brasileiro de Geografia e Estatística. Brasília. Available online at: https://sidra.ibge.gov.br/pesquisa/lspa/tabelas
IMEA (2015). Instituto Matogrossense de Economia Agricola (Mato Grosso Institute for Agriculture Economics). Cuiabá. Available online at: http://www.imea.com.br/ (accessed May 01, 2016).
INMET (2016). Instituto Nacional de Meteorologia (National Institute of Meteorology). Brasília Available online at: http://www.inmet.gov.br/
IPCC (2006). “Intergovernamental Panel On Climate Change,” in IPCC Guidelines for National Greenhouse Gas Inventories, Volume 4: Agriculture, Forestry and Other Land Use, Prepared by the National Greenhouse Gas Inventories Programme, eds Eggleston HS, Buendia L, Miwa K, Ngara T, Tanabe K (Japan: IGES), Available online at: http://www.ipcc-nggip.iges.or.jp/public/2006gl/vol4.html
IPCC (2013). “Intergovernamental Panel On Climate Change. Climate Change 2013: The Physical Science Basis,” in Contribution of Working Group I to the Fifth Assessment Report of the Intergovernmental Panel on Climate Change, eds Stocker, T.F., D. Qin, G.-K. Plattner, M. Tignor, S.K. Allen, J. Boschung, A. et al. (New York, NY: Cambridge University Press), 1535.
IPCC (2019a). Climate Change and Land: an IPCC special report on climate change, desertification, land degradation, sustainable land management, food security, and greenhouse gas fluxes in terrestrial ecosystems, eds P.R. Shukla, J. Skea, E. Calvo Buendia, V. Masson-Delmotte, H.-O. Pörtner, D. C. Roberts, et al. In press. Available online at: https://www.ipcc.ch/site/assets/uploads/sites/4/2021/02/05_Chapter-2-V5.pdf
IPCC (2019b). IPCC 2019, 2019 Refinement to the 2006 IPCC Guidelines for National Greenhouse Gas Inventories, eds. E. Calvo Buendia, K. Tanabe, A. Kranjc, J. Baasansuren, M. Fukuda, S. Ngarize, A. Osako, Y. Pyrozhenko, P. Shermanau, S. Federici. Switzerland: IPCC. Available online at: https://www.ipcc-nggip.iges.or.jp/public/2019rf/index.html
Jankowski, K. J., Neill, C., Davidson, E. A., Macedo, M. N., Costa Junior, C., Galford, G., et al. (2018). Deep soils modify environmental consequences of increased nitrogen fertilizer use in intensifying Amazon agriculture. Sci. Rep. 8:13478. doi: 10.1038/s41598-018-31175-1
Kappes, C. (2013). Sistemas de cultivo de milho safrinha no Mat Grosso. XII Seminario Nacional de Milho Safrinha – EMBRAPA/UFGD. Available at: http://www.cpao.embrapa.br/cds/milhosafrinha2013/palestras/5CLAUDINEIKAPPES.pdf
Kappes, C., Zancanaro, L., and Jesus, F. V. (2013). Doses de nitrogênio, via ureia e nitrato de amônio, em cobertura no milho safrinha em sucessão à soja. XII Seminario Nacional de Milho Safrinha – EMBRAPA/UFGD. Available online at: http://www.cpao.embrapa.br/cds/milhosafrinha2013/PDF/04.pdf
Kiese, R., Li, C., Hilbert, D., Papen, H., and Butterbach-Bahl, K. (2005). Regional application of PnET-N-DNDC for estimating the N2O source strength of tropical rainforests in the Wet Tropics of Australia. Global Change Biol. 11, 128–144. doi: 10.1111/j.1365-2486.2004.00873.x
Kim, S., Liu, Y. Y., Johnson, F. M., Parinussa, R. M., and Sharma, A. (2015). A global comparison of alternate AMSR2 soil moisture products: Why do they differ? Rem. Sens. Environ. 161, 43–62. doi: 10.1016/j.rse.2015.02.002
Kim, Y., Seo, Y., Kraus, D., Klatt, S., Haas, E., Tenhunen, J., et al. (2014). Simulation of N2O emissions and nitrate leaching from plastic mulch radish cultivation with LandscapeDNDC. Ecol. Res. 29, 441–454. doi: 10.1007/s11284-014-1136-3
Kottek, M., Grieser, J., Beck, C., Rudolf, B., and Rubel, F. (2006). World Map of the Köppen-Geiger climate classification updated. Meteorologische Zeitschrift 15, 259–263. doi: 10.1127/0941-2948/2006/0130
Li, C. (2000). Modeling trace gas emissions from agricultural ecosystems. Nutr. Cycl. Agroecosyst. 58, 259–276. doi: 10.1007/978-94-010-0898-3_20
Li, C., Salas, W., De Angelo, B., and Rose, S. (2006). Assessing alternatives for mitigating net greenhouse gas emissions and increasing yields from rice production in China over the next twenty years. J. Environ. Qual. 35, 1554–1565. doi: 10.2134/jeq2005.0208
Li, C., Zhuang, Y., Cao, M., Crill, P., Dai, Z., Frolking, S., et al. (2001). Comparing a process-based agro-ecosystem model to the IPCC methodology for developing a national inventory of N2O emissions from arable lands in China. Nutri. Cycl. Agroecosyst. 60, 159–175. doi: 10.1023/A:1012642201910
Li, C. S., Frolking, S., and Frolking, T. A. (1992a). A model of nitrous-oxide evolution from soil driven by rainfall events: 1. model structure and sensitivity. J. Geophysic. Res. 97, 9759–9776. doi: 10.1029/92JD00509
Li, C. S., Frolking, S., and Frolking, T. A. (1992b). A process-oriented model of N2O and NO emissions from forest soils: 2. model applications. J. Geophysic. Res. 105, 4377–4383. doi: 10.1029/1999JD900949
Li, H., Qiu, J., Wang, L., Tang, H., Li, C., and Ranst, E. V. (2010). Modelling impacts of alternative farming management practices on greenhouse gas emissions from a winter wheat–maize rotation system in China. Agricult. Ecosyst. Environ. 135, 24–33. doi: 10.1016/j.agee.2009.08.003
Li, H., Qiu, J., Wang, L., Xu, M., Liu, Z., and Wang, W. (2012). Estimates of N2O emissions and mitigation potential from a spring maize field based on DNDC model. J. Integrat. Agricult. 11, 2067–2078. doi: 10.1016/S2095-3119(12)60465-1
Lugato, E., Zuliani, M., Alberti, G., Vedove, G. D., Gioli, B. B., et al. (2010). Application of DNDC biogeochemistry model to estimate greenhouse gas emissions from Italian agricultural areas at high spatial resolution. Agricult. Ecosyst. Environ. 139, 546–556. doi: 10.1016/j.agee.2010.09.015
Luizão, F., Matson, P., Livingston, G., Luizão, R., and Vitousek, P. (1989). Nitrous oxide flux following tropical land clearing Global Biogeochem. Cy. 3 281–285 doi: 10.1029/GB003i003p00281
Macedo, M. N., DeFries, R. S., Morton, D. C., Stickler, C., Galford, G. L., and Shimabukuro, Y. E. (2012). Decoupling of deforestation and soy production in the southern Amazon during the late 2000s. Proceed. Nat. Acad. Sci. 109, 1341–1346. doi: 10.1073/pnas.1111374109
MapBiomas (2019). MapBiomas project: Collection [v.4.0] of the annual land use land cover maps of Brazil. MapBiomas. Available online at: http://plataforma.mapbiomas.org/stats
Mar, G. D., Marchetti, M. E., Ferreira de Souza, L. C., Gonçalves, M. C., and Novelino, J. O. (2003). Fertilidade do solo e nutricao de plantas: Producao do milho safrinha em funcao de doses e epocas de aplicacao de nitrogenio. Bragantia 62, 267–274. doi: 10.1590/S0006-87052003000200012
Matson, P. A., Naylor, R., and Ortiz-Monasterio, I. (1998). Integration of environmental, agronomic, and economic aspects of fertilizer management. Science 280, 112–115. doi: 10.1126/science.280.5360.112
Medrado, E., and Lima, J. E. F. W. (2014). Development of pedotransfer functions for estimating water retention curve for tropical soils of the Brazilian savanna. Geoderma Reg. 1, 59–66. doi: 10.1016/j.geodrs.2014.08.003
Meurer, K. H. E., Franko, U., Stange, C. F., Rosa, J. D., Madari, B. E., and Jungkunst, H. F. (2016). Direct nitrous oxide (N2/O) fluxes from soils under different land use in Brazil—a critical review. Environ. Res. Lett. 11:023001. doi: 10.1088/1748-9326/11/2/023001
Moriasi, D. N., Arnold, J. G., Van Liew, M. W., Bingner, R. L., Harmel, R. D., and Veith, T. L. (2007). Model evaluation guidelines for systematic quantification of accuracy in watershed simulations. Trans. ASABE 50, 885–900. doi: 10.13031/2013.23153
Morton, D. C. R. S., DeFries, Y. E., Shimbukuro, L. O., Anderson, E., Arai, F. B., Espirito-Santo, R., and Morisette, J. (2006). Cropland expansion changes deforestation dynamics in the southern Brazilian Amazon. Proceed. Nat. Acad. Sci. 103, 14,637–14,641. doi: 10.1073/pnas.0606377103
Neill, C. M. T., Coe, S. H., Riskin, A. V., Krusche, H., Elsenbeer, M. N., et al. (2013). Watershed responses to Amazon soya bean cropland expansion and intensification. Philosophic. Trans. Royal Soc. B 368:20120425. doi: 10.1098/rstb.2012.0425
O'Connell, C. S. (2015). Ecological Tradeoffs to an Agricultural Amazonia: Investigating the effects of increased agricultural production on Amazonia's contribution to global climate and nitrogen cycling. Ph.D. thesis (University of Minnesota).
Packham, L. E. T., Massheder, J., Smith, K. A., and Hyde, B. (2006). The Simile Modeling Frameworkd Modeling of Nitrous Oxide Emissions from Irish Agriculture. EPA 2006-SS-46-MI, Ireland.
Perlman, J., Hijmans, R. J., and Horwath, W. R. (2013). Modelling agricultural nitrous oxide emissions for large regions. Environ. Modell. Softw. 48, 183–192. doi: 10.1016/j.envsoft.2013.07.002
Raucci, G. S., Moreira, C. S., Alves, P. A., Mello, F. F. C., Frazão, L. A., Cerri, C. E. P., et al. (2015). Greenhouse gas assessment of Brazilian soybean production: a case study of Mato Grosso State. J. Clean. Product. 96, 418–425. doi: 10.1016/j.jclepro.2014.02.064
Rezende Pereira, J. L. A., Von Pinho, R. G., Borges, I. D., Rezende Pereira, A. M. A., and Lima, T. G. (2009). Cultivares, doses de fertilizantes e densidades de semeadura no cultivo de milho safrinha. Ciência e Agrotecnologia 33, 676–683. doi: 10.1590/S1413-70542009000300003
Richards, M., Bruun, T. B., Campbell, B., Gregersen, L. E., Huyer, S., Kuntze, V., et al. (2016). How countries plan to address agricultural adaptation and mitigation: an analysis of Intended Nationally Determined Contributions. CCAFS dataset version 1.3. Copenhagen, Denmark: CGIAR Research Program on Climate Change. Agriculture and Food Security (CCAFS), Copenhagen.
Riskin, S. H., Porder, S., Schipanski, M. E., Bennett, E. M., and Neill, C. (2013). Soils mediate environmental consequences of intensive soybean agriculture. BioScience 63, 49–54. doi: 10.1525/bio.2013.63.1.10
Scheffler, R., Neill, C., Krusche, A. V., and Elsenbeer, H. (2011). Soil hydraulic response to land-use change associated with the recent soybean expansion at the Amazon agricultural frontier. Agric. Ecosyst. Environ. 144, 281–289. doi: 10.1016/j.agee.2011.08.016
Six, J. C., Feller, K., Denef, S., Ogle, J., and Albrecht, A. (2002). Soil organic matter, biota and aggregation in temperate and tropical soils-Effects of no-tillage. Agronomie 22, 755–775. doi: 10.1051/agro:2002043
Smith, K. A. (2017). Changing views of nitrous oxide emissions from agricultural soil: key controlling processes and assessment at different spatail scales. Euro. J. Soil Sci. 68, 137–155. doi: 10.1111/ejss.12409
Smith, P., Bustamante, M., Ahammad, H., Clark, H., Dong, H., Elsiddig, E. A., et al. (2014). “Agriculture, Forestry and Other Land Use (AFOLU),” in Kadner, S., Seyboth, K., Adler, A., Baum, I., Brunner, S., Eickemeier, P., et al. Climate Change 2014: Mitigation of Climate Change. Contribution of Working Group III to the Fifth Assessment Report of the Intergovernmental Panel on Climate Change, Cambridge University Press, Cambridge, United Kingdom and New York, NY, USA.
Smith, W. N., Grant, B. B., Desjardins, R. L., Worth, D., Li, C., Boles, S. H., et al. (2010). A tool to link agricultural activity data with the DNDC model to estimate GHG emission factors in Canada. Agric. Ecosyst. Environ. 136, 301–309. doi: 10.1016/j.agee.2009.12.008
Snyder, C. S., Bruulsema, T. W., Jensen, T. L., and Fixen, P. E. (2009). Review of greenhouse gas emissions from crop production systems and fertilizer management effects. Agric. Ecosyst. Environ. 133, 247–266. doi: 10.1016/j.agee.2009.04.021
Souza, E., and Soratto, R. P. (2006). Efeito de fontes e doses de nitrogênio em cobertura, no milho safrinha, em plantio direto. Revista Brasileira de Milho e Sorgo. Sete Lagoas. 5, 387–397. doi: 10.18512/1980-6477/rbms.v5n3p395-405
Spera, S. A., Cohn, A. S., VanWey, L. K., Mustard, J. F., Rudorff, B. F., Risso, J., et al. (2014). Recent cropping frequency, expansion, and abandonment in Mato Grosso, Brazil had selective land characteristics. Environ. Res. Lett. 9:064010. doi: 10.1088/1748-9326/9/6/064010
Spera, S. A., Galford, G. L., Coe, M. T., Macedo, M. N., and Mustard, J. F. (2016). Land-Use Change Affects Water Recycling in Brazil's Last Agricultural Frontier. Global Change Biol. 13:928. doi: 10.1111/gcb.13298
Stange, F., Butterbach-Bahl, K., Papen, H., Zechmeister-Boltenstern, S., Li, C., and Aber, J. (2000). A process-oriented model of N2O and NO emissions from forest soils: 2. Sensitivity analysis and validation. J. Geophysic. Res.105, 4385–4398. doi: 10.1029/1999JD900948
Sul, W. J., Asuming-Brempong, S., Wang, Q., Tourlousse, D. M., Penton, C. R., Deng, Y., Rodrigues, J. L. M., Adiku, S. G. K., Jones, J. W., Zhou, J., Cole, J. R., and Tiedje, J. M. (2013). Tropical agricultural land management influences on soil microbial communities through its effect on soil organic carbon. Soil Biol. Biochemistr. 65, 33–38. doi: 10.1016/j.soilbio.2013.05.007
Tesfay, K., Takele, R., Sapkota, T. B., Khatri-Chhetri, A., Solomon, D., Stirling, C., et al. (2021). Model comparison and quantification of nitrous oxide emission and mitigation potential from maize and wheat fields at a global scale. Sci. Total Environ. 37:107239. doi: 10.1016/j.dib.2021.107239
Tian, H., Xu, R., Canadell, J. G., Thompson, R. L., Winiwarter, W., Suntharalingam, P., et al. (2020). A comprehensive quantification of global nitrous oxide sources and sinks. Nature. 586, 248–256. doi: 10.1038/s41586-020-2780-0
Tomasella, J., and Hodnett, M. G. (1996). Soil hydraulic properties and van Genuchten parameters for an oxisol under pasture in central Amazonia. Amazonian Deforestation Clim. 96, 101–124.
Tomasella, J., and Hodnett, M. G. (2005). “Pedrotransfer functions for tropical soils,” in Pachepsky Y., Rawls, W. J. eds (Org.) Developments in Soil Science: Pedotransfer Functions in Hydrology. 30 ed. Amsterdam: Elsevier, v. 30, p. 415429.
United Nations (2018). United Nations Treaty Collection, Status of the Treaties. Available online at: https://treaties.un.org/Pages/ViewDetails.aspx?src=TREATYandmtdsg_no=XXVII-7-dandchapter=27andclang=_en (accessed September 07, 2018).
van Genuchten, M. T. (1980). A closed form equation for predicting the hydraulic conductivity of unsaturated soils. Soil Sci. Soc. Am. J. 44, 892–898, doi: 10.2136/sssaj1980.03615995004400050002x
Velthof, G. L., Oudendag, D. A., and Oenema, O. (2007). Development and Application of the Integrated Nitrogen Model MITERRA-EUROPE Alterra report (1663)0.1, Wageningen.
Venterea, R. T., Burger, M., and Spokas, K. A. (2005). Nitrogen oxide and methane emissions under varying tillage and fertilizer management. J. Environ. Qual. 34, 1467. doi: 10.2134/jeq2005.0018
Vitousek, P. M. (1984). Litterfall, nutrient cycling, and nutrient limitation in tropical forests. Ecology 65:285. doi: 10.2307/1939481
Werner, C., Butterbach-Bahl, K., Haas, E., Hickler, T., and Kiese, R. (2007). A global inventory of N2O emissions from tropical rainforest soils using a detailed biogeochemical model. Global Biogeochem. Cycles 21:GB3010. doi: 10.1029/2006GB002909
Keywords: GHG emission, agriculture, nitrogen fertilization management, amazon, food system
Citation: Costa C Jr, Galford GL, Coe MT, Macedo M, Jankowski K, O'Connell C and Neill C (2021) Modeling Nitrous Oxide Emissions From Large-Scale Intensive Cropping Systems in the Southern Amazon. Front. Sustain. Food Syst. 5:701416. doi: 10.3389/fsufs.2021.701416
Received: 27 April 2021; Accepted: 26 October 2021;
Published: 10 December 2021.
Edited by:
Bruno José Rodrigues Alves, Brazilian Agricultural Research Corporation (EMBRAPA), BrazilReviewed by:
Dongsheng Yu, Institute of Soil Science, Chinese Academy of Sciences (CAS), ChinaBeata Emoke Madari, Brazilian Agricultural Research Corporation (EMBRAPA), Brazil
Copyright © 2021 Costa, Galford, Coe, Macedo, Jankowski, O'Connell and Neill. This is an open-access article distributed under the terms of the Creative Commons Attribution License (CC BY). The use, distribution or reproduction in other forums is permitted, provided the original author(s) and the copyright owner(s) are credited and that the original publication in this journal is cited, in accordance with accepted academic practice. No use, distribution or reproduction is permitted which does not comply with these terms.
*Correspondence: Ciniro Costa Jr. Qy5Db3N0YWpyQGNnaWFyLm9yZw==