
95% of researchers rate our articles as excellent or good
Learn more about the work of our research integrity team to safeguard the quality of each article we publish.
Find out more
ORIGINAL RESEARCH article
Front. Sustain. Food Syst. , 25 August 2021
Sec. Sustainable Food Processing
Volume 5 - 2021 | https://doi.org/10.3389/fsufs.2021.698195
This article is part of the Research Topic Food Bioactives: Implications for Meeting Sustainable Development Goals View all 8 articles
 Javier Morales1
 Jorge Araujo-Sanchez1
 Lizbeth Castro-Concha1Angela Ku1
 Alejandro Pereira-Santana2
 María de Lourdes Miranda-Ham1
 Enrique Castaño1*
Betalains are tyrosine-derived plant pigments present in several species of the Caryophyllales order. Betalains are classified in red betacyanins and yellow betaxanthins and are implicated in plant stress tolerance and visual attraction for pollinators. The compounds are used as natural colorants in many industries. Today, there is little information on betalain biosynthesis with several key enzymes that remain unknown on plants of the Caryophyllales order. Omic tools have proven to be very useful in gaining insights into various molecular mechanisms. In this study, we used suspension cells from fruits of the cactus Stenocereus queretaroensis. Two growing conditions were used to perform RNA-seq and differential expression analysis to help identify betalain biosynthesis-related genes. We found 98 differential expressed genes related to aromatic amino acids and betalain biosynthesis pathways. Interestingly, we found that only one gene of the betalain synthesis pathway was differentially expressed. The rest of the genes belong to the aromatic amino acid pathway, including hydroxy phenylpyruvate-related genes, suggesting the possibility of an alternative biosynthetic pathway similar to that observed in legumes.
The essence of color is a particular characteristic that has a profound influence on the animal kingdom. We are also affected by our choice of objects, clothing, and food. However, the use of synthetic colorants has been regulated to such an extent that only a specific spectrum of dyes are endorsed by the health organizations based on their possible side effects (Trasande et al., 2018). Because of this, in the last decades, natural pigments have regained commercial, and scientific interest. Betalains are water-soluble tyrosine derivate pigments, synthesized in the cytoplasm, and stored in the vacuole. Betalains are present in flowers, fruits, and occasionally in vegetative tissue of plants of the Caryophyllales order (Osbourn, 2017; Polturak and Aharoni, 2018).
Betalains arise from several reactions that involve betalamic acid primarily, resulting in two types of pigments: betacyanins and betaxanthins. Betacyanins are red pigments, resulting in condensation of betalamic acid with a cycle-3-(3,4-dihydroxy phenyl)-L-alanine molecule (cyclo-DOPA). At the same time, betaxanthins are yellow pigments from the conjugation of betalamic acid with the amino group of amino acid. The presence of betalains in nature is related to essential processes, such as pollination of flowers or stress tolerance mechanisms. Betalains also have bioactive properties that include antioxidant and antimicrobial (Tesoriere et al., 2004; Esatbeyoglu et al., 2015), and compared with other plant pigments such as anthocyanins, betalains are stable over a wide pH range (Gandía-Herrero et al., 2016; Choo et al., 2018). The best known edible sources of betacyanins and betaxanthins include the roots of sugar beet (B. vulgaris L.) belonging to the Amaranthaceae family, and fruits of the cacti Hylocereus polyrhizus (both from Caryophyllales order) (Azeredo, 2009; Osbourn, 2017; Polturak and Aharoni, 2018).
Stenocereus (A. Berger) Riccob, is a genus within the Caryophyllales that comprises ~24 species of cacti, and its geographical distribution ranges from the southern border of the US to Peru and Venezuela. The main characteristic of this genus is the production of highly desired edible fruits, generically called “pitayas,” which have acquired commercial value as exotic fruits worldwide (Alviter, 2002). In Mexico, Stenocereus represents 19 species throughout the territory (Sánchez Mejorada, 1984). The cultivated species of this genus are Stenocereus thurberi, Stenocereus griseus, Stenocereus stellatus, Stenocereus fricci, and Stenocereus queretaroensis, the latter being the most used due to the availability of varieties and their productivity (Ruiz et al., 2015). S. queretaroensis (Weber) Buxbaum is a well-defined columnar cactus (Bravo Hollis and Sánchez Mejorada, 1978). The branches are cylindrical and have eight prominent ribs. The flowers differ in the areolas of the upper half of the branches. The pitayas of S. queretaroensis are ovoid or globose fruits, covered by a generally soft shell, which have areolas with thorns. The pulp of the fruit is juicy and sweet, with colors of various blends of white and purple, although depending on the variety, it can have colors ranging from pink to yellow (Supplementary Figure 1). The betacyanins and betaxanthins present in the fruits provide intense and attractive colors, which are considered essential indicators for the classification of varieties in this genus.
The pigments extracted from pitayas have some advantages over those extracted from beetroots as they do not alter the taste of other foods (Azeredo, 2009). In addition, the range of colors from cacti betalains ranges from yellow to violet, compared with pigments obtained from other sources. Based on the broad color spectrum, water solubility, and various bioactive properties, pitaya betalains are promising candidate pigments with a wide range of potential applications in the food industry and the biotechnological processing of food products.
Because plants can harbor particular steps in metabolite biosynthesis and their precursors (Schenck and Maeda, 2018), transcriptomics can be a useful tool for the study of the biosynthetic pathway of betalains in different species within the Caryophyllales order, all of them without a reference genome. Four key genes of betalain production were identified: 4,5-DOPA dioxygenase estradiol, cytochrome P450, and glucosyltransferase in a study of Hylocereus polyrhizus pulp fruits (Qingzhu et al., 2015). Most recently, a newly recognized gene named CYP76AD6, which codes for a cytochrome P450-like enzyme was silenced in sugar beet, reducing betalain formation. Moreover, in tobacco leaves, overexpression of this gene leads to a betalain heterologous biosynthesis (Polturak et al., 2016). Furthermore, in Bougambilia species, a tight correlation between betalain content and CYP76AD1, dihydroxy-phenylalanine (DOPA)-4,5-dioxygenase (DODA) was shown in a transcriptomic analysis (Xu et al., 2016). An evolutionary approach in Mirabilis jalapa flowers reveals pivotal changes in betalain biosynthesis compared with anthocyanins, where not only lacking of anthocyanin related genes, but some specific gene mutations lead to betalain synthesis (Polturak et al., 2018). Recently, a study in fruits of Hylocereus costaricensis found a higher expression of the CYP76AD1α and DODAα genes in red fruits compared with a white pulp of Hylocereus undatus (Xi et al., 2019). Here, we identified pivotal genes related to betacyanin synthesis through the differential expression profiles and their induction by sugar content or osmotic stress.
Two growing conditions were established for cell suspensions obtained from the mesocarp of S. queretaroensis fruits. A modified MS media (Murashige and Skoog, 1962) was used containing 4.02 μM Ca2+ and minus glycine and nicotinic acid. Sucrose 3% (SqY1 media) or 8% (SqR1 media), were used for the growth of cells under in vitro culture conditions (Miranda-Ham et al., 1999). Previous to the multiplication of the plant material, 15 ml of the inoculum cells in SqY1 media was added to 40 ml of half-strength MS media using 50 Erlenmeyer flasks of 250-ml volume capacity; on the other hand, we added 10 ml of the inoculum cells in SqR1 media to 40 ml of half-strength MS using 60 Erlenmeyer flasks of 250-ml volume capacity. The cell cultures were moved at room temperature (25°C ± 2) under constant mechanical agitation at 115 rpm and in continuous light conditions.
We evaluated the fresh weight (FW) and dry weight (DW) of the cell mass as well as the pH and conductivity of the residual medium. The cell growth assessment was performed on pre-scheduled dates, starting on day 0 and every 2 days during 34 days. Three flasks were randomly selected from each condition. FW of the cultures was determined by vacuum filtering the total content of each flask with the help of a funnel and depositing the collected liquid medium in individual conical tubes. We conducted pH measurements using a Thermo Orion potentiometer and we measured the electrical conductivity with a Hanna conductometer, calibrated against distilled water. For both cultures, we conducted all the measurements every second day. All experiments were performed three times; for every day of measure, we took three flasks, to calculate media and standard deviation in every day of evaluation.
The pigment content was determined by the spectrophotometric method reported previously (Cai et al., 2003), using the fresh extract obtained, measured in a spectrophotometer (Génesys 10 UV-vis) in triplicate and using the following formula:
where BC is the content of betalains in fresh weight (mg/g), V is the volume (ml) of the extract obtained, DF is the dilution factor, L is the length of the optical step (cm), and W is the weight of the sample (g). For red pigments (betacyanins), A is the absorbance measured at 538 nM, MW is the molecular mass of betanine (550 g/mol), and ε is the molar absorbability of betanine (60,000 L/mol × cm). In the case of betaxanthins, A is the absorbance measured at 480 nM, MW is the molecular mass of indicaxanthin (308 g/mol), and ε is the molar absorbability of indicaxanthin (48,000 L/mol × cm). For each, quantification media and standard deviation were calculated.
Six flasks of sucrose at 3% and six of sucrose at 8% were harvested on the 16th day of culture. Then, the flask of each condition was mixed, filtrated, and aliquoted into cryovial tubes containing 0.1 g of sample each. The cryovials were frozen with liquid nitrogen and stored at −76°C until RNA extraction.
Fourteen-day growth cells of SqY1 were reseeded in 3% sucrose, 8% sucrose, and 3 plus 5% PEG 6,000 media. Color changes were documented on days 3, 5, and 7 of culture cycle. Cells of the 7th day were taken and fixed with 4% formaldehyde for 24 h and 4°C temperature. Later, the cells were mounted in fluoroshield-DAPI (Sigma Aldrich) in glass slides and incubated for 30 min. Cell images were taken in a confocal microscope [Olympus FV1000 microscope (Olympus Corporation)] using 355, 488, and 555 nM, and bright field. We used bright field for cell detection. A 355-nM channel was used for the detection of DAPI (in blue). Betaxanthin fluorescence was detected in 488 nM excitation wavelength. No fluorescence was detected in 555 nM. Colocalization of DAPI and betaxanthin was made by merging 355- and 488-nM channels.
The color change was carried out from photos of the Erlenmeyer flasks with cell growth in 3 sucrose, 8 sucrose, and 3% plus 5% PEG media. Photos were taken under the same conditions. Once the photos were taken and a composed photo of all nine flasks was made, the image was analyzed in the ImageJ software in which the background was subtracted with the background subtraction tool. The values of the three channels and the calculated percentage of each signal were obtained. Finally, the percentages of the red channel signal from each treatment were plotted.
A 0.1 g of SqY1 and SqR1 were used for RNA extraction with the kit PureLink™ RNA Mini Kit (Invitrogen) with some modifications: We used 1 ml of TRIzol™ Reagent buffer for lysis; homogenization was carried with 0.5 mm glass beads, 500 μl of isopropanol was added to homogenate, and then was passed through kit columns according to the manufacturing procedure. RNA was eluted with 50 μl of water. The quality of the RNA samples was evaluated by nanodrop 2,000 (Thermo Scientific™) and by Agilent 2,100 bioanalyzer. The integrity of the samples was visualized in a non-denaturing agarose gel (1%).
Of the total RNA per sample (three per condition), 1 μg was used as input material for each sequencing library by using poly-T oligo-attached magnetic beads. Sequencing libraries were generated using NEBNext® Ultra™ RNA Library Prep Kit for Illumina® (NEB, USA) following the recommendations of the manufacturer. Index codes were added to attribute sequences to each sample, and library quality was assessed on the Agilent Bioanalyzer 2,100 system, RNA-sequencing, and de novo assembly.
Pair-end sequencing configuration (150 PE × 40 M raw reads) was performed on a Novaseq 6,000 sequencer. The resulting raw reads were processed by FASTQC (http://www.bioinformatics.babraham.ac.uk/projects/fastqc/) and Trimmomatic v0.36 (Bolger et al., 2014) to filter and remove low-quality sequences and reads (Q ≥ 20). The resulted clean reads were assembled by using Trinity v.r2014-04-13p1 (Grabherr et al., 2011) with minimum kmer coverage set to 2 and all other parameters set to default. We used the Corset software v1.05 (Davidson and Oshlack, 2014) for the clustering of transcripts to enhance the statistical power of DEG analysis by reducing redundancy.
The functional annotation of all assembled transcripts was done against the following databases: NR (NCBI non-redundant protein sequences), NT (NCBI non-redundant nucleotide sequences), Pfam v33.1 (Protein family, Finn et al., 2014), KOG/COG (Clusters of Orthologous Groups of proteins, Tatusov et al., 2003), Swiss-Prot (A manually annotated and reviewed protein sequence database; www.uniprot.org), KO (KEGG Ortholog database, Kanehisa and Goto, 2000), and GO (Gene Ontology, Ashburner et al., 2000). The e-value threshold for NT, NR, SwissProt, and KOG was 1e−5; for PFAM, 0.01; for Go, 1e−6; and for KEGG, 1e−10.
Quantification of gene expression levels was estimated by mapping all the PE trimmed libraries to the de novo assembled transcriptome (filtered by Corset) employing Bowtie2 program (Langmead and Salzberg, 2012), which is wrapped into the RNA-Seq by Expectation-Maximization (RSEM) software v1.2.26 (Li and Dewey, 2011). Read counts were normalized to FPKM (expected number of Fragments Per Kilobase of transcript sequence per Millions of base pairs sequenced), representing the normalized gene expression levels.
Before expression analysis, the sample correlation was calculated using Pearson correlation, to test the reliability of the experiment. Differential expression analysis of the two conditions (SqYC and SqRT) was performed by using the DESeq R package v1.10.1 (Anders and Huber, 2010), which is based on the negative binomial distribution. Differential expressed genes (DEGs) were defined as those presenting a fold change (FC) ≥ 1 and an adjusted p-value ≤ 0.05.
Gene Ontology (GO) enrichment analysis of the DEGs was implemented by the GOseq R package v1.10.0, based on Wallenius non-central hypergeometric distribution (Robinson and Oshlack, 2010). KOBAS software v2.0.12 (Mao et al., 2005) was used to test the statistical enrichment of differential expression genes in KEGG pathways.
RNA-Seq raw data of all libraries were deposited in the National Center of Biotechnology Information (NCBI) Sequence Read Archive (SRA accession: GSE173230). The Bioproject accession: GSE173230. The accession numbers of biosamples are GSM5263976-SqR1, GSM5263977-SqR2, GSM5263978-SqR3, GSM5263979-SqY1, GSM5263980-SqY2, and GSM5263981-SqY3.
Cell cultures of S. queretaroensis of both treatments (SqY1 and SqR1, Figure 1) were evaluated for 34 days of growth and color evaluation (yellow to reddish gray as indicated in the color index, Supplementary Figure 2). Four different parameters were measured as stated in the Materials and methods section in order to measure growth, where both treatments behaved in a similar manner, only fresh weight was presented. At the end of the SqY1 culture cycle (treatment with 3% sucrose), a typical sigmoid curve could be observed, whose growth phases were well identified. The lag phase was identified between days 0 and 8; the exponential phase was found between days 8 and 20, with a progressive deceleration between days 20 and 22; and the stationary phase was observed from day 22 (Figure 1B). For the SqR1 treatment (grew with 8% sucrose), the lag phase lasted until the fourth day (Figure 1E). From this day, the exponential growth became evident until the 20th day, and the stationary phase was observed between days 20 and 30, to finally give way to the phase of cell death (Figure 1E).
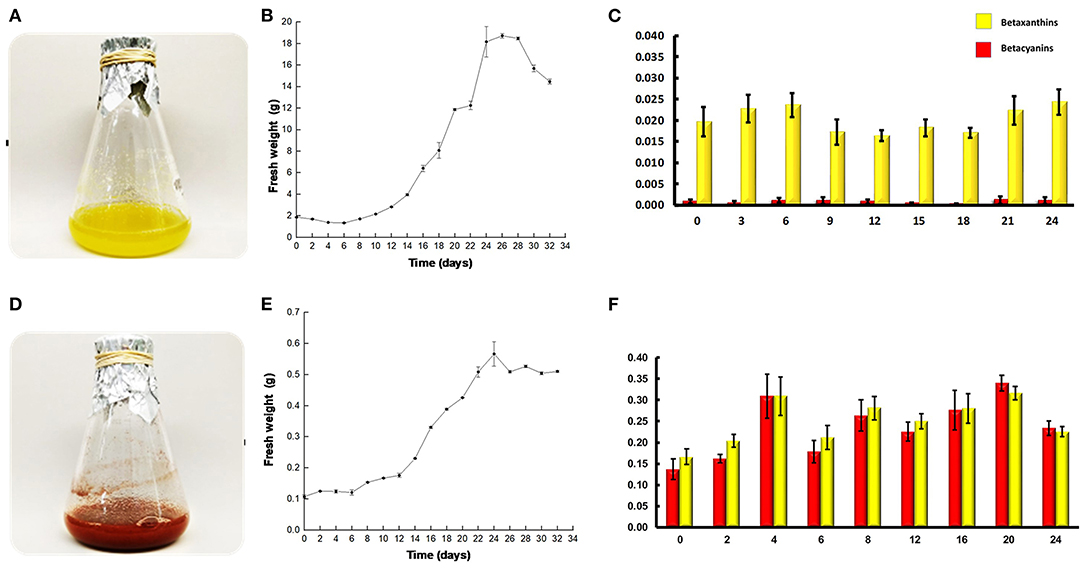
Figure 1. Pitaya cell grow and betalain quantification. (A) SqY1 suspension cell Erlenmeyer flask. (B) SqY1 culture cycle grow curve (fresh weigh). (C) Betalain quantification during culture cycle. (D) SqR1 suspension cell Erlenmeyer flask. (E) SqR1 culture cycle grow curve (fresh weigh). (F) Betalain quantification during culture cycle.
The quantification of betalains in the SqY1 line (Figure 1A) shows that pigment presence belonged to the betaxanthin class, with a small amount of betacyanins. We observed a small increase in both betalains during the exponential phase, followed by a fall at day 9, a recovery occurs on day 12 (Figure 1C) that coincides with the stationary phase. The SqR1 line (Figure 1D) had one order magnitude difference in the content of betaxanthins compared with the SqY1 line. However, SqR1 presented a similar amount of betacyanins and betaxathins, where there appears to be an increase on the fourth day and then fall on the 6th day, and a recovery is observed on day 8 (Figure 1F).
Six transcriptome libraries were constructed with a total of 88 million raw reads: three corresponding to betaxanthin-producing cells (SqY1) and three for betacyanin productions (SqR1). The error rate distribution was calculated for all libraries (Supplementary Figure 3), and then, all the reads were filtered to leave only those with the highest quality, and sequence-free adapters (Supplementary Figures 3, 4); finally, we kept 13 G of clean bases with a phred quality ≥Q20, with a total of 81.7 Gbp for the assembly (Table 1) and GC content around 46% (Supplementary Figure 5).
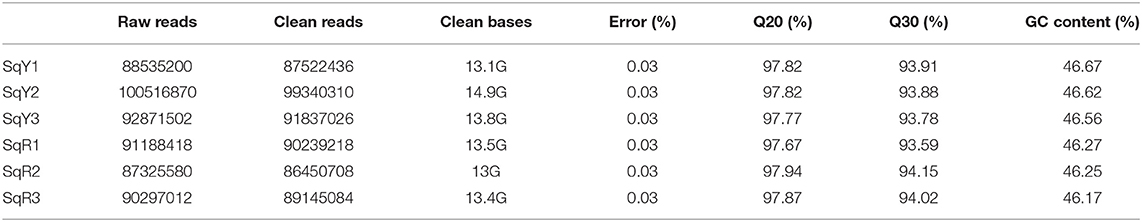
Table 1. Libraries reads quality control.
A total of 171,128 transcripts (Table 2) were assembled with a minimum size of 201 nucleotides, a maximum length of 15,505, and an average length of 1,531. The N50 and N90 for the assembled transcripts were 2,379 and 703, respectively. We obtained 170,970 unigenes (Table 2) with a minimum length of 201 and a maximum of 15,505, while the average sequence sizes were 1,532. The N50 and N90 were calculated at 2,380 and 704, respectively (Table 3). This is reflected in the distribution of transcripts according to their length in nucleotides (Table 2), where it can be observed that 77% of transcripts were >500 bases.
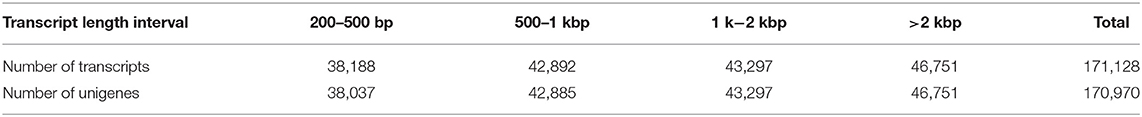
Table 2. Transcript length distribution.

Table 3. Unigene length distribution.
The 170,970 unigenes were annotated against seven public databases: NR, Pfam, GO, KO, KOG, NT, and SwissProt (Supplementary Figure 6A). From the total of assembled transcripts, 26,159 were found in seven databases, 58.91% of them in the NR database, 45.01% in the SwissProt, and 21.23% in the KOG database (Figure 2A). From the total of annotated transcripts, 17,619 were found exclusively in the NR database, 1,644 in NT, and five were only found in KOG (Supplementary Figure 6B).
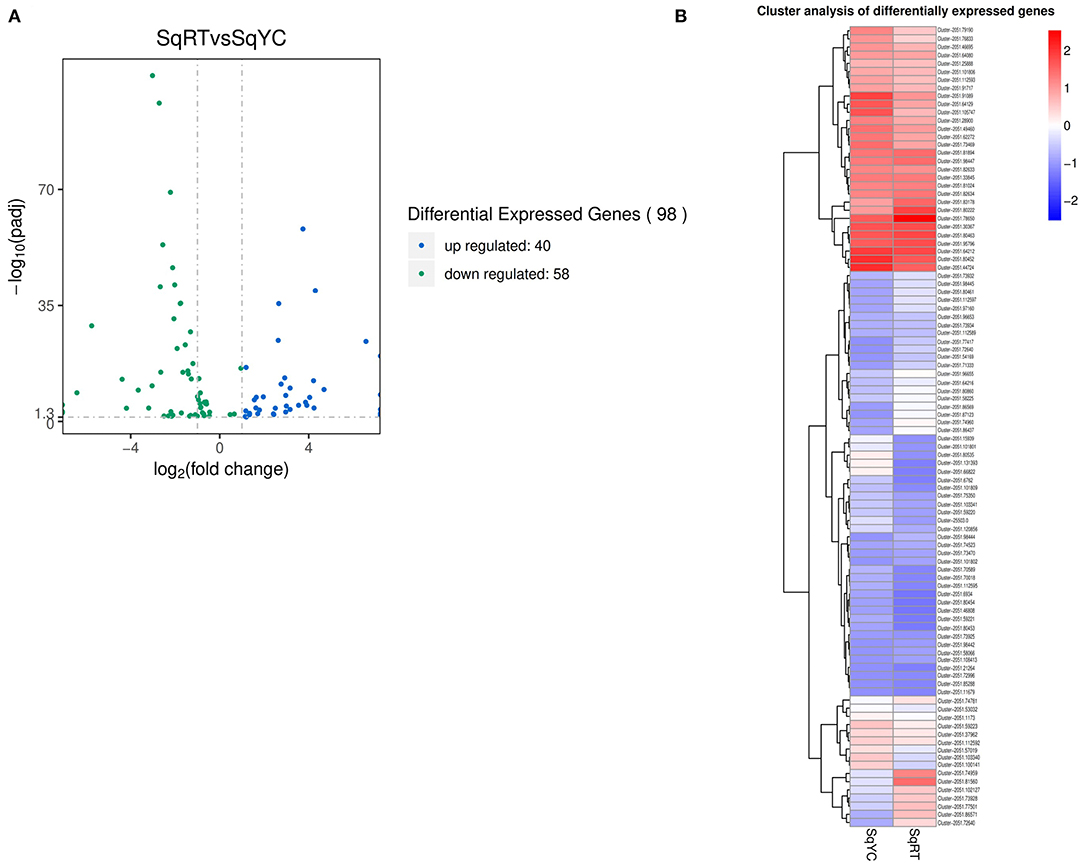
Figure 2. Betalain-related pathways differentially expressed gene (DEG) analysis. (A) Volcano plot of DEG in betalain biosynthesis and aromatic amino acid pathways. (B) Cluster analysis of the 98 DEGs.
Regarding the blast species classification, 66.5% of the annotated sequences had a higher similarity to Beta vulgaris, 4.7% to Vitis vinifera, 1.6% to Nelumbo nucifera, and 1.4% to Theobroma cacao. The other 24.4% of the sequences had similarities to other species (Supplementary Figure 6C). About the highest range of similarity, 46.3% of the assembled transcripts had a similarity percentage of 60–80%, while only 1.5% of annotated sequences had a similarity value range of 95–100% (Supplementary Figure 6D).
From the total of annotated transcripts, 31% had a higher percentage of representativeness of 1e100, while only 4.6% had an e-value equal to 0 (Supplementary Figure 7A). Regarding the KOG classification, the main categories within annotated genes were general function prediction only, posttranslational modification, protein turnover, chaperones, and signal transduction mechanisms (Supplementary Figure 7B). Finally, for KEGG classification, the main enriched pathways were carbohydrate metabolism, folding, sorting and degradation, and translation (Supplementary Figure 7C). All transcripts were mapped against the GO term database and classified according to the three main categories: biological process (BP), molecular function (MF), and cellular component (CC). Among the principal terms in the BP category are cellular process, metabolic process, single-organism process; among the MF terms are: binding and catalytic activity; and within CC terms are: cell, cell part, organelle, and macromolecular complex (Supplementary Figure 7D).
Pearson's correlation indicated values above 0.9 for the SqY1 libraries and above 0.86 for the SqR1 libraries (Supplementary Figure 8A), but it was close to 0.6 among the libraries of different lines. The expression level of each gene was quantified by RSEM program by mapping all clean reads of each library against our de novo assembled transcriptome. The accounts for all six libraries were normalized to FPKM values (Supplementary Figure 8B).
From all the unigenes that were expressed at least at 0.3 FPKM (116,136 transcripts), we identified a total of 48,963 DEGs among treatments; 25,353 were upregulated and 23,610 were downregulated (Supplementary Figure 9B). Comparing SqYC and SqRT groups, we identified 60,456 common expressed genes; 36,282 were expressed only in SqRT and 19,398 in SqYT (Supplementary Figure 9C).
According to the three main categories of GO database, the term within MF were the most enriched for the DEG, and been binding, heterocyclic compound binding, organic cyclic compound binding, ion, and protein binding, the most enriched terms. Within biological process (BP), the most enriched terms were protein metabolic process and cellular protein metabolic process (Supplementary Figure 10A).
Within the KEGG-enriched categories of upregulated DEGs were protein processing in the endoplasmic reticulum and plant–pathogen interaction (Supplementary Figure 10B). On the other hand, for the downregulated DEGs, the enriched categories for KEGG pathways were carbon metabolism, ribosome, and RNA transport (Supplementary Figure 10C). The upregulated genes had lower q-value overall than the downregulated, where ribosomes were the category with the lowest q-value.
We focused on the biosynthetic pathways of aromatic amino acids and betalains; a total of 98 DEGs were identified (Figure 2A). From those, 40 genes were upregulated and 58 were downregulated, where 10 of them had a higher significant difference (–log10 q-value) >35, while the clustered heat map (Figure 2B) shows the close relationship between the expression patterns of these genes.
Regarding the aromatic amino acid metabolic pathway (Figure 3), it was observed that 23 related to tyrosine precursors were downregulated, pre-synthesis of shikimate, specifically the genes of shikimate kinase enzymes (2.7.1.71), enol pyruvyl-shikimate phosphate synthase (2.5.1.19), and chorismate synthase (4.2.3.5), while chorismate mutase (5.4.99.5), which synthesizes prephenate from chorismate presents both up- and downregulated genes. In the same way, two prephenate transaminases, whose product is the L-arogenate (2.6.1.78 and 2.6.1.79) have similar behaviors. Interestingly, the expression of the arogenate dehydrogenase (1.3.1.78), which produces tyrosine using L-arogenate as substrate, is downregulated in red cells. In addition, a large number of genes related to the synthesis of phenylalanine, phenylpyruvate, and hydroxy-phenylpyruvate show an expression both upregulated and downregulated.
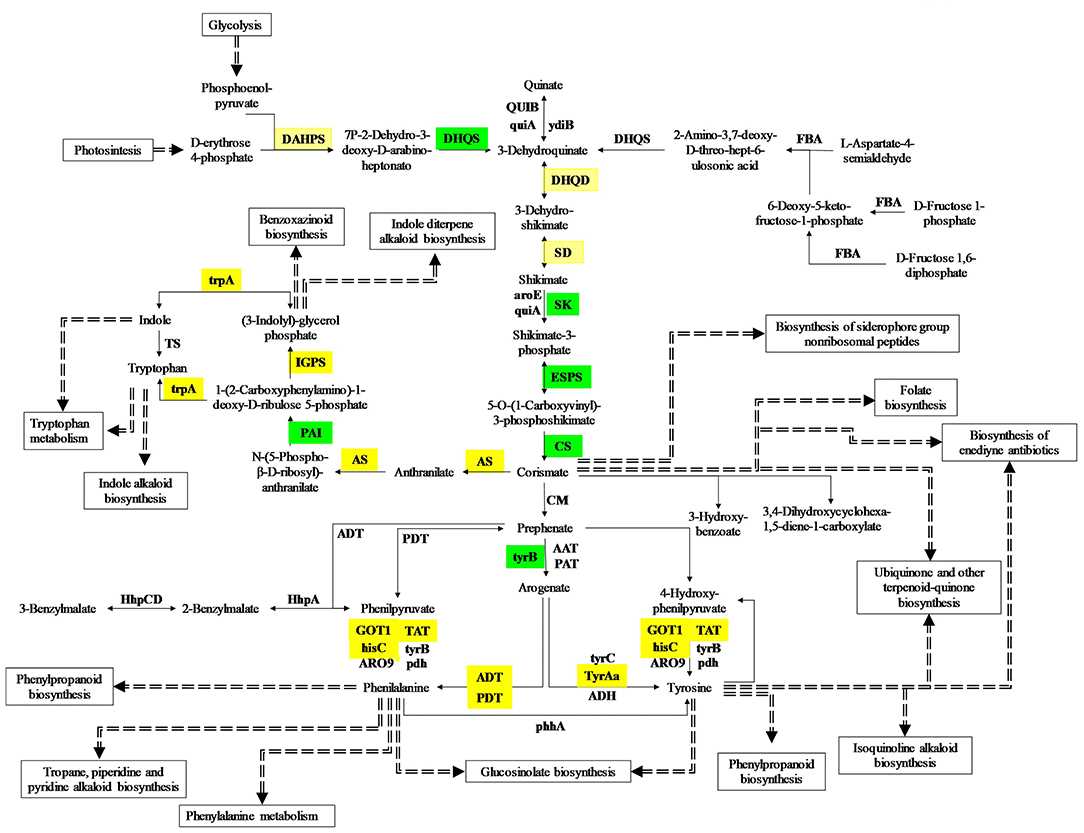
Figure 3. DEG genes are involved in the aromatic amino acid pathway. Red squares indicate upregulated genes. Green squares indicate downregulated genes. Yellow squares show both up- and downregulated genes.
Concerning the betalain biosynthetic pathway (Figure 4), only two gene clusters associated with 4.5-DOPA dioxygenase estradiol (DODA, 1.13.11) were observed (Figure 2B). The first Cluster−2,051.103340 is upregulated in yellow cultures and downregulated in red. In the second Cluster−2,051.102127, the regulation occurs inversely. We observed a similar behavior in the case of two tyrosine aminotransferases: Cluster−2,051.66822 and Cluster−2,051.73928. The first has a light upregulation expression in yellow and downregulation in red, while the second transcript is upregulated in red and downregulated in yellow cells.
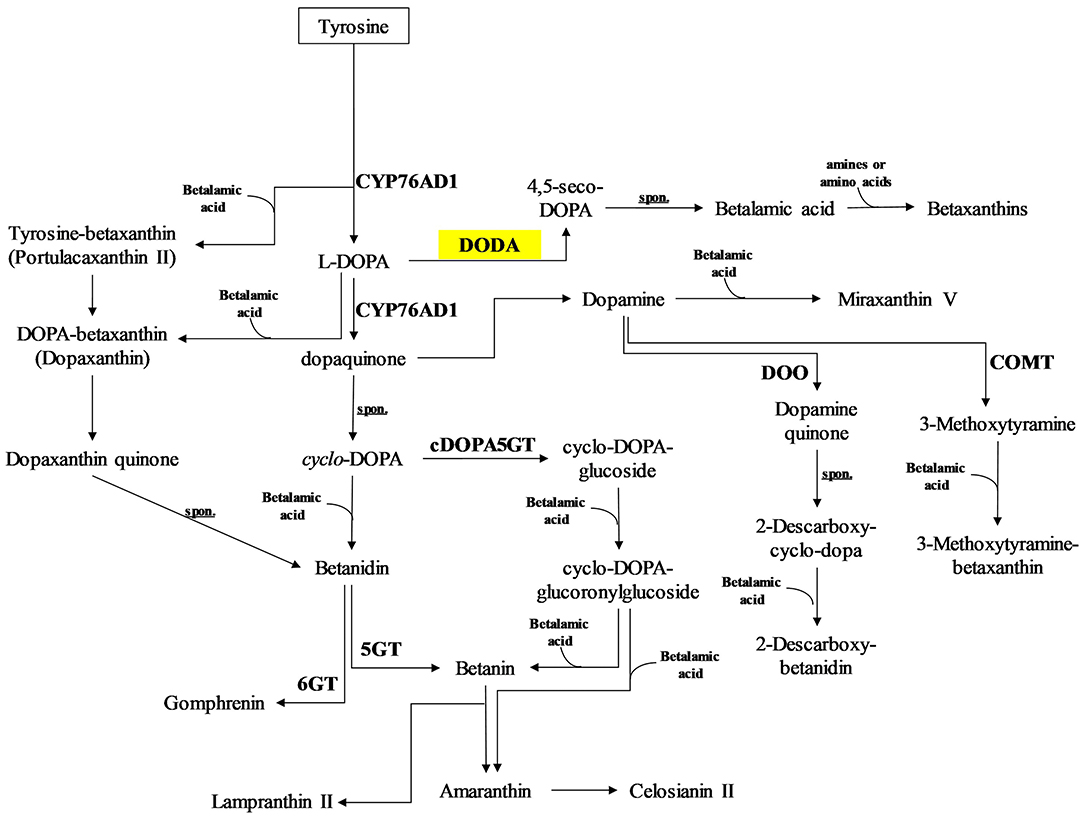
Figure 4. DEG genes related to betalain synthesis pathway. Green squares indicate down regulated genes. Yellow squares show both up and downregulated genes.
According to total betalain quantification (Figures 1C,F), a sucrose concentration of 8% enhanced the betalain production in pitaya suspension cells. This solute concentration can create osmotic stress in the cells. Therefore, we decided to perform a time-lapse to define color change from cell cultures of S. queretaroensis yellow grown in SqR1 or SqY1 media with or without added polyethylene glycol 6,000 to induce osmotic stress (Elmaghrabi et al., 2017). The cells showed no apparent changes in pigmentation in the first 3 days of culture (Figures 5A–C). On the 5th day, we observed a clear difference between the cells in the 8% sucrose media and the cells with 5% PEG. The latter showed a slightly red pigmentation in comparison with the 8% of sucrose (Figure 5A,D–F). On the 7th day of culture (Figure 5A,G–I), the cells in 3% sucrose media showed no change in color; however, the cells cultivated in 8% sucrose or in the media containing 5% PEG begun to produce pigmentation change (Figure 5B). On the 9th day, the cells with sucrose at 8% show a greater red color turnover in comparison with the other two conditions (Figure 5B)
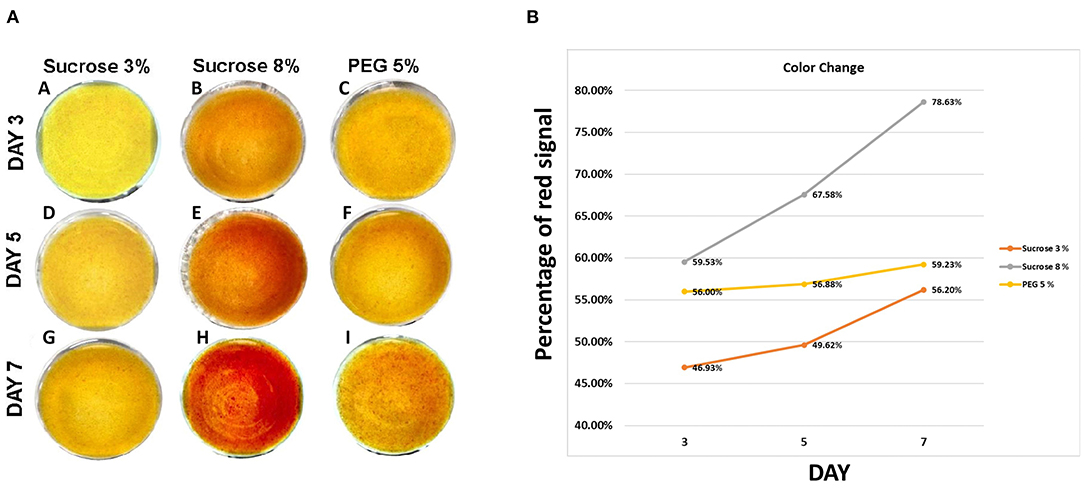
Figure 5. Betalain synthesis in Stenocereus queretaroensis culture. (A) Time lapse of yellow cell (Sqy1) osmotic treatment. (A), (D), and (G) belong to the sucrose 3% media culture. (B), (E), and (H) are sucrose 8% condition. (C), (F), and (I) belong to PEG 6000 5% treatment. Time lapse was performed by 7 days. (B) Percentage of the red channel of the RGB measurement.
Confocal analysis shows betaxanthin accumulation in cells (Figure 6). We took the cells of 3% sucrose and PEG conditions on the 7th day, the cells were then fixed and stained with DAPI, which was used as a nuclear reference. We observed intact round cells in the bright field (Figures 6A,F), and DAPI in 355 channels showing cell nuclei. The nuclei do not show alteration in shape (Figures 6B,G). In 488 channels, we observed a signal corresponding to betaxanthin (Figures 6C,H) due to the excitation wavelength of 450–490 nM reported for these pigments (Gandía-Herrero et al., 2005; Guerrero-Rubio et al., 2020). The autofluorescence occurs only in yellow color cells at 488 nm (Supplementary Figure 11). The signal in PEG-treated cells located in the nuclear and cytoplasmic areas of the cell, while the cells grown in 3% sucrose showed autofluorescence surrounding the cell nucleus.
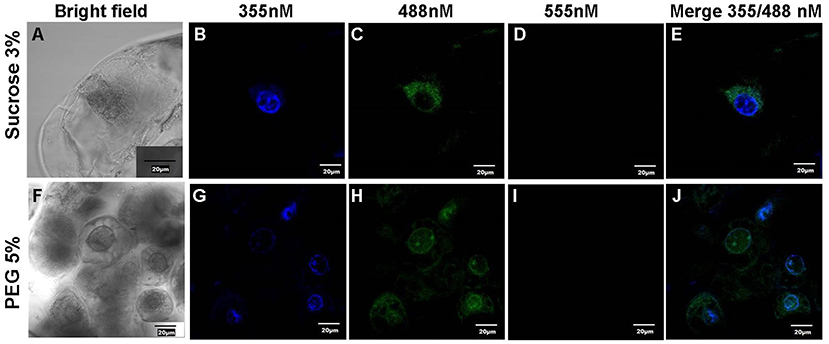
Figure 6. In cell fluorescent detection of Stenocereus queretaroensis. (A,F) Bright field of culture cells, (B,G) DAPI stained signal at 355 nM, and (C,H) Autofluorescence Stenocereus queretaroensis culture cells at 488 nM as stated in the Materials and methods section. (D,I) lack of autofluorescence signal at 555 nM (E,J). Merge of 355 and 488 channel. The cells were cultivated either in the absence of stress at 3% glucose or under osmotic stress with PEG 5%.
Betalains are secondary metabolites derived from tyrosine and are unique to plants of the order of Caryophyllales. Betalain function, in addition to attracting pollinators and seed dispersor, also plays a function in mechanisms of stress tolerance. Recently, betalains have become significant due to the wide variety of colors they possess as well as their bioactive properties (Tesoriere et al., 2004; Khan and Giridhar, 2015; Osbourn, 2017; Polturak and Aharoni, 2018).
The use of sequencing tools, particularly RNA-seq analysis for de novo assemblies, have proven to be very useful in determining genes of importance for the synthesis of a large number of plant metabolites, including secondary metabolites derived from tyrosine such as alkaloids or other pigments such as anthocyanins (Zhao et al., 2014; Liu et al., 2015; Wei et al., 2015) in model and non-model plants. This approach results are very useful for studying particularities in the synthesis of specialized metabolites derived from tyrosine like betalains. S. queretaroensis can produce a large number of betalain colors. This fact makes very attractive to deepen our knowledge of the synthesis of these pigments.
According to the data provided by the growth curve and the quantification of the pigments, the days of most significant accumulation of betalains coincide with the stationary phase, which is typically considered the condition where secondary metabolites are produced. Therefore, day 16 was chosen to perform the RNA extraction with cells (yellow and red) of both conditions of sucrose concentration as a first approach to the identification of DEGs.
Since a reference genome is not available, seven databases were used to perform the annotation of 170,970 unigenes, of which 66.5% had the highest degree of similarity against the genes of B. vulgaris, which is one of the closest species with genome and transcriptomes publicly available, and also, this is a betalain producer species within Caryophyllales. Moreover, functional notation showed that much of the genes might be primarily related to protein synthesis and post-translational modifications, as well as cell transport, which is characteristic of the exponential phase in cell cultures.
Pearson's correlation analysis indicates a high correlation between the replicates of each condition, but with differences between treatment conditions. Based on the values of Pearson correlation in the SqYC replicates, higher than 0.9, it indicates greater reproducibility when compared with those of SqRT, which was <0.9. This is probably a reflection of what is observed in the betalain content, where it is observed that in SqYC samples (SqY1-3), the presence of betaxanthins is observed almost uniquely, while in SqRT samples (SqR1-3), both betaxanthins and betacyanins are observed in similar proportions, suggesting a more heterogeneous population. However, despite this, values close to 0.5 of Pearson correlation between the two groups indicate a different expression.
Within the 116,136 DEGs identified, we focused on two metabolic pathways, betalain synthesis, and aromatic amino acid pathway. We found that 1 of these belongs to betalain synthesis, 94 of them to aromatic AA pathway (Figures 3A,B), and 15 transcripts corresponding to 9 genes with a differential expression (Figure 3B): chorismate mutase, bifunctional 3-dehydroquinate dehydratase/shikimate dehydrogenase, arogenate dehydrogenase, tyrosine aminotransferase, 4,5-DOPA dioxygenase estradiol, Pyrus × bretschneideri N-(5′-phosphoribosyl) anthranilate isomerase 1, aspartate aminotransferase, and chorismate mutase type II (Supplementary Table 2).
We expected an increased expression on genes related to tyrosine biosynthesis, especially arogenate dehydrogenase (TyrA; EC 1.3.1.78). This gene had a reduction in its expression in red SqR1 cells and a slight increase in yellow SqY1 cultivated cells. This is the opposite of what is expected since the production of tyrosine is necessary for an enhanced betalain biosynthesis, which has been observed in other betalain producer species (Lopez-Nieves et al., 2018; Polturak et al., 2018; Liu et al., 2019; Xi et al., 2019).
Similarly, there are differentially expressed genes related to the production of phenylpyruvate, such as prephenate dehydratase (EC 4.2.1.91 and 4.2.1.51) and aminotransferases such as aspartate aminotransferase (EC 2.6.1.1), tyrosine aminotransferase (EC 2.6.1.5), and histidinol phosphate aminotransferase (EC 2.6.1.9). Both genes present positive and negative fold changes, thus, suggesting that a change occurs through transcriptional regulation of isoenzymes that are more efficient in the synthesis of the by-products of these pathways.
The results suggest two alternatives: one indicates that in S. queretaroensis, synthesis of tyrosine preferably used hydroxyphenylpyruvate to produce tyrosine (Yoo et al., 2013; Bedewitz et al., 2014), in specific conditions, such as osmotic stress due to 8% sucrose grow media. This is suggested for the differential expression of tyrosine aminotransferase in cultures. Even more, this should indicate the presence of this alternative cytosolic located pathway.
PEG treatment mimics osmotic stress (Elmaghrabi et al., 2017; Zhang and Shi, 2018), and our treatment was capable of inducing color change to red and betaxanthin accumulation inside yellow cells. In addition, the content of betacyanins is higher in cells of the SqR1 line than in SqY1. However, these results cannot confirm this assumption, since this pathway is common only in bacteria and legumes (Schenck and Maeda, 2018), and so, future analyses such as RT-qPCR, heterologous expression, and enzymatic characterization of the products of these genes should be carried out.
The second alternative suggests that the point at which sampling was performed may not be ideal for identifying differential genes related to betacyanin synthesis in which the content of betacyanins and the expression of specific genes may change. This may be the effect of reseeding and the difference between the two crops, such as the duplication time that could be reflected in the phase of the cell cycle in which most cells are located as they are not synchronized.
Since some of the genes are classified according to their function, they are limited in protein synthesis, nutrient transport, and DNA repair, which is common in the G2 phase of the cycle, when cells decide to divide (Vasconsuelo and Boland, 2007). This could explain the TyrA downregulation since tyrosine must be tightly regulated for normal cell growth (de Oliveira et al., 2019) and no bioinformatic evidence of a prephenate dehydrogenase expression, which is then responsible for tyrosine biosynthesis in legumes, could be found (Schenck et al., 2015).
We identify two DEGs corresponding to 4,5-estradiol-dioxygenase or DOPA (EC 1.13.11-), which is consistent with the data in other betalain-producing species (Lopez-Nieves et al., 2018; Polturak et al., 2018; Liu et al., 2019; Xi et al., 2019). DOPA has been identified as an essential gene for the synthesis of betacyanins since its product, 4,5-seco-dopa undergoes a spontaneous re-arrangement to produce betalamic acid, which is condensed with another 4,5-seco-dopa molecule to produce betanidine will be modified to produce the different varieties of betalains (Christinet et al., 2004; Gandía-Herrero and García-Carmona, 2012; Bean et al., 2018). DOPA belongs to a family of enzymes with different catalytic properties, being able to produce different amounts of 4,5-seco-dopa. They also participate in functions not related to pigment synthesis, but yet related to tyrosine metabolism. This explains the fact that the two genes show opposite expression patterns (Christinet et al., 2004).
A high-quality transcriptome of S. queretaroensis was obtained, a cactus with promising potential as a source of betalains. Ninety-five DEGs related to both tyrosine synthesis and the amino acid from which these pigments are derived are both from the betalain synthesis pathway. The arogenate dehydrogenase (2051.131393) was found to be downregulated in red cultures, which contradicts what is observed in the metabolism of aromatic amino acids in most plants, except for legumes. It was found that two DEGs probably belong to DOPA, of which only one of them (2051.103340) is upregulated in yellow and one in red (2051.102127). A similar case occurs with one tyrosine aminotransferase upregulated in yellow (2051.66822) and one in red (2051.73928) suggesting the possibility of an alternative cytosolic biosynthetic pathway, which is only found in legumes. This color change and betalain accumulation is related to stress, mainly osmotic stress, since PEG is capable of inducing betacyanin production.
This species, as well as its cell suspensions, may be crucial to the identification of genes essential for the synthesis of betalains. Finally, more in-depth analyses must be carried out to discard or accept the results obtained.
RNA-Seq raw data of all libraries were deposited in the National Center of Biotechnology Information (NCBI) Sequence Read Archive (SRA accession: GSE173230). The Bioproject accession: GSE173230. The accession numbers of Biosamples are: GSM5263976-SqR1, GSM5263977-SqR2, GSM5263978-SqR3, GSM5263979-SqY1, GSM5263980-SqY2, GSM5263981-SqY3.
JM: RNA extraction, quantification, transcriptomic and DEG results analysis, cell fixation, data analysis, and manuscript writing. JA-S: plant cell growth and manuscript writing. LC-C: plant growth, betalain quantification, and culture cycle characterization. AK: confocal microscopy analysis and including samples preparation. AP-S: data bioinformatic analysis and critical review and editing. MM-H: conceived the study and manuscript preparation. EC: conceived the study, data analysis, and manuscript preparation.
This work was supported by CB-2016-286730-Z CONACYT Ciencia Basica.
The authors declare that the research was conducted in the absence of any commercial or financial relationships that could be construed as a potential conflict of interest.
All claims expressed in this article are solely those of the authors and do not necessarily represent those of their affiliated organizations, or those of the publisher, the editors and the reviewers. Any product that may be evaluated in this article, or claim that may be made by its manufacturer, is not guaranteed or endorsed by the publisher.
The Supplementary Material for this article can be found online at: https://www.frontiersin.org/articles/10.3389/fsufs.2021.698195/full#supplementary-material
Supplementary Figure 1. Stenocereus queretaroensis (pitaya) cactus. (A) Whole pitaya plant. (B) pitaya fruit.
Supplementary Figure 2. Culture cycle of pitaya suspension cells. (A) Color index from the Society of Dyes and Colorants. (B) Erlenmeyer flasks with pitaya suspension cells with different betalain content.
Supplementary Figure 3. Error rate distribution along with the six Libraries. (A) SqY1 (B) SqY2 (C) SqY3 (D) SqR1 (E) SqR1 (F) SqR1.
Supplementary Figure 4. Read quality distribution. (A) SqY1 (B) SqY2 (C) SqY3 (D) SqR1 (E) SqR1 (F) SqR1.
Supplementary Figure 5. Nitrogenated bases content. (A) SqY1 (B) SqY2 (C) SqY3 (D) SqR1 (E) SqR1 (F) SqR1.
Supplementary Figure 6. Sequence annotation analysis. (A) Sequence annotation in seven databases. (B) Venn diagram of gene distribution along with databases. (C) Species classification. (D) Similarity distribution.
Supplementary Figure 7. Gene functional annotation. (A) E-VALUE distribution. (B) KOG function classification. (C) KEGG classification. (D) GO function classification.
Supplementary Figure 8. Gene expression level, SqYC vs SqRT. (A) Pearson correlation. (B) FPKM density distribution. (C) FPKM distribution in boxplot.
Supplementary Figure 9. Differential expression analysis in SqYC vs SqRT. (A) Erlenmeyer flask with yellow and red cells. (B) Volcano plot of DEG. (C) Venn diagram of DEG. (D). Heat map cluster analysis.
Supplementary Figure 10. Gene enrichment analysis. (A) Enrichment GO terms, up and down. (B) KEGG pathway enrichment, up-regulated genes. (C) KEGG pathway enrichment, down-regulated genes.
Supplementary Figure 11. In cell fluorescent detection of Stenocereus queretaroensis. PEG vs Sucrose 8%. (A) and (D) Bright field of culture cells. (B) and (E). 355nM channel signal (DAPI). (C) and (F) Auto florescent Stenocereus queretaroensis culture cells at 488 nM.
Supplementary Table 1. Total read and reads mapped.
Supplementary Table 2. Representative differential expressed genes in aromatic amino acid and betalain biosynthesis.
Alviter, Á. R. (2002). Cultivo de la Pitaya (Stenocereus sp): una Alternativa para el Trópico Seco del Estado de MICHOACÁN. Morelia: UACh, Centro Regional Universitario Centro Occidente.
Anders, S., and Huber, W. (2010). Differential expression analysis for sequence count data. Genome Biol. 11:R106. doi: 10.1186/gb-2010-11-10-r106
Ashburner, M., Ball, C. A., Blake, J. A., Botstein, D., Butler, H., Cherry, J. M., et al. (2000). Gene Ontology: tool for the unification of biology. Nat. Genetics 25, 25–29. doi: 10.1038/75556
Azeredo, H. M. C. (2009). Betalains: properties, sources, applications, and stability—a review. Int. J. Food Sci. Technol. 44, 2365–2376. x. doi: 10.1111/j.1365-2621.2007.01668.x
Bean, A., Sunnadeniya, R., Akhavan, N., Campbell, A., Brown, M., and Lloyd, A. (2018). Gain-of-function mutations in beet DODA2 identify key residues for betalain pigment evolution. New Phytol. 219, 287–296. doi: 10.1111/nph.15159
Bedewitz, M. A., Góngora-Castillo, E., Uebler, J. B., Gonzales-Vigil, E., Wiegert-Rininger, K. E., Childs, K. L., et al. (2014). A root-expressed L-phenylalanine:4-hydroxyphenylpyruvate aminotransferase is required for tropane alkaloid biosynthesis in Atropa belladonna. Plant Cell 26, 3745–3762. doi: 10.1105/tpc.114.130534
Bolger, A. M., Lohse, M., and Usadel, B. (2014). Trimmomatic: a flexible trimmer for illumina sequence data. Bioinformatics 30, 2114–2120. doi: 10.1093/bioinformatics/btu170
Cai, Y., Sun, M., and Corke, H. (2003). Antioxidant activity of betalains from plants of the amaranthaceae. J. Agric. Food Chem. 51, 2288–2294. doi: 10.1021/jf030045u
Choo, K. Y., Kho, C., Ong, Y. Y., Thoo, Y. Y., Lim, R. L. H., Tan, C. P., et al. (2018). Studies on the storage stability of fermented red dragon fruit (Hylocereus polyrhizus) drink. Food Sci. Biotechnol. 27, 1411–1417. doi: 10.1007/s10068-018-0367-4
Christinet, L., Burdet, F. X., Zaiko, M., Hinz, U., and Zrýd, J.-P. (2004). Characterization and functional identification of a novel plant 4,5-extradiol dioxygenase involved in betalain pigment biosynthesis in andlt;emandgt;portulaca grandifloraandlt;/emandgt. Plant Physiol. 134:265. doi: 10.1104/pp.103.031914
Davidson, N. M., and Oshlack, A. (2014). Corset: enabling differential gene expression analysis for de novo assembled transcriptomes. Genome Biol. 15, 410–410. doi: 10.1186/PREACCEPT-2088857056122054
de Oliveira, M. V. V., Jin, X., Chen, X., Griffith, D., Batchu, S., and Maeda, H. A. (2019). Imbalance of tyrosine by modulating TyrA arogenate dehydrogenases impacts the growth and development of Arabidopsis thaliana. Plant J. 97, 901–922. doi: 10.1111/tpj.14169
Elmaghrabi, A. M., Rogers, H. J., Francis, D., and Ochatt, S. J. (2017). PEG induces high expression of the cell cycle checkpoint gene WEE1 in embryogenic callus of Medicago truncatula: potential link between cell cycle checkpoint regulation and osmotic stress. Front. Plant Sci. 8:1479. doi: 10.3389/fpls.2017.01479
Esatbeyoglu, T., Wagner, A. E., Schini-Kerth, V. B., and Rimbach, G. (2015). Betanin—A food colorant with biological activity. Mol. Nutr. Food Res. 59, 36–47. doi: 10.1002/mnfr.201400484
Finn, R. D., Bateman, A., Clements, J., Coggill, P., Eberhardt, R. Y., Eddy, S. R., et al. (2014). Pfam: the protein families database. Nucleic Acids Res. 42(Database issue), D222–D230. doi: 10.1093/nar/gkt1223
Gandía-Herrero, F., Escribano, J., and García-Carmona, F. (2005). Betaxanthins as pigments responsible for visible fluorescence in flowers. Planta 222, 586–593. doi: 10.1007/s00425-005-0004-3
Gandía-Herrero, F., Escribano, J., and García-Carmona, F. (2016). Biological activities of plant pigments betalains. Crit. Rev. Food Sci. Nutr. 56, 937–945. doi: 10.1080/10408398.2012.740103
Gandía-Herrero, F., and García-Carmona, F. (2012). Characterization of recombinant Beta vulgaris 4,5-DOPA-extradiol-dioxygenase active in the biosynthesis of betalains. Planta 236, 91–100. doi: 10.1007/s00425-012-1593-2
Grabherr, M. G., Haas, B. J., Yassour, M., Levin, J. Z., Thompson, D. A., Amit, I., et al. (2011). Full-length transcriptome assembly from RNA-Seq data without a reference genome. Nat. Biotechnol. 29, 644–652. doi: 10.1038/nbt.1883
Guerrero-Rubio, M. A., Escribano, J., Gandía-Herrero, F., and Gand?a-Herrero, F. (2020). Light emission in betalains: from fluorescent flowers to biotechnological applications. Trends Plant Sci. 25, 159–175. doi: 10.1016/j.tplants.2019.11.001
Kanehisa, M., and Goto, S. (2000). KEGG: kyoto encyclopedia of genes and genomes. Nucleic Acids Res. 28, 27–30. doi: 10.1093/nar/28.1.27
Khan, M. I., and Giridhar, P. (2015). Plant betalains: chemistry and biochemistry. Phytochemistry 117, 267–295. doi: 10.1016/j.phytochem.2015.06.008
Langmead, B., and Salzberg, S. L. (2012). Fast gapped-read alignment with Bowtie 2. Nat. Methods 9, 357–359. doi: 10.1038/nmeth.1923
Li, B., and Dewey, C. N. (2011). RSEM: accurate transcript quantification from RNA-Seq data with or without a reference genome. BMC Bioinform. 12:323. doi: 10.1186/1471-2105-12-323
Liu, S., Zheng, X., Pan, J., Peng, L., Cheng, C., Wang, X., et al. (2019). RNA-sequencing analysis reveals betalains metabolism in the leaf of Amaranthus tricolor L. PLoS ONE 14:e0216001. doi: 10.1371/journal.pone.0216001
Liu, Y., Lin-Wang, K., Deng, C., Warran, B., Wang, L., Yu, B., et al. (2015). Comparative transcriptome analysis of white and purple potato to identify genes involved in anthocyanin biosynthesis. PLoS ONE 10:e0129148. doi: 10.1371/journal.pone.0129148
Lopez-Nieves, S., Yang, Y., Timoneda, A., Wang, M., Feng, T., Smith, S. A., et al. (2018). Relaxation of tyrosine pathway regulation underlies the evolution of betalain pigmentation in Caryophyllales. New Phytol. 217, 896–908. doi: 10.1111/nph.14822
Mao, X., Cai, T., Olyarchuk, J. G., and Wei, L. (2005). Automated genome annotation and pathway identification using the KEGG Orthology (KO) as a controlled vocabulary. Bioinformatics 21, 3787–3793. doi: 10.1093/bioinformatics/bti430
Miranda-Ham, M., López-Gómez, R., Castro-Concha, L., Chrispeels, A., Hernández, H., and Loyola-Vargas, V. (1999). Betalain production in cell line of Stenocereus queretaroensis (Cactaceae) from immature fruits. Phyton Int. J. Exp. Bot. 65, 27–33.
Murashige, T., and Skoog, F. (1962) A revised medium for rapid growth bioassays with tobacco tissue cultures. Physiol. Plant. 15, 473–497. doi: 10.1111/j.1399-3054.1962.tb08052.x
Polturak, G., and Aharoni, A. (2018). “La Vie en Rose”: biosynthesis, sources, and applications of betalain pigments. Mol. Plant 11, 7–22. doi: 10.1016/j.molp.2017.10.008
Polturak, G., Breitel, D., Grossman, N., Sarrion-Perdigones, A., Weithorn, E., Pliner, M., et al. (2016). Elucidation of the first committed step in betalain biosynthesis enables the heterologous engineering of betalain pigments in plants. New Phytol. 210, 269–283. doi: 10.1111/nph.13796
Polturak, G., Heinig, U., Grossman, N., Battat, M., Leshkowitz, D., Malitsky, S., et al. (2018). Transcriptome and metabolic profiling provides insights into betalain biosynthesis and evolution in mirabilis jalapa. Mol. Plant 11, 189–204. doi: 10.1016/j.molp.2017.12.002
Qingzhu, H., Chengjie, C., Zhe, C., Pengkun, C., Yuewen, M., Jingyu, W., et al. (2015). Transcriptomic analysis reveals key genes related to betalain biosynthesis in pulp coloration of hylocereus polyrhizus. Front. Plant Sci. 6:1179. doi: 10.3389/fpls.2015.01179
Robinson, M. D., and Oshlack, A. (2010). A scaling normalization method for differential expression analysis of RNA-seq data. Genome Biol. 11:R25. doi: 10.1186/gb-2010-11-3-r25
Ruiz, M. C. A., Barrios, E. P., Luna, C. N., López, A. A., Martínez, J. S., Rodríguez, L. J. A., et al. (2015). La pitaya silvestre (Stenocereus queretaroensis) Una Alternativa Alimenticia, Nutricional, Y Socioeconomica.
Sánchez Mejorada, R. (1984). Origen, Taxonomía y Distribución de las Pitayas en México. ITAO Oaxaca: Aprovechamiento del pitayo.
Schenck, C. A., Chen, S., Siehl, D. L., and Maeda, H. A. (2015). Non-plastidic, tyrosine-insensitive prephenate dehydrogenases from legumes. Nat. Chem. Biol. 11, 52–57. doi: 10.1038/nchembio.1693
Schenck, C. A., and Maeda, H. A. (2018). Tyrosine biosynthesis, metabolism, and catabolism in plants. Phytochemistry 149, 82–102. doi: 10.1016/j.phytochem.2018.02.003
Tatusov, R. L., Fedorova, N. D., Jackson, J. D., Jacobs, A. R., Kiryutin, B., Koonin, E. V., et al. (2003). The COG database: an updated version includes eukaryotes. BMC Bioinform. 4:41. doi: 10.1186/1471-2105-4-41
Tesoriere, L., Allegra, M., Butera, D., and Livrea, M. A. (2004). Absorption, excretion, and distribution of dietary antioxidant betalains in LDLs: potential health effects of betalains in humans. Am. J. Clin. Nutr. 80, 941–945. doi: 10.1093/ajcn/80.4.941
Trasande, L., Shaffer, R. M., and Sathyanarayana, S. (2018). Food additives and child health. Pediatrics 142:e20181410. doi: 10.1542/peds.2018-1410
Vasconsuelo, A., and Boland, R. (2007). Molecular aspects of the early stages of elicitation of secondary metabolites in plants. Plant Sci. 172, 861–875. doi: 10.1016/j.plantsci.2007.01.006
Wei, H., Chen, X., Zong, X., Shu, H., Gao, D., and Liu, Q. (2015). Comparative transcriptome analysis of genes involved in anthocyanin biosynthesis in the red and yellow fruits of sweet cherry (Prunus avium L.). PLoS ONE 10, e0121164–e0121164. doi: 10.1371/journal.pone.0121164
Xi, X., Zong, Y., Li, S., Cao, D., Sun, X., and Liu, B. (2019). Transcriptome analysis clarified genes involved in betalain biosynthesis in the fruit of red pitayas (Hylocereus costaricensis). Molecules 24:445. doi: 10.3390/molecules24030445
Xu, S., Huang, Q., Lin, C., Lin, L., Zhou, Q., Lin, F., et al. (2016). Transcriptome comparison reveals candidate genes responsible for the betalain-/anthocyanidin-production in bougainvilleas. Funct. Plant Biol. 43, 278–286. doi: 10.1071/FP15246
Yoo, H., Widhalm, J. R., Qian, Y., Maeda, H., Cooper, B. R., Jannasch, A. S., et al. (2013). An alternative pathway contributes to phenylalanine biosynthesis in plants via a cytosolic tyrosine: phenylpyruvate aminotransferase. Nat. Commun. 4:2833. doi: 10.1038/ncomms3833
Zhang, C., and Shi, S. (2018). Physiological and proteomic responses of contrasting alfalfa (Medicago sativa L.) varieties to PEG-induced osmotic stress. Front. Plant Sci. 9:242. doi: 10.3389/fpls.2018.00242
Zhao, D., Jiang, Y., Ning, C., Meng, J., Lin, S., Ding, W., et al. (2014). Transcriptome sequencing of a chimaera reveals coordinated expression of anthocyanin biosynthetic genes mediating yellow formation in herbaceous peony (Paeonia lactiflora Pall.). BMC Genomics 15:689. doi: 10.1186/1471-2164-15-689
Keywords: differential expression, betacyanins, betaxanthins, cyclo-DOPA, betalains
Citation: Morales J, Araujo-Sanchez J, Castro-Concha L, Ku A, Pereira-Santana A, Miranda-Ham MdL and Castaño E (2021) Defining Color Change in Pitaya: A Close Look at Betacyanin Synthesis Genes in Stenocereus queretaroensis. Front. Sustain. Food Syst. 5:698195. doi: 10.3389/fsufs.2021.698195
Received: 20 April 2021; Accepted: 19 July 2021;
Published: 25 August 2021.
Edited by:
Viji Sarojini, The University of Auckland, New ZealandReviewed by:
Guadalupe Virginia Nevárez-Moorillón, Autonomous University of Chihuahua, MexicoCopyright © 2021 Morales, Araujo-Sanchez, Castro-Concha, Ku, Pereira-Santana, Miranda-Ham and Castaño. This is an open-access article distributed under the terms of the Creative Commons Attribution License (CC BY). The use, distribution or reproduction in other forums is permitted, provided the original author(s) and the copyright owner(s) are credited and that the original publication in this journal is cited, in accordance with accepted academic practice. No use, distribution or reproduction is permitted which does not comply with these terms.
*Correspondence: Enrique Castaño, ZW5yaXF1ZWNAY2ljeS5teA==
Disclaimer: All claims expressed in this article are solely those of the authors and do not necessarily represent those of their affiliated organizations, or those of the publisher, the editors and the reviewers. Any product that may be evaluated in this article or claim that may be made by its manufacturer is not guaranteed or endorsed by the publisher.
Research integrity at Frontiers
Learn more about the work of our research integrity team to safeguard the quality of each article we publish.