 Vera Sokolov1,2*
 Jemaneh Habtewold2
 Andrew VanderZaag2
 Kari Dunfield3
 Edward Gregorich2
 Claudia Wagner-Riddle3Jason J. Venkiteswaran1Robert Gordon4
- 1Department of Geography and Environmental Studies, Wilfrid Laurier University, Waterloo, ON, Canada
- 2Agriculture and Agri-Food Canada, Ottawa, ON, Canada
- 3School of Environmental Science, University of Guelph, Guelph, ON, Canada
- 4School of the Environment, University of Windsor, Windsor, ON, Canada
Addition of sulfuric acid (H2SO4) to liquid dairy manure (slurry) reduces methane (CH4), nitrous oxide (N2O), and ammonia (NH3) emissions. There is interest in understanding how gaseous emissions respond to decreasing rates of acidification, to determine economically optimum application rates. Acidification rates were tested ranging from 0 to 2 g sulfuric acid (H2SO4) L−1 slurry in six meso-scale outdoor storage tanks, each filled with 10.6 m3 slurry and stored for 114 d. Results showed that the rate of acidification for maximum inhibition of CH4 and NH3 emissions varied markedly, whereas N2O reductions were modest. Reductions of CH4 increased with acid rate from 0 to 1.2 g L−1, with no additional response beyond >1.2 g L−1. In contrast to CH4, inhibitions of NH3 showed a linear response across all rates, although reductions were ≤ 30%. Thus, higher acidification rates would be required to achieve greater NH3 emission reductions. Our findings indicate that achieving >85% NH3 emissions reductions would require 4 × more acid than achieving >85% CH4 reductions. Decisions on optimum H2SO4 rates will depend on the need to mitigate CH4 emissions (the primary greenhouse gas emitted from stored liquid manure) or reduce NH3 emissions (which is regulated in some regions). These results will help develop guidelines related to the potential costs and benefits of reducing emissions through acidification.
Introduction
Storage of liquid manure is a potential hotspot for methane (CH4), nitrous oxide (N2O), and ammonia (NH3) emissions (Petersen, 2018). Current estimates suggest that 0.36 Gt CO2eq y−1 greenhouse gases (GHG) are emitted globally annually from manure storages (IPCC, 2014). Ammonia emissions have significant environmental implications and reduce the fertilizer value of the slurry, while methane and N2O are potent greenhouse gases (Amann et al., 2013; IPCC, 2013). Methane is the predominant GHG emitted and has a warming potential of 34 × that of CO2 over 100 years. Nitrous oxide, on the other hand, has lower emittance, but is a potent GHG with 298 × the warming potential of CO2 over 100 years. Owing to their significant impacts on environmental quality and climate change, CH4, N2O, and NH3 emission reductions from these point sources has been greatly studied (Hörnig et al., 1999; Smith et al., 2007; Montes et al., 2013; Petersen, 2018).
Acidification of slurry is gaining attention as an emission mitigation practice due to its low cost and relative efficiency for reducing multiple gases (Kavanagh et al., 2019). Reducing slurry pH by adding sulfuric acid (H2SO4) to stored dairy slurries has led to a range of CH4 and NH3 reduction efficiencies (Habtewold et al., 2018; Sokolov et al., 2019b, 2020). Sommer et al. (2017) reported 62 and 68% reductions in NH3 and CH4 emissions, respectively, with 0.27 g H2SO4 L−1 slurry (pH 5.2). Similarly, Petersen et al. (2012) reported reduction of 87% CH4 and 95% NH3 emissions, by reducing slurry pH from 7 to 4.5. Lastly, Misselbrook et al. (2016) reported up to 61 and 75% reductions in CH4 and NH3 emissions, respectively, for rates up to 6.9 g H2SO4 L−1 slurry. Our previous research (Habtewold et al., 2018; Sokolov et al., 2019b, 2020) had 84 and 90% CH4 reductions using 1.5–2.7 g L−1 H2SO4 (pH ~6). Although H2SO4-based acidification of dairy slurry is the most tried-and-true measure in reducing CH4 and NH3 emissions during slurry storage, the sensitivity of these emissions to different rates of H2SO4 addition and the optimal rate for reduction of emissions have not been evaluated.
Simultaneous reductions of GHG and NH3 emissions have significant environmental benefits, yet regulatory and policy considerations differ across countries. For instance, several European countries (e.g., Denmark) have established legislation for the reductions of GHGs and NH3 emissions (Jacobsen, 2015) whereas other countries, including Canada, have only GHG reduction targets. Therefore, it is desirable to further determine the optimal application rate to reduce the cost and volumes of acid required, depending on which gas(es) are the target for mitigation. To address these issues and successfully adapt manure acidification to full-scale systems, dose-response evaluation of acidification rates and the resulting reductions in CH4, N2O, and NH3 emissions, particularly on a larger scale, is desirable. Previous research has shown that reductions in CH4 emissions have greater sensitivity to H2SO4 addition than NH3 emissions (Habtewold et al., 2018; Sokolov et al., 2019b), and hence it may be possible to optimally reduce CH4 emissions at a lower rate of acid than NH3 emissions.
Materials and Methods
Experimental Site and Manure Acidification
This research was conducted from May 25 through September 15, 2019 using a meso-scale facility located at the Dalhousie University's Bio-Environmental Engineering Centre in Truro, NS, Canada (45°45′ N, 62°50′ W). Six concrete rectangular outdoor slurry tanks (l × w × h, 3.8 m × 1.73 m × 1.80 m), which were covered by flow-through steady-state chambers (Figure 1), were filled with dairy manure (10.6 m3 per tank). Details about the experimental site, storage tanks, and chambers were described by Wood et al. (2012). This experimental site has been used in the past to assess a range of dry matter content (Wood et al., 2012), manure types (Le Riche et al., 2017), residual manures (Wood et al., 2014; Sokolov et al., 2019a), and surface covers (VanderZaag et al., 2009, 2010).
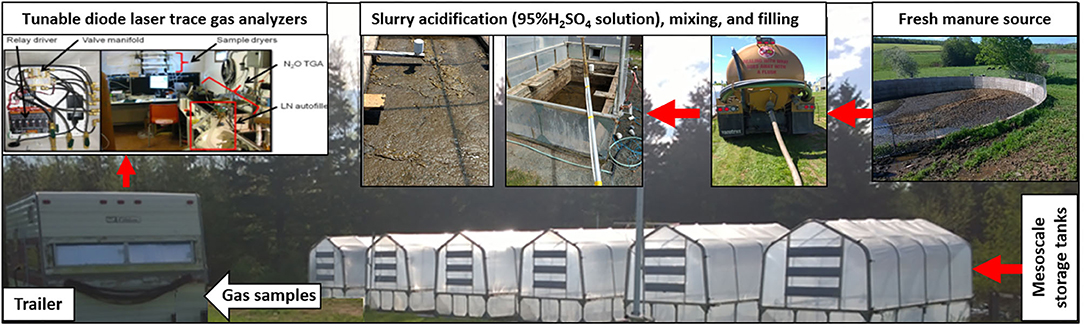
Figure 1. The mesoscale study site indicating manure source, storage tanks, and slurry acidification.
Manure was obtained from a manure storage from a local commercial dairy farm. To make sure the tanks received similar compositions of manure, each load of the fresh manure collected from the farm was equally distributed. The farm used sand bedding which can inflate the dry matter content of the manure. The fresh manure collected had a dry matter content of up to 23.5%. This was markedly higher than in previous research and caused a breakage of the pumping mechanism on the tankard used. The high dry matter was likely due to poor timing of manure collection with farm activities (tank emptying, manure addition, etc.). To avoid further issues and to simulate more typical liquid dairy manure storage conditions (i.e., dry matter content <10%) we diluted the manure using lake water prior to the start of monitoring. This may have changed the sand settling, although prior researched (Sokolov et al., 2019a) observed sand settling occurred rapidly, therefore it likely had a very minimal effect.
For acidification, we used different volumes of 95% H2SO4 solution (Bebbington Industries, Dartmouth, NS, Canada) resulting in H2SO4 addition rates of 0, 0.4, 0.8, 1.2, 1.6, or 2.0 g L−1. This experimental design was modified from Ngwabie et al. (2016). Instead of treatment replications this study focused on continuous sampling over a full season of monitoring at the meso-scale. Although the results cannot be directly applied to on-farm manure storages, the results will be important in comparison with previous meso-scale research and understanding the mechanism of H2SO4 reduction of GHG and ammonia production. In our previous studies, the addition of 1.6 or 2.7 g H2SO4 L−1 slurry reduced CH4 emissions by ≥85% but no significant difference was observed for the two rates (Habtewold et al., 2018; Sokolov et al., 2019b). Thus, our goal for this study was to test the effects of lower rates of H2SO4 addition (i.e., ≤ 2 g L−1) on emissions, given that the resulting pH does not seem to be a determining factor in CH4 reductions. The acid was pumped into the manure using a peristaltic pump with acid resistant tubing. The acid was simultaneously mixed into the manure for an even distribution. Gas sampling started immediately following acidification. Previous research (Sokolov et al., 2019b) observed that due to the large scale of the tanks, our mixing was not enough to fully homogenize the manure and pockets of more acidic manure were observed. Therefore, waiting ~2 weeks (June 10) prior to manure sampling allowed for the manure to fully homogenize.
Gas Measurements
During storage, air samples from the inlet (i.e., ambient air) and outlet of each tank's chamber were continuously collected through long polyethylene tubing connected to two tunable diode laser trace gas analyzers in an adjacent trailer (Figure 1). The gas analyzers measure the concentration of CH4 and N2O in gas subsamples every 30 s, while a CR5000 datalogger (Campbell Scientific Inc., Edmonton, AB, Canada) controls the air sampling system and records gas concentrations. Methane concentrations (μg m−3) were computed from the measured mixing ratios (i.e., relative abundance of gas components in the gas samples) using chamber air temperatures and atmospheric pressure (i.e., 101.3 kPa).
Gas fluxes (μg m−2 s−1) were calculated based on Wood et al. (2012):
where Cout and Cin are measured gas concentrations (μg m−3) from the outlet and inlet gas samples, respectively; SA is the surface area of the storage tank (m2); and Q is the airflow rate (m3 s−1).
Ammonia concentrations, measured periodically during the incubation (49 times during the 114 d of incubation), were measured with 24-h deployment intervals using gas washing technique as described by VanderZaag et al. (2010). Details about gas sampling and analysis for NH3 concentrations are provided by Sokolov et al. (2019b). Ammonia concentrations (μg m−3) were calculated as:
where CNH3, air (μg m−3) is the concentration of NH3-N in the air subsample, CNH3, aq is the aqueous NH3 concentration (μg m−3), Vl is the volume of the trapping solution (m3), and Vair is the volume of sample air that passed through the trap during the deployment (m3). The NH3 flux was then calculated using (Equation 1).
The indirect N2O emissions from volatilized NH3 were calculated by using the default emission factor (i.e., 0.01) suggested for manure management systems (Dong et al., 2006). The total GHG emitted (100 y global warming potential) from each tank was calculated after converting CH4 and N2O to carbon dioxide equivalents (CO2-eq) by multiplying emissions by 34 and 298, respectively (IPCC, 2013).
The methane conversion factor was calculated for each H2SO4 rate using the starting loss on ignition (LOI) (kg) and maximum potential CH4 production (Bo = 0.24 m3 CH4 kg−1 LOI) following the IPCC methods (Dong et al., 2006). Additionally, cumulative CH4 emissions for each rate were scaled by starting LOI, while N2O and NH3-N emissions were scaled by starting total nitrogen (TN) and total ammoniacal nitrogen (TAN).
Analysis of Manure Properties
Manure samples were taken at the trial start (May 25, 2019), as well as before (June 10, 2019), during (August 19, 2019), and after (November 2, 2019) peak CH4 fluxes. Samples were collected with a long sampling rod with a manually operated opening to avoid mixing between layers and samples were frozen until analysis. To reduce spatial variability in manure properties, a composite sample per tank was obtained after mixing samples from nine different locations (on coordinates of a grid) and depth profiles. Only one sample (2 ×1 L) was taken per tank in order to make scheduling easier and ensure timely alignment with CH4 flux emissions. Several manure properties including pH using an electrode (American Public Health Association method 4500-H+), dry matter (DM) and loss on ignition (LOI) (American Public Health Association method 2540 B), total carbon (TC), TN (combustion method AOAC 990.03-2002), ammonium-N (NH3-N) (American Public Health Association method 4500-NH3 B), and total phosphorous (TP) contents were determined at the Nova Scotia Department of Agriculture's Laboratory Services (Harlow Institute, NS, Canada) using standard methods (Clesceri et al., 1998).
Data Analysis
Unlike CH4 and N2O, NH3 emissions were measured periodically (46 measurements over 114 d). Therefore, interpolations were used to obtain a complete data set for the 114 d. Acidification-induced changes in manure characteristics and gaseous emissions were compared to the control (untreated) slurry. To assess how rates of acidification were numerically related to differences in manure characteristics (pH, LOI, and NH4-N) or reductions in emissions (CH4 and NH3), response-curves were plotted by applying a linear regression model. For changes in CH4 and total GHG emissions, the low rate (0–1.2 g L−1) and high rate (1.2–2.0 g L−1) were analyzed separately. This was done to highlight the difference in response between the low and high rates. Additionally, a higher rate from our previous research, 2.7 g L−1, for the same site and manure source (Habtewold et al., 2018; Sokolov et al., 2019b) was added to the regression analyses to extrapolate the regression and test its fit in the models. This made the high rate 1.2–2.7 g L−1, while the low rate stayed 0–1.2 g L−1. Regression analyses were performed using the function “lm” in R version 3.6.3 [(R Core Team, 2013). R: A language and environment for statistical computing. R Foundation for Statistical Computing, Vienna, Austria. URL https://www.R-project.org/]. In addition to the coefficient of determination (i.e., R2; explained/total variation of the model), residuals (i.e., differences between the observed and predicted reductions in CH4 or NH3 emissions) were assessed to the test whether the regression fits were good (Law and Jackson, 2017). When P <0.05, we considered the changes in the manure characteristics, CH4, or NH3 emissions have significant relations with changes in H2SO4 rates.
Results
Slurry Characteristics Vary With Acidification Rate
The pH of dairy slurry used for this research was 8.2. At the start of the experiment, addition of 0.4 or 0.8 g L−1 had no significant effect (P = 0.164; Figure 2) on slurry pH while the higher rates (i.e., ≥1.2 g L−1) reduced the slurry pH to 7.4. Although not significant, rates of H2SO4 addition and slurry pH had a negative relationship at all sampling periods throughout the trial (Figure 2).
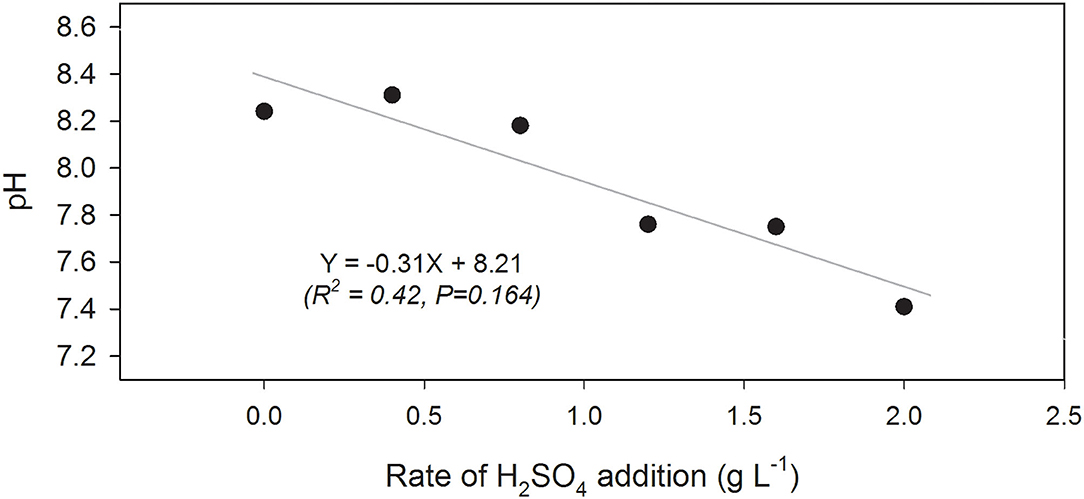
Figure 2. Linear regression of manure pH and rate of sulfuric acid (H2SO4) addition (g L−1) from beginning of trial (June 10).
There were no clear impacts of acidification on nutrient mineralization, as expressed by manure contents of DM, LOI, TN, TC, NH4-N, and TP (Table 1). Differences between treatments were minor over all sampling periods. However, there was a general trend in all tanks for DM, LOI, TN, and TC to decrease over time, especially early in the storage period (June 10–August 19, Table 1). This was expected as the early stage (i.e., lag phase) is typically characterized by rapid solids settling and higher rates of microbial hydrolysis and acidogenesis which supply substrates for more rapid gaseous production in the later stages.
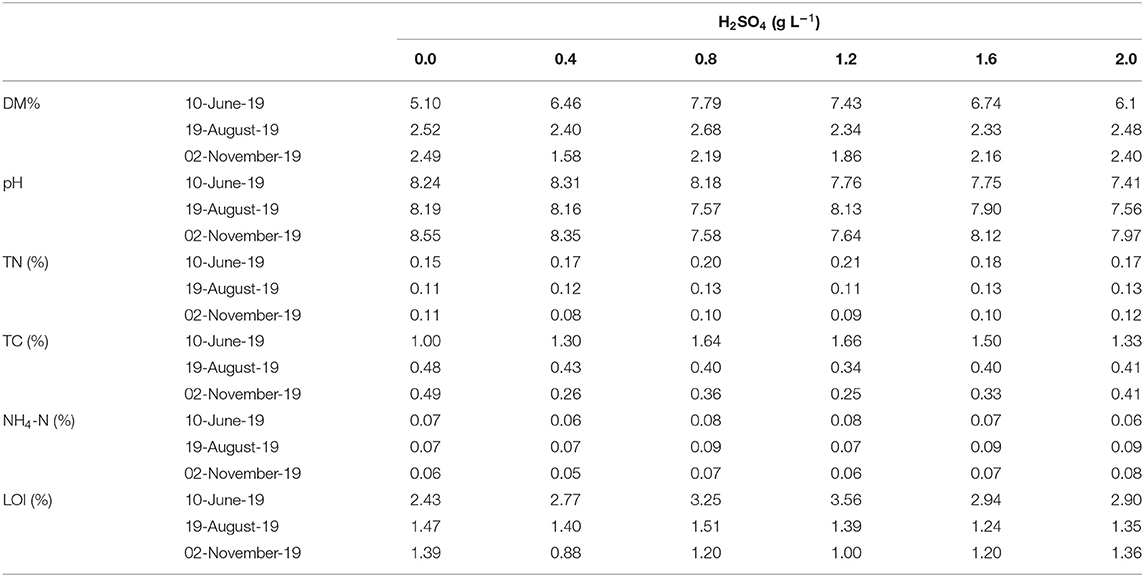
Table 1. Dry matter (DM, %), pH, total nitrogen (TN, %), total carbon (TC, %), ammonia-N (NH4-N, %), loss on ignition (LOI, %) of dairy slurries at the start of the trial (10 Jun), mid-trial (19 Aug), and end of the trial (02 Nov) in response to different rates of H2SO4 (g L−1 slurry) addition.
With few exceptions, slurry pH generally increased with storage time, which is consistent with our previous research and other studies (Table 1; Petersen et al., 2012; Wang et al., 2014; Regueiro et al., 2016; Sommer et al., 2017; Habtewold et al., 2018; Kavanagh et al., 2019). Microbial utilization of accumulated volatile fatty acids has often been used to explain gradual increases in slurry pH, although the process may be affected by H2SO4 through lower pH and/or toxicity.
Responses of Gaseous Emissions to H2SO4 Addition
Methane
The CH4 production followed a predictable trend, starting with a production lag (May 25–July 23), followed by a rapid increase peaking mid-summer (July 23–August 23), and ending with a slow decline till the end of the monitoring period (August 23–September 15). Unlike our previous research where daily CH4 flux started to increase after 35 d of storage (Habtewold et al., 2018; Sokolov et al., 2019b), the current storage had longer lag phase (~60 d) before the daily flux started to increase (Figure 3A). Daily CH4 emissions were highest (52–68 g m−2 d−1) between 78 d and 99 d (Figure 3A). The total CH4 production from the control was 2,688 g m−2 and 1,680 g m−3 during the 114-d storage period (Figure 3B; Table 2). This is slightly lower than observed by Sokolov et al. (2019b) where the daily flux reached 76 g m−2 d−1, resulting in slightly lower (13%) total emissions. As the manure source and study site were the same in these two studies, the longer lag phase and lower peak emission are likely related to the lower average starting LOI in the current study as a result of the dilution (3.0 and 9.7%) and other environmental factors. Wood et al. (2012) reported lower total CH4 emissions corresponding with increasing dilution. Additionally, air temperature was lower for more than 1 month in the current study compared to the previous trial (accessed from Environment and Climate Change Canada climate station, ID 8201380, Debert, NS, Canada, ~15 km from the research site). Likely both factors reduced the CH4 production, therefore it is unclear the extent to which either caused this reduction.
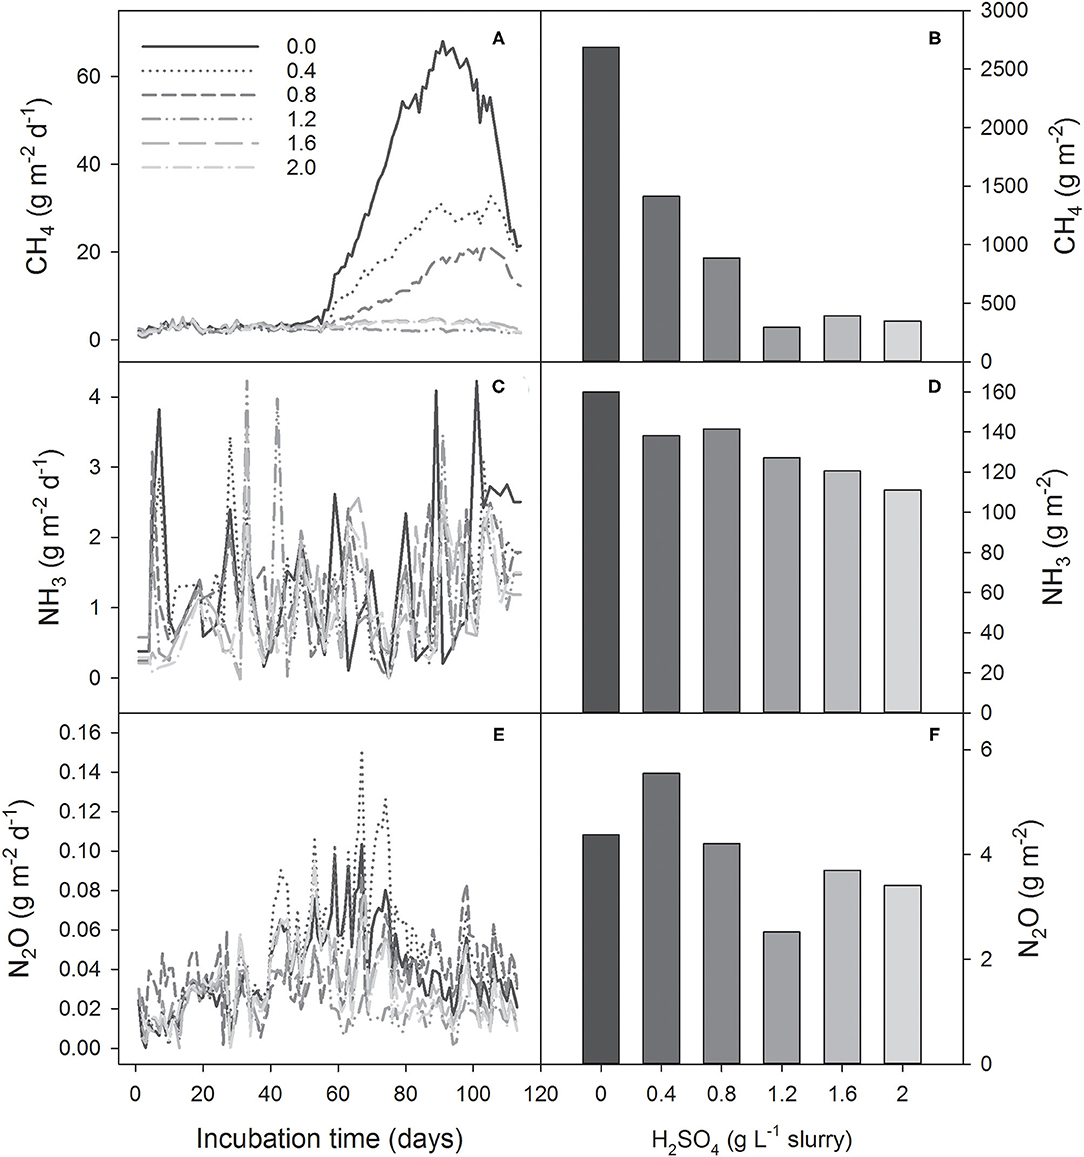
Figure 3. Gases emitted from acidified (0.4–2.0 g H2SO4 L−1 slurry) and control (untreated) dairy slurries, shown by daily flux of [(A) CH4, (C) NH3, (E) N2O] and total cumulative emissions [(B) CH4, (D) NH3, (F) N2O] for the entire storage period (114 d; May 25–September 15, 2019).
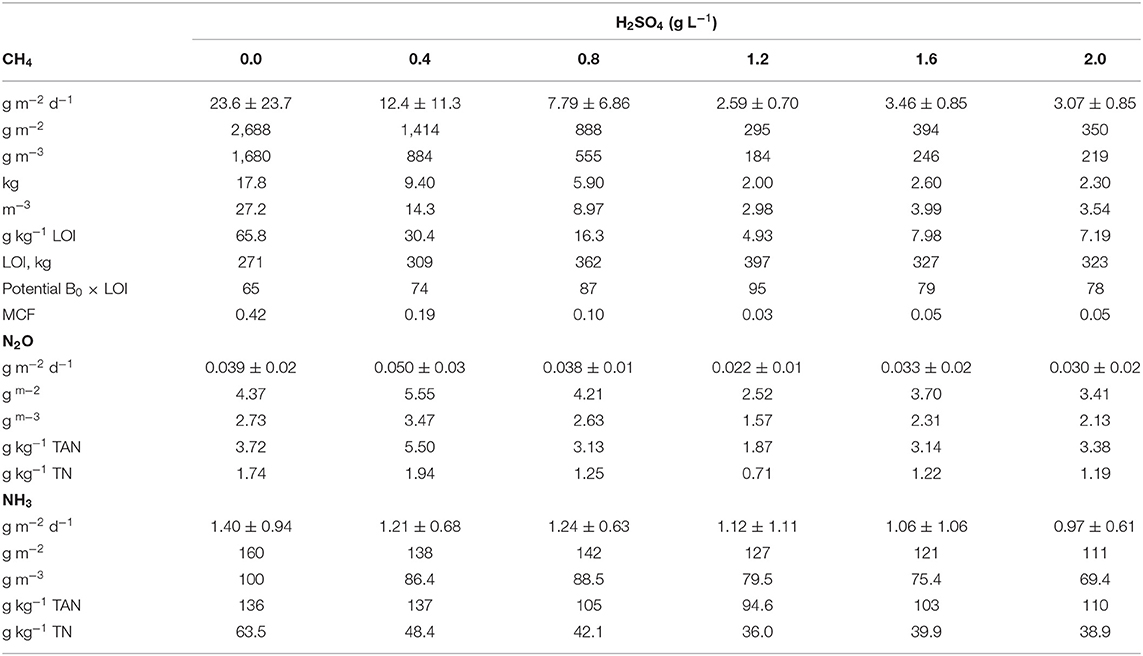
Table 2. Methane (CH4), nitrous oxide (N2O), and ammonia (NH3) emissions from stored dairy manure treatments from start of trial (June 10) to trial end (Nov 2) expressed as cumulative (g m−2 and g m−3) and mean daily (g m−2 d−1 ± SD) emissions, as well as scaled cumulative CH4 expressed as methane conversion factor (MCF) and scaled cumulative N2O and NH3 emissions by total nitrogen (TN, g kg TN−1) and total ammoniacal-nitrogen (TAN, g kg TAN−1).
Methane emissions decreased with acidification rate, although not with a simple linear trend. There was a marked difference in CH4 reductions in high rates of H2SO4 (1.2–2.0 g L−1) and low rates of H2SO4 (0.0–1.2 g L−1) (Figure 3B). With the high rates of acid (≥1.2 g L−1), the daily CH4 emissions were consistently ≤ 5 g m−2 d−1 throughout the storage period, which resulted in 85–89% reduction in total CH4 emissions (Figure 3B). This is in line with Sokolov et al. (2019b) where similar reductions were observed using 1.6 or 2.7 g L−1 (Habtewold et al., 2018; Sokolov et al., 2019b). By taking the control slurry as a reference, the relationship between changes in CH4, NH3, and total GHG (in CO2-eq) emissions and H2SO4 rates were analyzed using linear regression (Figures 4A–C). Rates of H2SO4 and changes in CH4 emissions showed a strong linear relationship for lower rates of 0–1.2 g L−1 (R2 = 0.95; P < 0.05; Figure 4A). At higher rates the linear regression line became nearly flat, showing that the CH4 emissions were not further reduced at rates of ≥1.2 g L−1 (R2 = 0.09; P > 0.05). This indicated that rates around 1.2 g L−1 were critical for effective CH4 emission reductions. Moreover, we observed a good fit of the response data for the higher rate in our previous study (Figure 4A).
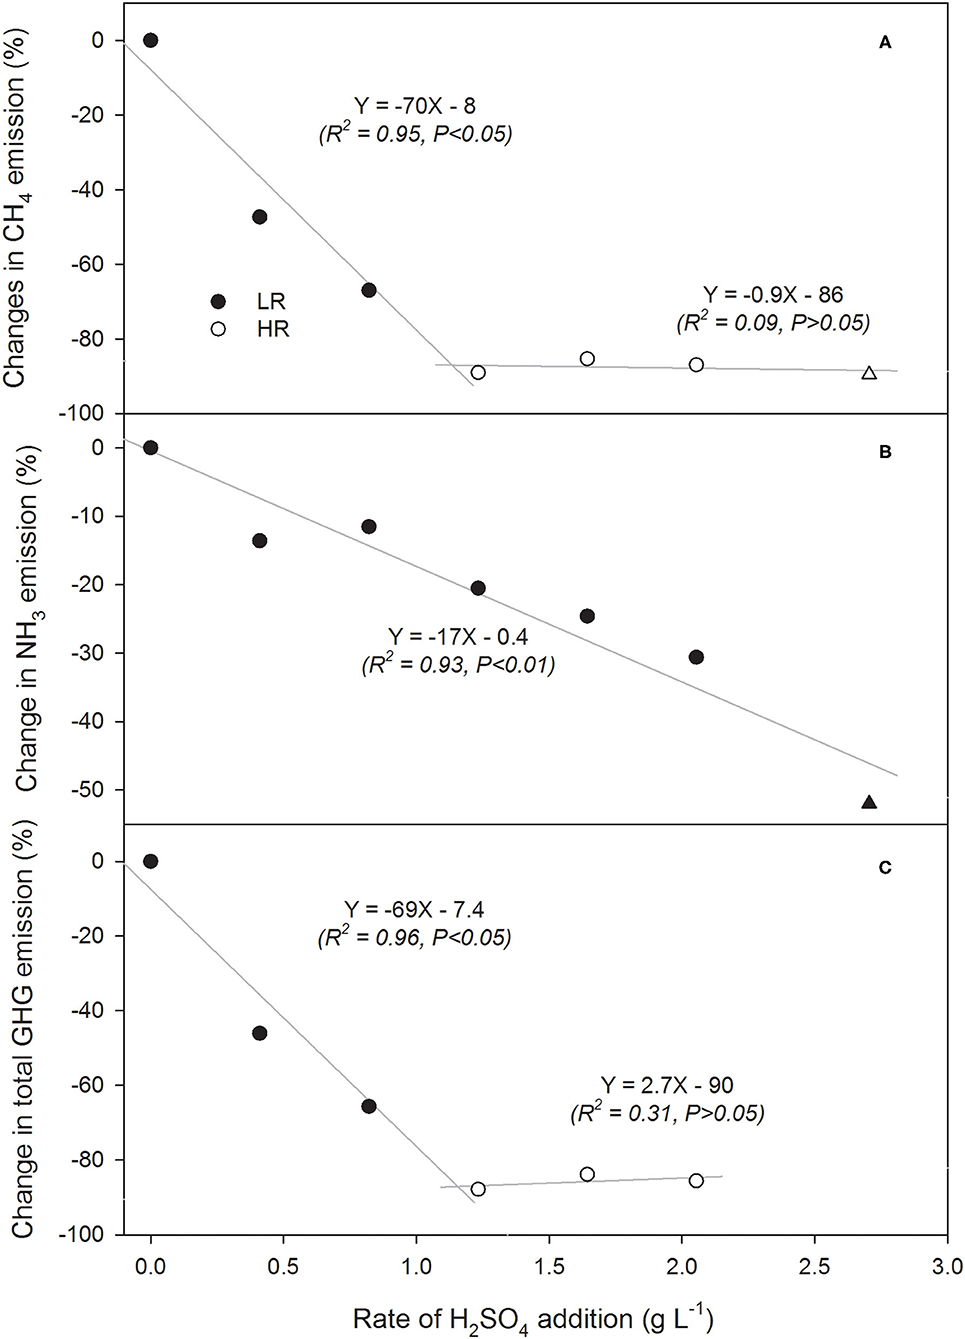
Figure 4. Regression curves showing the relationships between rates of H2SO4 addition to stored dairy slurries and the subsequent changes in (A) CH4, (B) NH3, and (C) total greenhouse gas emissions (CO2-eq). Low rate (LR) and high rate (HR) were separated in (A,C) to show the differing trends. Data from our previous study (Sokolov et al., 2019b) in (A,B) are denoted by Δ and ▴, respectively. Slopes in the equations indicate expected change (%) in emissions as H2SO4 rate increase with 1 g.
Nitrous Oxide
The effect of H2SO4 on N2O emissions was unclear. While daily N2O emissions peaked between 40 and 80 d (Figure 3E), with the 0.4 g L−1 rate having the highest daily emissions. Cumulative emissions had an unclear trend, with the lowest rate, 0.4 g L−1, having the highest total emissions (5.55 g m−2 and 3.47 g m−3) and the 1.2 g L−1 rate the lowest (2.52 g m−2 and 1.57 g m−3; Figure 3F, Table 2). Aside for the 0.4 g L−1 rate, all others had rates had lower total emissions than the control, with an average reduction of 21%. Regardless of the treatments, cumulative N2O emissions were low (<6 g m−2), representing <2% of the total CH4 emitted on a CO2-eq basis. This is in line with previous research by Sokolov et al. (2019a), who reported insignificant N2O emissions from stored liquid manure. Given the low emissions, N2O reductions are less important than CH4 and NH3. Therefore, it is more important result is that no increase in N2O was observed.
Ammonia
Ammonia emissions had an unclear trend over the storage period for all treatments (Figure 3C). Sporadic peaks were observed throughout the study period, likely related to factors other than time and temperature. The control produced the most total NH3 (160 g m−2 and 100 g m−3) and had the highest daily average emissions (1.40 ± 0.94 g m−2 d−1; Table 2). Unlike CH4 emissions, differences in daily NH3 losses between treatments were small throughout the storage period (Figure 3C). However, the effects of acidification were apparent on the cumulative emissions (Figure 3D). Increasing H2SO4 rate appeared to have a linear effect of reducing NH3 emissions (R2 = 0.93 and P < 0.01; Figure 4B). Over the entire storage period (114 d), untreated slurry and the slurry that received the highest acidification rate emitted 160 and 111 g NH3 m−2 (100 and 69.4 g NH3 m−3), respectively. This reduced overall NH3 emissions by 31% (Figure 3D). This is a significantly lower reduction than reported by others, where ≥75% reductions in NH3 emissions were demonstrated (Petersen et al., 2012; Misselbrook et al., 2016; Regueiro et al., 2016; Kavanagh et al., 2019; Sokolov et al., 2019b). These studies, however, likely used higher rates of acidification to reduce slurry pH to 4.5–6.5.
The relationship between changes in NH3 emissions and rates of H2SO4 were linear for all rates (Figure 4B). The response data for NH3 from the previous year was well-correlated with response data from this study (R2 = 0.93; P < 0.01). Moreover, the slope of the regression line (−17% g−1 L), indicated the average reduction (%) in NH3 emissions per gram of H2SO4 added. Data extrapolation indicated that ~5 g L−1 may be needed to achieve 85% NH3 reduction, which is markedly higher than the rate needed for 85% CH4 reduction (4 × more acid needed).
Total Greenhouse Gases
On a CO2-eq basis, CH4 accounted for 92 ± 4% of total GHGs, while direct and indirect N2O emissions accounted for 5 ± 2% and 3 ± 2%, respectively (Table 3). Acidification reduced total GHGs by 46–86%. Despite the inconsistent response of N2O emissions to H2SO4 rates, response curves of total GHG emissions (CO2-eq) and changes in emissions (%) vs. H2SO4 rates (Figure 4C) were similar with the observed CH4 responses. Thus, acidification of stored liquid dairy manure with H2SO4 appeared to have a stronger influence on the dominant CH4 than non-CH4 emissions.
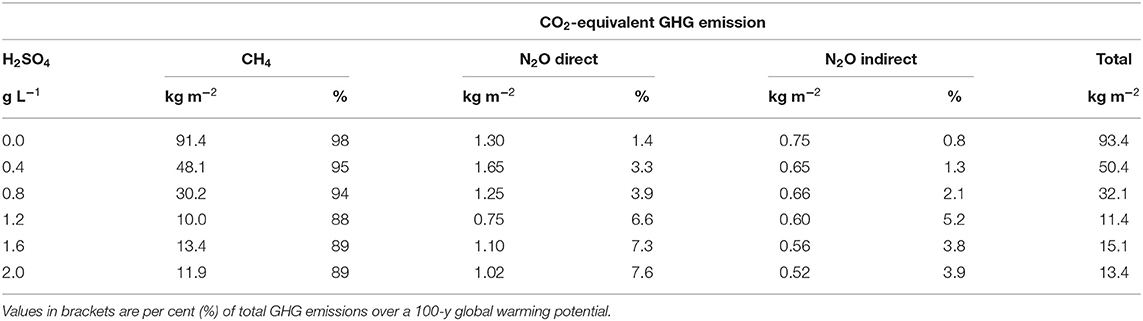
Table 3. Total greenhouse gas (GHG; kg CO2-eq m−2) emitted from stored liquid dairy slurry per rate of H2SO4 (g L−1 slurry) over the 114-d storage period (May 25–September 15, 2019).
Discussion
Acidification had a non-linear trend of reducing CH4 emissions and a linear trend for NH3 emissions. Reducing CH4 was cost-effective up to 1.2 g L−1 H2SO4. At higher acidification rates, the CH4 reduction become small, while the required quantity of H2SO4 continued to increase. This suggests that a low rate of acidification may be enough to make large GHG reductions from liquid dairy manure storages. The NH3, on the other hand, decreased linearly with acid addition. Therefore, adding more acid would have a corresponding NH3 reduction. The amount of acidification would, therefore, depend on the target emission and desired result.
Many European countries have regulated NH3 emissions (Giannakis et al., 2019), and manure acidification is an increasingly common reduction method. Denmark, for example, has adopted strict measures for manure acidification (Jacobsen, 2015). However, in the current study only 30% NH3 reductions were observed with the highest H2SO4 rate of 2 g L−1. This suggests that high rates of acidification may be needed for more marked NH3 emission reductions. In many countries there are no regulations for direct NH3 emissions. Instead, strict standards for reducing GHG emissions and the carbon footprint of animal agriculture are enforced. Our findings suggest that total GHG emissions can be reduced at lower rates (i.e., 1.2 g L−1) of acidification by focusing on CH4 reductions, which is the largest GHG produced. The lower acidification rates for effective reduction of GHG emission also indicate lower cost than previous estimates based on NH3 reduction. Moreover, decisions for cost-effective rates of acidification may depend on how the policy and regulatory context assigns the relative importance of these gases with respect to GHG emissions.
Conclusion
Methane was the dominant GHG from stored liquid dairy manure, contributing >88% of total GHGs (in CO2-eq m−2), whereas NH3 and N2O contributed <10 and <5%, respectively. Addition of H2SO4 is a common method to reduce CH4 and NH3 emissions from stored dairy slurry. However, studies that used different rates of H2SO4 acidification (often ≥1.5 g L−1 slurry) achieved comparable reductions. Using meso-scale storage tanks filled with 10.6 m3 of dairy slurry, we show that CH4 emissions can be effectively reduced at much lower rates of H2SO4 compared to NH3 emissions. A rate of 1.2 g L−1 was sufficient to reduce 89% CH4 emissions from dairy manure, however, this rate reduced total NH3 emissions only 20%. This was likely due to different mechanisms for CH4 and NH3 inhibitions. Data extrapolation indicated that ≥85% of the reductions in NH3 emissions may require up to 5 g L−1. Thus, our results suggest differences in the sensitivity of these gases to H2SO4 addition may challenge simultaneous inhibition using a single acidification rate. On the other hand, CH4 (the primary GHG from slurry) can be reduced at relatively low acidification rates, which is promising from a cost-benefit perspective.
Data Availability Statement
The raw data supporting the conclusions of this article will be made available by the authors, without undue reservation.
Author Contributions
VS was project lead. JH contributed to manuscript writing and data analysis. AV contributed intellectually and financially to overall project, and particularly for GHG emission aspects. KD contributed intellectually and financially to materials and supplies. EG contributed intellectually with manuscript editing and funding. CW-R contributed intellectually and with manuscript editing, and particularly with the GHG emissions aspects. JV contributed intellectually helping with statistical analysis and manuscript editing. RG was major funding holder for this project, contributed intellectually and financially, and particularly with the GHG emission aspects. All authors contributed to the article and approved the submitted version.
Funding
This research was supported by Agriculture and Agri-Food Canada (2495), Natural Sciences and Engineering Research Council, and Wilfrid Laurier University.
Conflict of Interest
The authors declare that the research was conducted in the absence of any commercial or financial relationships that could be construed as a potential conflict of interest.
References
Amann, M., Klimont, Z., and Wagner, F. (2013). Regional and global emissions of air pollutants: recent trends and future scenarios. Annu. Rev. Environ. Resour. 38, 31–55. doi: 10.1146/annurev-environ-052912-173303
Clesceri, L. S., Greenber, A. E., and Eaton, A. D. (1998). Standard Methods for the Examination of Water and Waste Water, 20th Edn. Washington, DC: American Public Health Association, American Water Works association, Water Environment Federation.
Dong, H., Mangino, J., McAllister, T. A., Hatfield, J. L., Johnson, D. E., Lassey, K. R., et al. (2006). “Chapter 10: Emissions from livestock and manure management,” in 2006 IPCC Guidelines for National Greenhouse Gas Inventories, (Geneva) 10.1–10.87.
Giannakis, E., Kushta, J., Bruggeman, A., and Lelieveld, J. (2019). Costs and benefits of agricultural ammonia emission abatement options for compliance with European air quality regulations. Environ. Sci. Eur. 31:93. doi: 10.1186/s12302-019-0275-0
Habtewold, J., Gordon, R., Sokolov, V. K., VanderZaag, A., Wagner-Riddle, C., and Dunfield, K. (2018). Targeting bacteria and methanogens to understand the role of residual slurry as an inoculant in stored liquid dairy manure. Appl. Environ. Microbiol. 84:e02830–17. doi: 10.1128/AEM.02830-17
Hörnig, G., Türk, M., and Wanka, U. (1999). Slurry covers to reduce ammonia emission and odour nuisance. J. Agric. Eng. Res. 73, 151–157. doi: 10.1006/jaer.1998.0402
IPCC (2013). Climate Change 2013: Chapter 8: Anthropogenic and Natural Radiative Forcing. Contribution of Working Groups I, II and III to the Fifth Assessment Report of the Intergovernmental Panel on Climate Change. Geneva: IPCC.
IPCC (2014). Climate Change 2014: Synthesis Report. Contribution of Working Groups I, II and III to the Fifth Assessment Report of the Intergovernmental Panel on Climate Change. Geneva: IPCC.
Jacobsen, B. H. (2015). “Why is acidification a success only in Denmark?,” in Manureresource Conference (Ghent: INEMAD).
Kavanagh, I., Burchill, W., Healy, M. G., Fenton, O., Krol, D. J., and Lanigan, G. J. (2019). Mitigation of ammonia and greenhouse gas emissions from stored cattle slurry using acidifiers and chemical amendments. J. Clean. Prod. 237:117822. doi: 10.1016/j.jclepro.2019.117822
Law, M., and Jackson, D. (2017). Residual plots for linear regression models with censored outcome data: a refined method for visualizing residual uncertainty. Commun. Stat. Simul. Comput. 46, 3159–3171. doi: 10.1080/03610918.2015.1076470
Le Riche, E. L., Vanderzaag, A., Wagner-Riddle, C., Dunfield, K. E., Sokolov, V. K., and Gordon, R. (2017). Do volatile solids from bedding materials increase greenhouse gas emissions for stored dairy manure? Can. J. Soil Sci. 97, 512–521. doi: 10.1139/CJSS-2016-0119
Misselbrook, T., Hunt, J., Perazzolo, F., and Provolo, G. (2016). Greenhouse gas and ammonia emissions from slurry storage: impacts of temperature and potential mitigation through covering (pig slurry) or acidification (cattle slurry). J. Environ. Qual. 45, 1520–1530. doi: 10.2134/jeq2015.12.0618
Montes, F., Meinen, R., Dell, C., Rotz, A., Hristov, A. N., Oh, J., et al. (2013). SPECIAL TOPICS — mitigation of methane and nitrous oxide emissions from animal operations: II. A review of manure management mitigation options1. J. Anim. Sci. 91, 5070–5094. doi: 10.2527/jas.2013-6584
Ngwabie, N. M., Gordon, R. J., VanderZaag, A., Dunfield, K., Sissoko, A., and Wagner-Riddle, C. (2016). The extent of manure removal from storages and its impact on gaseous emissions. J. Environ. Qual. 45, 2023–2029. doi: 10.2134/jeq2016.01.0004
Petersen, S. O. (2018). Greenhouse gas emissions from liquid dairy manure: prediction and mitigation. J. Dairy Sci. 101, 6642–6654. doi: 10.3168/jds.2017-13301
Petersen, S. O., Andersen, A. J., and Eriksen, J. (2012). Effects of cattle slurry acidification on ammonia and methane evolution during storage. J. Environ. Qual. 41:88. doi: 10.2134/jeq2011.0184
Regueiro, I., Coutinho, J., Gioelli, F., Balsari, P., Dinuccio, E., and Fangueiro, D. (2016). Acidification of raw and co-digested pig slurries with alum before mechanical separation reduces gaseous emission during storage of solid and liquid fractions. Agric. Ecosyst. Environ. 227, 42–51. doi: 10.1016/j.agee.2016.04.016
Smith, K., Cumby, T., Lapworth, J., Misselbrook, T., and Williams, A. (2007). Natural crusting of slurry storage as an abatement measure for ammonia emissions on dairy farms. Biosyst. Eng. 97, 464–471. doi: 10.1016/j.biosystemseng.2007.03.037
Sokolov, V. K., VanderZaag, A., Habtewold, J., Dunfield, K., Wagner-Riddle, C., Venkiteswaran, J., et al. (2019a). Greenhouse gas emissions from gradually-filled liquid dairy manure storages with different levels of inoculant. Nutr. Cycl. Agroecosyst. 115, 455–467. doi: 10.1007/s10705-019-10023-2
Sokolov, V. K., VanderZaag, A., Habtewold, J., Dunfield, K., Wagner-Riddle, C., Venkiteswaran, J. J., et al. (2019b). Greenhouse gas mitigation through dairy manure acidification. J. Environ. Qual. 48, 1435–1443. doi: 10.2134/jeq2018.10.0355
Sokolov, V. K., VanderZaag, A., Habtewold, J., Dunfield, K., Wagner-Riddle, C., Venkiteswaran, J. J., et al. (2020). Dairy manure acidification reduces CH4 emissions over short and long-term. Environ. Technol. 1–8. doi: 10.1080/09593330.2020.1714744
Sommer, S. G., Clough, T. J., Balaine, N., Hafner, S. D., and Cameron, K. C. (2017). Transformation of organic matter and the emissions of methane and ammonia during storage of liquid manure as affected by acidification. J. Environ. Qual. 46, 514–521. doi: 10.2134/jeq2016.10.0409
VanderZaag, A. C., Gordon, R. J., Jamieson, R. C., Burton, D. L., and Stratton, G. W. (2009). Gas emissions from straw covered liquid dairy manure during summer storage and autumn agitation. Trans. Asabe 52, 599–608. doi: 10.13031/2013.26832
VanderZaag, A. C., Gordon, R. J., Jamieson, R. C., Burton, D. L., and Stratton, G. W. (2010). Permeable synthetic covers for controlling emissions from liquid dairy manure. Appl. Eng. Agric. 26, 287–297. doi: 10.13031/2013.29544
Wang, K., Huang, D., Ying, H., and Luo, H. (2014). Effects of acidification during storage on emissions of methane, ammonia, and hydrogen sulfide from digested pig slurry. Biosyst. Eng. 122, 23–30. doi: 10.1016/j.biosystemseng.2014.03.002
Wood, J. D., Gordon, R. J., Wagner-Riddle, C., Dunfield, K. E., and Madani, A. (2012). Relationships between dairy slurry total solids, gas emissions, and surface crusts. J. Environ. Qual. 41:694. doi: 10.2134/jeq2011.0333
Keywords: manure acidification, methane, ammonia, manure management, greenhouse gases
Citation: Sokolov V, Habtewold J, VanderZaag A, Dunfield K, Gregorich E, Wagner-Riddle C, Venkiteswaran JJ and Gordon R (2021) Response Curves for Ammonia and Methane Emissions From Stored Liquid Manure Receiving Low Rates of Sulfuric Acid. Front. Sustain. Food Syst. 5:678992. doi: 10.3389/fsufs.2021.678992
Received: 10 March 2021; Accepted: 07 June 2021;
Published: 06 July 2021.
Edited by:
Bruno José Rodrigues Alves, Brazilian Agricultural Research Corporation (EMBRAPA), BrazilReviewed by:
Elio Dinuccio, University of Turin, ItalyMarta Andrea Alfaro, Instituto de Investigaciones Agropecuarias, Chile
Copyright © 2021 Sokolov, Habtewold, VanderZaag, Dunfield, Gregorich, Wagner-Riddle, Venkiteswaran and Gordon. This is an open-access article distributed under the terms of the Creative Commons Attribution License (CC BY). The use, distribution or reproduction in other forums is permitted, provided the original author(s) and the copyright owner(s) are credited and that the original publication in this journal is cited, in accordance with accepted academic practice. No use, distribution or reproduction is permitted which does not comply with these terms.
*Correspondence: Vera Sokolov, Ym9zYTQ0MDBAbXlsYXVyaWVyLmNh