- 1Center for Rural Economy, School of Natural and Environmental Sciences, Newcastle University, Newcastle upon Tyne, United Kingdom
- 2International Rice Research Institute, Los Baños, Philippines
We compare farm level efficiency rankings derived from non-spatial and a variety of spatial model specifications that account for unobserved heterogeneity in both the production and the efficiency sides of the stochastic frontier model in an empirical application on rice farming in the Philippines. We show how not accounting for unobserved spatial heterogeneity affects efficiency estimates and farm efficiency rankings. When not accounting for unobserved spatial heterogeneity efficiency, models show farms to be relatively more inefficient than they actually are (i.e., once unobserved spatial heterogeneity is incorporated in the models). More importantly from a policy perspective, the rankings of the farms in terms of efficiency are altered once unobserved spatial heterogeneity is incorporated in efficiency models. We recommend the use of unobserved effects in both production and efficiency within the stochastic frontier analysis framework to avoid making any misleading recommendations to farmers and policymakers.
Introduction
Agriculture in developing countries is challenged by a growing scarcity of resources, which imposes the need for efficient resource allocation to increase productivity. The Asian rice production sector is a particular example where decision for input allocation is critical in the midst of growing resource scarcity and the need for improving productivity to ensure food security. There is growing literature devoted to the analysis of farmers' technical efficiency in developing countries using a stochastic frontier analysis approach (Idiong, 2007; Balde et al., 2014; Quilty et al., 2014; Michler and Shively, 2015, etc.). However, most of the technical efficiency literature has ignored unobserved spatial heterogeneity. Neglecting unobserved spatial heterogeneity in technical efficiency analysis may lead to coefficients that are inefficient or biased (Anselin, 2001). In agriculture, unobserved spatial heterogeneity can arise from farmers emulating each other, level of infrastructure, or climatic and topographic conditions (Areal et al., 2012a). In some cases, spatial information can be incorporated into the analysis combining the use of different data sources including climatic and topographic maps and location of farms. For instance, Gadanakis and Areal (2020) show how incorporating rainfall and the length of the growing season in the technical efficiency analysis of cereal production matters. However, incorporating information on social interaction is more challenging. There are several reasons why farm and household level networks may influence technical efficiency. Farmers may emulate each other because they may receive the support of agricultural extension agents in farming communities. However, there is overwhelming evidence that farmers still rely on their social networks for information on input allocation, management practices, etc. (Case, 1992; Foster and Rosenzweig, 1996; Bandiera and Rasul, 2006; Langyintuo and Mekuria, 2008; Conley and Udry, 2010; Maertens and Barrett, 2012; Banerjee et al., 2013; Ward and Pede, 2014; Nakano et al., 2018). In this regard, farmers who belong to the same agro-ecological system and share a common resource pool depend on the regulations set within the resource pool for their farming management. For farmers in irrigated areas who share water within a water users' group, this kind of dependency may emerge more strongly among them as compared to the rainfed farmers who farm more independently. Lastly, farmers who belong to the same water users' group in irrigated areas may face similar institutional shocks and regulations. Notably, they may have formed similar social preferences through collective irrigation management (Ostrom, 2000; Tsusaka et al., 2015). In this manner, farm-level spatial dependency may arise though socio-economic, agro-climatic, or institutional similarities and could influence farmers' technical efficiency.
New developments in the field of spatial econometrics have made it possible to examine the spatial effects in the stochastic frontier analysis (SFA) (Areal et al., 2012a; Glass et al., 2013, 2014; Tsionas and Michaelides, 2015). While the effects of not incorporating spatial dependency in terms of inefficiency or the stochastic production frontier on SFA results have been shown (Carvalho, 2018; Pede et al., 2018; Tsukamoto, 2019) and a way to incorporate spatial correlation in both the noise and inefficiency terms has been developed by Orea and Álvarez (2019), there are no clear model specification strategies on where and how the spatial dependency should be modeled. Using an empirical application on rice farming survey data in the Philippines, we compare the distribution of farm level efficiency in four alternative models to illustrate what strategy could be used: (1) non-spatial model, (2) spatial model where the spatial dependency is only modeled in the output Y (SAR model), (3) spatial model where the spatial dependency is only modeled in the errors [as in Areal et al. (2012a) and Pede et al. (2018)], and (4) 2 and 3 combined (SARAR model) (Billé et al., 2018). Model 2 (SAR) captures latent influences associated with production (e.g., unobserved climatic conditions of the farm neighborhood and soil characteristics). Model 3 captures spatial effects associated with efficiency, and Model 4 (SARAR) separates these spatial dependencies into those associated with factors outside the control of the farmer (i.e., spatial dependencies between farm productions that are not production inputs) and those associated purely with management of the farm (managerial practices or sharing of information, for example). Results show the implications using each of the models on efficiency scores on management and policy recommendations.
Materials and Methods
We use panel data collected by the International Rice Research Institute (IRRI) during four consecutive rice seasons from 2009 to 2011 in the Bohol province in the Philippines from 496 rice farmers with farms within a relatively close distance (maximum distance between farms is approximately 13 km); 205 and 291 observations are from rainfed and irrigated ecosystems, respectively. A thorough description of the survey questionnaire is available in JICA (2012). Descriptive statistics of farms and household characteristics were presented in Tsusaka et al. (2015) and Pede et al. (2018). The short distance between farms allows capturing the effect of unobserved spatial heterogeneity, including small networks of relatively close farmers (i.e., spatial dependency associated with information sharing).
The SFA literature addressed the issue of unobserved heterogeneity through panel estimators (Kumbhakar and Lovell, 2000). We follow and expand a one-step Bayesian procedure described in Areal et al. (2012a) and applied by Pede et al. (2018) to estimate models 2–4. We expand Pede et al. (2018) by considering the SARAR model (model 4 below) and examining the impact of model selection on farm level efficiency rankings. We specify the non-spatial model as follows:
where yit is the production of farm i for i = 1,…,N at season t for t = 1,…,T; xit is the (1 × K) vector of inputs of production (seed –kg-, plot size –ha-, labor –man-days-, fertilizer –kg- and capital –PHP-)1 and its combinations for farm i at season t following a translog functional form for the production function (i.e., x is in logarithmic form); zit is a 1 × M vector of M non-stochastic environmental variables for farm i at season t that includes farmer's level of education, household size, household head being a female, and remittance; pit is a 1 × (T-1) vector for T-1 dummy variables accounting for seasons 2–4; β, θ, and ψ are unknown parameter vectors to be estimated; vit is a random error; and ui is the farm inefficiency, which is assumed to be constant across the seasons. Stacking all variables into matrices we can describe the following spatial extensions of Model 1.
where W is a spatial row normalized weight matrix with diagonal elements being zero, ensuring that all elements in the spatial weight matrix W are non-negative and efficiency estimates are in the unit interval (Kutlu, 2018; Kutlu et al., 2020a); γ and ρ are spatial coefficients, assumed to be between 0 and 1, and associated with production and efficiency, respectively; u and ũ are latent variables whose distributional form is unknown. Different weight matrix specifications can be used, and its selection is arbitrary (Areal et al., 2012a). We use a distance-based N × N weight matrix W with elements wij defined as:
where wii = 0 precludes direct prediction of Y; dij is the distance between farms i and j (in km); and s is the cut-off distance around a given observation over which other observations are likely to be dependent. Equation 5 represents this by showing an inverse relationship between the spatial weighted matrix value and distance between farms. The cut-off distance s indicates the point at which this negative relationship is decreasing relatively slowly. Since the cut-off point is unknown a priori, a number of different cut-off points varying from 100 to 1,000 m are used (Areal et al., 2012a; Pede et al., 2018). The distance between farms is the Euclidean distance calculated using the plot coordinates.
We used a translog functional form for the models estimated:
We imposed monotonicity and concavity at the mean of the data as well as inequality conditions required for inefficiency to be non-negative. A Bayesian approach was used to estimate models 1–4. For model 1 we assume a normal distribution with mean 0T and covariance matrix h−1IT where h is the inverse of the variance; xit are explanatory variables for individual i in period t; vit and vjt are independent of one another for i ≠ j; and ui and vjtare independent of one another for all i and j. The conditional likelihood function is proportional to a normal distribution:
where . We complement the conditional likelihood function with priors for , and u. We use an independent normal-gamma prior for the coefficients in the production frontier and the error precision (Koop, 2003). For the inefficiencies, we use an exponential prior distribution of . The prior for is assumed to be:
where r* is the median of the prior distribution. Model 2 differs from model 1 by adding Wy as an explanatory variable to the production function. The conditional likelihood function is proportional to a normal distribution:
with the prior for γ following a normal-gamma distribution. We follow the Bayesian approach used by Areal et al. (2012a) and Pede et al. (2018) to estimate Model 3. Model 4 is an extension of model 3 where we add Wy as an explanatory variable to the production function. The conditional posteriors are obtained from the joint posterior distribution that includes an indicator function I(ρ∈[0, 1]) where I(·) = 1 is ρ∈[0, 1] and I(·) = 0 otherwise. The conditional posterior for ũi in model 3 and 4 (making Wy part of x in the production side and γ part of the vector β, for simplification) is:
where and . As pointed out by Areal et al. (2012a), this is not a recognizable form and Metropolis-Hastings algorithm is used (Metropolis et al., 1953; Hastings, 1970). We refer interested readers to Areal et al. (2012a) and Pede et al. (2018) for further details on the Bayesian approach used.
Once farm level estimates for u are obtained, farm level efficiencies are usually calculated as exp(−ui). However, in SAR models efficiency estimates need to be corrected (Glass et al., 2016; Kutlu, 2018). There are two approaches to obtain the corrected farm efficiency levels that can be followed. Glass et al. (2016) proposed to calculate the corrected farm efficiency level as whereas Kutlu (2018) proposed , with the former, as pointed out by Kutlu (2018), potentially sensitive to outliers. Therefore, we use the approach proposed by Kutlu (2018) to calculate the corrected farm level efficiency levels.
Results
Figures 1–4 show the mean estimate for the spatial parameters γ and ρ for the different models analyzed, which capture unobserved spatial heterogeneity associated with production and efficiency respectively, at different cut-off distances between 100 m and 1,000 m. Results show a decrease in unobserved spatial heterogeneity associated with production, γ, and efficiency, ρ, respectively as the cut-off distance increases.
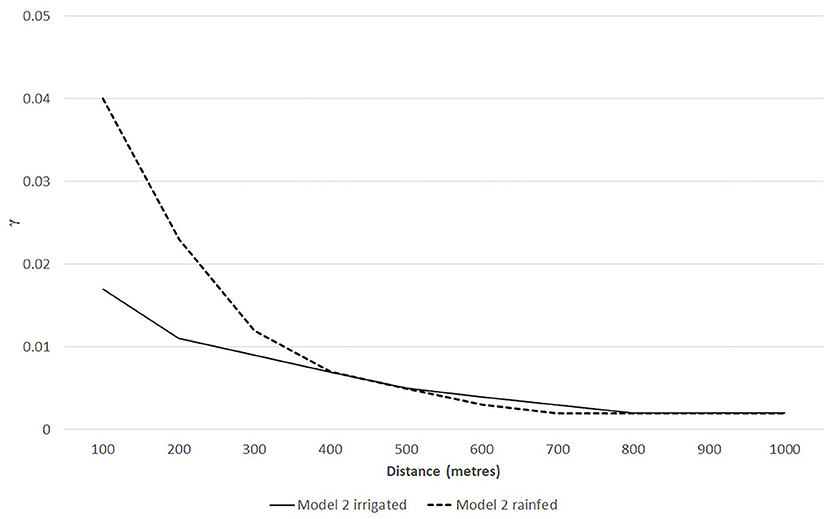
Figure 1. Spatial dependence at different cut-off distances for model 2 in irrigated farms and rainfed farms.
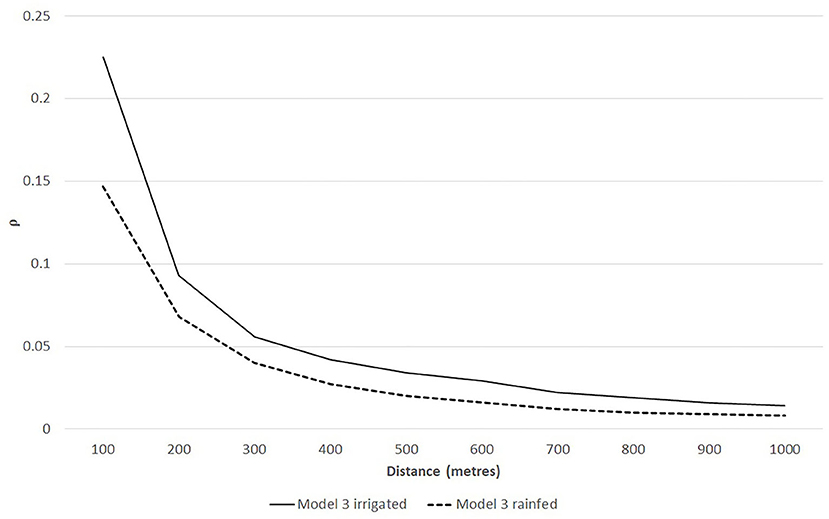
Figure 2. Spatial dependence at different cut-off distances for model 3 in irrigated farms and rainfed farms.
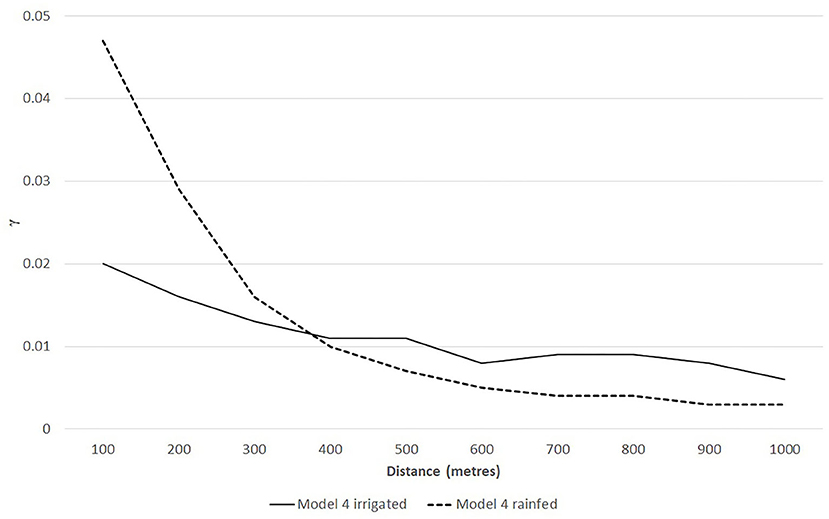
Figure 3. Spatial dependence in the output (γ) at different cut-off distances for model 4 in irrigated farms and rainfed farms.
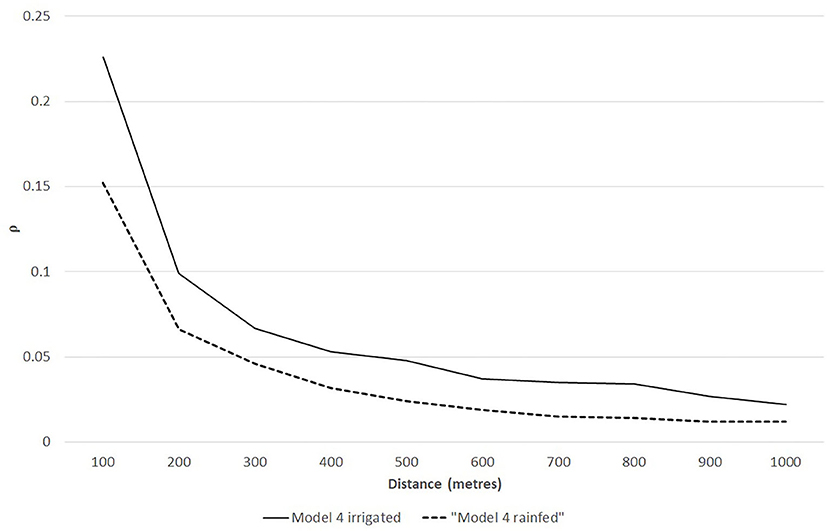
Figure 4. Spatial dependence in the output (ρ) at different cut-off distances for model 4 in irrigated farms and rainfed farms.
For Model 2, where the spatial dependency is only modeled in the output Y (SAR model), at 100 m the spatial dependence parameter associated with rice production γ is 0.017 and 0.040 for irrigated and rainfed farms, respectively (see Table 1 with results). Comparing the posterior conditional distributions for γ for rainfed and irrigated farms shows that the probability of spatial dependence parameter associated with rice production γ (100 m) being greater in rainfed than irrigated farms is 95%. The higher spatial dependency found in rainfed farms may be due to similar climatic characteristics at neighborhood levels being more important for rainfed farms in determining rice production than it is for irrigated farms. Hence, accounting for such unobserved heterogeneity is relatively more important in rainfed farms, although their absolute effect in production estimation may be small. We also found evidence of spatial homogeneity being present in the efficiency part of the stochastic frontier (e.g., neighboring farmers conducting similar management practices by sharing information), captured by ρ in model 3. This spatial dependency effect was found to be relatively higher in irrigated than rainfed farms. Comparing the posterior conditional distributions for γ (100 m) for rainfed and irrigated farms shows that the probability of spatial dependence parameter associated with rice production γ being greater in irrigated than rainfed farms is 92%. This is expected since irrigated farmers do work more closely than rainfed farmers do. Farmers in irrigated areas share water within a water users' group under similar institutional shocks and regulations, forming similar social preferences through collective irrigation management (see Ostrom, 2000; Tsusaka et al., 2015). This creates a relatively stronger spatial dependency for them than for rainfed farmers who farm more independently.
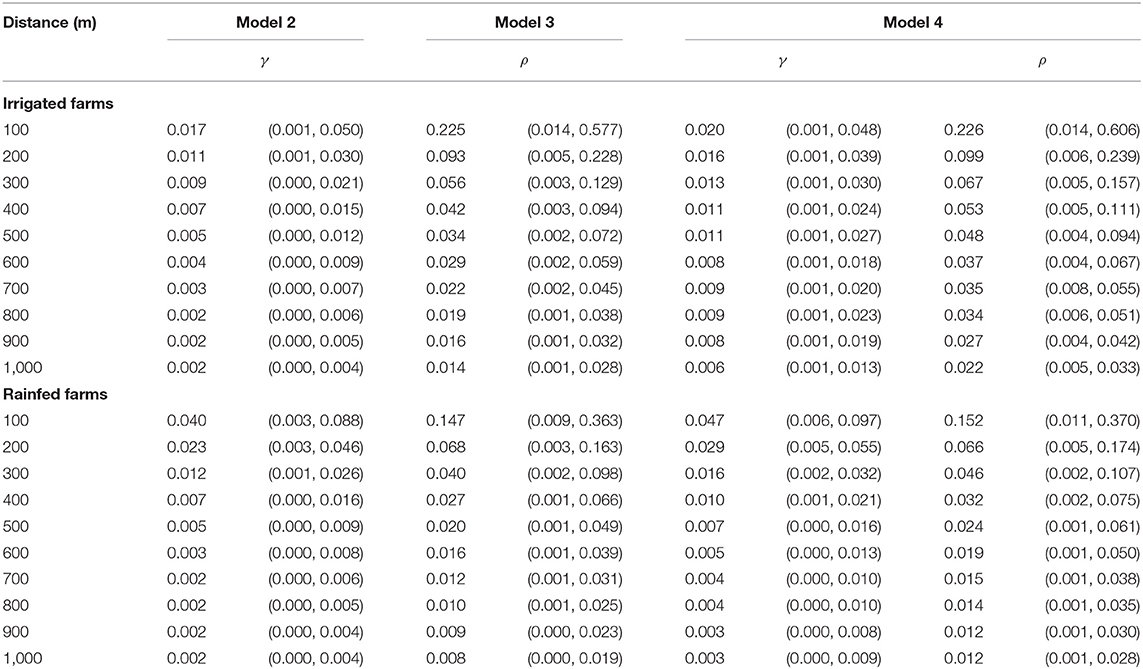
Table 1. Spatial dependence parameters at different cut-off distances for models 2, 3, and 4 in irrigated farms and rainfed farms.
Table 1 shows the results for the estimates for spatial parameters γ and ρ, which capture unobserved spatial heterogeneity associated with production and efficiency, respectively. Results comprise the mean of the coefficient and the 95% coverage posterior region in brackets. The interpretation of the Bayesian 95% coverage posterior (a, b) is that, according to our data and model, the parameter is between a and b with a 0.95 probability.
Figures 5, 6 show the technical efficiency distribution (Kernel density) for the non-spatial model and the spatial Model 2 at different distances for rainfed and irrigated farms, respectively. Modeling the spatial dependency in the output shifts the efficiency distribution of rainfed farms to the right, which indicates the presence of spatial homogeneity for rainfed farms at 100 m distance. However, accounting for spatial dependency in the output of irrigated farms does not significantly alter the farm efficiency distribution from the one obtained by the non-spatial model. Accounting for spatial dependency in irrigated rice production does not influence the efficiency results. This result is due to the spatial dependency found (i.e., unobserved spatial heterogeneity associated with rice production) being relatively small. The reason for it is that unobserved conditions that may affect irrigated rice production may not vary much within 100 m (also note that farms are located in a relatively close proximity with maximum distance between farms being 13 km).
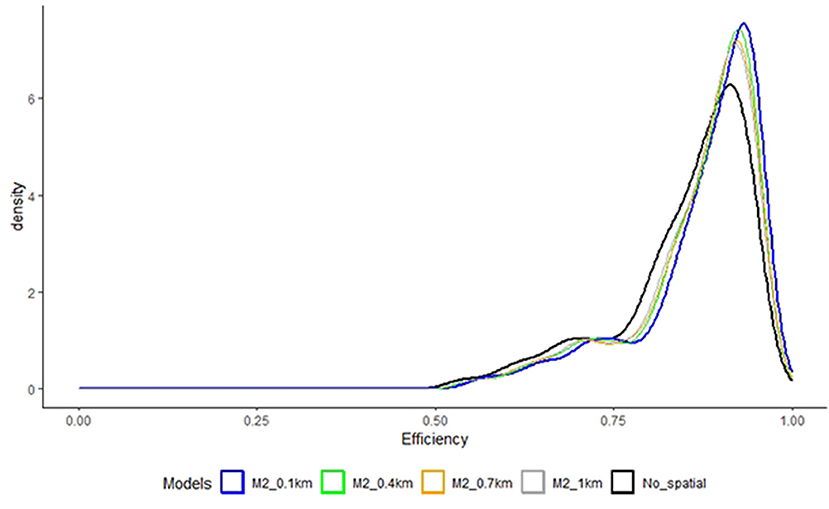
Figure 5. Model 2 vs. non spatial: Farm technical efficiency distribution for rainfed farms at different cut-off distances.
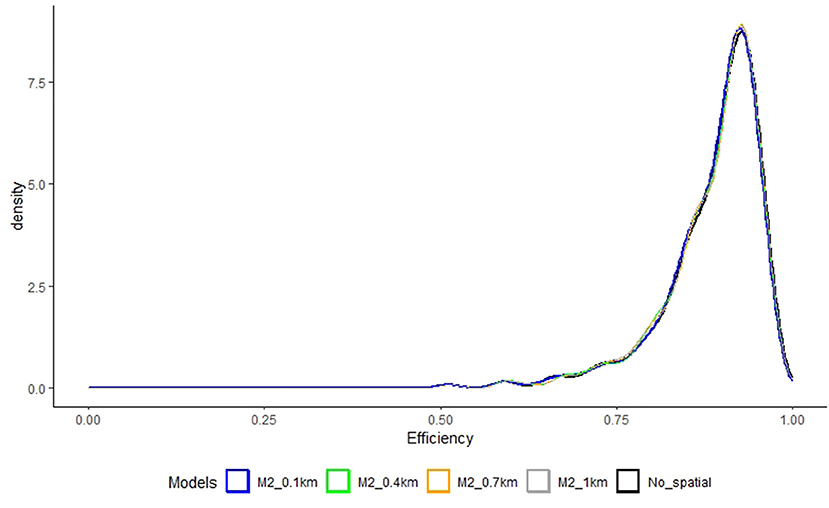
Figure 6. Model 2 vs. non spatial: Farm technical efficiency distribution for irrigated farms at different cut-off distances.
Figures 7, 8 show the farm technical efficiency distribution (Kernel density) for the non-spatial model and the spatial Model 3 for rainfed and irrigated farms at different cut-off distances from 100 to 1,000 m. The figures show results obtained from the non-spatial model and the spatial Model 3 that accounts for unobserved spatial heterogeneity associated with farm technical efficiency for rainfed and irrigated farms, respectively. Accounting for spatial dependency in the efficiency term shifts the efficiency distribution to the right, meaning that part of the inefficiency found in the non-spatial model is due to unobserved spatial homogeneity. In this case the estimated parameter capturing spatial homogeneity present, ρ, which may capture neighboring farmers sharing information about management practices, has a bigger incidence in the technical efficiency estimation than unobserved spatial heterogeneity associated with production, γ.
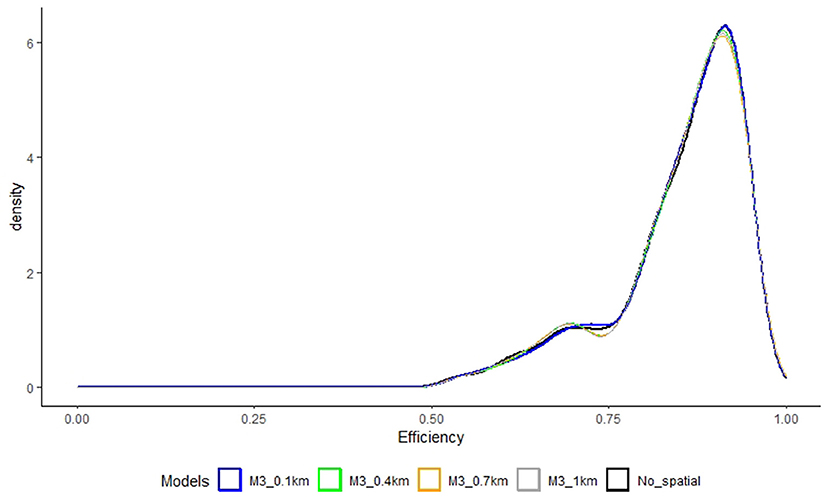
Figure 7. Model 3 vs. non spatial: Farm technical efficiency distribution for rainfed farms at different cut-off distances.
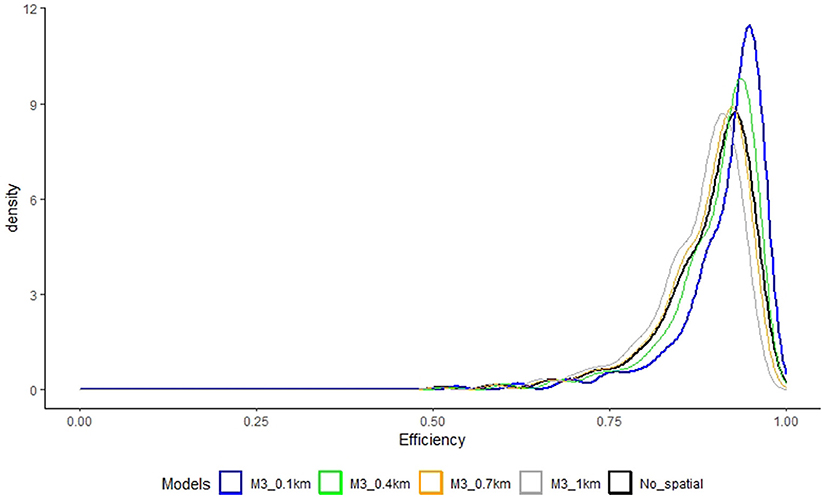
Figure 8. Model 3 vs. non spatial: Farm technical efficiency distribution for irrigated farms at different cut-off distances.
Figures 9, 10 show the farm technical efficiency distribution for rainfed and irrigated farms at different cut-off distances from 100 to 1,000 m for the non-spatial model and Model 4. The figures show that controlling for both unobserved factors affecting production (e.g., climatic and soil characteristics) and efficiency, such as managerial aspects (e.g., farmers sharing of information), also shift the technical efficiency distribution to the right. In this case, we obtain close but slightly higher estimates for both the spatial dependence parameter associated with rice production γ and spatial dependence parameter associated with rice production efficiency ρ than when using models 2 and 3 where these are estimated separately.
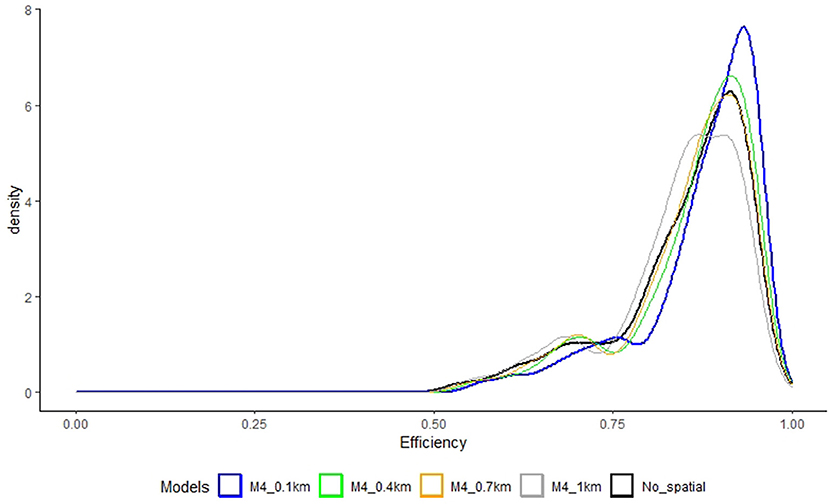
Figure 9. Model 4 vs. non spatial: Farm technical efficiency distribution for rainfed farms at different cut-off distances.
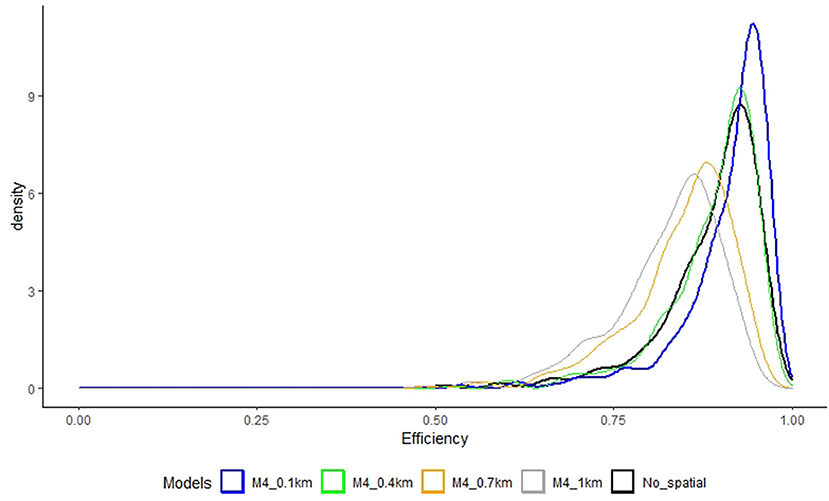
Figure 10. Model 4 vs. non spatial: Farm technical efficiency distribution for irrigated farms at different cut-off distances.
As pointed by Areal et al. (2012b) and Areal et al. (2018) it is important to investigate the differences in farms' rankings between the different models used. Once the functional form of the frontier has been altered (e.g., by incorporating previously omitted information such as spatial information) individual efficiency results may well change. Figures 11 and 12 show kernel densities for the change in rankings for the rainfed and irrigated farm models studied, respectively. We found that for rainfed farms the ranking of farms varies on average five positions when using Model 2 and 4 positions for Model 3 at 100 m cut-off distance, as opposed to Model 1 (non-spatial) with some farms ranking varying up to 60 ranking positions. Using Model 4 makes these ranking differences wider. The average variation in ranking is over 9 positions, with some farms varying up to 71 positions.
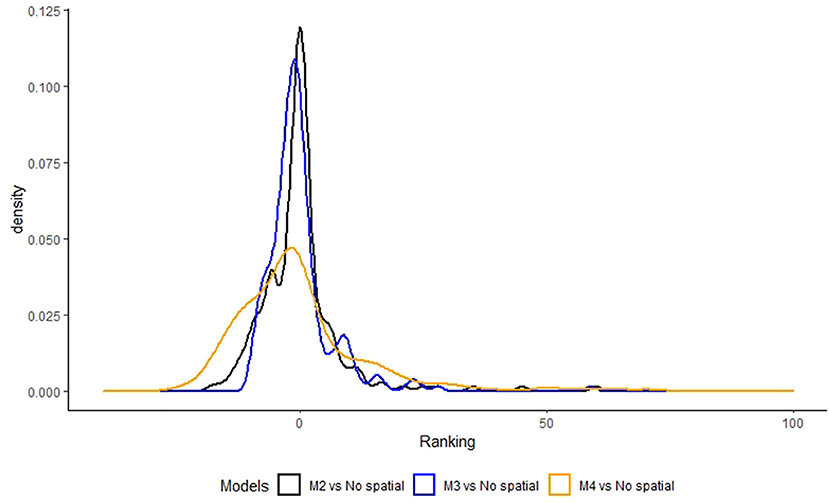
Figure 11. Technical efficiency ranking differences of models 2–4 compared to Model 1 for rainfed farms.
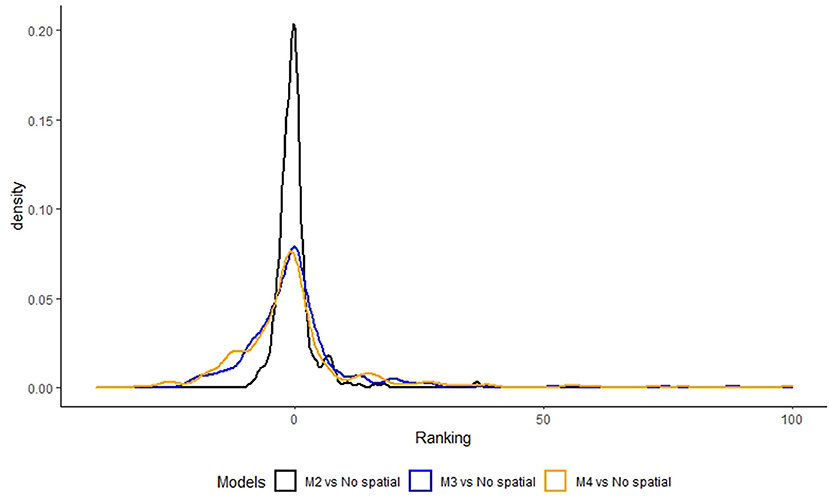
Figure 12. Technical efficiency ranking differences of models 2–4 compared to Model 1 for irrigated farms.
For irrigated farms we find that there is less variation in the changes in ranking of farms for Model 2 compared with rainfed farms but more variation for Model 3 and Model 4, with 25 farms changing more than 20 positions and one farm dropping 99 ranking positions under Model 4.
Discussion
Accounting for spatial dependency in SFA avoids biases associated with neglecting information on spatial unobserved heterogeneity. Importantly, spatial dependency may arise from both the production and the efficiency side of SF models; therefore, the use of flexible models which take both into account is recommended. Usually crucial information on climatic, topographic, soil, and social conditions are disregarded in efficiency analysis studies. Rarely is this information included in farm production surveys. Sometimes, relevant information such as climatic data can be collected from different data sources and combined with production information at the farm level using geographical information. However, some other information may be more difficult to obtain or be unavailable (e.g., information on whether information is shared between farmers). Hence, incorporating spatial dependency is especially important to control for any unobserved spatial heterogeneity that may be present.
We have shown the need for incorporating unobserved spatial heterogeneity into the production and efficiency side of stochastic frontier analysis. We have used these models to show a case were the researcher faces uncertainty about the model to use. Of course, a number of alternative models are possible depending on how much information there is about the nature of the spatial effects and how the spatial effects are specified. For instance, we could specify the spatial effects in a model in a way that captures neighbor externalities [a spatial lag of X model (SLX)], where the output is associated with the average of neighboring inputs. Another important issue worth pointing out is the choice of specification for the spatial weight matrix W, which defines the spatial relations between the farms. Spatial weight matrices can be categorized into three main groups: distance-based (as the one used here) spatial weight matrices, boundaries-based spatial weight matrices, and combined distance-boundaries-based spatial weight matrices. Since spatial relations are unknown, a priori research must make assumptions about them. These are often limited by the type of information on the geographical location of farms (e.g., coordinates, district, region). Importantly, as found by Areal et al. (2012a), the way in which the connectivity matrix is specified may have an impact on the levels of efficiency obtained and this needs to be acknowledged and/or tested (e.g., by using different specifications for the connectivity matrix).
We showed how neglecting unobserved spatial heterogeneity can have important effects on (a) how a sector can be categorized in terms of its level of efficiency and (b) how farms can be wrongly targeted for policy support. Regarding the effect on how a sector can be categorized in terms of its level of efficiency, not accounting for unobserved spatial heterogeneity efficiency may lead to wrongly concluding that farms are relatively more inefficient than they actually are. This may have broad implications if a particular sector (e.g., rice producers) is considered to be inefficient and therefore resources are allocated to it through policy action (e.g., financial support). Wrongly targeting farms for policy support is a consequence of the effect that not accounting for spatial unobserved effects may have on farm technical efficiency rankings. The fact that the ranking of farms varies once new relevant information is incorporated into the efficiency analysis is important from a policy perspective. For instance, this is relevant in cases where policymakers need to identify farms in need of support. Identification of farms in need of support using efficiency models that do not account for unobserved spatial heterogeneity (at least) may lead to targeting the wrong farms. We advocate for incorporating both spatial unobserved effects in production and efficiency in SFA to avoid any negative implications for efficiency analysis and any recommendation to farmers and policymakers derived from them.
It is worth pointing out that we have focused on the effects of neglecting unobserved spatial heterogeneity in SFA models, but other types of heterogeneity (non-spatially dependent) may be present and are also important to account for in SFA models. In this regard, SFA model extensions to account for unobserved heterogeneity, endogeneity, time-varying inefficiency, and time-invariant individual effects have been developed (Greene, 2005a,b; Wang and Ho, 2010; Kutlu and Tran, 2019; Kutlu et al., 2020b). Also, here we assumed inputs are exogenous variables in the SFA models and control for endogeneity derived from omitted/not available explanatory variables to capture spatially dependent latent influences. However, endogeneity may occur when there is non-spatially dependent correlation between the inputs and statistical noise or inefficiency. Recent literature about heterogeneity and endogeneity in SFA has developed other ways to account for these issues (Amsler et al., 2016; Lai and Kumbhakar, 2018; Kutlu and Tran, 2019).
Finally, taking into consideration the issues highlighted above, we advocate for future model developments focusing on integrating approaches to account for both unobserved spatial and non-spatial heterogeneity and endogeneity.
Data Availability Statement
The raw data supporting the conclusions of this article will be made available upon request to the International Rice Research Institute (IRRI).
Ethics Statement
The studies involving human participants were reviewed and approved by International Rice Research Institute. The patients/participants provided their written informed consent to participate in this study.
Author Contributions
FA and VP contributed to the data analysis and drafting the manuscript. All authors contributed to the article and approved the submitted version.
Funding
The financial support for the survey data collection was provided by the Japan International Cooperation Agency (JICA) and Japan International Research Center for Agricultural Science (JIRCAS). VP's time on this research was supported by the RICE CGIAR Research Program.
Conflict of Interest
The authors declare that the research was conducted in the absence of any commercial or financial relationships that could be construed as a potential conflict of interest.
Acknowledgments
Authors would like to thank the Japan International Cooperation Agency (JICA) and Japan International Research Center for Agricultural Science (JIRCAS) for their financial support of the survey data collection, Shigeki Yokoyama for co-managing the Bohol project in the Philippines, Takuji W. Tsusaka for assistance on the raw data, Modesto Membreve, Franklyn Fusingan, Cesar Niluag, Baby Descallar, and Felipa Danoso of the National Irrigation Administration for arranging the interviews with farmers, and Pie Moya, Lolit Garcia, Shiela Valencia, Elmer Sunaz, Edmund Mendez, Evangeline Austria, Ma. Indira Jose, Neale Paguirigan, Arnel Rala, and Cornelia Garcia for data collection. Pede's time on this research was supported by the RICE CGIAR Research Program.
Footnotes
1. ^The abbreviated units are defined as follow: kg, kilogram; ha, hectare; PHP, Philipino Peso; km, kilometer.
References
Amsler, C., Prokhorov, A., and Schmidt, P. (2016). Endogeneity in stochastic frontiers. J. Econ. 190, 280–288. doi: 10.1016/j.jeconom.2015.06.013
Anselin, L. (2001). Spatial effects in econometric practice in environmental and resource economics. Am. J. Agric. Econ. 83, 705–710. doi: 10.1111/0002-9092.00194
Areal, F. J., Balcombe, K., and Tiffin, R. (2012a). Integrating spatial dependence into stochastic frontier analysis. Aust. J. Agric. Resour. Econ. 56, 521–541. doi: 10.1111/j.1467-8489.2012.00597.x
Areal, F. J., Jones, P. J., Mortimer, S. R., and Wilson, P. (2018). Measuring sustainable intensification: combining composite indicators and efficiency analysis to account for positive externalities in cereal production. Land Use Policy. 75, 314–326. doi: 10.1016/j.landusepol.2018.04.001
Areal, F. J., Tiffin, R., and Balcombe, K. G. (2012b). Provision of environmental output within a multi-output distance function approach. Ecol. Econ. 78, 47–54. doi: 10.1016/j.ecolecon.2012.03.011
Balde, B. S., Kobayashi, H., Nohmi, M., Ishida, A., Esham, M., and Tolno, E. (2014). An analysis of technical efficiency of mangrove rice production in the guinean coastal area. J. Agric. Sci. 6, 179–196. doi: 10.5539/jas.v6n8p179
Bandiera, O., and Rasul, I. (2006). Social networks and technology adoption in Northern Mozambique. Econ. J. 116, 869–902. doi: 10.1111/j.1468-0297.2006.01115.x
Banerjee, A., Chandrasekhar, A. G., Duflo, E., and Jackson, M. O. (2013). The diffusion of microfinance. Science 341:1236498. doi: 10.1126/science.1236498
Billé, A. G., Salvioni, C., and Benedetti, R. (2018). Modelling spatial regimes in farms technologies. J. Product. Anal. 49, 173–185. doi: 10.1007/s11123-018-0529-7
Carvalho, A. (2018). Efficiency spillovers in Bayesian stochastic frontier models: application to electricity distribution in New Zealand. Spat. Econ. Anal. 13, 171–190. doi: 10.1080/17421772.2018.1444280
Case, A. (1992). Neighborhood influence and technological change. Reg. Sci. Urban Econ. 22, 491–508. doi: 10.1016/0166-0462(92)90041-X
Conley, T. G., and Udry, C. R. (2010). Learning about a new technology: pineapple in Ghana. Am. Econ. Rev. 100, 35–69. doi: 10.1257/aer.100.1.35
Foster, A. D., and Rosenzweig, M. R. (1996). Technical change and human-capital returns and investments: evidence from the green revolution. Am. Econ. Rev. 86, 931–953.
Gadanakis, Y., and Areal, F. J. (2020). Accounting for rainfall and the length of growing season in technical efficiency analysis. Oper. Res. 20, 2583–2608. doi: 10.1007/s12351-018-0429-7
Glass, A. J., Kenjegalieva, K., and Paez-Farrell, J. (2013). Productivity growth decomposition using a spatial autoregressive frontier model. Econ. Lett. 119, 291–295. doi: 10.1016/j.econlet.2013.03.002
Glass, A. J., Kenjegalieva, K., and Sickles, R. C. (2014). Estimating efficiency spillovers with state level evidence for manufacturing in the US. Econ. Lett. 123, 154–159. doi: 10.1016/j.econlet.2014.01.037
Glass, A. J., Kenjegalieva, K., and Sickles, R. C. (2016). A spatial autoregressive stochastic frontier model for panel data with asymmetric efficiency spillovers. J. Econom. 190, 289–300. doi: 10.1016/j.jeconom.2015.06.011
Greene, W. (2005a). Reconsidering heterogeneity in panel data estimators of the stochastic frontier model. J. Econ. 126, 269–303. doi: 10.1016/j.jeconom.2004.05.003
Greene, W. (2005b). Fixed and random effects in stochastic frontier models. J. Product. Anal. 23, 7–32. doi: 10.1007/s11123-004-8545-1
Hastings, W. K. (1970). Monte Carlo sampling methods using Markov chains and their applications. Biometrika 57, 97–109. doi: 10.2307/2334940
Idiong, I. C. (2007). Estimation of farm level technical efficiency in smallscale swamp rice production in cross river state of Nigeria : a stochastic frontier approach. World J. Agric. Sci. 3, 653–658.
JICA (2012). Impact evaluation of Bohol Irrigation Project (Phase2) in the Republic of the Philippines. Tokyo: Japan International Cooperation Agency.
Kumbhakar, S. C., and Lovell, C. A. K. (2000). Stochastic Frontier Analysis. Cambridge: Cambridge University Press. doi: 10.1017/CBO9781139174411
Kutlu, L. (2018). Estimating efficiency in a spatial autoregressive stochastic frontier model. Econ. Lett. 163, 155–157 doi: 10.1016/j.econlet.2017.12.025
Kutlu, L., and Tran, K. C. (2019). “Chapter 5 - Heterogeneity and endogeneity in panel stochastic frontier models.” in Panel Data Econometrics Tsionas, ed B. T. Mike (London: Academic Press), 131–146. doi: 10.1016/B978-0-12-814367-4.00005-8
Kutlu, L., Tran, K. C., and Tsionas, M. G. (2020a). A spatial stochastic frontier model with endogenous frontier and environmental variables. Eur. J. Oper. Res. 286, 389–399. doi: 10.1016/j.ejor.2020.03.020
Kutlu, L., Tran, K. C., and Tsionas, M. G. (2020b). Unknown latent structure and inefficiency in panel stochastic frontier models. J. Product. Anal. 54, 75–86 doi: 10.1007/s11123-020-00584-8
Lai, H., and Kumbhakar, S. C. (2018). Endogeneity in panel data stochastic frontier model with determinants of persistent and transient inefficiency. Econ. Lett. 162, 5–9. doi: 10.1016/j.econlet.2017.10.003
Langyintuo, A. S., and Mekuria, M. (2008). Assessing the influence of neighborhood effects on the adoption of improved agricultural technologies in developing agriculture. Afr. J. Agric. Resour. Econ. 2, 151–169.
Maertens, A., and Barrett, C. B. (2012). Measuring social networks' effects on agricultural technology adoption. Am. J. Agric. Econ. 95, 353–359. doi: 10.1093/ajae/aas049
Metropolis, N., Rosenbluth, A. W., Rosenbluth, M. N., Teller, A., and Teller, E. (1953). Equation of state calculations by fast computing machines. J. Chem. Phys. 21, 1087–1092. doi: 10.1063/1.1699114
Michler, J. D., and Shively, G. E. (2015). Land Tenure, Tenure Security and Farm Efficiency: Panel Evidence from the Philippines. J. Agric. Econ. 66, 155–169. doi: 10.1111/1477-9552.12082
Nakano, Y., Tsusaka, T. W., Aida, T., and Pede, V. O. (2018). Is farmer-to-farmer extension effective? The impact of training on technology adoption and rice farming productivity in Tanzania. World Dev. 105, 336–351. doi: 10.1016/j.worlddev.2017.12.013
Orea, L., and Álvarez, I. C. (2019). A new stochastic frontier model with cross-sectional effects in both noise and inefficiency terms. J. Econ. 213, 556–577. doi: 10.1016/j.jeconom.2019.07.004
Ostrom, E. (2000). Collective action and the evolution of social norms. J. Econ. Perspect. 14, 137–158. doi: 10.1257/jep.14.3.137
Pede, V. O., Areal, F. J., Singbo, A., Mckinley, J., and Kajisa, K. (2018). Spatial dependency and technical efficiency: an application of a Bayesian stochastic frontier model to irrigated and rainfed rice farmers in Bohol, Philippines. Agric. Econ. 49, 301–312. doi: 10.1111/agec.12417
Quilty, J. R., McKinley, J., Pede, V. O., Buresh, R. J., Correa, T. Q., and Sandro, J. M. (2014). Energy efficiency of rice production in farmers' fields and intensively cropped research fields in the Philippines. F. Crop. Res. 168, 8–18. doi: 10.1016/j.fcr.2014.08.001
Tsionas, E. G., and Michaelides, P. G. (2015). “A spatial stochastic frontier model with spillovers: evidence for Italian regions. Scottish J. Pol. Econ. 63, 243–257. doi: 10.1111/sjpe.12081
Tsukamoto, T. (2019). A spatial autoregressive stochastic frontier model for panel data incorporating a model of technical inefficiency. Jpn. World Econ. 50, 66–77. doi: 10.1016/j.japwor.2018.11.003
Tsusaka, T. W., Kajisa, K., Pede, V. O., and Aoyagi, K. (2015). Neighborhood effects and social behavior: the case of irrigated and rainfed farmers in Bohol, the Philippines. J. Econ. Behav. Organ. 118, 227–246. doi: 10.1016/j.jebo.2015.04.022
Wang, H. J., and Ho, C. W. (2010). Estimating fixed-effect panel stochastic frontier models by model transformation. J. Econ. 157, 286–296. doi: 10.1016/j.jeconom.2009.12.006
Keywords: spatial dependency, Bayesian approach, technical efficiency, rice farming, unobserved heterogeneity
Citation: Areal FJ and Pede VO (2021) Modeling Spatial Interaction in Stochastic Frontier Analysis. Front. Sustain. Food Syst. 5:673039. doi: 10.3389/fsufs.2021.673039
Received: 26 February 2021; Accepted: 19 April 2021;
Published: 04 June 2021.
Edited by:
Jun He, Yunnan University, ChinaReviewed by:
Levent Kutlu, The University of Texas Rio Grande Valley, United StatesKhandaker Md. Mostafizur Rahman, Bangladesh Agricultural University, Bangladesh
Copyright © 2021 Areal and Pede. This is an open-access article distributed under the terms of the Creative Commons Attribution License (CC BY). The use, distribution or reproduction in other forums is permitted, provided the original author(s) and the copyright owner(s) are credited and that the original publication in this journal is cited, in accordance with accepted academic practice. No use, distribution or reproduction is permitted which does not comply with these terms.
*Correspondence: Francisco J. Areal, ZnJhbmNpc2NvLmFyZWFsLWJvcnJlZ29AbmV3Y2FzdGxlLmFjLnVr
 Francisco J. Areal
 Valerien O. Pede