 Eirik Mikkelsen
 Magnus Stoud Myhre
 Roy Robertsen
 Ulf Winther2
- 1Nofima, Tromsø, Norway
- 2SINTEF Ocean, Trondheim, Norway
The sustainability of aquaculture is a complex issue that can be hard to assess and communicate. Communicating it to the general public is in many ways an even bigger challenge than communicating to experts on sustainability or aquaculture. The general public's perception of the status and challenges for sustainability is important for the development of the aquaculture industry and for society at large, through its roles both as consumers and electorate, and generally in providing or denying a “social license to operate” for the industry. This paper presents the process and challenges involved in choosing and quality assuring sustainability indicators for Norwegian aquaculture, covering environmental, economic, and social dimensions. It involved a team of researchers, a quality assurance group, IT developers and designers, a literature review, a national survey, and user-testing, all to establish criteria for selecting data and indicators and how to present them, and to do the actual production. The endpoint is a web-portal with indicators currently covering 22 themes, aimed at anyone interested in the sustainability of Norwegian fish farming. The portal does not conclude if or to what degree Norwegian fish farming is sustainable, as that would require making valuation and trade-offs among different sustainability objectives. Many indicators are automatically updated, and data are only from publicly available sources and produced by the authorities or research institutions. The portal is under continuous development, with new themes and indicators, and improving spatial and temporal resolution.
Introduction
Global aquaculture production has grown tremendously over the last 6–7 decades (FAO, 2020) and is affecting economic and social conditions and the environment in many places (Gephart et al., 2020). In Norway, the aquaculture business had gross value added of more than 40 billion NOK (4 billion €) in 2019, with a production of around 1.4 million tons (Fisheries Directorate, 2021). The export value was 74 billion NOK (7.4 billion €) in 2020 (NSC, 2021). The distribution of the economic benefits has however been a much debated issue the latter years (Hersoug et al., 2021). The industry also has a number of environmental challenges (Olaussen, 2018), in particular salmon lice from fish farms affecting wild salmon stocks (Overton et al., 2019), and which also creates significant costs and losses for the farmers (Iversen et al., 2020b).
In line with this, the issue of the sustainability of aquaculture has become increasingly prominent both in academia, politics and in media, both in Norway and globally. But sustainability is not a straight-forward concept to work with, for many reasons. It has no universally agreed definition beyond the broad concept in the Brundtland report (WCED, 1997), and many have tried to shape the content of the term to fit their purposes and objectives. Many aspects of sustainability, even if agreed upon, are difficult to measure, and in addition, sustainability is an integrated concept where the different aspects may impact each other, and be weighted differently over time, across geographies, and groups/individuals. Is it then at all possible to present indicators on the sustainability of industrial activities that are seen as undisputed facts and are relevant?
Is it also possible to choose and present indicators so that they inform the general public in a way that promotes a more knowledge-based public debate on the sustainability of aquaculture? The general public's knowledge and perceptions on sustainability of the aquaculture industry are important for the industry, but also the public policy and society at large. As consumers and as electorate for the politicians determining public policies, the general public is important for aquaculture's social license to operate (Kelly et al., 2017).
Aquaculture is a diverse activity, that can be in different water environments and locations, with various species, technologies, and industrial organizations, and then also with a big Specter of environmental risks and impacts, and economic and social consequences (FAO, 2020). Some sets of (potential) indicators aim to be rather generic and cover many different types of aquaculture and contexts (e.g., Valenti et al., 2018), while others target more narrow, like the set collected by Amundsen and Osmundsen (2018) based on eight certification schemes for salmon aquaculture.
In this paper we discuss the challenges involved in selecting, collating, and presenting data on the sustainability of aquaculture in Norway, which is mainly salmon and trout farming, and present our final criteria and indicators. Our process and findings should be interesting for those striving to choose, collect, and establish sustainability indicators, especially when presenting them for a non-specialist audience, and on aquaculture.
The research questions that have guided the work with the paper are: (1) Which themes and indicators are especially relevant for considering the sustainability of Norwegian fish farming? (2) What makes indicators and a web portal on the sustainability of aquaculture trustworthy? (3) What are important process elements and issues for establishing relevant and trustworthy indicators and a web portal on the sustainability of aquaculture? (4) What are good criteria for selecting such indicators?
The paper is organized as follows: The next section gives a background on sustainability indicators and their design, existing indicator-sets on the sustainability of aquaculture, and on aquaculture in Norway. The Methods section describes how we approached the process to make the content for and design of the web-portal. The Results section describes the resulting workflow, results of a survey to the general public, the concluding set of criteria for the indicators, and the actual set of indicators in the published version of the web portal. The Discussion and Conclusion section considers challenges and dilemmas in designing such a web portal, as well as future directions for the work with the portal.
Background
Sustainability and Indicators
Since sustainability was introduced as a term at the global high level by WCED (1997), it has become a widely used objective guiding the actions of both governments, industries, and consumers (Portney, 2015; UN, 2015), although also being contested and problematized (Aarset et al., 2020). Most common frameworks of sustainability identify three sustainability dimensions: economic, environmental, and social (e.g., Bracco et al., 2019; Eustachio et al., 2019). Many frameworks also include a governance dimension covering institutional sustainability. Sustainability is a complex phenomenon that is difficult to observe directly (FAO, 1999; UNDESA, 2007), and many indicator-sets and abstract indicators have been constructed to capture it (Singh et al., 2012). Such indicator-sets can contain many indicators, like those suggested for fisheries (FAO, 1999; Anderson et al., 2015) or for aquaculture (Valenti et al., 2018). Certification schemes for sustainable aquaculture can be seen as a type of abstract indicator, based on several indirect sub-indicators (Osmundsen et al., 2020a). It seems that the social dimension of sustainability has been the hardest to grasp (Vifell and Soneryd, 2012; Hicks et al., 2016; Alexander et al., 2020).
Indicators in general provide information on the status or development of a phenomenon, usually one that is difficult or impractical to observe directly (Bracco et al., 2019). Some indicators give precise information on the phenomenon in question, like an indicator light telling that the temperature in a freezer is above a chosen threshold. For more complex phenomena, an indicator may only be able to indicate the status or development. Indicators can be qualitative or quantitative, and they can indicate a change, a trend, or status (Bracco et al., 2019). For an indicator to be able to say something on status, reference values for the indicator must be defined. For sustainability indicators, both the choice of reference values for indicators and the selection of indicators per se are inherently normative and political choices (Levett, 1998).
Bracco et al. (2019) distinguishes between direct, indirect, and proxy indicators, depending on how precisely an indicator relates to the underlying phenomena of interest. Direct indicators can be used when the phenomenon of interest is rather straightforward. Indirect or proxy indicators are useful when the phenomenon is abstract and cannot be measured directly or it would require complex and resource demanding efforts to measure it well. An indirect indicator does not directly represent the actual phenomenon of interest, but other phenomena related to it. If the phenomenon is escaped salmon from salmon farming, the estimated number of escaped salmon may be adequate as an indicator. If the phenomenon is the quality of aquaculture governance, indirect, or abstract indicators is required. Often a set of indirect indicators is deemed necessary to sufficiently illuminate the actual phenomenon of interest. Abstract indicators are typically constructed from a set of indirect indicators, calculating weighted or unweighted averages or similar, and mathematically normalizing to end up with values for the abstract indicator between 0 and 1 or 0 and 100, like for example in the Ocean Health Index (Halpern et al., 2012).
Choosing which sustainability themes and indicators to present is to some extent a value-laden and political choice (Levett, 1998), even though science can provide guidance, not least on the relevance and validity of specific indicators for various themes. Issues and themes that are used in actual regulation will obviously be relevant. But also themes that come up in public discourses and political discussions must be considered, as well as indicators identified from scientific work. What is considered important and relevant themes will always be constant developing, driven by changes in production technology and industry structure, culture, demography, and general economic activities in society, and also in climate, biology, and ecology. Hence, a set of indicators must also evolve to remain relevant. Another aspect is the balance of indicators between the major sustainability dimensions. Major aquaculture sustainability certification schemes have many indicators for environmental aspects, while social and economic aspects are less covered (Osmundsen et al., 2020a, Alexander et al., 2020). Many sustainability themes are however connected across the main sustainability dimensions, so individual indicators can be relevant for several dimensions.
Given the variation and complexity of choosing and creating indicators, criteria to guide the selection of indicators have been proposed, including for sustainability indicators (e.g., FAO, 1999; UNDESA, 2007; Brown, 2009). Central general criteria for indicators include scientific validity, data availability, robustness, precision, practical feasibility, cost efficiency, ability to communicate information, understandable, acceptance by stakeholders, and relevance for policy priorities.
The selection of themes and indicators can benefit from the involvement of relevant stakeholders (FAO, 1999; Consensus, 2006; Brown, 2009). Their first-hand knowledge can help in achieving scientific validity, robustness and precision as well as general acceptance of indicators. The general public, which can be seen as people without or with limited statistical knowledge, can further contribute to assessing how understandable the indicators are and how they are communicated (Eurostat, 2017, p. 22) Given that aquaculture can be a contentious issue, where available information can shape decisions and affect stakeholders, having an expert-led process can contribute to the trustworthiness of information and assessments (Servaes et al., 2012).
The different types of indicators can have different purposes. Fundamentally, indicators allow for comparisons, either across geography, time, units (companies, activities, etc.), or with reference values. Direct indicators can lead to immediate action, especially if clear reference values have been defined. Indirect indicators will inform on different aspects of a phenomenon of interest and can thus help guide the selection and priority of actions. Abstract indicators can be used to qualify or rank actors and may thus guide the selection among a set of actors. This could be the authorities deciding who should get an aquaculture license or consumers deciding who to buy from. It can also motivate those that score poorly to do something about the situation. But unlike the direct and indirect indicators, the abstract indicators themselves cannot guide what to do if the indicator score is too low. For that, one needs to analyse the underlying data and indirect indicators.
When choosing reference values for indicators there are several principal options (UNAIDS, 2010). One option is to choose a historical situation, a baseline value, as the reference point. This will show historical development. Historical trends could also be used as reference, or some measure of stakeholders' expectations. Comparison with similar activities elsewhere and how they develop, or using expert opinions and research findings are other options. The challenge with assessing sustainability is that what is ultimately to be considered is not a historical development, but how the future will be (Stiglitz et al., 2010, p. 61). This is obviously difficult.
Many types of sustainability assessments are described in the literature (e.g., Singh et al., 2012). They can be said to be of four main types: (1) Dashboards of indicators, (2) Composite indices, (3) Footprints of resource use, and (4) “Sustainability-adjusted” measures of welfare and wealth (Stiglitz et al., 2010; GGKP, 2016; Bracco et al., 2019). Dashboards present sets of indicators that directly or indirectly relate to sustainability, without ranking or weighting them. Creating a broad set of indicators is a necessary first step in any analysis of sustainability, since sustainability is complex by nature and a list of potentially relevant variables must be established (Stiglitz et al., 2010, p. 63). The dashboard framework makes a broad assessment across all dimensions of sustainability possible. However, the link between the value of an indicators and sustainability may not always be clear (Stiglitz et al., 2010, p. 63), and it can be difficult to compare situations when individual indicators vary in amplitude and direction of change (Bracco et al., 2019).
Composite indices can help such comparisons, but weighting, aggregation, and normalization, which is required to go from several sustainability indicators to one, requires implicit value-judgements, and cannot always be scientific (Böhringer and Jochem, 2007; Bracco et al., 2019). If a clear outcome can be defined and measured, composite indicators can be calculated by scientific methods, but for sustainability this is difficult (Nardo et al., 2005). While the authors behind composite indices of sustainability often are very explicit on how the weighting is done, the normative foundations or implications are rarely justified or made explicit (Stiglitz et al., 2010, p. 65). Also, a difference in score on a composite index between two entities does not give information on why this has come about—rather, it is like an invitation to study the underlying components closely (Stiglitz et al., 2010, p. 65), thus returning to a dashboard of indicators. Both dashboards of indicators and composite indices on sustainability are criticized by Stiglitz et al. (2010) for lacking a well-defined notion of what sustainability means.
The “footprints”-approach to measure sustainability is about estimating the over-use, under-investment in, or pressure on resources (Stiglitz et al., 2010, p. 67). Such indicators tend to consider the use or flow of one or a few resources that affect stocks of resources that future generations' welfare will depend on, like the stock of greenhouse gases in the atmosphere. For broader footprint-estimates, one needs to find an appropriate metric and ways to aggregate, which gives the same sort of challenges as in making other composite sustainability indices (Stiglitz et al., 2010, p. 67). The conceptual link between the estimated footprint and sustainability is however usually clearer than with the two types of assessments explained above. The same goes for the fourth type of sustainability assessment; measures of GDP (gross domestic product) and wealth that try to systematically correct for elements that matter for sustainability and which are not included in standard GDP calculations (Stiglitz et al., 2010, p. 65). While footprints can be calculated for activities by individuals or industries, the adjusted GDP estimates typically estimate status for countries or even larger entities, and are thus less relevant for indicating the sustainability of aquaculture as an activity.
How should sustainability assessments aiming to inform a general public be different from when they are aimed at industry actors, authorities, researchers, or other experts? The Bellagio Sustainability Assessment and Measurement Principles (Bellagio STAMP) (Pintér et al., 2012) give some guidance for effective communication: One should use clear and plain language, present information in a fair and objective way that helps to build trust, use innovative visual tools and graphics to aid interpretation and tell a story, and make data available in as much detail as is reliable and practicable. That the presentation is considered to be without bias is seen as important for building trust, as is engagement early on with users of an assessment (Pintér et al., 2012).
Aquaculture and Sustainability Indicators
Aquaculture is a very diverse activity globally (Garlock et al., 2020), and its development will have impact on food nutrition, human well-being, and global environmental health (Gephart et al., 2020). Monitoring its development along all dimensions of sustainability will be crucial to understand and govern that development (Krause et al., 2015). Sustainability comparisons across the diversity of aquaculture technologies and species, geographical, political, and socio-economic contexts can be relevant and useful. There are even sustainability comparisons for animal protein providers across meat and fish (Coller FAIRR, 2020). Yet, it is obvious that sustainability assessments also need to be tailored to more specific situations and contexts to give information relevant for national and regional challenges.
There have been many attempts at making comprehensive indicator sets for the sustainability of aquaculture. A workshop in 2006 proposed 78 indicators on sustainability for aquaculture in Europe, across nine different themes (Consensus, 2006). Many indicators are included in various certification schemes for aquaculture. Osmundsen et al. (2020a) mapped the indicators of eight widely used certification schemes and found that they contained altogether 1,916 indicators, ranging from 52 to 468 indicators per certification scheme. They also found that environmental indicators dominated, and that other dimensions were poorly covered.
It is quite common that companies in a value chain demand that those they buy products or services from are certified according to specific certification schemes (Gutierrez and Thornton, 2014). For the consumers, the large number of certification schemes can be confusing (Gutierrez and Thornton, 2014). Despite this, certification schemes are quite commonly used. However, seafood consumers are not the only intended target group for the aquaculture industry's use of certification schemes. Persons living in the vicinity of aquaculture production may have concern about the environmental, economic, and social impacts of aquaculture, and some certification schemes target such aspects (Aas et al., 2019; Osmundsen et al., 2020a). This may be one way for the industry to strengthen their social license to operate (Kelly et al., 2017; Mather and Fanning, 2019; Sinner et al., 2020). Even though some social and socio-economic sustainability indicators have been proposed and exist, this is the sustainability dimension that seems to have the poorest coverage generally (FAO, 2009; Alexander et al., 2020; Krause et al., 2020). For doing trade-offs between different sustainability aspects, it could help if data on the different effects of aquaculture were comparable (Zheng et al., 2009), like economic data (Knowler, 2008), but such data seems to be largely missing (Mikkelsen et al., 2020). Some indicators are used directly in the authorities' management of aquaculture, for example in in Norway (Osmundsen et al., 2020b, NFD, 2015), but there is also clear criticism of authorities in some countries being too slow to incorporate indicators in management (Milewski and Smith, 2019). The relative fuzziness of the sustainability term has also led to what some authors call a power struggle between authorities and industry actors over how it should be interpreted and have operational consequences (Aarset et al., 2020).
As this paper mainly is about making sustainability indicators for Norwegian aquaculture, which again is dominated by salmon farming, a brief introduction of that is warranted. Since the start of the Norwegian salmon farming industry in the late 1960s, it has developed into a significant industry, where Norway is now the world's biggest exporter of farmed salmon, and companies originating from Norway are also major players in the other salmon-producing countries, including Chile, Scotland, and Canada (Hersoug et al., 2019). In Norway, there are around 1,000 localities for salmon farming along nearly the full length of the long Norwegian coast, of which around 60% have production at any given time. The industry provides jobs and income (Johansen et al., 2019), especially in rural areas (Johnsen et al., 2020) where decreasing employment and population numbers in general have been observed (Iversen et al., 2020a). The impacts of salmon farming have varied over the years, as have which impacts are in focus in the public debate, including environmental (Taranger et al., 2015; Olaussen, 2018), economic, and social impacts (Hersoug et al., 2021).
The dominating open net pen concept has proven economically very successful, but production costs have increased sharply the latter years, due to increased feed prices and costs for prevention, treatment, and mortality associated with pathogens including salmon lice (Iversen et al., 2020b). Consolidation of the industry and its ownership, as well as changes in production technology and subsequent changes in labor use have led to an increasingly skewed distribution of benefits from the industry between different municipalities with fish farms (Hersoug et al., 2021). This has led to challenges with the industry's social legitimacy (Hersoug et al., 2021).
The public management of aquaculture in Norway has emphasized different aspects of sustainability over the years, but even from the very first (temporary) Aquaculture Act of 1973 both environmental, economic, and social sustainability concerns were included. With the Aquaculture Act of 1991 the term sustainable development (“bærekraftig utvikling”) were explicitly put in its objective (§1), and has remained there through later revisions of the legislation (Mikkelsen et al., 2018). Regular monitoring and reporting are required regarding i.a. the parasitic salmon lice, diseases, biomass, and pollution situation below pens, and the authorities can force reduced or closed production or other restrictive measures due to environmental or social concern (Mikkelsen et al., 2018). New salmon farming licenses have been issued in rounds that have emphasized as diverse priorities as rural development, industrial development, ownership, fish health, the environment, and industry's willingness to pay for new capacity (Hersoug et al., 2019). A government white paper in 2015 launched the ambition to devise a system of “predictable and environmentally sustainable growth in Norwegian salmon and trout farming” (NFD, 2015). This ended in the so-called “traffic light system,” established in 2017; an assessment of the extra induced mortality on wild salmon and trout stocks due to salmon lice originating from the salmon farms dictate in which regions salmon production capacity can increase (green light), must be reduced (red light), or stays the same (orange light), and companies' willingness to pay for more production capacity decide which companies actually get any increased capacity (Hersoug et al., 2021). The problems with social legitimacy have also led the authorities to introduce two different taxation/redistribution schemes that shall ensure economic benefits for all municipalities and counties that have salmon farms (Hersoug et al., 2021).
Methodology
The process to establish the web-portal has to a large degree involved answering the same questions that are posed in this article, and thus that process largely constitutes the method to answer the questions. One important function has been to organize the input and involvement of different actors, experts, stakeholders, and the general public, with their competence and perspectives, into the considerations necessary to choose and present indicators so that relevance and trustworthiness are achieved. The overall process took several years, and went through a pre-project, phase one of the main project, and is now (March, 2021) in phase two of the main project. Table 1 gives an overview of the individual projects and major elements in them. The projects have been financed and owned by the Norwegian Seafood Research Fund (FHF). This section also specifically presents a survey to the general public and the method for theme and indicator selection.
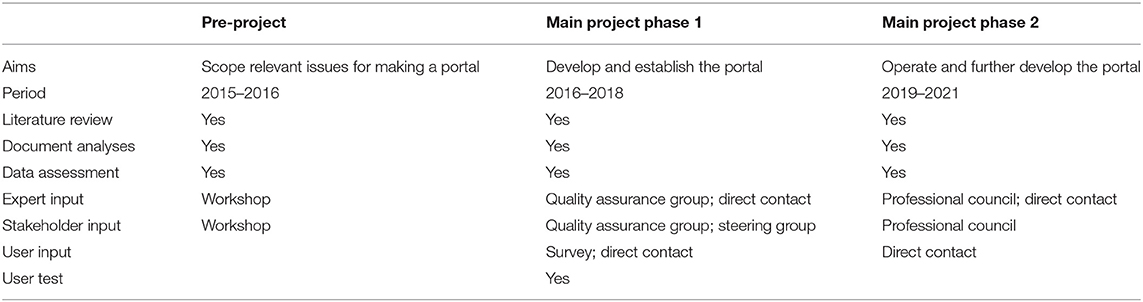
Table 1. Main characteristics of pre-project and main project's phases 1 and 2.
The Pre-project
The aims of the pre-project were to (i) identify criteria for holistic sustainability indicators to be included in the portal covering environmental, economic and social sustainability, (ii) consider data availability and data sources and efficient methods for collection and processing of data, and (iii) suggest set-ups for presentation (Andreassen et al., 2016). The process to fulfill these aims included a review of scientific and government literature, certification schemes, and sustainability reports from aquaculture companies, supplemented by a workshop with relevant stakeholders and representatives from research institutions. The result was an overview of possible criteria, indicators and data sources, ending up with 26 potential indicators across 10 “focus areas” (Andreassen et al., 2016). It was recommended to have a balance between indicators covering environmental, economic, and social sustainability in a web portal. This also became an important point when the Norwegian Seafood Research Fund decided to fund the main project.
The Main Project
In the first phase of the main project the aim was to get the portal established and openly available. This phase should also define the target group. In the second phase it was to run and further develop the portal. The core project group was set up with members from research institutions Nofima (project lead) and SINTEF Ocean, to ensure competence and also independence from the aquaculture industry. BarentsWatch was also member of the core project group, as partner responsible for web publication. BarentsWatch has an open information system on oceans and marine use at www.barentswatch.no, and has 10 ministries and 29 directorates and research institutions as partners. By establishing the aquaculture sustainability web-portal on the Barentswatch platform, one hoped for efficient technical production and maintenance of the portal, and that it would find users among those that already used the Barentswatch platform.
Two additional groups were formed to support the development of the portal in the first phase. The first was a quality assurance group with members from Norwegian universities and research institutes, an environmental NGO (Bellona), and from a consultancy [Teigen Consulting, Institute for Policy Analysis and Development (INPAD)]. The second was a so-called steering group appointed by the project owner and funder, with four members from aquaculture companies. The steering group should, as stated in their mandate from FHF, contribute to the project reaching its objectives, to maximize the benefits for the industry, and that the results of the project is implemented in the industry. The steering group explicitly did not have authority to “influence the project in a way that could weaken the scientific management” of it1. Both the members of the quality assurance group and the steering group gave valuable inputs as experts and stakeholders, but Nofima and SINTEF Ocean have been responsible for the final choice of themes, datasets, indicators, and the presentation in the portal.
Target Group
One possible division of target groups are between “specialists” and “citizens”/“the general public” (Eurostat, 2017, p. 22), which differ in their needs for and abilities to understand detailed statistical information. It can also be specifically about their previous knowledge about the aquaculture industry. Within the general public, Eurostat (2017, p. 23) lists the following as possible subgroups: policy-makers, youngsters, University students, pensioners, families, representatives of the civil society, generalist journalists. The choice of target group(s) can affect all aspects of the web portal. The more precisely the target group can be defined, the easier it will be to approach it to get useful input regarding choice of themes and indicators, the geographic and timewise resolution for them, the format for presentation, and more. It will likely also be less need for making compromises regarding these choices.
The preproject report (Andreassen et al., 2016) emphasized the need to clarify the target group(s) for the web-portal. While leaving this to the main project, it did however mention both decision makers and “ordinary people,” and that they had received inputs especially about media, consumers of farmed salmon, and local and regional decision makers relevant for aquaculture. In the main project additional and more specific target groups were considered in a workshop with the project researchers and persons from BarentsWatch, and in discussions with members of the steering group and quality assurance group. Additional groups mentioned included politicians, NGOs, and individuals concerned with regional development and sustainability, persons and organizations from other industries, and especially also those with little prior knowledge of the aquaculture industry.
Selecting Themes and Indicators
To select themes, identify and collect data, select or construct indicators and make a web-presentation of them has been an iterative process. Figure 1 sketches the workflow in the main project. The selection of themes and identification of data sources (1 and 2 in the Figure 1) used the list from the pre-project as a starting point. The project aimed to select indicators based on existing data, and thus not create or collect primary data itself. The motivation was to get a first version of the portal operative without having to wait for new data to be collected.
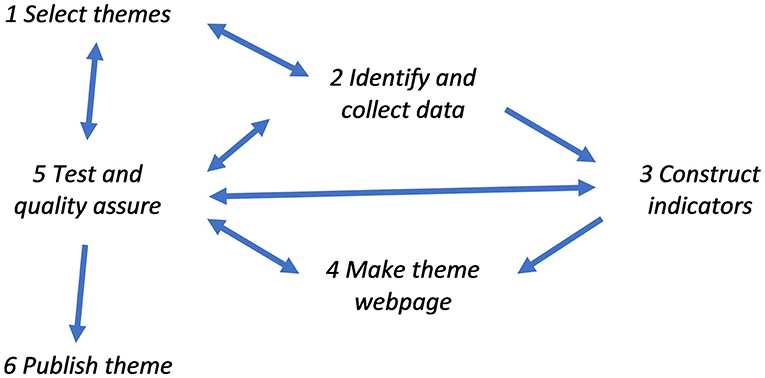
Figure 1. Sketch of workflow in main project to select and design indicators.
As data was identified and collected, and draft versions of indicators (3 in Figure 1) were constructed, certain challenges appeared. In some cases, the available data was found to be too limited for the breadth or complexity of the theme, and indicators based on them would likely give an incorrect picture of its status or development. In other cases, the problem was the high number of relevant datasets making it difficult to select a reasonable sub-set suitable for presentation on a webpage. An example of the latter was for the planned theme Safe and Healthy Food. A very large number of both nutrients and contaminants in farmed salmon are monitored regularly in Norway (IMR, 2020). Of the ca. 80 contaminants monitored, 17 have an official maximum threshold, and both were considered too many to be presented on a webpage in the portal. Another data-related challenge was data only being available from some years back. Was it likely or unlikely that they were so outdated as to give a wrong impression of today's situation? For greenhouse gas emissions, available data were from 2007, and it was easy to conclude they could not be used. Data on feed ingredients and their conversion to energy and proteins in the fish were from 2012/2013, and they were included.
To construct indicators from datasets it was necessary to consider the most relevant aspects for aquaculture sustainability. This included geographic level (national/regional/local), time periods (year, month, week) and if indicators should have values relative to how the aquaculture sector developed over time (size or activity level), or to the environmental, economic or social context the industry operate in.
When suitable indicators had been constructed, the next step was to design a webpage for the theme (4 in the Figure 1). After designing a template to be used across themes, the focus moved to the concrete content for each theme's webpage. Quality assurance (5) was conducted through several mechanisms. The quality assurance group gave input in meetings or email to selection of themes and indicators and their presentation. When the portal was approaching version 2, a user-test was carried out where the users were asked to find answers to certain issues/questions by using the portal. How they used the webpages was observed and they also commented on their experience. The user-test gave input that was useful for the specific design of the webpages, layout of diagrams, and on wording. In addition to the feedback from these groups, a nationwide survey gave important input to quality-assurance.
Survey
The nation-wide survey was conducted to get input on how important different topics on aquaculture were for the respondents, and important factors for a web-portal on aquaculture to be credible. The survey was conducted 6 March to 12 April 2018 as a web survey and was performed by the survey company Norstat based on their panel of respondents. The survey was representative with regard to age-groups and gender for the general population in six regions covering all of Norway, and had 630 respondents. This gives, with the total number of inhabitants of Norway 18 years or older as the survey population, a 95% confidence interval of maximum ± 3.9 %.
The 33 themes covered by the survey were selected based on a literature review (Andreassen et al., 2016), workshops, and meetings with representatives from research, aquaculture industry, and environmental NGOs with knowledge on aquaculture and sustainability, and a mapping of the availability of relevant data for themes.
Results
This section presents results on relevant and selected themes (based on the defined target group, choice of sustainability assessment, and survey results), what affects trustworthiness, the set of criteria for choosing themes and indicators, and important process elements and issues when making the web-portal.
The chosen purpose and target group is pivotal when assessing which themes and indicators that will be relevant for a web-portal on the sustainability of aquaculture. It also affects what kind of sustainability assessment type that will be best suited, and how the presentation on the web pages should be. The selected target group was described as “anybody interested in facts about the aquaculture industry,” and understood as the part of the general public that has finished school. Those with little prior knowledge on aquaculture were emphasized as part of the target group, as were local and regional politicians and bureaucrats, journalists, and high school students. This means that aquaculture experts are outside of the target group, though they could find it useful as a resource to easily find updated facts.
The purpose of the portal is to provide facts about the sustainability of aquaculture in Norway, giving a balanced view of environmental, economic, and social dimensions, and focusing on salmon and trout farming. Aiming to help facilitate a fact-based public debate, the portal must give information on many different themes, rather than presenting just a composite index or a “footprint.” Thus, a dashboard/set of indicators was selected as the sustainability assessment approach.
The issues identified by the target groups as relevant or of interest were chosen as a starting point for which themes or indicators could be used. The survey provided valuable information on that. The proportion of respondents from the survey who found a theme “Important” or “Very important” is shown in Figure 2, together with the proportion who answered “Don't know.” The majority of respondents found 31 of 33 themes to be important or very important, showing that sustainability was perceived as a broad concept, across both environmental, economic, and social issues, and also management/governance. Still, themes related to environment and social issues do dominate as the most important. Several themes have relevance for more than one of the sustainability dimensions. Fish disease can, for example, affect economy, environment, and fish welfare, where the latter could be seen as a social/ethical issue.
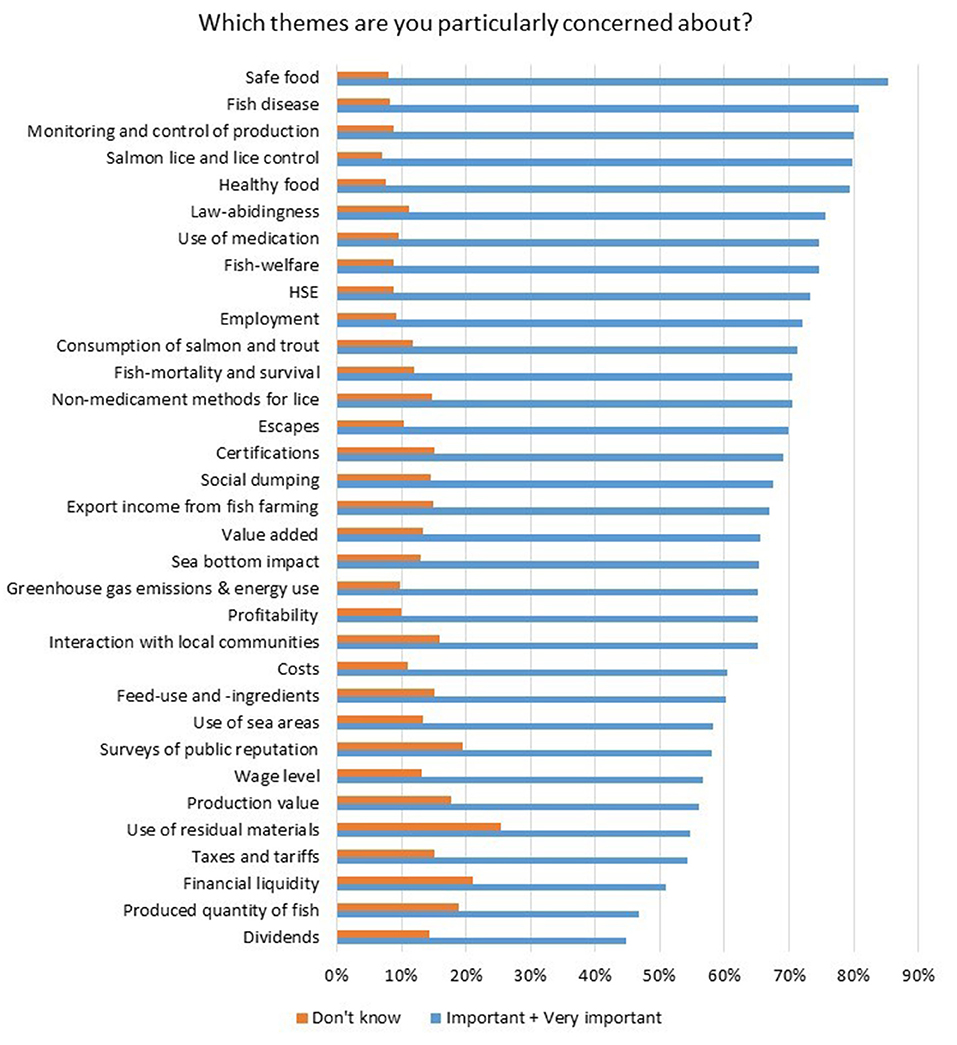
Figure 2. Survey results: Share of respondents that find themes on aquaculture “Important” or “Very important,” or do not know.
The respondents found the following themes especially important: Safe food (85% answered Important or Very important), Fish disease (81%), Monitoring and control of production (80%), Salmon lice and lice control (80%), Healthy food (79%).
In addition to the target group's interest in various themes and indicators, their actual importance for sustainability issues related to aquaculture matter for their relevance. Consideration of this was based on scientific literature, what was emphasized in legislation and regulation, and expert and stakeholder opinion.
Several other aspects than relevance were important for the selection of themes and indicators, including some practical aspects. The set of criteria for choosing themes and indicators that the project ended up using is:
- Themes and indicators shall cover environmental, economic, and social sustainability.
- The indicators chosen for a theme must together shed light on significant aspects of the theme.
- The indicators must be clearly related to the effects of aquaculture, and not be strongly influenced by other factors.
- The indicators shall be based on existing data sets.
- Data are publicly available and from objective/authoritative sources.
- The collection and handling of data can be done practically and cost-efficient.
- Data are suitable for presentation on a webpage.
Based on this, the current version of the portal (as of March 2021) has the 22 selected themes presented in Table 2, sorted across the three main dimensions of sustainability.
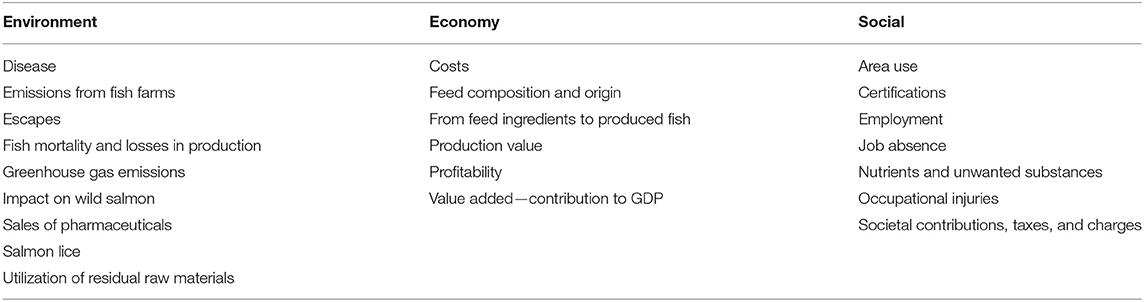
Table 2. Themes in the portal, as of March 2021.
The survey also included questions on what makes a web-portal credible. For this, all the alternatives listed got a high share of “Important” and “Very important” (Figure 3), ranging from 61 to 83%. That the data presented are based on research was seen as the most important criteria (83%), followed by that the data source is stated (80%). That the data are quality assured by a quality assurance group (78%), and that research and research institutions have been responsible for making and presenting the indicators (74%) were also considered important. A categorization of the answers in the “Other” category found that 18 respondents stated that the portal or actors behind it had to be “independent,” 14 that the language had to be understandable, 13 that data had to be openly available/documented, and 9 that the portal had to be easy to navigate/orientate in. Sixty-nine of the “Other” responses were not relevant for the portal as such.
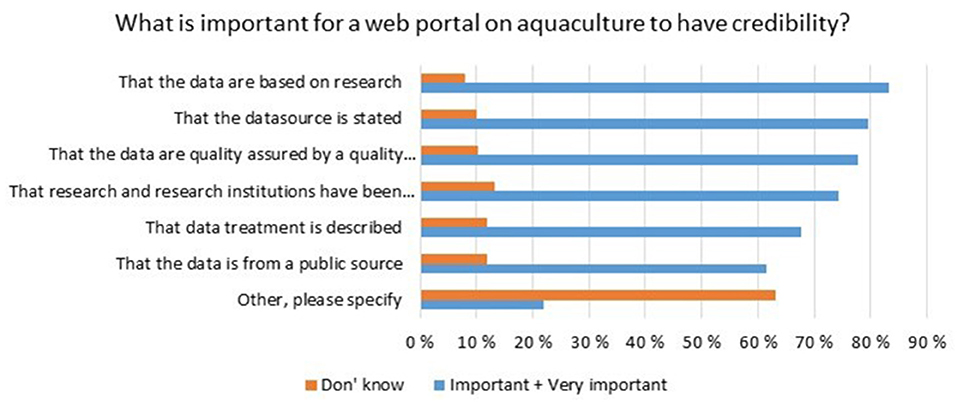
Figure 3. Survey results: Share of respondents that find issues “Important” or “Very important” for a web portal on aquaculture to be credible.
Most of these points on credibility from the survey were either already decided for the portal, like the organization of the project with a group of researchers responsible for decision making and using only publicly available data, or were added or made more pronounced. The latter included clearly referring to data sources and additional information, and striving to present and describe the themes and what the indicators show neutrally and objectively.
A number of other considerations were made for the design of the theme pages. They all have the same basic design (Figure 4), in part to make it easier for the users to orientate and find information once they start using the portal. The lead paragraphs sum up or present important aspect of the theme. If the link to sustainability is not obvious, the main text explains this. This is considered especially important as the target group also includes those that have little prior knowledge of aquaculture in Norway, but even for those that are familiar with the aquaculture industry this may not be obvious. Special terms and indicators are explained in the text or in separate information boxes. The status or development may be summed up in a sentence or two. Information on monitoring, control, or management may also be briefly described. The key figures are for the last year, or the latest full year there is data for. The diagrams with indicator values show development or regional variation, or a combination of the two. Below the diagrams follows information on the source(s) for the dataset, when the page was last updated, and where more information can be found. The latter includes links or reference to webpages, reports, scientific articles, or legal documents.
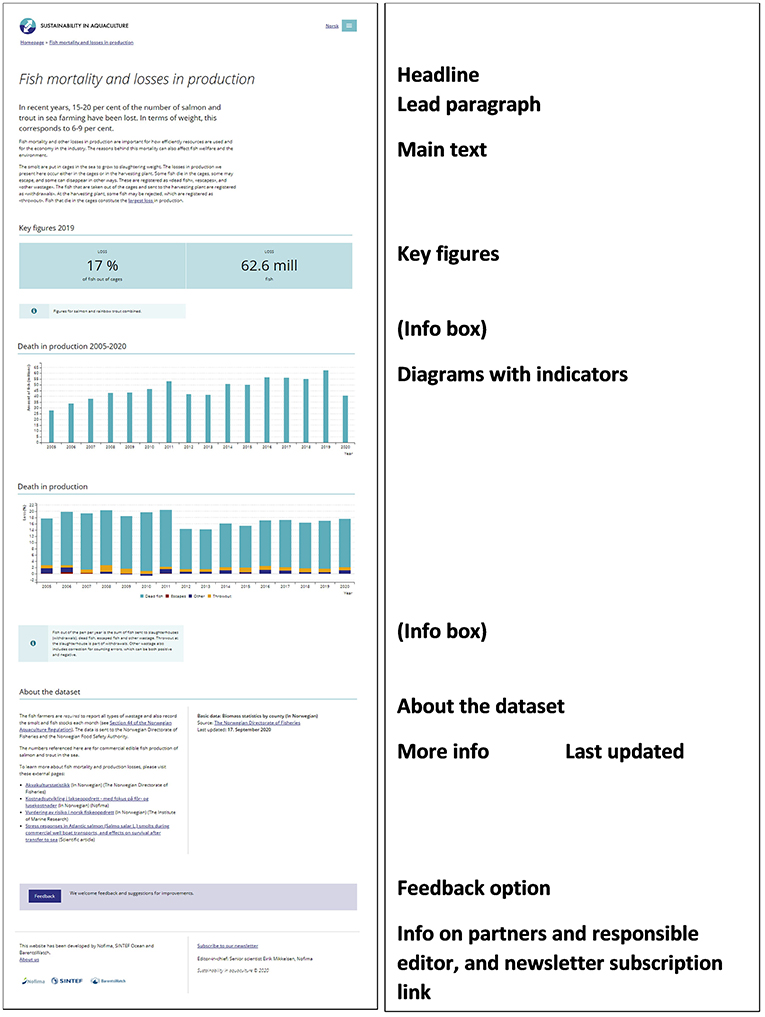
Figure 4. Theme page structure.
Each theme page can have several indicators, that may be updated at different time intervals. Counting the indicator with most frequent update for each theme, one of the themes have weekly updates, two have monthly updates, twelve have annual updates, and eight have irregular updates. The ones that are irregularly updated are based on research project data, as are some of the annually updated ones. The other indicators are generally based on data that the authorities publish from monitoring of and mandatory reporting by the aquaculture industry. Most of the indicators give figures covering all of Norway, but two themes have data on county level.
It is an aim to keep the indicators in the portal up to date and present new data as soon as they are published. Therefore, automatic transfer of data and updating of indicators is used as much as possible. This is practical and cost-efficient. It does however put limitations on the text on the theme pages, as it cannot refer to specific indicator values in a way that risks it being outdated and wrong when indicators are automatically updated. Currently four themes have indicators with automatic updating.
In addition to the individual theme pages, the portal has several general information pages: The start page with an overview of all the themes, About the Norwegian aquaculture industry, Sustainability, Selection of themes, an overview of the data sets used and their origin, About us, and a Newsletter page with archive and subscription options. Especially the page on the Norwegian aquaculture industry and the one on Sustainability are made with those with little prior information on aquaculture in mind.
There has not been any formal evaluation of the process to establish the portal, but some reflections on this can still be presented, based on the core group's experiences from the process. Having a core project group consisting of researchers independent from the aquaculture industry clearly strengthens the credibility of the portal. While these researchers must have knowledge of the aquaculture industry and about sustainability, with the starting point that the portal should present data on both the environmental, economic, and social dimensions of sustainability, it is also clear that the core project group cannot have expert competence in all the relevant fields. Alternatively, if the core group should cover all fields it would be a very large project group and it would be difficult to organize an effective work process. Being able to draw on experts in different fields has therefore been essential. This goes both for getting ad-hoc support from experts for individual themes and indicators and getting input on the broader aspects from the experts that followed the project over time as members of the quality assurance group and the professional council.
Stakeholders have also contributed positively in the process, but this has mostly been persons from the aquaculture industry and from environmental NGOs. We have also collected input from the general public through the national survey. While the involvement of different stakeholder groups and sub-groups of the general public could have been deeper and more extensive in the project process, this is nearly always the case. We think the level of involvement we had gave sufficient information for deciding on the content and design of the portal. This also when we consider the time and other resources that were available.
Discussion and Conclusion
Public availability of relevant and trustworthy information on the impacts and management of aquaculture is essential for good governance of the industry (FAO, 2017). The web-portal presented in this article is an attempt to contribute to this for Norwegian aquaculture, covering both environmental, economic, and social sustainability dimensions. To decide on the published version of the portal, a number of challenges have been met and trade-offs made. Several considerations have been taken in deciding on criteria for selecting indicators, on which themes and indicators should be presented, and how they should be presented. For those to design similar types of sustainability web-portals, decisive factors for the choices made must stem from the objectives with establishing such a portal and the defined target group.
It is more difficult to define the needs of the “general public” than other target groups. The general public can be defined in many ways, and it can be segmented in many ways (Eurostat, 2017). Focusing on some sub-groups out of the wider general public makes it easier to collect input and feedback and make design choices. There is a risk for opposing signals from the different sub-groups, making compromises necessary, and a risk for not meeting the needs of sub-groups that have not been given the chance to give input. Still, it may be easier to tailor the design of the web portal to the needs of some sub-groups rather than trying to sample the wide general public. With sub-groups one can usually resort to focus group techniques to collect input, requiring just a few persons. To get representative input for the whole general public requires many more respondents. Carefully considering if some sub-groups are more important than others could make prioritization easier.
Which themes and indicators are relevant and how they should be presented depend on several factors. The factual relevance for sustainability is clearly a criterion, and experts can help assess this. Whether various stakeholders and the general public think a theme is important should also matter, even if experts do not find the theme very relevant for sustainability. For such a theme it is important to avoid misconceptions, with trustworthy facts and information. If misconceptions about the sustainability of aquaculture are common among the general public their concerns may promote inappropriate decisions by politicians.
Credibility and trustworthiness are essential for a web-portal such as the one presented here. This depends on those who are involved in establishing the portal and which roles they have, how the data presented was obtained, and how it is presented. The limited attention span of those obtaining information from the Internet is a special challenge. Hence the length of texts and the number of indicators on each web page have been limited, and this makes it difficult to include all the nuances and reservations that a scientific presentation and objectivity might require. Also, for the texts to be comprehensible to the general public, precise but advanced scientific terms must be replaced with plain language. So, demands on form and presentation challenges precision and objectivity.
The necessary demands of credibility and objectivity might also make it harder to promote and create excitement for the portal, and thus attract users. Much in today's media, both news channels and social media, focuses on conflicts and strong opinions. The portal does not do that, and the portal does not conclude if salmon and trout farming in Norway are sustainable, neither in general terms nor for individual themes. This has to do with how sustainability assessments often are value-based and not science-based (Böhringer and Jochem, 2007). In some cases, it is possible to define a situation that clearly is sustainable. Zero escapees in salmon farming would for example be a sustainable number of escapees. But for most real-world situations it is not possible to judge based on science whether a situation is sustainable or not. How many escaped salmon could be sustainable? Some of the portal's indicators do present the situation in relation to some limits set by the authorities. This concerns, for example, how often fish farms exceed the maximum average number of lice per fish in the farms, or that benthic environment under the pens fails to meet quality requirements. But these limits are set without an exact scientific basis for sustainability. Neither are there scientific criteria for trading different sustainability aspects off against each other. Reid and Rout (2020) propose a very different approach, where sustainability indicators should be defined with a clear choice about what is to be sustained and for whom, and a “radical transparency” on the values and moral imperatives used to determine this. This would then be based on a participatory approach to determining the values and priorities. A major problem with using the approach of Reid and Rout for the web-portal on Norwegian aquaculture's sustainability would be to determine who should decide the values and priorities. The sustainability issues span both local, regional, national, and international concerns as well as the environmental, economic, and social dimension. Even though the general public of Norway is the main target group for the web-portal, it would be unreasonable to let their values determine what should be deemed sustainable across all these levels and dimensions. If it were a matter of considering social sustainability in Norway only, it would be more reasonable.
The portal thus just presents facts on status and development for the indicators and leaves it to the users to make their own judgement about whether or how sustainable the situation is. As such, the portal is open to the general criticism of dashboard-type sustainability assessments of not actually assessing how sustainable the situation is (Stiglitz et al., 2010; p. 62). Sets of sustainability indicators can in principle be transformed into a single measure of sustainability by making a composite index, but there are serious challenges related to both normalization and weighting of the individual indicators in the index (Kwatra et al., 2020). More concerns for sustainability assessment methods are also presented and discussed in Sala et al. (2015). Common shortcomings with the methods proposed, for the purpose and target group of the web-portal on Norwegian aquaculture, is that it is rather technical exercises that will be hard to understand and it may not be clear how the status on concrete issues that the general public can relate to matter for the sustainability. With a themes-based, dashboard approach, the relevance for policy areas is much clearer (Kwatra et al., 2020). Most of the portal's indicators have a timeseries of data that makes it possible to assess if the development related to that indicator is becoming more or less sustainable. Recently, the portal has also added some comparison with other industries and regions. The theme page on greenhouse gas emissions, added in July 2020, compares farmed salmon products from Norway with wild caught seafood products from Norway and also European animal products. Where other such relevant comparisons are available based on scientifically robust methods, we plan to include this in the portal in the future. Among the candidates for this are antibiotics use in animal protein production.
Even though the portal does not conclude whether aquaculture is sustainable or not, the portal can contribute to resolving some conflicts. It is well known that some conflicts are rooted in misinformation or misunderstanding of what is actually the situation. The portal can then help by providing the facts. One example of a misconception that seems to persist with many is that antibiotics is used a lot in salmon farming in Norway. In reality, it has been very low since the 1990s, and much lower than in agriculture.
Positive feedback on the portal has come from persons representing public authorities at different levels and aquaculture industry, both in Norway and abroad. They have found it easy to find information and describe the portal as being able to point out the challenges facing Norwegian salmon farming today. Despite this, the number of visits to the portal is lower than we had expected. As of March 2021, around 20,000 unique visitors (ip-numbers) have been on the portal. About 75% of these are from Norway, while the rest comes from other countries all over the world. Future plans are to improve the promotion of the portal and to investigate more among current and potential users how the portal could become more relevant and attractive to use.
Two measures to make it more relevant and interesting are to make sure that indicators in the portal are based on as up-to-date data as possible, and that data are available on a geographical scale relevant for people's everyday lives. The first published version of the portal was dominated by annually updated indicators for the national level. Increasing the number of automated updates of indicators is one important strategy, and as more data providers offer APIs (application programming interfaces) this becomes increasingly possible. Providing more indicators at county or municipal level should make the portal more interesting for ordinary people, also more relevant for local political and administrative processes. One challenge with offering indicators at the municipal level is to still keep the portal simple to understand and navigate in. Showing data for all of Norway's 226 coastal municipalities as the standard presentation is hardly an alternative, so this will require a design where the users must make some active choices.
The portal's indicators are based on already existing datasets. While this has made it possible to establish indicators and theme pages relatively quickly, it has also meant that some highly relevant themes could not be established due to lack of data. In parallel with working on making indicators for the portal from existing datasets, the research team has also proposed research themes and projects to make new datasets. One example is related to greenhouse gas emissions from aquaculture, where a project was established, and indicators now are present in the portal. Having a possibility to propose new datasets that could be established, and that resources can be made available to collect them, is important for keeping such a portal and its indicator set relevant. Among the areas where publicly available datasets in Norway are insufficient for use in the portal are fish welfare, area use and area conflicts, and freshwater use.
As we have shown, making a web-portal with sustainability indicators for aquaculture for the general public will require trade-offs between several objectives. Even though we have identified some criteria and recommendations for both selecting content and presentation, some discretionary decisions must be made. It is an integrative and overall qualitative decision. The compromises can be a source for never-ending doubt to whether other solutions would be better, but it is better to get such a portal established rather than keep searching for the perfect solution. It is important that facts to assess the sustainability of aquaculture is made easily available to the general public. Nearly half of the countries that reported having aquaculture activities in the latest of FAO's bi-annual surveys on responsible fisheries and aquaculture saw a need for a better framework to manage and benefit from the aquaculture activities (FAO, 2020, p. 100). While other webpages in Norway contain much of the same information that is presented in the Sustainability in Aquaculture web-portal, no other has the broad coverage of relevant themes, quality assured information based on openly available data from objective sources, presented in a form tailored to the general public. The work to improve the portal continues.
Data Availability Statement
The raw data supporting the conclusions of this article will be made available by the authors, without undue reservation.
Author Contributions
EM contributed to the idea, conceptualization, and writing first draft. All authors contributed to the input on structure, commenting, editing, and approved the submitted version.
Conflict of Interest
The authors declare that the research was conducted in the absence of any commercial or financial relationships that could be construed as a potential conflict of interest.
Acknowledgments
The work was financed under grants numbers 901139, 901255, and 901541 from the Norwegian Seafood Research Fund (FHF). Kine Mari Karlsen was project leader for the work with the portal up to February 2020, and also responsible for the survey reported here.
Footnotes
1. ^It was also stated explicitly that if assumptions or framework for the project from FHF itself, steering group or reference groups was considered to possibly affect the quality or legitimacy of the project, the project leader must point this out to FHF immediately. FHF no longer appoint “steering groups” for their projects, but rather professional councils (“Faglig råd”) (FHF, 2020).
References
Aarset, B., Carson, S. G., Wiig, H., Måren, I. E., and Marks, J. (2020). Lost in translation? Multiple discursive strategies and the interpretation of sustainability in the Norwegian salmon farming industry. Food Ethics 5:11. doi: 10.1007/s41055-020-00068-3
Aas, T. S., Ytrestøyl, T., and Åsgård, T. (2019). Utilization of feed resources in the production of Atlantic salmon (Salmo salar) in Norway: an update for 2016. Aquacult. Rep. 15:100216. doi: 10.1016/j.aqrep.2019.100216
Alexander, K. A., Amundsen, V. S., and Osmundsen, T. C. (2020). Social stuff' and all that jazz: understanding the residual category of social sustainability. Environ. Sci. Policy 112, 61–68. doi: 10.1016/j.envsci.2020.06.003
Amundsen, V. S., and Osmundsen, T. C. (2018). Sustainability indicators for salmon aquaculture. Data Brief 20, 20–29. doi: 10.1016/j.dib.2018.07.043
Anderson, J. L., Anderson, C. M., Chu, J., Meredith, J., Asche, F., Sylvia, G., et al. (2015). The fishery performance indicators: a management tool for triple bottom line outcomes. PLoS ONE 10:e0122809. doi: 10.1371/journal.pone.0122809
Andreassen, O., Karlsen, K. M., Robertsen, R., and Solås, A.-M. (2016). Utvikling av et Bærekraftsbarometer for Norsk Lakseoppdrett - Forprosjekt. Rapport 13/2016, Nofima, Tromsø.
Böhringer, C., and Jochem, P. E. P. (2007). Measuring the immeasurable - a survey of sustainability indices. Ecol. Econ. 63, 1–8. doi: 10.1016/j.ecolecon.2007.03.008
Bracco, S., Tani, A., Çalicioglu, Ö., Gomez San Juan, M., and Bogdanski, A. (2019). Indicators to Monitor and Evaluate the Sustainability of Bioeconomy. Overview and a Proposed Way Forward. Environment and Natural Resource Management Working Paper 77. Food and Agriculture Organisation of the United Nations (FAO), Rome.
Brown, D. (2009). Good Practice Guidelines for Indicator Development and Reporting, Third World Forum on 'Statistics, Knowledge and Policy'. Charting Progress, Building Visions, Improving Life. Busan, Korea.
Consensus (2006). Defining Indicators for Sustainable Aquaculture Development in Europe. Report from A Multi-Stakeholder Workshop held in Oostende, Belgium November 21–23, 2005.
Eurostat (2017). Towards a Harmonised Methodology for Statistical Indicators. Part 2 - Communicating Through Indicators. 2017 Edn. Luxembourg: Publications Office of the European Union. Available online at: https://ec.europa.eu/eurostat/documents/3859598/7862432/KS-GQ-17-001-EN-N.pdf/3a226be6-efe0-4668-b09f-3dcd20f8ff11?t=1486482132000
Eustachio, J. H. P. P., Caldana, A. C. F., Liboni, L. B., and Martinelli, D. P. (2019). Systemic indicator of sustainable development: Proposal and application of a framework. J. Clean. Prod. 241:118383. doi: 10.1016/j.jclepro.2019.118383
FAO (1999). Indicators for Sustainable Development of Marine Capture Fisheries. FAO Technical Guidelines for Responsible Fisheries No. 8. Rome: Food and Agricultural Organization of the United Nations.
FAO (2009). The Socio-Economic Impacts of Aquaculture - Methods for Identification and Assessment Draft report. Rome: FAO.
FAO (2017). Aquaculture Development - Aquaculture Governance and Sector Development. Rome: Food and Agricultural Organisation of the United Nations.
FAO (2020). The State of World Fisheries and Aquaculture (SOFIA). Rome: Food and Agricultural Organisation of the United Nations.
FHF (2020). About FHF. Available online at: https://www.fhf.no/fhf/about-fhf-english/ (accessed September 29, 2020).
Fisheries Directorate (2021). Aquaculture Statistics. Atlantic Salmon and Rainbow Trout. Grown Out. Sale 1994–2019. Available online at: https://www.fiskeridir.no/English/Aquaculture/Statistics/Atlantic-salmon-and-rainbow-trout (accessed March 31, 2020).
Garlock, T., Asche, F., Anderson, J., Bjørndal, T., Kumar, G., Lorenzen, K., et al. (2020). A global blue revolution: aquaculture growth across regions, species, and countries. Rev. Fish. Sci. Aquacult. 28, 107–116. doi: 10.1080/23308249.2019.1678111
Gephart, J. A., Golden, C. D., Asche, F., Belton, B., Brugere, C., Froehlich, H. E., et al. (2020). Scenarios for global aquaculture and its role in human nutrition. Rev. Fish. Sci. Aquacult. 29, 122–138. doi: 10.1080/23308249.2020.1782342
GGKP (2016). Measuring Inclusive Green Growth at the Country Level. Taking Stock of Measurement Approaches and Indicators. Working Paper 02 2016, Green Growth Knowledge Platform, Research Committee on Measurement and Indicators, Geneva, Switzerland. Available online at: https://www.greengrowthknowledge.org/sites/default/files/downloads/resource/Measuring_Inclusive_Green_Growth_at_the_Country_Level.pdf (accessed February 22, 2021).
Gutierrez, A., and Thornton, T. F. (2014). Can consumers understand sustainability through seafood eco-labels? A U.S. and UK case study. Sustainability 6, 8195–8217. doi: 10.3390/su6118195
Halpern, B. S., Longo, C., Hardy, D., McLeod, K. L., Samhouri, J. F., Katona, S. K., et al. (2012). An index to assess the health and benefits of the global ocean. Nature 488, 615–620. doi: 10.1038/nature11397
Hersoug, B., Mikkelsen, E., and Karlsen, K. M. (2019). “Great expectations” - allocating licenses with special requirements in Norwegian salmon farming. Mar. Policy 100, 152–162. doi: 10.1016/j.marpol.2018.11.019
Hersoug, B., Mikkelsen, E., and Osmundsen, T. C. (2021). What's the clue; better planning, new technology or just more money? - the area challenge in Norwegian salmon farming. Ocean Coast. Manage. 199:105415. doi: 10.1016/j.ocecoaman.2020.105415
Hicks, C. C., Levine, A., Agrawal, A., Basurto, X., Breslow, S. J., Carothers, C., et al. (2016). Engage key social concepts for sustainability. Science 352:38. doi: 10.1126/science.aad4977
IMR (2020). Seafood data. Available online at: https://sjomatdata.hi.no/#search/ (accessed October 1, 2020).
Iversen, A., Asche, F., Buck, M., Henriksen, E., Stein, J., and Svalestuen, S. (2020a). The growth and decline of fisheries communities: explaining relative population growth at municipality level. Mar. Policy 112:103776. doi: 10.1016/j.marpol.2019.103776
Iversen, A., Asche, F., Hermansen, O., and Nystoyl, R. (2020b). Production cost and competitiveness in major salmon farming countries 2003–2018. Aquaculture 522:735089. doi: 10.1016/j.aquaculture.2020.735089
Johansen, U., Bull-Berg, H., Vik, L. H., Stokka, A. M., Richardsen, R., and Winther, U. (2019). The Norwegian seafood industry - importance for the national economy. Mar. Policy 110:103561. doi: 10.1016/j.marpol.2019.103561
Johnsen, P. F., Erraia, J., Fjose, S., Blomgren, A., Fjelldal, Ø., Robertsen, R., et al. (2020). Nasjonale Ringvirkninger av Sjømatnæringen I 2019 (In Norwegian: National Economic Ripple Effects of the Sefood Industry in 2019), Menon-publikasjon nr. 98/2020, Oslo, Menon.
Kelly, R., Pecl, G. T., and Fleming, A. (2017). Social licence in the marine sector: a review of understanding and application. Mar. Policy 81, 21–28. doi: 10.1016/j.marpol.2017.03.005
Knowler, D. (2008). “Economic implications of an ecosystem approach to aquaculture (EAA),” in Building an Ecosystem Approach to Aquaculture, FAO/Universitat de les Illes Balears Experts Workshop. 7–11 May 2007, Palma de Mallorca Spain, eds D. Soto, J. Aguilar-Manjarrez, and N. Hishamunda (Rome: FAO), 47–65.
Krause, G., Billing, S.-L., Dennis, J., Grant, J., Fanning, L., Filgueira, R., et al. (2020). Visualizing the social in aquaculture: how social dimension components illustrate the effects of aquaculture across geographic scales. Mar. Policy 118:103985. doi: 10.1016/j.marpol.2020.103985
Krause, G., Brugere, C., Diedrich, A., Ebeling, M. W., Ferse, S. C. A., Mikkelsen, E., et al. (2015). A revolution without people? Closing the people-policy gap in aquaculture development. Aquaculture 447, 44–55. doi: 10.1016/j.aquaculture.2015.02.009
Kwatra, S., Kumar, A., and Sharma, P. (2020). A critical review of studies related to construction and computation of sustainable development indices. Ecol. Indic. 112:106061. doi: 10.1016/j.ecolind.2019.106061
Levett, R. (1998). Sustainability indicators-integrating quality of life and environmental protection. J. R. Stat. Soc. A 161, 291–302. doi: 10.1111/1467-985X.00109
Mather, C., and Fanning, L. (2019). Social licence and aquaculture: towards a research agenda. Mar. Policy 99, 275–282. doi: 10.1016/j.marpol.2018.10.049
Mikkelsen, E., Fanning, L., Kreiss, C., Billing, S.-L., Dennis, J., Filgueira, R., et al. (2020). Availability and usefulness of economic data on the effects of aquaculture: a North Atlantic comparative assessment. Rev. Aquacult. 13, 601–618. doi: 10.1111/raq.12488
Mikkelsen, E., Karlsen, K. M., Robertsen, R., and Hersoug, B. (2018). Skiftende Vindretning. Særlige Hensyn for Tildeling av Tillatelser til Lakseoppdrett (In Norwegian: Special Considerations for Allocating Licences for Farming Salmon and Trout in Norway). Nofima report 26/2018, Nofima, Tromsø, Norway.
Milewski, I., and Smith, R. E. (2019). Sustainable aquaculture in Canada: lost in translation. Mar. Policy 107:103571. doi: 10.1016/j.marpol.2019.103571
Nardo, M., Saisana, M., Saltelli, A., and Tarantola, S. (2005). Tools for Composite Indicators Building, EUR 21682 EN. Joint Research Centre, European Commission, Ispra, Italy.
NFD (2015). Forutsigbar og Miljømessig Bærekraftig Vekst i Norsk Lakse- og Ørretoppdrett (In Norwegian: Predictable and Environmentally Sustainable Growth in Norwegian Salmon and Trout Farming). Meld. St. 16, 2014–2015. Report to the Parliament. Ministry of Trade, Industry and Fisheries, Oslo.
NSC (2021). Stable Norwegian Seafood Exports in 2020 Despite the Corona Pandemic. Norwegian Seafood Council. Available online at: https://en.seafood.no/news-and-media/news-archive/stable-norwegian-seafood-exports-in-2020-despite-the-corona-pandemic/ (accessed March 31, 2021).
Olaussen, J. O. (2018). Environmental problems and regulation in the aquaculture industry. Insights from Norway. Mar. Policy 98, 158–163. doi: 10.1016/j.marpol.2018.08.005
Osmundsen, T. C., Amundsen, V. S., Alexander, K. A., Asche, F., Bailey, J., Finstad, B., et al. (2020a). The operationalisation of sustainability: sustainable aquaculture production as defined by certification schemes. Global Environ. Change 60:102025. doi: 10.1016/j.gloenvcha.2019.102025
Osmundsen, T. C., Olsen, M. S., and Thorvaldsen, T. (2020b). The making of a louse - constructing governmental technology for sustainable aquaculture. Environ. Sci. Policy 104, 121–128. doi: 10.1016/j.envsci.2019.12.002
Overton, K., Dempster, T., Oppedal, F., Kristiansen, T. S., Gismervik, K., and Stien, L. H. (2019). Salmon lice treatments and salmon mortality in Norwegian aquaculture: a review. Rev. Aquacult. 11, 1398–1417. doi: 10.1111/raq.12299
Pintér, L., Hardi, P., Martinuzzi, A., and Hall, J. (2012). Bellagio STAMP: principles for sustainability assessment and measurement. Ecol. Indic. 17, 20–28. doi: 10.1016/j.ecolind.2011.07.001
Reid, J., and Rout, M. (2020). Developing sustainability indicators - the need for radical transparency. Ecol. Indic. 110:105941. doi: 10.1016/j.ecolind.2019.105941
Sala, S., Ciuffo, B., and Nijkamp, P. (2015). A systemic framework for sustainability assessment. Ecol. Econ. 119, 314–325. doi: 10.1016/j.ecolecon.2015.09.015
Servaes, J., Polk, E., Shi, S., Reilly, D., and Yakupitijage, T. (2012). Towards a framework of sustainability indicators for 'communication for development and social change' projects. Int. Commun. Gaz. 74, 99–123. doi: 10.1177/1748048511432598
Singh, R. K., Murty, H. R., Gupta, S. K., and Dikshit, A. K. (2012). An overview of sustainability assessment methodologies. Ecol. Indic. 15, 281–299. doi: 10.1016/j.ecolind.2011.01.007
Sinner, J., Newton, M., Barclay, J., Baines, J., Farrelly, T., Edwards, P., et al. (2020). Measuring social licence: what and who determines public acceptability of aquaculture in New Zealand? Aquaculture 521:734973. doi: 10.1016/j.aquaculture.2020.734973
Stiglitz, J. E., Sen, A., and Fitoussi, J.-P. (2010). Report by the Commission on the Measurement of Economic Performance and Social Progress. Available online at: https://www.researchgate.net/publication/258260767_Report_of_the_Commission_on_the_Measurement_of_Economic_Performance_and_Social_Progress_CMEPSP (accessed February 22, 2021).
Taranger, G. L., Karlsen, Ø., Bannister, R. J., Glover, K. A., Husa, V., Karlsbakk, E., et al. (2015). Risk assessment of the environmental impact of Norwegian Atlantic salmon farming. ICES J. Mar. Sci. 72, 997–1021. doi: 10.1093/icesjms/fsu132
UN (2015). Transforming our World: the 2030 Agenda for Sustainable Development. Resolution Adopted 25 September 2015. United Nations General Assembly A/RES/70/1. New York, USA, United Nations.
UNAIDS (2010). An Introduction to Indicators, UNAIDSMonitoring and Evaluation Fundamentals. UNAIDS, Geneva.
UNDESA (2007). Indicators of Sustainable Development: Guidelines and Methodologies, 3rd Edn. United Nations Department of Economic and Social Affairs.
Valenti, W. C., Kimpara, J. M., Preto, B. D. L., and Moraes-Valenti, P. (2018). Indicators of sustainability to assess aquaculture systems. Ecol. Indic. 88, 402–413. doi: 10.1016/j.ecolind.2017.12.068
Vifell, Å. C., and Soneryd, L. (2012). Organizing matters: how 'the social dimension' gets lost in sustainability projects. Sustain. Dev. 20, 18–27. doi: 10.1002/sd.461
WCED (1997). Our Common Future: World Commission on Environment and Development. Brundtland Commission. p. 43.
Zheng, W., Shi, H., Chen, S., and Zhu, M. (2009). Benefit and cost analysis of mariculture based on ecosystem services. Ecol. Econ. 68, 1626–1632. doi: 10.1016/j.ecolecon.2007.12.005
Appendix
Info on Survey
The survey was carried out over internet in March 2018 by the Norstat Company, using their panel of respondents. Participation was voluntarily, all responses were anonymous, and the survey was compliant with Norwegian personal data protection regulations for research. Table A1, A2 shows the breakdown of respondents, which was representative for the population in Norway by age-groups, gender, and region.
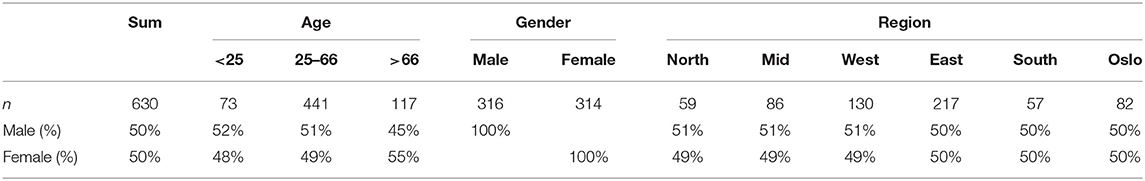
TABLE A1. Survey respondents' age, gender, and geography.
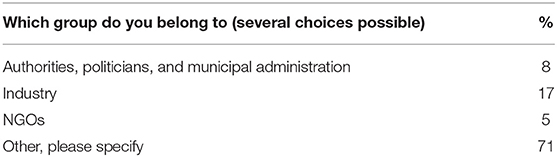
TABLE A2. Survey respondents' group belonging.
Keywords: sustainability indicators, aquaculture, web portal, Norway, salmon
Citation: Mikkelsen E, Myhre MS, Robertsen R and Winther U (2021) Making a Web-Portal With Aquaculture Sustainability Indicators for the General Public. Front. Sustain. Food Syst. 5:644314. doi: 10.3389/fsufs.2021.644314
Received: 20 December 2020; Accepted: 10 May 2021;
Published: 14 June 2021.
Edited by:
Helgi Thorarensen, UiT the Arctic University of Norway, NorwayCopyright © 2021 Mikkelsen, Myhre, Robertsen and Winther. This is an open-access article distributed under the terms of the Creative Commons Attribution License (CC BY). The use, distribution or reproduction in other forums is permitted, provided the original author(s) and the copyright owner(s) are credited and that the original publication in this journal is cited, in accordance with accepted academic practice. No use, distribution or reproduction is permitted which does not comply with these terms.
*Correspondence: Eirik Mikkelsen, ZWlyaWsubWlra2Vsc2VuQG5vZmltYS5ubw==