 Ajay Iyer
 Sylvia H. Duncan
 Wendy R. Russell
94% of researchers rate our articles as excellent or good
Learn more about the work of our research integrity team to safeguard the quality of each article we publish.
Find out more
ORIGINAL RESEARCH article
Front. Sustain. Food Syst., 15 February 2021
Sec. Nutrition and Sustainable Diets
Volume 5 - 2021 | https://doi.org/10.3389/fsufs.2021.575056
This article is part of the Research TopicAlternative Protein Source For A Sustainable And Healthy NutritionView all 12 articles
Agriculture has come under pressure to meet global food demands, whilst having to meet economic and ecological targets. This has opened newer avenues for investigation in unconventional protein sources. Current agricultural practises manage marginal lands mostly through animal husbandry, which; although effective in land utilisation for food production, largely contributes to global green-house gas (GHG) emissions. Assessing the revalorisation potential of invasive plant species growing on these lands may help encourage their utilisation as an alternate protein source and partially shift the burden from livestock production; the current dominant source of dietary protein, and offer alternate means of income from such lands. Six globally recognised invasive plant species found extensively on marginal lands; Gorse (Ulex europaeus), Vetch (Vicia sativa), Broom (Cytisus scoparius), Fireweed (Chamaenerion angustifolium), Bracken (Pteridium aquilinum), and Buddleia (Buddleja davidii) were collected and characterised to assess their potential as alternate protein sources. Amino acid profiling revealed appreciable levels of essential amino acids totalling 33.05 ± 0.04 41.43 ± 0.05, 33.05 ± 0.11, 32.63 ± 0.04, 48.71 ± 0.02 and 21.48 ± 0.05 mg/g dry plant mass for Gorse, Vetch, Broom Fireweed, Bracken, and Buddleia, respectively. The availability of essential amino acids was limited by protein solubility, and Gorse was found to have the highest soluble protein content. It was also high in bioactive phenolic compounds including cinnamic- phenyl-, pyruvic-, and benzoic acid derivatives. Databases generated using satellite imagery were used to locate the spread of invasive plants. Total biomass was estimated to be roughly 52 Tg with a protein content of 5.2 Tg with a total essential amino acid content of 1.25 Tg (~24%). Globally, Fabaceae was the second most abundant family of invasive plants. Much of the spread was found within marginal lands and shrublands. Analysis of intrinsic agricultural factors revealed economic status as the emergent factor, driven predominantly by land use allocation, with shrublands playing a pivotal role in the model. Diverting resources from invasive plant removal through herbicides and burning to leaf protein extraction may contribute toward sustainable protein, effective land use, and achieving emission targets, while simultaneously maintaining conservation of native plant species.
Existing mainstream food supply systems are capable of surpassing global nutritional requirements and yet, we find about 12.3% of the human population living with chronic malnutrition (FAO et al., 2020). Increased atmospheric CO2 and malnutrition can be causally attributed to inefficiencies along the food supply chain primarily through wastage and poor resource allocation (Bajželj et al., 2014; Sabaté et al., 2015; Xue et al., 2017). The high-energy input required for modern agriculture is mostly sourced from fossil fuels, which directly leads to greenhouse gas emissions. This in turn contributes to climate change, increasing crop vulnerability due to altered pest behaviour, temperature eccentricities, and altered seasonal patterns. Cultivation of crops and plants, which is essentially an anabolic carbon storing process, is rendered ineffective owing to such intensive cultivation practises to meet global food demand. One of the major sources of food-based carbon emission is animal husbandry. Most of the global protein produced is directed toward animal feed. Currently, animal husbandry enjoys the single largest resource allocation; especially land, in global food production and is the dominant source of protein for most people (Day, 2013; FAO, 2019). Justification for the present scale of animal husbandry enumerates reasons such as employment, superior essential amino acid profile of animal products, useful functional properties and gastronomic preferences. However, protein turnover from this enterprise is low, while associated greenhouse gas (GHG) emissions are high, making it the single largest contributing factor to agricultural emissions (Pragna et al., 2018).
In the case of Scotland, large parts of the Scottish Highlands are ill suited for arable farming and are primarily used for rough grazing. Plants such as Gorse (Ulex europaeus), Vetch (Vicia sativa), Broom (Cytisus scoparius), Fireweed (Chamaenerion angustifolium), Bracken (Pteridium aquilinum), and Buddleia (Buddleja davidii) are able to quickly grow in urban as well as marginal lands owing to their robust physiologies and quicker germination times, allowing them to dominate available land and often encroach into farmlands (Eldridgea et al., 2011). Since they can grow in low nutrient conditions, they are known to colonise lands left fallow for rejuvenation. This necessitates the investment of resources to remove such plants. While historically, the excised mass was used for animal fodder during times of famine (Łuczaj, 2010; Pinela et al., 2017), they are currently dried and burnt, dug into the soil for increased organic matter or discarded into the landfill which contributes to carbon emissions. Investigation into their nutritive value and developing efficient protein extraction processes may help solve the problem of resource waste and add potential means of compensation for the investment made toward their active removal. Numerous large-scale leaf protein extraction designs have been proposed, although commercial impetus is lacking owing to efforts being diverted to crop variety selection and design. However, adopting such revalorization strategies may mitigate costs generally incurred from raw material sourcing while simultaneously dealing with downstream waste-management. Currently, the resources dedicated to unwanted plant removal is substantial and costs are borne entirely by local farmers, impinging on their income margins. Additionally, these plants pose a threat to local diversity if not kept in check (Parker, 2000; Dassonville et al., 2008; Shiferaw et al., 2019).
Characterisation of these plants as a potential source of nutrition may help provide impetus for their effective utilisation and limit or decrease their spread in their non-native locations or stimulate interest for their conservation in native lands. Extraction methods for obtaining leaf proteins have been well-studied; particularly by Pirie (1977) who pioneered the use of industrial pulping mechanisms to express plant juices. However, contemporary methods for removal of pungent and strong-tasting phenolics were not cost effective and subsequent advances made in crop genetics, and development of novel cultivars overshadowed the idea. Recent years, however, have seen an increase in the pursuit of leaf protein recovery, particularly from agricultural waste. Understanding the total protein content and the amino acid composition of native Scottish plants may help open newer avenues for protein sourcing and allow for more robust food systems resilient to global policies and environment.
Improved utilisation and reallocation of land use for alternate and sustainable protein production is required to help reduce dependence on animal husbandry and offset part of the associated emissions. Along with other non-conventional sources such as insects (Henchion et al., 2017), fungi (Bano et al., 1963), and seaweed (Tamayo Tenorio et al., 2018), revalorisation of invasive plants appears to be an abundant and a potentially lucrative route of obtaining protein (Pirie, 1932, 1969a,b; Nagy et al., 1978). The work described here assesses the revalorisation potential of invasive plants through comprehensive nutritional investigation. It considers potential health benefits, and the predicted impact on land resource allocation and associated GHG emissions.
World data on land use and green-house-gas emissions were obtained from FAOSTAT (FAO, 2019).
All chemicals and kits were purchased from Merck (Darmstadt, Germany), and used without further purification unless stated otherwise.
All experiments and measurements were performed in triplicate.
All colorimetric assays were carried out in 96-well-plates and incubated with film cover (Greiner Bio-One, Kremsmuenster, Austria). Absorption values were obtained using SpectraMax 190 (Molecular Devices, San Jose, USA).
All plant samples were collected between March and July in the North-East of Scotland at the following GPS co-ordinates. Gorse (Ulex europaeus), Broom (Cytisus scoparius), and Bracken (Pteridium aquilinum); 57.257, −2.483, Fireweed (Chamaenerion angustifolium); 57.157, −2.086, Vetch (Vicia sativa); 57.157, −2.139, and Buddleia (Buddleja davidii); 57.158, −2.099. Collection procedure was in accordance to guidelines by the Ministry of Forest, CA (British Columbia Ministry of Forest, 1996). The sampling design aimed to gather biomass across numerous plant samples over a unit land area. For each species at the site of invasion, leaves were harvested from a random number of multiple plants in one-metre-squared plot until one kilogramme of leaf mass was obtained. This was performed in triplicate across adequately spaced one-metre plots. The leaf samples were separated from stalks and debris and pooled, and freeze-dried (Labconco, UK). Samples were freezer-milled (Centramex, USA), and stored at 4°C under vacuum. The whole leaf samples were used to profile amino acids, phenolics, and total NSP (Non-starch Polysaccharide).
The leaf samples (10 mg) were vortexed in phosphate buffer (10 mL; 10 mM; pH 7.5) at 25°C and kept in an ultrasonic bath (Branzen, B12) for 2 min. The supernatant was separated by centrifugation (4°C; 15 min; 4,000 g). A subsample of the aqueous supernatant extract was used for colorimetric estimation of soluble phenolics, sugar and protein content. Remainder of the supernatant and precipitate were collected and freeze dried. Freeze dried precipitate was used to estimate bound proteins.
Fast Blue assay was performed to estimate total soluble phenolics as described by Lester et al. (2012). Sample or Standard (100 μL) was incubated with 2 μL Fast Blue (0.1% w/v) for 30 s on a shaker. Sodium hydroxide (NaOH; 2 μL; 5% w/v) was added and incubated for 90 min in the dark. Absorbance was measured at 420 nm.
Lever's assay was used to estimate soluble sugars as previously described by Lever (1973, 1977). Lever reagent comprised of 4-hydroxybenzoic acid hydrazide (PAHBAH, 0.76% w/v), bismuth (III) nitrate pentahydrate (0.48% w/v), potassium sodium tartrate (0.28% w/v), NaOH (2% w/v) in ultrapure Milli-Q water. Sample or standard (5 μL) was incubated with 200 μL of Lever reagent at 70°C for 30 min. The samples were then allowed to cool for 10 min and absorbance was checked at 415 nm.
Sample hydrolysis was carried out using HCl (6 N) with phenol (2% w/v) to aid removal of oxygen radicals (Muramoto et al., 1987). Freeze-dried supernatant and retentate (10 mg) were digested in HCl (6 N; 10 mL, prepared as described above) and digested using MARS 6 (CEM, US) microwave digester with a temperature ramp to 150°C for 20 min. The temperature was maintained for 60 min and then cooled overnight.
Protein content was determined by amino acid estimation using the Ninhydrin Assay based on the work described by Harding and MacLean (1916). An aliquot (10 μL) of the supernatant was dried at 60°C in a microtiter plate and re-suspended in phosphate buffer (10 mM, 100 μL, pH 7.5) to which ninhydrin reagent (75 μL) was added and incubated at 60°C for 60 min. The absorbance was measured at 570 nm.
Hydrolysis for amino acid profiling was performed as previously described for protein estimation with the addition of 10 mg of tryptamine. Essential amino acids were profiled and quantified using Gas Chromatography in tandem with Mass Spectrometry (GC-MS) with U13-C amino acids as internal standards as described previously in Calder et al. (1999).
Phenolics were characterised in a three-stage extraction process as previously described (Russell et al., 2007). Briefly, 0.1 g of freeze-dried, freeze-milled leaf samples were sequentially extracted under acidic, alkali, and finally neutral pH conditions using biphasic solvent extraction with ethyl acetate as the organic layer. The aqueous layer was adjusted to the required pH condition using 1 M HCl or 1 N NaOH.
Quantification was performed using LC-MS as previously described without modifications (Neacsu et al., 2015). Internal standard used were 13C benzoic acid; 2 ng/μL in 0.02% acetic acid in 75% methanol for negative mode MS and 2-amino-3,4,7,8-tetramethylimidazo[4,5-f] quinoxaline; 0.5 ng/μL in acetic acid (0.02% v/v) in methanol (75% v/v) for positive mode MS.
Non-starch polysaccharides were estimated as described by Englyst et al. using GC with inositol as an internal standard (Englyst and John, 1984; Englyst and Hudson, 1996; Bach Knudsen et al., 1997). Briefly, plant samples were hydrolysed in H2SO4 (7 M) at 100°C for 1 h. Monosaccharides were analysed by Gas Chromatography with Flame Ionised Detection (GC-FID) using Inositol as internal standard.
Lignin content was assayed using the Acetyl Bromide method (Barnes and Anderson, 2017). The protocol was modified to improve carbohydrate removal using enzymes (Hatfield et al., 1999; Fukushima and Hatfield, 2001; Hatfield and Fukushima, 2005; Hojilla-Evangelista et al., 2017). Briefly, the freeze-dried original plant samples (100 mg) were washed with phosphate buffer (10 mM; 10 mL, pH 7.5) at 35°C twice and suspended in citric acid buffer (50 mM, 20 mL, pH 4.9) with 20 units each of cellulase, pectinase and xylanase (all three from Sigma-Aldrich) at 40°C for 4 h. Samples were centrifuged at 4,000 g for 15 min. Retentate was recovered and resuspended in citric acid buffer and incubated with Visozyme® (Novozymes, Denmark) overnight at 32°C. Samples were centrifuged again under the same condition and the supernatant was discarded. Retentate was washed twice with 5 mL ethanol at 30°C, followed by 10 mL of 90% aq. DMSO at 40°C. Sample was finally washed with 10 mL acetone at 30°C and allowed to dry overnight in vacuo. Dried sample (5 mg) was suspended in acetyl bromide (5% v/v) prepared in glacial acetic acid and incubated for 2 h at 70°C. Samples were left overnight in the dark under ambient temperature. The absorbance of the supernatant was measured at 280 nm. Absorption coefficient was assumed to be 23.6 g/cm/mL.
Statistical analysis was performed using R (Version 4.0.2) and RStudio (Version 1.2.1335). Biological values were tested using one-way (OW)-ANOVA followed by the Tukey-HSD post-hoc test at 99% confidence interval. Significance is expressed as F(degrees of freedom, residuals) = F-value, p-value as recommended by Field et al. (2012) unless stated otherwise. All graphs and visualisation have been made using ggplot2 (Wickham, 2016).
GPS location was downloaded from the GBIF database. Identifier of the dataset used to generate maps and analysis can be found at https://doi.org/10.15468/dl.tgk8j9. Packages used in R were: “dplyr” (Wickham et al., 2020), “ggspatial” (Dunnington, 2020), “ggrepel” (Slowikowski, 2020), “sf” (Pebesma, 2018), and “rnaturalearth” (South, 2017).
Principal Component Analysis (PCA) of the phenolic composition was performed on logarithmically transformed data using packages factoextra (Kassambara and Mundt, 2019) and FactoMineR (Lê et al., 2008). Diagnostics of loadings and contribution to the PCA analysis was performed with the help of the package corrplot (Wei and Simko, 2017).
The database on world agricultural values, obtained from FAOSTAT was subjected to exploratory factor analysis using the package psych (Revelle, 2020). Further confirmatory analysis was performed using lavaan (Rosseel, 2012) and lavaanPlot (Lishinski, 2018). Univariant PCA was performed using factoextra, to visualise overarching trends across countries under reduced dimensions. From the database, general regions such as “OECD,” “South-east Asia,” and similar classifications in the database were removed. Finally, all measures of land use were made intrinsic for a country by calculating its percentage coverage relative to its geopolitical land area. A naïve approach was adopted toward factor selection where percentage deviation was used as the metric of choice which showed high variation across individual countries. Factors with a percentage deviation value >100 were chosen for further exploratory factor analysis using maximum likelihood (ML) factor reduction to understand correlation to the latent factors. Finally, a System Equation Mode (SEM) was constructed based on the correlation using confirmatory analysis. Income group classification was performed according to data from World Bank (2020).
Six invasive plants (Gorse, Vetch, Broom, Fireweed, Bracken, and Buddleia) were characterised for total protein content, amino acid profile, non-starch polysaccharide (NSP) composition, and phenolic composition to assess their potential for revalorisation.
Across the plant samples, Bracken was found to have total protein content significantly greater than other plant samples as shown in Table 1. A one way (OW)-ANOVA test at a 99% confidence interval across plant samples for total protein content was found to be significant [F(5,12) = 725.3; p = 1.88 × 10⁴], but similarities were revealed using Tukey-HSD post-hoc test between Gorse and Broom (p = 0.10), and Vetch and Fireweed (p = 0.69). Soluble protein represents the protein fraction extractable using mechanical grinding and buffer solubilisation which ANOVA deemed to have significant overall distinction [F(5,12) = 1,208; p = 8.9 × 10⁻¹⁶]. A post-hoc test, however, could not distinguish between Gorse and Bracken at a 99% confidence interval (p = 0.03). Gorse had 47.3 ± 1.2 mg/g soluble protein (40.8% total protein), while Bracken had 45.2 ± 0.5 mg/g soluble protein (31.6% of total protein). The insoluble protein indicates proteins which remain bound to the cell wall and require further effort for extraction to efficiently use the biomass. ANOVA test found significant difference across the plants [F(5,12) = 1,356; p = 4.45 × 10⁻¹⁶], although a post-hoc test could not distinguish between Buddleia and Fireweed (p = 0.96).

Table 1. Total, soluble, and bound protein in Gorse, Vetch, Broom, Fireweed, Bracken, and Buddleia.
In Table 2, the amino acid composition of the plants is shown. The difference in amino acid profile was found to be statistically significant [F(5,318) = 4.645; p = 4.17 × 10⁻⁴] across plants, but a post-hoc test found Buddleia as the influencing component with a difference which was significant at a 99% confidence interval from Broom (p = 0.005) and Bracken (p = 2.1 × 10⁻⁵) and at a 95% confidence interval from Fireweed (p = 0.040) and Gorse (p = 0.010). Statistical difference was insignificant between the other five plants. Similarities in individual essential amino acid content at 99% confidence interval is also shown in Table 2. Total essential amino acid content of the leaf mass was found to be similar between Gorse and Broom (p = 0.99).
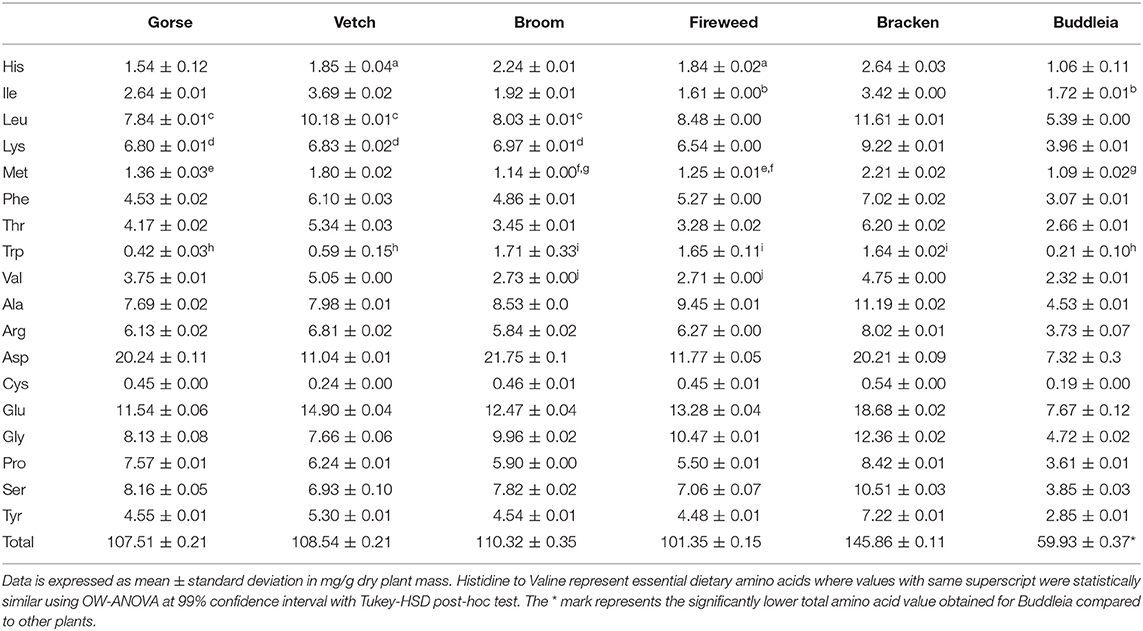
Table 2. Amino acid content of Gorse, Vetch, Broom, Fireweed, Bracken, and Buddleia.
The total essential amino acid content of Gorse, Vetch, Broom, Fireweed, Bracken and Buddleia are 33.05 ± 0.04, 41.43 ± 0.05, 33.05 ± 0.11, 32.63 ± 0.04, 48.71 ± 0.02, and 21.48 ± 0.05 mg/g dry plant mass. When this is presented for % of total protein, the essential amino acid content was the highest for Vetch and appeared to be unique across the plants [F(5,12) = 259.1, p = 8.67 × 10⁻¹²] using OW-ANOVA. No statistical difference was found between Bracken and Buddleia (p = 0.015), and Gorse and Bracken (p = 0.013) at 99% confidence interval.
Additional plant components such as carbohydrate and non-nutrient plant bio-actives have potential use as food or feed and could provide health benefits or wider uses as biomaterials contributing to an effective cyclic economy. Table 3 summarises proximate values of non-protein components and their distribution in the aqueous soluble and non-soluble fractions measured across the six leaf samples.
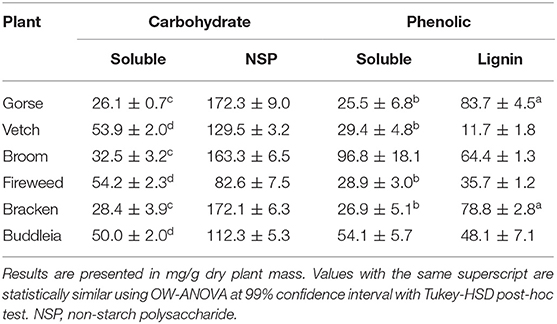
Table 3. Summary of proximate values for phenolic and carbohydrate content.
Correlation analysis across all measurements given in Tables 1 and 3 revealed a strong relation between soluble carbohydrate and lignin (r2 = −0.89, p = 5.52 × 10⁻⁷), soluble protein and lignin (r2 = 0.78, p = 1.43 × 10⁻⁴), lignin and NSP (r2 = 0.70, p = 1.15 × 10⁻³), soluble carbohydrate and NSP (r2 = −0.87, p = 3.64 × 10⁻⁶), soluble carbohydrate and soluble protein (r2 = −0.89, p = 5.57 × 10⁻⁷), and of particular interest, soluble protein and NSP (r2 = 0.77, p = 1.58 × 10⁻⁷). No significant associations were found with insoluble protein bound to the cell wall with any measured proximate components.
Two-way ANOVA test on a model expressing soluble protein content (Table 1) as a function of constituent NSP monomers (Table 4) showed significant association with Arabinose [F(1,11) =437.74, p = 3.29 × 10⁻¹⁰], Fucose [F(1,22) = 269.72, p = 4.37 × 10⁻⁹], Rhamnose [F(1,22) = 20.60 p = 8.4 × 10⁻³], and Galactose [F(1,22) = 10.66 p = 0.008]. A multiple regression analysis revealed Xylose and Rhamnose content in the leaf mass could serve as predictors for soluble protein content which was significant at [F(1,15) = 402.16, p = 3.035 × 10⁻¹²] and [F(1,15) = 34.69, p = 2.97 × 10⁻⁵], respectively, with values expressed in mg/g dry plant mass in the equation:
Goodness of fit of the linear model is shown in Supplementary Figure 1.
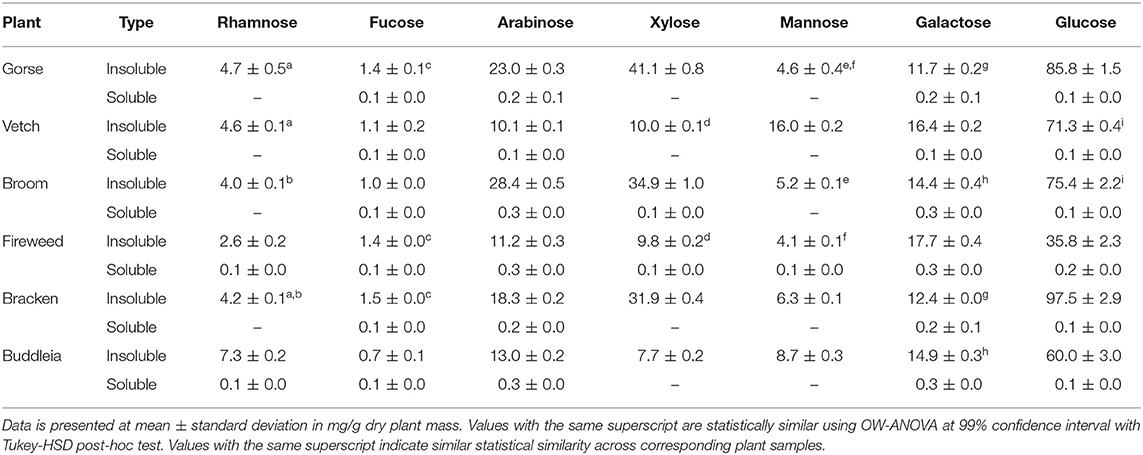
Table 4. Neutral sugar composition of non-starch polysaccharide in Gorse, Broom, Fireweed, and Buddleia. Gorse, Vetch, Broom, Fireweed, Bracken, and Buddleia.
From the perspective of process development, such associations are particularly important as plants such as Gorse, Broom and Bracken could yield higher dividends with simple mechanical extraction, leaving behind substrates rich in NSP and Lignin. It further highlights the association between protein and cell wall and the possible treatment; particularly enzymatic, which may be employed to efficiently utilise the biomass. Furthermore, the comparable Lignin and NSP values of Gorse, Broom and Bracken to de-pithed bagasse (Hajiha and Sain, 2015) warrants further investigation into their potential use in paper-making or other higher value processing (Rainey and Covey, 2016).
The free sugars measured in the aqueous extract reflect the moieties undergoing translocation in the leaf fated for catabolism or storage (Goldschmidt and Huber, 1992). The soluble phenolics were highest for Broom although, Gorse was found to have the highest overall phenolic content of 109.2 ± 8.1 mg/g dry plant mass with 76.6% of it bound to the plant cell wall components. Syringaresinol was the most abundant lignan across the plants and was particularly high in Gorse (47.4 ± 8.1 mg/Kg), Broom (43.3 ± 6.4 mg/Kg), and Bracken (28.7 ± 2.7 mg/Kg) (Supplementary Table 1). Gorse was rich in chlorogenic acid (1.5 ± 0.1 g/Kg) and in general showed a higher content of all phenolic groups.
Among the 112 phenolic compounds analysed (Supplementary Table 1), 25 compounds accounted for 90% of total variance observed across all plants and largely influenced their characterisation. Correlation and contribution of each component plant and phenolic compound, respectively, to the composite PCA axes is given in Supplementary Tables 2, 3. The plot (Figure 1) revealed that flavonoids as well as cinnamic- and phenylpyruvic acid derivatives largely influenced the profile diversity. Relative position of plants as function of their phenolic profiles is provided in the Supplementary Figure 2 which shows a loose recapitulation of their phylogenetic grouping. Gorse, Broom, and Vetch, which belong to the Fabaceae family are expected to plot closer while distancing themselves from Bracken, Fireweed, and Buddleia. However, Gorse and Broom appeared to have a rather unique profile while Vetch plots closer to Bracken. Fireweed and Buddleia plot separately, reflecting their distinctive phenolic profiles.
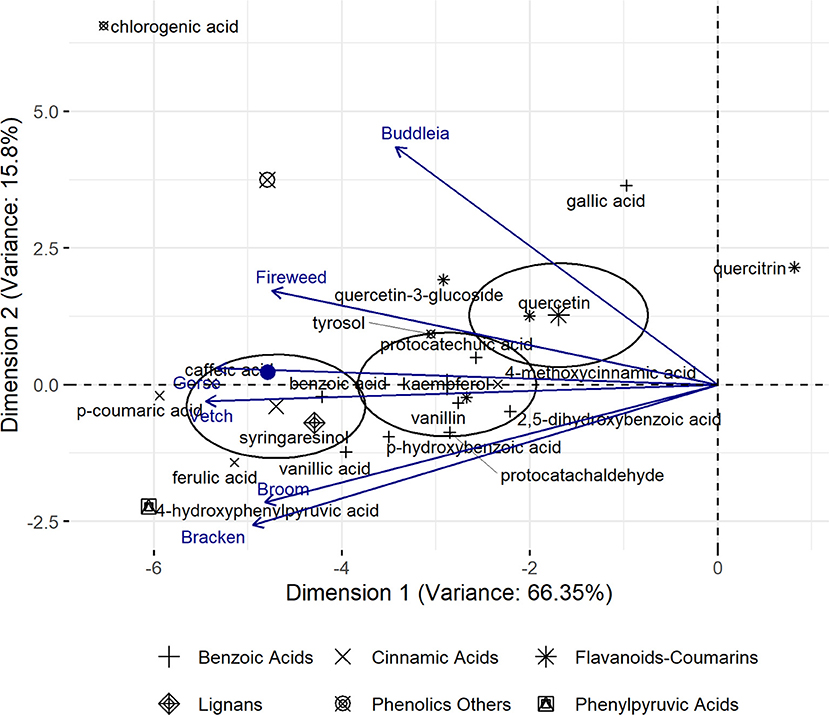
Figure 1. Principal Component Analysis (PCA, univariant-scaled) profile of Gorse, Vetch, Broom, Fireweed, Bracken, and Buddleia across six phenolic groups. Ellipses represent 95% confidence intervals beyond which loadings significantly driving plant characterisation are expected to plot. Relative similarity of plants represented as resultant vectors of contributing phenolic profile is indicated by their distance from the mean which is indicated as a filled blue circle along Dimension 1.
Pearson's test on cinnamic derivatives against phenylalanine (Table 2) reveals a strong positive correlation to cinnamic acid and 3,4,5-trimethoxycinnamic acid content across the six investigated plants (R2 = 0.92 and 0.94, respectively). Larger samples sizes may be required to corroborate this observation, although established biochemical pathways give some support to this observation (Hyun et al., 2011; Vargas-Tah and Gosset, 2015).
Based on the hits for GPS points classified under a given invasive plant family, their global and Scottish abundance are shown in Figure 2. In the global list of family abundance, among 635 families identified, Fabaceae featured second while Onagraceae ranked 39, Dennstaedtiaceae ranked 76, and Buddlejaceae ranked 245. The Scottish family abundance identified the presence of 131 families with Fabaceae ranking fourth, Onagraceae ranked 19 Dennstaedtiaceae ranked 52, and Buddlejaceae ranked 62.
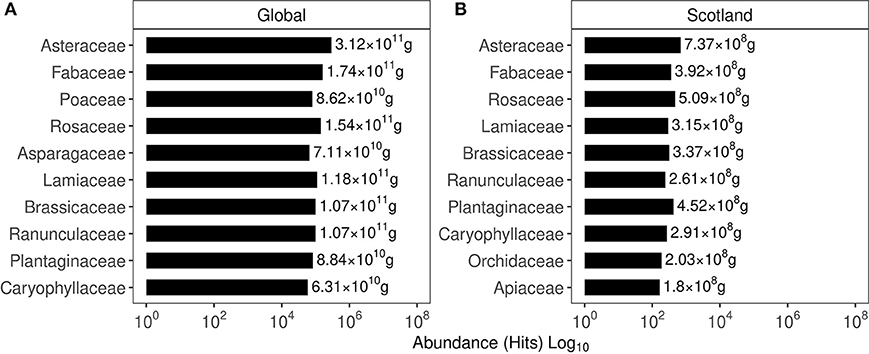
Figure 2. Abundance of the top 10 plant families based on their occurrence in the GIBF database. (A) Family abundance globally. (B) Family abundance in Scotland. Values express the protein content estimated in the biomass of these plants.
The expected resolution for such broad, satellite-based vegetation survey is between 120–250 m. The details are provided in the GPS uncertainty margins available in the GIBF database and an account of uncertainties and challenges in remote measurement is provided by Lawrence et al. (2006); Niphadkar and Nagendra (2016); Baron et al. (2018). At a shrub density between 45 and 70 Kg/m2 (Passioura, 1991), the mean biomass held in invasive plants is roughly 52.2 Tg, which translates to 26.1 Tg of carbon and 5.2 Tg of protein. Globally, annual protein requirement is 215 Tg. This could potentially supply about 2.5% of global annual protein requirements, assuming 1.2 g/Kg body weight of daily protein intake as recommended by the National Institutes of Health (NIH) (Phillips et al., 2016). In Scotland, the biomass held in invasive plants is roughly 448.27 Gg, which translates to 224.14 Gg of carbon and 45 Gg of protein. Scottish annual protein requirements are approximately 118.4 Gg, indicating that invasive plants could supply about 25% of annual protein requirements. Interestingly, in terms of minimum essential amino acids recommended by the World Health Organisation (WHO) (Joint WHO/FAO/UNU Expert Consultation, 2007), the estimated protein present in the invasive plant biomass could potentially satisfy about 3.5% of global annual requirements. Comparison of essential amino acids produced from existing agricultural products to the estimated values in the invasive plant mass is given in Figure 3 using global and Scottish datapoints. It was observed that the essential amino acid content of all invasive plants could satisfy partial global and Scottish dietary requirements from locally sourced invasive plants. Estimates of the individual essential amino acid content of commercial agricultural produce as well as the invasive plant biomass is provided in Supplementary Figure 4. The essential amino acid content in families to which the six plants investigated is shown in Figure 4 and the GPS locations were plotted on a map to understand their spread and identify areas most susceptible to their invasion in Figures 5, 6.
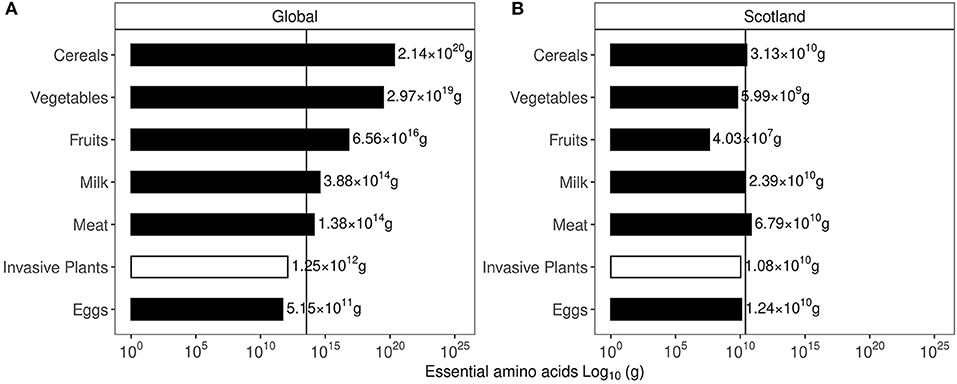
Figure 3. Estimated content of essential amino acid present in invasive plant biomass. (A) Values for global essential amino acid content of agricultural produce and invasive plant mass. (B) Values for Scottish essential amino acid content of agricultural produce and invasive plant mass.
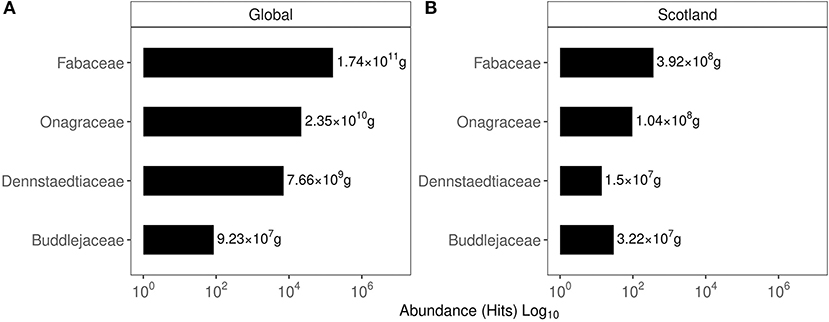
Figure 4. The relative abundance of the families of the plants investigated in this work based on their occurrence in the GIBF database. (A, B) Values represent the protein estimated in the invasive biomass.
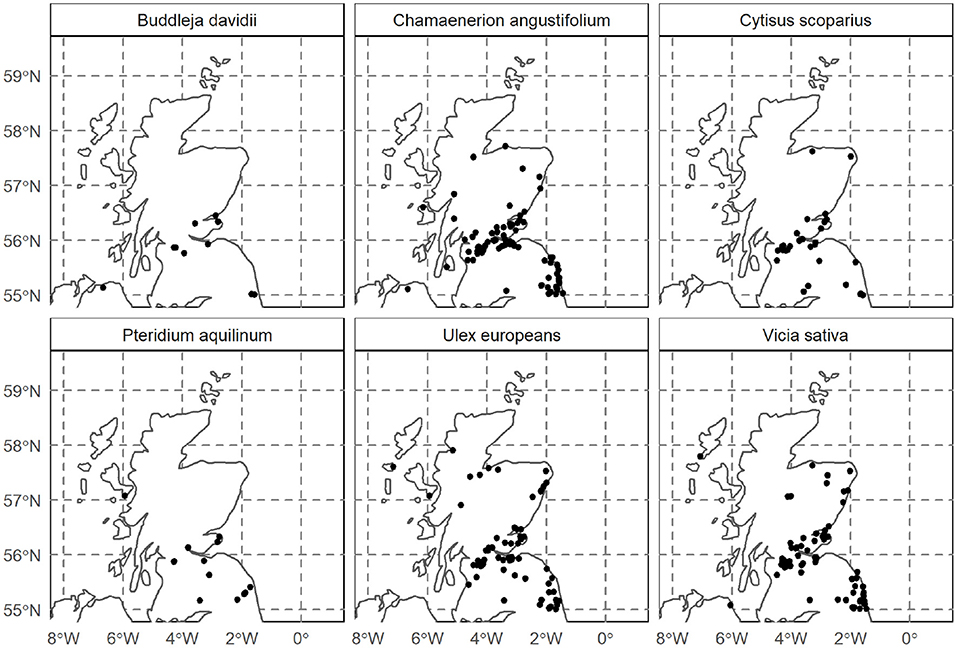
Figure 5. Invasive plant distribution in Scotland, identified using GPS-Satellite imagery.
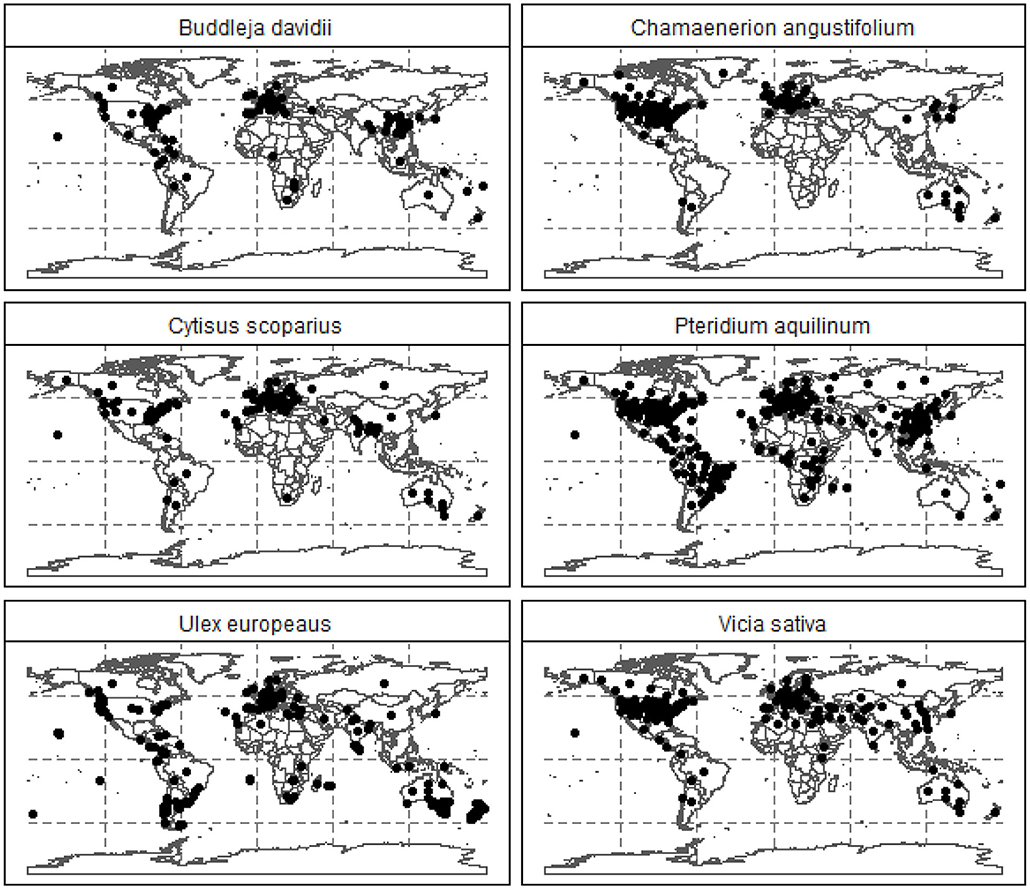
Figure 6. Global distribution of the six invasive plants investigated here.
Allocation of fertile land for food production and forestry has a major impact on global carbon storage (Smith et al., 2008). Of the available fertile land used for economic agriculture and forestry, 25.1% is used exclusively for animal husbandry, predominantly as meadows and pastureland (Figure 7). It is the single largest allocation in agricultural land use surpassing the combined value of all other actively developed land such as irrigated, planted, and organic and permanent crop land.
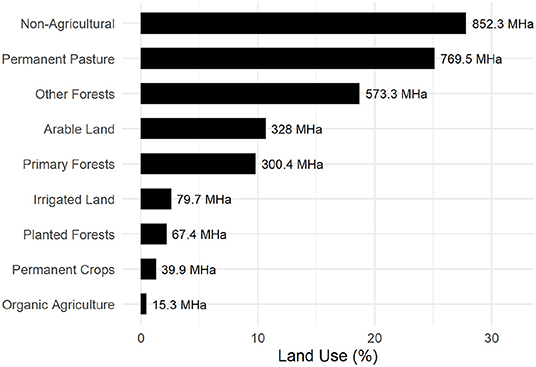
Figure 7. Global land use for Agricultural and Forestry (FAO, 2019).
Despite the landmass available for plant growth shown in Figure 7, emissions associated to high-energy agriculture, potentially offset any anabolic carbon storage. Animal husbandry contributes to 22% of total agricultural emissions through direct enteric fermentation via ruminants and a further 15% through manure management. This involves soil conditioning of crop and pastureland (Figure 8) or disposal, making it the single largest contributor of agricultural emission. Burning of organic matter, either as a means of crop/plant waste disposal or fresh land acquisition through “slash-and-burn” cultivation (Uhl, 1987; Kleinman et al., 1995; Brady, 1996) accounts for 17% of agricultural emissions.
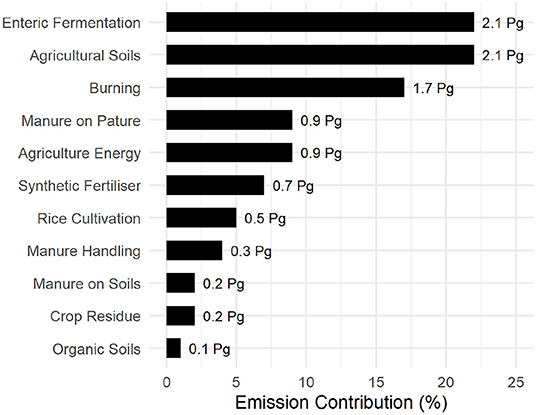
Figure 8. Global emissions from agriculture and associated land use compiled from FAOSTAT (FAO, 2019). Emission values are expressed in Petagram (Pg).
Effect of increased resource allocation to animal husbandry and its use as the dominant source of dietary protein can be observed in the carbon footprint to produce yield. Figure 9 illustrates the carbon-cost of common agricultural raw produce. Cumulative effect of enteric emissions and manure handling on the carbon footprint can be observed for ruminant meat such as cattle, goats, and buffalo, which is about 40 times higher than plant based or non-ruminant chicken produce.
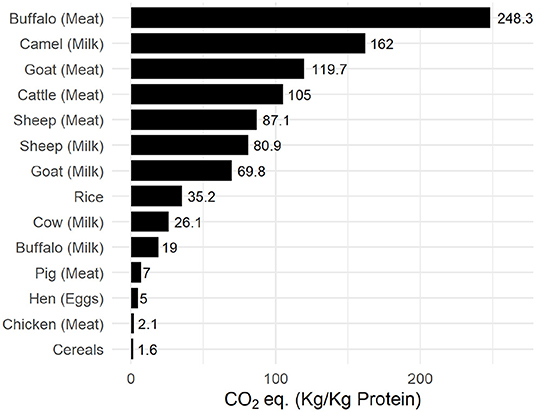
Figure 9. Carbon-impact of common agricultural produce. Data was compiled from FAOSTAT (FAO, 2019).
The initial database from FAOSTAT contained factors that were converted to intrinsic percentages where applicable. For example agricultural land area was converted to an intrinsic value relative to the individual country size. Each subset of agriculture-associated emissions was converted to a percentage of total agricultural emissions. The initial set of factors were: Bovine Meat (g/day), Livestock (LSU/ha), Pesticide (Kg/ha), Fertiliser (Kg/ha), per capita Emission (t), Agri Employment (% labour force), Enteric Fermentation (% agricultural emission), Crop Residue Burning (% emission), Agricultural Soils (% emission), Soil Manure (% emission), Pasture Manure (% emission), Manure Management (% emission), Synthetic Fertilisers (% emission), Animal Origin Emission (% emission), Grassland (% land area), Agricultural land (% land area), Arable Land (% land area), Cropland (% land area), Forest land (% land area), Permanent Pasture (% land area), Permanent Cropland (% land area), Shrubland (% land area), and Urbanisation (% land area).
Among the available factors, only those with a percentage deviation >100 were chosen as shown in Supplementary Figure 5. Factor analysis is optimal across independent factors with normally distributed data. Within a strict maximum cut-off value of |R2| > 0.4 and at a 99% confidence interval, correlation analysis found Livestock to have strong and significant associations with Urbanisation and Pesticide use (R2 = 0.79 and 0.45, p: 7.54 × 10⁻¹⁵ and 1.88 × 10⁻⁴, respectively). Since Livestock could be expressed as an equation of Urbanisation and Pesticide, it was filtered out. Lastly, the values for plant protein as a percentage of total protein produced (Plant.Production) failed the Royston test for normality and was filtered out. The final dataset contained six factors, namely, Permanent Cropland (Perm.Cropland), Shrubland, Urbanisation, Labour force in agriculture (Agri.employment), Pesticide use, and Permanent Pasture.
An exploratory factor analysis (EFA) using maximum likelihood (ML) suggested an optimal number of two latent factors (shown in Supplementary Figure 3) with corresponding correlations shown in Supplementary Table 4. The RMSR (root mean square of residuals) was 0.06. The RMSEA (root mean square of approximation) index was found to be 0.055 with a 90% confidence interval ranging from 0 to 0.205 and a BIC at −11.85. The Tucker-Lewis Index (TLI) was 0.88.
Based on the suggestions provided by EFA, a confirmatory analysis (CA) of a system equation model (SEM) was performed where the first latent factor (ML1) was expressed as an additive, non-interactive model comprised of Permanent Cropland, Permanent Pasture, and Shrubland, while the second latent factor was expressed as an additive, non-interactive model comprised of Employment, Pesticide use, and Urbanisation. The resultant model is depicted in Figure 10 below. The RMSEA of the model was 0.064 (10% confidence range: 0.00–0.167) and a comparative fit index (CFI) of 0.925. The standardised root mean square residual was 0.061.
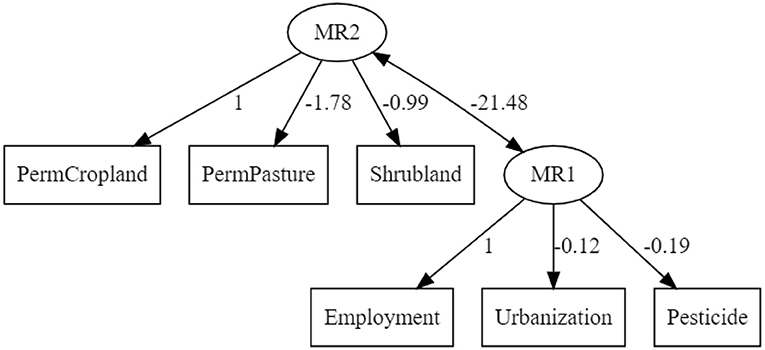
Figure 10. SEM-model constructed using intrinsic agricultural factors. Pesticide, pesticide used in tonnes; Urbanisation, percentage land area converted to artificial surfaces; Employment, percentage labour force in agriculture; PermCropland, percentage land area used as cropland; PermPasture, percentage land used as permanent pasture; and Shrubland, percentage marginal land.
As a complementary assessment, the PCA analysis of the selected high-variant intrinsic agricultural factors is shown in Figure 11 below. The plot accounts for 56.44% of total observed variance and it is interesting to note that countries, particularly the high and upper-middle income countries plot distinctly compared to the low and lowering middle income groups. This suggests that the emergent factor which can be elucidated over the factor analysis is the overall economic status of a country although no direct economic parameter such as GDP or per-capita income was fed into the factor analysis steps. Correlation and contribution of the factors and variables, respectively, to the composite axes is given in Supplementary Tables 5, 6.
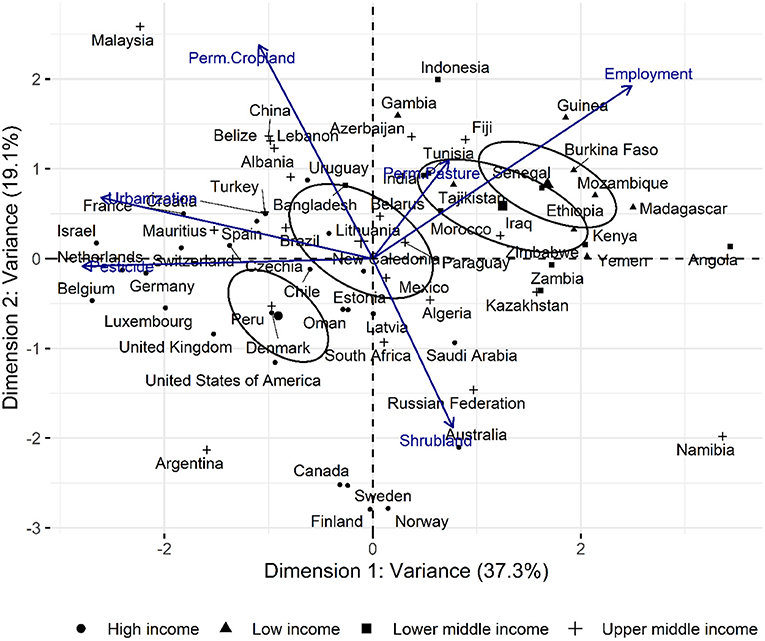
Figure 11. Principal component analysis (univariant-PCA) of countries according to permanent pasture (% of total land area), Shrubland/marginal land (% of total land area), LSU/ha, Plant protein production (plant protein produced as a percentage fraction of gross national protein produced), pesticide use (t), Urbanised land (% of total land area), permanent cropland (% of total land area), and Agriculture employment in agriculture (% labour force).
The strong association between land use and CO2 emissions was previously demonstrated by Smith et al. (2013) who suggested the reallocation of agricultural resources toward more climate-friendly plant-based cultivation. A detailed account of the carbon flow through the agricultural system was reported by Molotoks et al. (2018), which provides strong quantitative evidence of the contribution of fertiliser use and forest land reclamation toward emissions associated to food production. Complementary to their work, global agricultural data from FAOSTAT was used to identify trends that arise when high variable factors are assessed. The principle underpinning the factor analysis described was that the dynamics of a multicomponent system was a function of its most variable factors. In the principal component analysis (PCA) plot shown in Figure 11, vectors (high variant factors) drove the relative positioning of individual countries; revealing characteristic clustering (the emergent factor), which in this case reflected economic status. Diagonally opposing vectors function antithetically while those of similar orient amplify effect. A more defined relation between the factors is provided by the structural equation model (SEM) depicted in Figure 10 which, in conjunction with PCA revealed a strong association between the economy and land use and by extension, the emissions associated to agriculture. Shrubland was used a proxy for the marginal lands where native and introduced invasive plants are found. The opposing influence between shrubland and permanent cropland in the PCA plot reveals their contrasting effects in the characterisation of countries and their role in economic output as well as local ecology.
Maps showing the confirmed locations of invasive plants chosen for this study were identified using GPS-satellite imagery as shown in Figures 5 and 6. Among the families of the invasive plants chosen for this study, Fabaceae was highly represented in Scottish and global regions followed by Onagraceae, Dennstaedtiaceae, and Buddlejaceae. These plant families are in abundance in the North-East of Scotland. While satellite-imagery has improved over the decades and is invaluable in identifying endangered plant species and contributing toward conservation efforts, the work toward understanding the spread of invasive species remains relative nascent. The GPS locations from where the plant samples were obtained (see Materials and Methods) were not registered in the year 2020 database despite the plants having a sizeable coverage within those locations. Such errors decrease overall plant count and may underreport the severity of the problem faced on account of their spread. Molotoks et al. (2018) estimated agricultural carbon losses faced by invasive plant encroachment to 1 Pg, while according to estimates here based on satellite surveys, the total biomass present across all invasive plants is about 52 Tg. It is uncertain to what extent the biomass has been underestimated. It may be that recurring loss of agricultural biomass is caused by regular encroachment of invasive plants from the presently identified locations, which act as their natural reservoirs. Improved data collection is required to ameliorate uncertainties and help give a better estimate of the invasive biomass. Despite the possible underestimation, it was observed that the essential amino acid content of these plants may be sufficient to supplement Scottish and to some extent, global requirements.
Among the invasive plants investigated, Bracken was found to have the highest protein content (Table 1) and Vetch to contain the highest essential amino acid content in its constituent proteins (Table 2). However, in terms of protein accessibility easily achieved from mechanical grinding, Bracken and Gorse were found to have the highest soluble protein content (Table 1). However, the presence of potent carcinogens, namely, ptaquiloside (Niwa et al., 1983; O'Driscoll et al., 2016) found in Bracken makes it an unsuitable candidate until purification methods capable of removing these anti-nutrients are developed. In Vetch, only 15% of total protein was accessible, which was less than half that of Gorse, Broom, or Bracken. This may require further enzymatic or chemical extraction methods to fully realise the nutritional potential, but processes such as this may result in loss of essential amino acids depending on the nature of treatment. Traditional alkali-based extraction followed by neutralisation can result in severe loss of lysine and tryptophan (Jung et al., 2006) and generate significant effluent volumes, while the enzymatic procedures would substantially increase process cost (Sari et al., 2015).
Physical features differentiating leaves such as their hardness, affect the design used to effectively extract proteins, which is primarily governed by the plant cell-wall composition. It is interesting to note that Gorse, Broom, and Bracken are often subject to herbivory (Tempel, 1981; Broadfield and McHenry, 2019) and values of high lignin and NSP (Tables 3, 4) may reflect investment toward defensive mechanisms by toughening leaf mass or employing anti-nutrients; as in the case of Bracken (Niwa et al., 1983; O'Driscoll et al., 2016). The particularly woody nature of Gorse may be attributed to the high xylose content capable of producing branched, interlocking structures in conjunction with the lignin (Grantham et al., 2017; Gericke et al., 2018; Wierzbicki et al., 2019). When leaf samples are dried, this manifests as a brittle leaf structure making it amenable to crushing and juicing for protein extraction. Bracken and Broom leaf samples on the other hand show similar, but lower xylose content compared to Gorse, which in conjunction with a relatively lower lignin content and may have resulted in a more flexible leaf structures (Arola et al., 2013; Busse-Wicher et al., 2014).
Gorse has been prolific in more than 16 countries (Broadfield and McHenry, 2019); particularly in Oceania where it was introduced as an ornamental plant as well as to build natural barriers around private properties (Hoffmann and Broadhurst, 2016; Figure 6). Downstream process development for protein extraction using leaves from Gorse appears to be a lucrative solution of deriving nutrition as it had the highest protein recovery using economical methods such as mechanical grinding and buffer extraction. Although leaf proteins have previously faced disregard owing to low essential amino acids such as lysine, tryptophan and methionine, which were lost during traditional alkali extractions (Cuq et al., 1983; Zhang et al., 2017), improvements in throughput and reliability of ultrafiltration technology has since rendered the concern moot, as amino acid preservation is greater given the absence of any chemical treatment. All six plants studied plants exhibit a valuable essential amino acid profile (Table 1) suggesting that the final nutrient yield is a function of protein extractability.
The non-protein residue post-aqueous extraction appears to be rich in polysaccharides and lignin which could potentially be revalorised for use in other industries examples being; enzyme assisted ethanol production (Cheng et al., 2017) or use in paper industry. Left over marc has previously been demonstrated as an alternate substrate for edible mushrooms (Mintesnot et al., 2014; Kaszynski, 2016). Overall, the harvest index of such plants is high, as organs such as leaves and parenchyma-rich portions constitute about 48–55% of the plant mass (corresponding to Harvest Index of 0.48–0.55) compared to cereals with indices of about 0.3–0.45 (Singh and Stoskopf, 1971).
Gorse is also rich in soluble phenolics, particularly chlorogenic acid and major bioactive compounds such as phenylpyruvic-, benzoic-, and cinnamic acids derivatives. These compounds are commonly associated with health benefits owing to their anti-inflammatory and free radical-quenching properties (Ozcan et al., 2014; Shahidi and Ambigaipalan, 2015) and their role in maintaining gut health (Ozdal et al., 2016). The nutraceutical market is expected to grow to a value of around $10 billion by the year 2026 (Childs, 1999; Bröring and Cloutier, 2008; Research Markets, 2019) and with growing consumer demands and research investment in the plant-based “well-ness” industry, identification of viable and sustainable sources of bioactives is essential.
Invasive plants tend to have robust physiologies and faster germination times, which increase turnover and reduce income latency. Plants such as Gorse and Bracken grow rapidly during periods of spring, allowing harvest in early summer (Conway, 1957; Bowman et al., 2008). Harvesting and exploiting the nutritional value of such plants may help alleviate some of the burden on the existing agricultural systems to produce protein. Current terrestrial carbon held in vegetation amounts to 302.4 Pg (FAO, 2019) which is almost completely offset by animal husbandry industry. Since agricultural emission is a direct result of land use (Smith et al., 2008; Molotoks et al., 2018; Porter et al., 2019), land improvement and maintenance of pasture lands adds to the carbon cost of animal products as seen in Figure 8. Although classification of grazing land into rough grazing and maintained meadows is not available for all countries of the world, a significant portion is expected to be repurposed marginal land incapable of high-intensity farming (Asner et al., 2004; Peco et al., 2006). These sites tend to retain a considerable part of plant biodiversity and the native plants found in these sites come under enormous survival pressures from climate change, herbivory, and invasive plants and in many cases have been pushed to extinction (Duncan et al., 2004; Truscott et al., 2008; Lankau, 2012).
Given the average rise in global temperatures was recorded to be 1.96°C (2018–2019) (FAO, 2019; Roe et al., 2019), vulnerable economies, which are primarily agrarian are likely to face greater impact of adverse climatic conditions which could pivot them further into distress. A combination of novel, sustainable nutrition sources introduced through minimum disruption is essential to ensure continued livelihood and nutrition supply. The effect of conscious food choice on global carbon emission has been explored by Bajželj (2014) and Bajželj et al. (2014) and the comparison of scenarios across different food and production choices is quantitatively summarised by the EAT-Lancet Commission (Willett et al., 2019). This study strongly indicates the importance of reduction in the consumption of animal sources, while simultaneously moving away from intensive cultivation practises and instead focusing on food nutrition quality, rather than production yields. Leaf protein extraction technology could help harness the potential in revalorising the biomass of invasive plants, which is currently disposed of inefficiently and help toward production of alternate and more sustainable protein sources to complement existing food production.
Agriculture in our current economic system carries the burden of being a critical occupation for human survival, while having to maintain economic viability and now, faces the brunt of being a major contributor of anthropogenic GHG emissions. Based on the relationship between land resource allocation, emission and fiscal patterns observed in global agricultural data, the case is presented for revalorising invasive plants to ameliorate food insecurities. Marginal lands tend to serve as reservoirs for native plant species, which have now come under threat from excessive herbivory from unattended grazing, climate change and added competition from invasive plant species. Using databases cataloguing the location and spread of invasive plants through satellite imagery, Fabaceae species were found to be the second most abundant family globally, with the three most invasive species in Scotland belonging to this family. Among the six invasive plants investigated, Gorse (Ulex europaeus) was identified as a good candidate for implementation owing to its wide geographical spread, high protein extractability and potential of the co-products for further revalorisation efforts.
The raw data supporting the conclusions of this article will be made available by the authors, without undue reservation.
AI performed the experiments, data collection, and manuscript preparation. SD, CB, and WR supervised the work, helped with data interpretation, and preparation of manuscript. All authors contributed to the article and approved the submitted version.
This work was funded by the Scottish Government through RESAS as part of its strategic research programme.
The authors declare that the research was conducted in the absence of any commercial or financial relationships that could be construed as a potential conflict of interest.
We would like to thank William Rees and Teresa Grohmann for their time in helping with preparation of the manuscript. Jacqueline Wallace (Rowett Institute) and Robin Walker (SRUC) for providing plant samples. Donna Henderson and Jodie Park for technical assistance in NSP measurements. Susan Anderson for technical assistance in amino acid profiling. Gary Duncan and Lorraine Scobbie for technical assistance in phenolic profiling. Lisa Guerrier, Salomé Leveque (IUT- Clermont-Ferrand, France), who assisted and observed procedures as part of their lab-skill training. We would also like to thank Graham Horgan (BIOSS, Rowett Institute) for advise on the statistical analysis. We would like to thank the NHS for its incredible commitment to keeping us safe during these harsh times.
The Supplementary Material for this article can be found online at: https://www.frontiersin.org/articles/10.3389/fsufs.2021.575056/full#supplementary-material
Arola, S., Malho, J. M., Laaksonen, P., Lille, M., and Linder, M. B. (2013). The role of hemicellulose in nanofibrillated cellulose networks. Soft Matter. 9, 1319–1326. doi: 10.1039/C2SM26932E
Asner, G. P., Elmore, A. J., Olander, L. P., Martin, R. E., and Harris, A. T. (2004). Grazing systems, ecosystem responses, and global change. Annu. Rev. Environ. Resour. 29, 261–299. doi: 10.1146/annurev.energy.29.062403.102142
Bach Knudsen, K., Johansen, H., and Glitsø, V. (1997). Methods for analysis of dietary fibre - advantage and limitations. J. Anim. Feed Sci. 6, 185–206. doi: 10.22358/jafs/69515/1997
želj, B, and Richards, K. (2014). The positive feedback loop between the impacts of climate change and agricultural expansion and relocation. Land 3, 898–916. doi: 10.3390/land3030898
Bajželj, B, Richards, K. S., Allwood, J. M., Smith, P., Dennis, J. S., Curmi, E., et al. (2014). Importance of food-demand management for climate mitigation. Nat. Clim. Change 4, 924–929. doi: 10.1038/nclimate2353
Bano, Z., Srinivasan, K. S., and Srivastava, H. C. (1963). Amino acid composition of the protein from a Mushroom (Pleurotus sp.). Appl. Microbiol. 11, 184–187. doi: 10.1128/AM.11.3.184-187.1963
Barnes, W., and Anderson, C. (2017). Acetyl Bromide Soluble Lignin (ABSL) assay for total lignin quantification from plant biomass. Bio-protocol. 7:e2149. doi: 10.21769/BioProtoc.2149
Baron, J., Hill, D., and Elmiligi, H. (2018). Combining image processing and machine learning to identify invasive plants in high-resolution images. Int. J. Remote Sensing 39, 5099–5118. doi: 10.1080/01431161.2017.1420940
Bowman, G., Tarayre, M., and Atlan, A. (2008). How is the invasive gorse Ulex europaeus pollinated during winter? A lesson from its native range. Plant Ecol. 197, 197–206. doi: 10.1007/s11258-007-9370-1
Brady, N. C. (1996). Alternatives to slash-and-burn: a global imperative. Agric. Ecosyst. Environ. 58, 3–11. doi: 10.1016/0167-8809(96)00650-0
British Columbia Ministry of Forest (1996). Techniques and Procedures for Collecting, Preserving, Processing, and Storing Botanical Specimens. Victoria, BC. Available online at: https://www.for.gov.bc.ca/hfd/pubs/docs/wp/wp18.pdf (accessed 12 January, 2021).
Broadfield, N., and McHenry, M. T. (2019). A world of gorse: persistence of ulex europaeus in managed landscapes. Plants 8:523. doi: 10.3390/plants8110523
Bröring, S., and Cloutier, L. M. (2008). Value-creation in new product development within converging value chains: an analysis in the functional foods and nutraceutical industry. Br. Food J. 110, 76–97. doi: 10.1108/00070700810844803
Busse-Wicher, M., Gomes, T. C. F., Tryfona, T., Nikolovski, N., Stott, K., Grantham, N. J., et al. (2014). The pattern of xylan acetylation suggests xylan may interact with cellulose microfibrils as a twofold helical screw in the secondary plant cell wall of Arabidopsis thaliana. Plant J. 79, 492–506. doi: 10.1111/tpj.12575
Calder, A. G., Garden, K. E., Anderson, A. E., and Lobey, G. E. (1999). Quantitation of blood and plasma amino acids using isotope dilution electron impact gas chromatography/mass spectrometry with U- 13 C amino. Rapid Commun. Mass Spectrom. 13, 2080–2083. doi: 10.1002/(SICI)1097-0231(19991115)13:21<2080::AID-RCM755>3.0.CO;2-O
Cheng, N., Koda, K., Tamai, Y., Yamamoto, Y., Takasuka, T. E., and Uraki, Y. (2017). Optimization of simultaneous saccharification and fermentation conditions with amphipathic lignin derivatives for concentrated bioethanol production. Bioresour. Technol. 232, 126–132. doi: 10.1016/j.biortech.2017.02.018
Childs, N. M. (1999). Nutraceutical industry trends. J. Nutraceut. Funct. Med. Foods 2, 73–85. doi: 10.1300/J133v02n01_07
Cuq, J. C., Vié, M., and Cheftel, J. C. (1983). Tryptophan degradation during heat treatments: Part 2-Degradation of protein-bound tryptophan. Food Chem. 12, 73–88. doi: 10.1016/0308-8146(83)90019-5
Dassonville, N., Vanderhoeven, S., Vanparys, V., Hayez, M., Gruber, W., and Meerts, P. (2008). Impacts of alien invasive plants on soil nutrients are correlated with initial site conditions in NW Europe. Oecologia 157, 131–140. doi: 10.1007/s00442-008-1054-6
Day, L. (2013). Proteins from land plants - potential resources for human nutrition and food security. Trends Food Sci. Technol. 32, 25–42. doi: 10.1016/j.tifs.2013.05.005
Duncan, C. A., Jachetta, J. J., Brown, M. L., Carrithers, V. F., Clark, J. K., Ditomaso, J. M., et al. (2004). Assessing the economic, environmental, and societal losses from invasive plants on rangeland and wildlands 1. Weed Technol. 18, 1411–1416. doi: 10.1614/0890-037X(2004)018[1411:ATEEAS]2.0.CO;2
Dunnington, D. (2020). ggspatial: Spatial Data Framework for ggplot2. Available online at: https://cran.r-project.org/package=ggspatial
Eldridgea, D. J., Bowker, M. A., Maestreb, F. T., Roger, E., Reynold, J. F., and Whitforde, W. G. (2011). Impacts of shrub encroachment on ecosystem structure and functioning: towards a global synthesis. Ecol. Lett. 14, 709–722. doi: 10.1111/j.1461-0248.2011.01630.x
Englyst, H. N., and Hudson, G. J. (1996). The classification and measurement of dietary. Food Chem. 57, 15–21. doi: 10.1016/0308-8146(96)00056-8
Englyst, H. N., and John, H. (1984). Simplified method for the measurement of total non-starch polysaccharides by gas-liquid chromatography. Analyst 109, 937–942. doi: 10.1039/an9840900937
FAO (2019). FAOSTAT. Available online at: http://www.fao.org/faostat/en/#home (accessed February 4, 2020).
FAO IFAD UNICEF, WFP, WHO. (2020). The State of Food Security and Nutrition in the World 2020. Transforming Food Systems for Affordable Healthy Diets. Rome: FAO. doi: 10.4060/ca9692en Available online at: http://www.fao.org/state-of-food-security-nutrition/en/%0Ahttp://www.who.int/nutrition/publications/foodsecurity/state-food-security-nutrition-2017/
Field, A., Miles, J., and Field, Z. (2012). “Comparing several means: ANOVA (GLM1),” in Discovering Statistics Using R, 1st Edn. New Delhi: Sage, 398–461.
Fukushima, R. S., and Hatfield, R. D. (2001). Extraction and isolation of lignin for utilization as a standard to determine lignin concentration using the acetyl bromide spectrophotometric method. J. Agric. Food Chem. 49, 3133–3139. doi: 10.1021/jf010449r
Gericke, M., Gabriel, L., Geitel, K., Benndorf, S., Trivedi, P., Fardim, P., et al. (2018). Synthesis of xylan carbonates – an approach towards reactive polysaccharide derivatives showing self-assembling into nanoparticles. Carbohydr. Polym. 193, 45–53. doi: 10.1016/j.carbpol.2018.03.083
Goldschmidt, E. E., and Huber, S. C. (1992). Regulation of photosynthesis by end-product accumulation in leaves of plants storing starch, sucrose, and hexose sugars. Plant Physiol. 99, 1443–1448. doi: 10.1104/pp.99.4.1443
Grantham, N. J., Wurman-Rodrich, J., Terrett, O. M., Lyczakowski, J. J., Stott, K., Iuga, D., et al. (2017). An even pattern of xylan substitution is critical for interaction with cellulose in plant cell walls. Nat. Plants. 3, 859–865. doi: 10.1038/s41477-017-0030-8
Hajiha, H., and Sain, M. (2015). “The use of sugarcane bagasse fibres as reinforcements in composites,” in Biofiber Reinforcements in Composites,eds O. Faruk and M. Sain (Sawston, UK: Woodhead Publishing Ltd.), 525–549. doi: 10.1533/9781782421276.4.525
Harding, V. J., and MacLean, R. M. (1916). The ninhydrin reaction with amines and amides. J. Biol. Chem. 25, 337–350. doi: 10.1016/S0021-9258(18)87507-X
Hatfield, R., and Fukushima, R. S. (2005). Can lignin be accurately measured? Crop. Sci. 45, 832–839. doi: 10.2135/cropsci2004.0238
Hatfield, R. D., Grabber, J., Ralph, J., and Brei, K. (1999). Using the acetyl bromide assay to determine lignin concentrations in herbaceous plants: some cautionary notes. J. Agric. Food Chem. 47, 628–632. doi: 10.1021/jf9808776
Henchion, M., Hayes, M., Mullen, A., Fenelon, M., and Tiwari, B. (2017). Future protein supply and demand: strategies and factors influencing a sustainable equilibrium. Foods 6:53. doi: 10.3390/foods6070053
Hoffmann, B. D., and Broadhurst, L. M. (2016). The economic cost of managing invasive species in Australia. NeoBiota 31, 1–18. doi: 10.3897/neobiota.31.6960
Hojilla-Evangelista, M. P., Selling, G. W., Hatfield, R., and Digman, M. (2017). Extraction, composition, and functional properties of dried alfalfa (Medicago sativa L.) leaf protein. J. Sci. Food Agric. 97, 882–888. doi: 10.1002/jsfa.7810
Hyun, M. W., Yun, Y. H., Kim, J. Y., and Kim, S. H. (2011). Fungal and plant phenylalanine ammonia-lyase. Mycobiology 39, 257–265. doi: 10.5941/MYCO.2011.39.4.257
Joint WHO/FAO/UNU Expert Consultation (2007). Protein and Amino Acid Requirements in Human Nutrition: Report of a Joint. WHO Technical Report Series, 1–265.
Jung, S., Lamsal, B. P., Stepien, V., Johnson, L. A., and Murphy, P. A. (2006). Functionality of soy protein produced by enzyme-assisted extraction. JAOCS J. Am. Oil Chem. Soc. 83, 717–718. doi: 10.1007/s11746-006-1178-y
Kassambara, A., and Mundt, F. (2019). factoextra: Extract and Visualize the Results of Multivariate Data Analyses. Available online at: https://cran.r-project.org/package=factoextra
Kaszynski, K. J. (2016). Cultivating Oyster Mushrooms on Invasive Plants: An Alternative Substrate. Thesis, Wisconsin: Univsersity of Wisconsin-La Crosse. Available online at: http://digital.library.wisc.edu/1793/75737
Kleinman, P. J. A., Pimentel, D., and Bryant, R. B. (1995). The ecological sustainability of slash-and-burn agriculture. Agric. Ecosyst. Environ. 52, 235–249. doi: 10.1016/0167-8809(94)00531-I
Lê, S., Josse, J., and Husson, F. (2008). {FactoMineR}: a package for multivariate analysis. J. Stat. Softw. 25, 1–18. doi: 10.18637/jss.v025.i01
Lankau, R. A. (2012). Coevolution between invasive and native plants driven by chemical competition and soil biota. Proc. Natl. Acad. Sci. U.S.A. 109, 11240–11245. doi: 10.1073/pnas.1201343109
Lawrence, R. L., Wood, S. D., and Sheley, R. L. (2006). Mapping invasive plants using hyperspectral imagery and Breiman Cutler classifications (randomForest). Remote Sensing Environ. 100, 356–362. doi: 10.1016/j.rse.2005.10.014
Lester, G. E., Lewers, K. S., Medina, M. B., and Saftner, R. A. (2012). Comparative analysis of strawberry total phenolics via Fast Blue BB vs. Folin–Ciocalteu: assay interference by ascorbic acid. J. Food Compos. Anal. 27, 102–107. doi: 10.1016/j.jfca.2012.05.003
Lever, M. (1973). Colorimetric and fluorometric carbohydrate determination with p-hydroxybenzoic acid hydrazide. Biochem. Med. 8, 274–281. doi: 10.1016/0006-2944(73)90083-5
Lever, M. (1977). Carbohydrate determination with 4-hydroxybenzoic acid hydrazide (PAHBAH): effect of bismuth on the reaction. Anal. Biochem. 81, 21–27. doi: 10.1016/0003-2697(77)90594-2
Lishinski, A. (2018). lavaanPlot: Path Diagrams for Lavaan Models via DiagrammeR. Available online at: https://cran.r-project.org/package=lavaanPlot
Łuczaj, Ł. (2010). Changes in the utilization of wild green vegetables in Poland since the 19th century: a comparison of four ethnobotanical surveys. J. Ethnopharmacol. 128, 395–404. doi: 10.1016/j.jep.2010.01.038
Mintesnot, B., Ayalew, A., and Kebede, A. (2014). Evalutaion of biomass of some invasive weed species as substrate for Oyster Mushroom (Pleurotus spp.) cultivation. Pakistan J. Biol. Sci. 17, 213–219. doi: 10.3923/pjbs.2014.213.219
Molotoks, A., Stehfest, E., Doelman, J., Albanito, F., Fitton, N., Dawson, T. P., et al. (2018). Global projections of future cropland expansion to 2050 and direct impacts on biodiversity and carbon storage. Glob. Change Biol. 24, 5895–5908. doi: 10.1111/gcb.14459
Muramoto, K., Sunahara, S., and Kamiya, H. (1987). Measurement of tryptophan in peptides by acid hydrolysis in the presence of phenol and its application to the amino acid sequence of a sea anemone toxin. Agric. Biol. Chem. 51, 1607–1616. doi: 10.1271/bbb1961.51.1607
Nagy, S., Telek, L., Hall, N. T., and Berry, R. E. (1978). Potential food uses for protein from tropical and subtropical plant leaves. J. Agric. Food Chem. 26, 1016–1028. doi: 10.1021/jf60219a028
Neacsu, M., Vaughan, N., Raikos, V., Multari, S., Duncan, G. J., Duthie, G. G., et al. (2015). Phytochemical profile of commercially available food plant powders: their potential role in healthier food reformulations. Food Chem. 179, 159–169. doi: 10.1016/j.foodchem.2015.01.128
Niphadkar, M., and Nagendra, H. (2016). Remote sensing of invasive plants: incorporating functional traits into the picture. Int. J. Remote Sensing 37, 3074–3085. doi: 10.1080/01431161.2016.1193795
Niwa, H., Ojika, M., Wakamatsu, K., Yamada, K., Hirono, I., and Matsushita, K. (1983). Ptaquiloside, a novel norsesquiterpene glucoside from bracken, var. latiusculum. Tetrahedron Lett. 24, 4117–4120. doi: 10.1016/S0040-4039(00)88276-3
O'Driscoll, C., Ramwell, C., Harhen, B., Morrison, L., Clauson-Kaas, F., Hansen, H. C. B., et al. (2016). Ptaquiloside in Irish bracken ferns and receiving waters, with implications for land managers. Molecules 21:543. doi: 10.3390/molecules21050543
Ozcan, T., akpınar, A., Yilmaz-Ersan, L., and Delikanli, B. (2014). Phenolics in human health. Int. J. Chem. Eng. Appl. 5, 393–396. doi: 10.7763/IJCEA.2014.V5.416
Ozdal, T., Sela, D. A., Xiao, J., Boyacioglu, D., Chen, F., and Capanoglu, E. (2016). The reciprocal interactions between polyphenols and gut microbiota and effects on bioaccessibility. Nutrients 8:78. doi: 10.3390/nu8020078
Parker, I. M. (2000). Invasion dynamics of Cytisus scoparius: a matrix model approach. Ecol. Appl. 10, 726–743. doi: 10.1890/1051-0761(2000)010[0726:IDOCSA]2.0.CO;2
Passioura, J. B. (1991). Soil structure and plant growth. Aust. J. Soil Res. 29, 717–728. doi: 10.1071/SR9910717
Pebesma, E. (2018). Simple features for R: standardized Support for spatial vector data. R. J. 10, 439–446. doi: 10.32614/RJ-2018-009
Peco, B., Sánchez, A. M., and Azcárate, F. M. (2006). Abandonment in grazing systems: consequences for vegetation and soil. Agric. Ecosyst. Environ. 113, 284–294. doi: 10.1016/j.agee.2005.09.017
Phillips, S. M., Chevalier, S., and Leidy, H. J. (2016). Protein “requirements” beyond the RDA: implications for optimizing health. Appl. Physiol. Nutr. Metab. 41, 565–572. doi: 10.1139/apnm-2015-0550
Pinela, J., Carvalho, A. M., and Ferreira, I. C. F. R. (2017). Wild edible plants: Nutritional and toxicological characteristics, retrieval strategies and importance for today's society. Food Chem. Toxicol. 110, 165–188. doi: 10.1016/j.fct.2017.10.020
Pirie, N. (1932). Improved methods for the isolation of methionine and ergothioneine. Biochem. J. 27, 202–205.
Pirie, N. W. (1969a). The production and use of leaf protein. Proc. Nutr. Soc. 28, 85–91. doi: 10.1079/PNS19690017
Pirie, N. W. (1969b). Complementary ways of meeting the world's protein need. Proc. Nutr. Soc. 28, 255–262. doi: 10.1017/S0029665100100175
Pirie, N. W. (1977). A simple unit for extracting leaf protein in bulk. Exp. Agric. 13, 113–118. doi: 10.1017/S0014479700007705
Porter, J. R., Challinor, A. J., Henriksen, C. B., Howden, S. M., Martre, P., and Smith, P. (2019). Invited review: intergovernmental panel on climate change, agriculture, and food—a case of shifting cultivation and history. Glob. Change Biol. 25, 2518–2529. doi: 10.1111/gcb.14700
Pragna, P., Chauhan, S. S., Sejian, V., Leury, B. J., and Dunshea, F. R. (2018). Climate change and goat production: enteric methane emission and its mitigation. Animals 8:235. doi: 10.3390/ani8120235
Rainey, T. J., and Covey, G. (2016). “ Pulp and paper production from sugarcane bagasse,” in Sugarcane-Based Biofuels and Bioproducts, eds I. O'Hara and S. Mundree (Hoboken, NJ: John Wiley and Sons), 259–280. doi: 10.1002/9781118719862.ch10
Research Markets (2019). Global Nutraceuticals Market Report 2018: Market Accounted for $379.06 Billion in 2017 and Expected to Reach $734.60 Billion by 2026. Available online at: https://www.globenewswire.com/news-release/2019/01/29/1706747/0/en/Global-Nutraceuticals-Market-Report-2018-Market-Accounted-for-379-06-Billion-in-2017-and-Expected-to-Reach-734-60-Billion-by-2026.html (accessed February 4, 2020).
Revelle, W. (2020). psych: Procedures for Psychological, Psychometric, and Personality Research. Evanston, IL: Northwestern University. Available online at: https://cran.r-project.org/package=psych
Roe, S., Streck, C., Obersteiner, M., Frank, S., Griscom, B., Drouet, L., et al. (2019). Contribution of the land sector to a 1.5°C world. Nat. Clim. Change 9, 817–828. doi: 10.1038/s41558-019-0591-9
Rosseel, Y. (2012). {lavaan}: an {R} package for structural equation modeling. J. Stat. Softw. 48, 1–36. doi: 10.18637/jss.v048.i02
Russell, W. R., Labat, A., Scobbie, L., and Duncan, S. H. (2007). Availability of blueberry phenolics for microbial metabolism in the colon and the potential inflammatory implications. Mol. Nutr. Food Res. 51, 726–731. doi: 10.1002/mnfr.200700022
Sabaté, J., Sranacharoenpong, K., Harwatt, H., Wien, M., and Soret, S. (2015). The environmental cost of protein food choices. Public Health Nutr. 18, 2067–2073. doi: 10.1017/S1368980014002377
Sari, Y. W., Mulder, W. J., Sanders, J. P. M., and Bruins, M. E. (2015). Towards plant protein refinery: review on protein extraction using alkali and potential enzymatic assistance. Biotechnol. J. 10, 1138–1157. doi: 10.1002/biot.201400569
Shahidi, F., and Ambigaipalan, P. (2015). Phenolics and polyphenolics in foods, beverages and spices: antioxidant activity and health effects - a review. J. Funct. Foods 18, 820–897. doi: 10.1016/j.jff.2015.06.018
Shiferaw, H., Bewket, W., Alamirew, T., Zeleke, G., Teketay, D., Bekele, K., et al. (2019). Implications of land use/land cover dynamics and Prosopis invasion on ecosystem service values in Afar Region, Ethiopia. Sci. Total Environ. 675, 354–366. doi: 10.1016/j.scitotenv.2019.04.220
Singh, I. D., and Stoskopf, N. C. (1971). Harvest index in cereals. Agron. J. 63, 224–226. doi: 10.2134/agronj1971.00021962006300020008x
Slowikowski, K. (2020). ggrepel: Automatically Position Non-Overlapping Text Labels with “ggplot2”. Available online at: https://cran.r-project.org/package=ggrepel
Smith, P., Haberl, H., Popp, A., Erb, K., Lauk, C., Harper, R., et al. (2013). How much land-based greenhouse gas mitigation can be achieved without compromising food security and environmental goals? Glob. Change Biol. 19, 2285–2302. doi: 10.1111/gcb.12160
Smith, P., Martino, D., Cai, Z., Gwary, D., Janzen, H., Kumar, P., et al. (2008). Greenhouse gas mitigation in agriculture. Philos. Trans. R. Soc. B Biol. Sci. 363, 789–813. doi: 10.1098/rstb.2007.2184
South, A. (2017). rnaturalearth: World Map Data from Natural Earth. Available online at: https://cran.r-project.org/package=rnaturalearth
Tamayo Tenorio, A., Kyriakopoulou, K. E., Suarez-Garcia, E., van den Berg, C., and van der Goot, A. J. (2018). Understanding differences in protein fractionation from conventional crops, and herbaceous and aquatic biomass - consequences for industrial use. Trends Food Sci. Technol. 71, 235–245. doi: 10.1016/j.tifs.2017.11.010
Tempel, A. S. (1981). Field studies of the relationship between herbivore damage and tannin concentration in bracken (Pteridium aquilinum Kuhn). Oecologia 51, 97–106. doi: 10.1007/BF00344659
Truscott, A. M., Palmer, S. C., Soulsby, C., Westaway, S., and Hulme, P. E. (2008). Consequences of invasion by the alien plant Mimulus guttatus on the species composition and soil properties of riparian plant communities in Scotland. Perspect. Plant Ecol. Evol. Syst. 10, 231–240. doi: 10.1016/j.ppees.2008.04.001
Uhl, C. (1987). Factors controlling succession following slash-and-burn agriculture in Amazonia. J. Ecol. 75:377. doi: 10.2307/2260425
Vargas-Tah, A., and Gosset, G. (2015). Production of cinnamic and p-hydroxycinnamic acids in engineered microbes. Front. Bioeng. Biotechnol. 3, 1–10. doi: 10.3389/fbioe.2015.00116
Wei, T., and Simko, V. (2017). R Package “Corrplot”: Visualization of a Correlation Matrix. Available online at: https://github.com/taiyun/corrplot
Wickham, H. (2016). ggplot2: Elegant Graphics for Data Analysis. New York, NY: Springer-Verlag. Available online at: https://ggplot2.tidyverse.org
Wickham, H., François, R., Henry, L., and Müller, K (2020). dplyr: A Grammar of Data Manipulation. Available online at: https://cran.r-project.org/package=dplyr
Wierzbicki, M. P., Maloney, V., Mizrachi, E., and Myburg, A. A. (2019). Xylan in the middle: understanding xylan biosynthesis and its metabolic dependencies toward improving wood fiber for industrial processing. Front. Plant Sci. 10:176. doi: 10.3389/fpls.2019.00176
Willett, W., Rockström, J., Loken, B., Springmann, M., Lang, T., Vermeulen, S., et al. (2019). Food in the anthropocene: the EAT–lancet commission on healthy diets from sustainable food systems. Lancet 393, 447–492. doi: 10.1016/S0140-6736(18)31788-4
World Bank (2020). CO2 Emissions. Available online at: https://data.worldbank.org/indicator/EN.ATM.CO2E.KT (accessed June 2020, 18).
Xue, L., Liu, G., Parfitt, J., Liu, X., Van Herpen, E., Stenmarck, Å., et al. (2017). Missing Food, Missing Data? A Critical Review of Global Food Losses and Food Waste Data. Environ. Sci. Technol. 51, 6618–6633. doi: 10.1021/acs.est.7b00401
Keywords: plant protein, marginal lands, sustainable agriculture, net zero emissions, nutritional characterisation, invasive plants, essential amino acids, cyclic economy
Citation: Iyer A, Bestwick CS, Duncan SH and Russell WR (2021) Invasive Plants Are a Valuable Alternate Protein Source and Can Contribute to Meeting Climate Change Targets. Front. Sustain. Food Syst. 5:575056. doi: 10.3389/fsufs.2021.575056
Received: 22 June 2020; Accepted: 18 January 2021;
Published: 15 February 2021.
Edited by:
Rakesh Bhardwaj, National Bureau of Plant Genetic Resources (ICAR), IndiaReviewed by:
Aida Turrini, Council for Agricultural Research and Economics, ItalyCopyright © 2021 Iyer, Bestwick, Duncan and Russell. This is an open-access article distributed under the terms of the Creative Commons Attribution License (CC BY). The use, distribution or reproduction in other forums is permitted, provided the original author(s) and the copyright owner(s) are credited and that the original publication in this journal is cited, in accordance with accepted academic practice. No use, distribution or reproduction is permitted which does not comply with these terms.
*Correspondence: Wendy R. Russell, dy5ydXNzZWxsQGFiZG4uYWMudWs=
Disclaimer: All claims expressed in this article are solely those of the authors and do not necessarily represent those of their affiliated organizations, or those of the publisher, the editors and the reviewers. Any product that may be evaluated in this article or claim that may be made by its manufacturer is not guaranteed or endorsed by the publisher.
Research integrity at Frontiers
Learn more about the work of our research integrity team to safeguard the quality of each article we publish.