- 1Department of Agricultural and Applied Economics, Texas Tech University, Lubbock, TX, United States
- 2Texas A&M AgriLife Research, Lubbock, TX, United States
- 3School of Veterinary Medicine, Texas Tech University, Amarillo, TX, United States
The objective of this analysis was to integrate hydrologic, agronomic, and economic methods to evaluate various management strategies by changing crop acreage to better manage the declining resources of the Ogallala aquifer. A non-linear optimization model was used to estimate the optimal water use, crop mix, crop yield, and net returns over a 50 year period under dryland and deficit irrigation scenarios in the Texas High Plains. Results indicated that growers could maintain profitability by switching from fully irrigated center pivots to irrigating ½ and ¼ pivots.
Introduction
The Ogallala aquifer is the largest unconfined aquifer in the United States, covering over 450,000 km2 in parts of eight states: Nebraska, Texas, South Dakota, Wyoming, New Mexico, Kansas, Colorado, and Oklahoma (McGuire, 2017; TWDB, 2020). The Ogallala has an average 29 m of saturated thickness; however, excessive pumping has caused a depletion across much of the Great Plains. In Texas alone, the saturated thickness has declined >15 m since predevelopment in the 1950's (TWDB, 2020). The ability to irrigate crops has turned this semi-arid desert into one of the most productive agricultural regions in the world. The aquifer recharges through rainfall; however, in most counties recharge is 0–76 mm/year, far less than withdrawal (Deeds and Hamlin, 2015). As the saturated thickness of the aquifer has declined, this region has seen a shift in crop mix from more water-thirsty agricultural crops like corn to cotton (Colaizzi et al., 2009). Producers in some areas of the Texas High Plains are not able to fully irrigate entire pivots and are looking for deficit irrigation strategies to maximize water availability (Schneekloth et al., 2004; Rudnick et al., 2019). Developing new management practices that can maintain producer income will be required to adapt to reduced well capacities (Xue et al., 2017). A complete transition to dryland agriculture could potentially result in a loss of $1.6 billion annually (Yates et al., 2010; Lascano et al., 2020).
Optimization methods have been used to model the interaction between groundwater pumping, profitable cropping systems, and government policy. In the Southern Ogallala Aquifer region, Feng (1992) created a profit-maximizing dynamic programming model to determine optimal irrigated water use and cropping patterns from water availability. The objective function maximized net present value over a series of crops, cropping practices and irrigation technologies. Wheeler et al. (2008) analyzed the impact of short-term water rights buyout policies where land was removed from agricultural production, but allowed irrigation to resume after an allocated amount of time, and long-term buyout policy that switched to permanent dryland production. This study used the dynamic optimization model developed by Feng (1992) for nine counties in the Texas Southern High Plains. Yield estimates from the Environmental Policy Integrated Climate Model (EPIC) were used to build production functions (Williams et al., 1984). The results indicated that the long-term water buyout policy was more effective in reducing groundwater pumping, but the negative impact to the economy was greater than the short-term water buyout policy. Johnson et al. (2009) estimated the effect of a water pumping fee and a 50/50 quota policy that required 50% of the saturated thickness of the Ogallala aquifer to remain in 50 years. An IMPLAN input-output model was used to estimate the direct, indirect, and induced effects of each of the policy scenarios to determine the impact on regional economies (IMPLAN Group LLC, 2020). The 50/50 plan restricted water pumping more than the pumping fee, which resulted in a slower transition into dryland production.
The objective of this analysis was to successfully integrate hydrologic, agronomic, and economic methods to evaluate various management strategies by changing crop choices to better manage the dwindling resources of the Ogallala aquifer. This study builds on the models above by simulating aquifer drawdown to analyze the impact of declining water availability on the potential long-term economics of food and fiber production in the Texas High Plains using a non-linear dynamic optimization model by maximizing producer net returns projected over a 50 year time horizon. Management scenarios were created to analyze the profitability of reducing crop acreage and changing crop mix as a method to maximize water availability in a limited irrigation environment.
Materials and Methods
Due to the variability of saturated thickness and well capacity across the Southern Ogallala region, an aggregated model was estimated for one county in the Texas High Plains and a field-level analysis was conducted for a representative farm within that county to provide insight on producer profitability at a micro scale for various cropping systems. The model output provided an estimation of the optimal water use, crop mix, crop yield, and net returns over time.
Case Study Location and Data
The Texas Alliance for Water Conservation (TAWC) is a demonstration project located in the Texas High Plains that has worked with 36 growers covering over 2,400 ha−1 that began in 2005. Field sites were initially located in Hale and Floyd counties, but have expanded over time to Castro, Crosby, Deaf Smith, Lamb, Lubbock, Parmer, and Swisher Counties. As a consortium of growers, industry, universities, and government agencies, the TAWC seeks to maintain individual farm profitability and improve water use efficiency to extend the life of the Ogallala aquifer and the economic viability of rural communities. Detailed records of inputs and production practices are collected and analyzed across all TAWC field sites (Weinheimer et al., 2013; TAWC, 2020).
Hale County, Texas was selected as a case study location for this analysis because of the accessibility of grower data. This particular area represents an area transitioning from full irrigation to deficit and dryland production. From pre-development, saturated thickness in Hale County has declined more than 45 m (McGuire, 2017). While there are a few pockets of deeper saturated thickness, the northwestern part of the county has less than 15 years of useable life and the southeastern part of the county has already reached a saturated thickness of 9 m (Barbato, 2008). As saturated thickness declines, transitions into integrated and dryland systems are expected.
Hydrologic, agronomic, and economic data was used to perform this analysis. Aquifer characteristics such as saturated thickness, recharge, specific yield, depth to water, and well yield were retrieved from the High Plains Water District (2018). Irrigated and dryland crop acreage and average dryland yield were based on 10 year averages from (United States Department of Agriculture, 2019) (2008–2018). To determine profitability across each crop, economic data regarding price and variable expenses were averaged over the 2014–2018 Texas A&M AgriLife Extension crop and livestock budgets (Smith, 2014–2018). Prices used were $0.16 kg−1, $1.43 kg−1, $0.15 kg−1, and $.23 kg−1 for corn, cotton, sorghum, and wheat, respectively.
Quadratic production functions were created using a multiple regression analysis to estimate the yield-to-water relationship for each crop with TAWC grower data on yield and water applied. The production functions for corn and cotton are shown in Figure 1. Maximum corn yield occurs at 13,440 kg ha−1 and 1,780 kg ha−1 for cotton with 580 mm of irrigation.
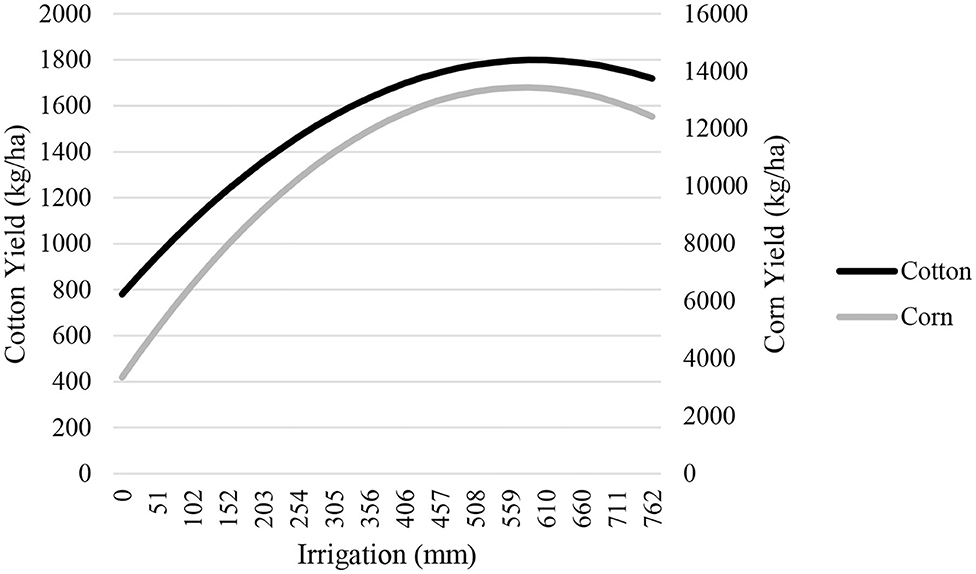
Figure 1. Corn and Cotton Production Functions estimated using field-level data from the TAWC producers using LEPA irrigation.
Economic Model
The production functions estimated from the TAWC producer data were input into a non-linear dynamic optimization model using the General Algebraic Modeling System (GAMS Development Corporation, 2019). The non-linear groundwater optimization model used in this analysis has an objective function to maximize producer profit over a 50 year projected period. The optimization routine runs iterations of possible yield and water combinations from the crop production functions and hydrologic characteristics of the aquifer to derive a solution that satisfies the objective function to:
where NPV is net present value, NRt is net revenue in time t, and r is the social discount rate. Net revenue is defined as:
where i represents the crops grown, k represents irrigation technology, Θ is the percentage of crop i produced using irrigation technology, k, during time t, Pi is the price of crop i, WAikt and WPikt are the water applied and water pumped from the aquifer, Yikt is crop yield, and Cikt are the costs of production. The model equations and constraints are:
Equations (3) and (4) are the two state variables, saturated thickness, ST, and pumping lift, X, where R is the recharge rate, PIA is the percentage of irrigated area expressed as the initial number of irrigated area in the county divided by the area of the county above the aquifer, and SY is the specific yield of the aquifer. Equation (5) calculates the total water pumped for each crop and Equation (6) restricts the total amount of water pumped to be less than or equal to the pumping capacity. Equation (7) represents the gross pumping capacity, where IST is the initial saturated thickness, WY is the well yield, AW is the area per well, and IGPM is the amount of water pumped per gallon per minute. Equation (8) calculates the pumping cost as a function of the energy use factor for electricity, EF, lift, X, price of electricity, EP, pump efficiency, EFF, and the water pumped, WP. The height of a column of water that will exert 1 psi = 6.895 kPa. Equation (9) is the total cost calculation, where VPC is the variable cost of production, PC is the pumping cost estimated in Equation (8), HC is the harvest cost, MC is the irrigation system maintenance cost, DP represents the depreciation of the irrigation system, and LC is the labor cost. Equation (10) restricts the crop area percentage over all crops over all irrigation systems to be <1 or = to 1, and Equation (11) is a non-negativity constraint, where Ω represents all decision variables. A 3% discount rate was used in the NPV analysis.
Results
County Baseline
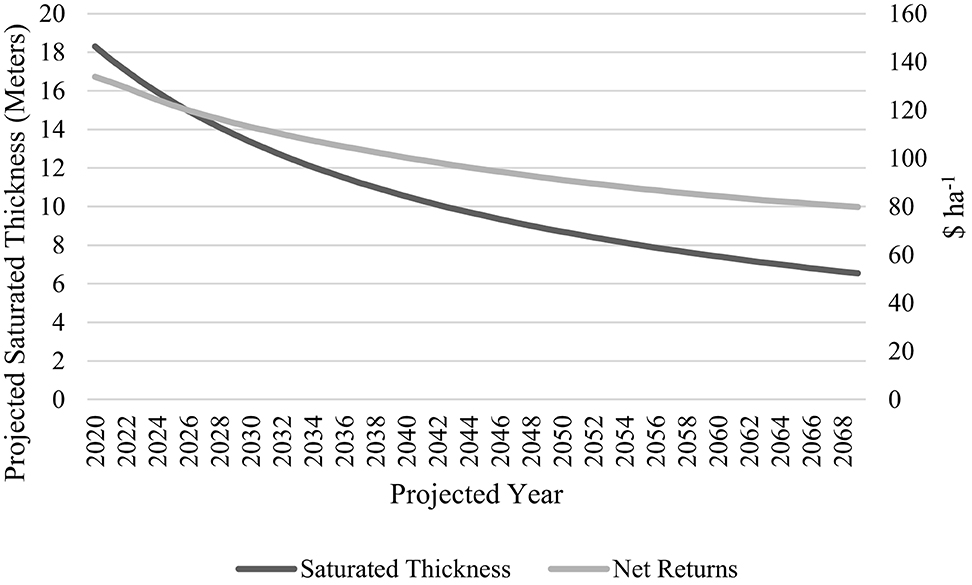
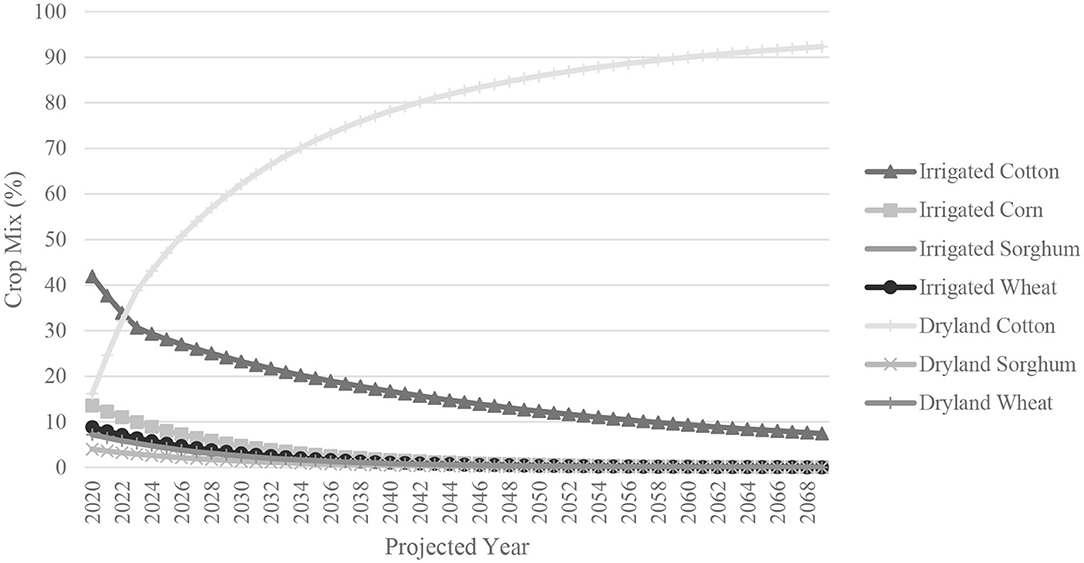
Results from the aggregated county baseline model for saturated thickness, net returns, and the percentage of irrigated crops are shown in Table 1 and Figures 2–4. Initial starting saturated thickness began at 18 m and declined to 7 m by the end of year 50 (2069) (Table 1, Figure 2). Across the 50 year time period, crop yields averaged 1,630 kg ha−1 for cotton, 12,690 kg ha−1 for corn, 7,790 kg ha−1 for sorghum, and 2,130 kg ha−1 for wheat. As saturated thickness declines, net returns across the time period declined from $134 ha−1 to $79 ha−1 with an NPV of $2,799 ha−1 over the entire projected period (Table 1, Figure 2). Figure 3 depicts the optimal crop mix for the county. Initially, the crop mix was 42% irrigated cotton, 14% irrigated corn, 8% irrigated sorghum and wheat, 16% dryland cotton, 4% dryland sorghum, and 7% dryland wheat. By the end of the projected period the crop mix was 92% dryland cotton, 7% irrigated cotton, and the other 2% was a negligible combination of dryland sorghum and wheat.
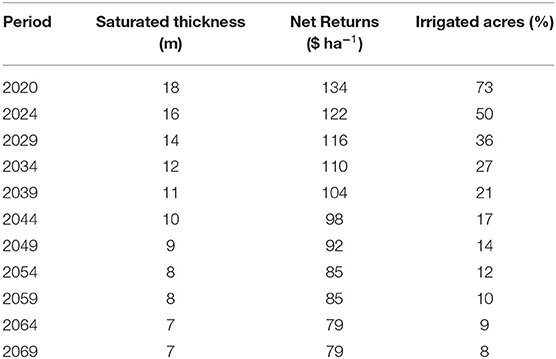
Table 1. Saturated thickness, net returns, and the percentage of irrigated acres in Hale County, Texas projected over a 50 year time period.
Field-Level Scenarios
A scenario analysis was performed to understand the long-term impact of various cropping systems at the field level. Based on the results from the county analysis, nine scenarios were created from combinations of corn and cotton production. Wheat and sorghum were not included in the field-level analysis due to a lack of impact at the county level. These scenarios are summarized in Table 2. These scenarios focus on one center pivot covering 49 ha−1 and 16 ha−1 of dryland cotton corners for a total of 65 ha−1. The scenarios were ranked by greatest amount of net present value.
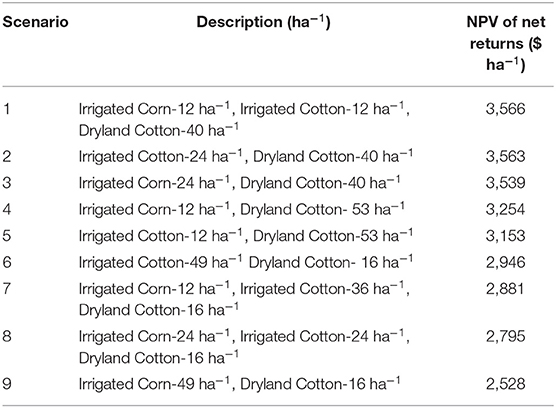
Table 2. Field-level scenarios ranked by net present value of net returns for a representative farm in Hale County, Texas.
While corn is a high-value agricultural crop, corn yields do not meet maximum yield potential in the Texas High Plains due to the semi-arid climate of the region, resulting in comparable profitability with cotton. The increased pumping cost for corn resulted in higher variable expenses and thus, lower profit. Since the profitability of corn and cotton were similar, the scenario results were primarily influenced by the amount of irrigated area, resulting in three distinct outcomes.
Scenarios 1, 2, and 3 were systems with 24 ha−1 of irrigation and 40 ha−1 of dryland cotton. These scenarios produced comparable results. Scenario 1 consisted of a ¼ pivot of irrigated corn (12 ha−1), a ¼ pivot of irrigated cotton (12 ha−1), and 40 ha−1 of dryland cotton. Average corn yield across was 12,740 kg ha−1 for corn and 1,650 kg ha−1 for irrigated cotton. The yield for dryland cotton was 540 kg ha−1 across all scenarios. This scenario generated the highest profitability over time with a net present value of net returns of $3,566 ha−1. Scenario 2 consisted of 24 ha−1 of irrigated cotton and 40 ha−1 of dryland cotton, which generated a NPV of $3,563/ha−1. Irrigated cotton yields averaged 1,650 kg ha−1 with 356 mm of water applied. Scenario 3 consisted of 24 ha−1 of corn and 40 ha−1 of dryland cotton and generated a NPV of $3,539 ha−1 (Table 2). Irrigated corn yields averaged 12,740 kg ha−1 with 432 mm of water applied. The nine crop scenarios resulted in three distinct water use patterns (Figure 4). Saturated thickness for Scenarios 1, 2, and 3 began at 18 m and declined to 8 m by year 50. Projected net returns over time are shown in Table 4 and Figure 5. As water availability declines, the amount of water that was able to be allocated to crops was also reduced, therefore resulting in lower net returns. In Scenario 1, 2, and 3, net returns were $179 ha−1, $174 ha−1, and $183 ha−1 respectively, in the beginning of the time period. By the end of the period, net returns were $87 ha−1 for Scenarios 1 and 2 and $86 ha−1 for Scenario 3 (Table 4). The crop mix for Scenarios 1, 2, and 3 began with 38% irrigated ha−1 and 62% dryland ha−1. Under these scenarios, irrigation remains constant for the first 15 years in Scenarios 1 and 2. By year 30 of the projection, the ability to irrigate sufficiently drops down to a ¼ of a pivot before essentially becoming a completely dryland farm. Scenario 3 maintains irrigation for the first 10 years into the forecast, and by year 25, can realistically irrigate ¼ of a pivot before becoming dryland (Table 5, Figure 6).
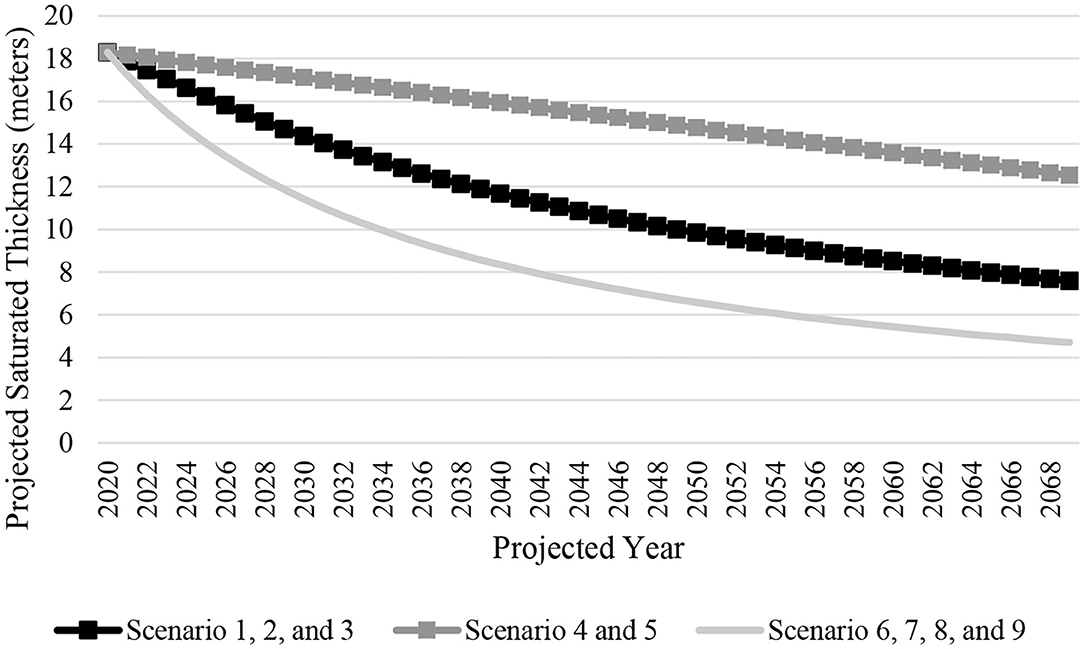
Figure 4. Projected saturated thickness (m) across nine field-level scenarios for a representative farm in Hale County, Texas.
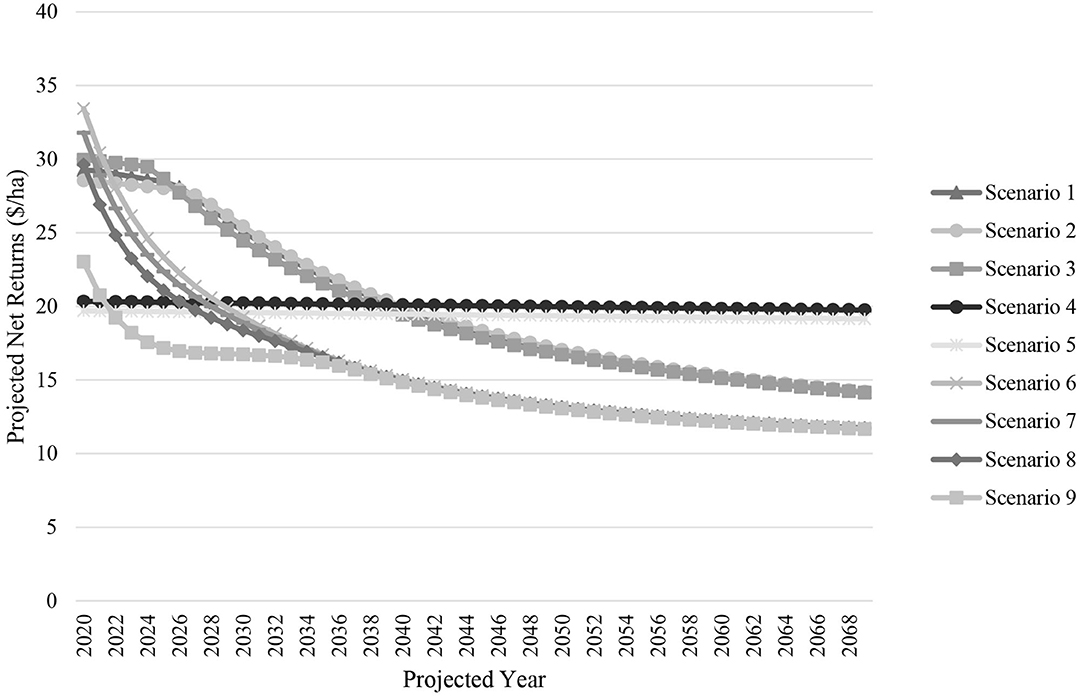
Figure 5. Projected net returns ($ ha−1) across nine field-level scenarios for a representative farm in Hale County, Texas.
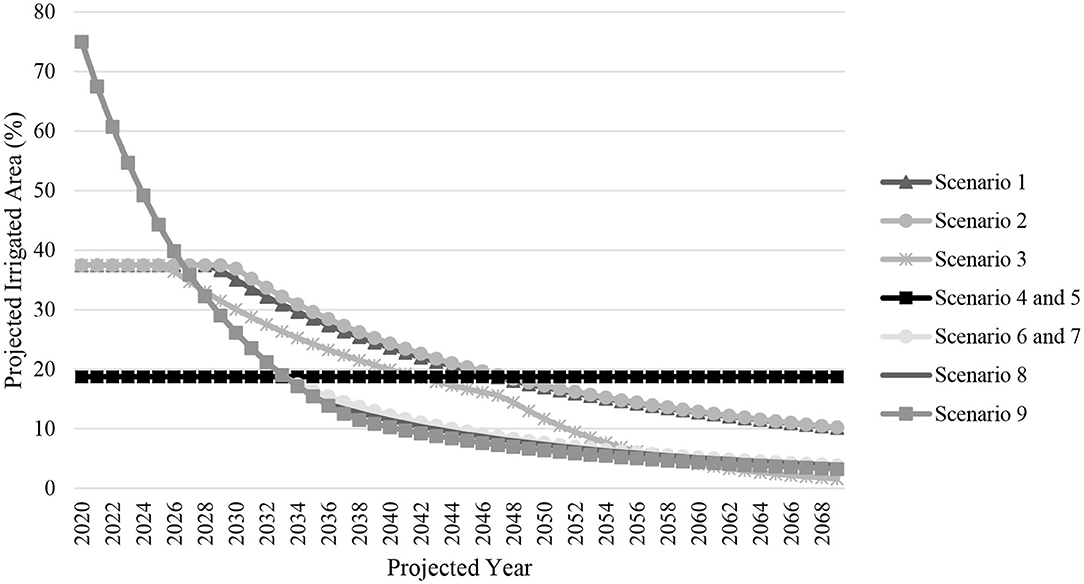
Figure 6. Projected irrigated area (%) across nine field-level scenarios for a representative farm in Hale County, Texas.
Scenarios 4 and 5 were systems with 12 ha−1 of irrigation and 53 ha−1 of dryland cotton. These scenarios produced similar results. Scenario 4 represented a ¼ pivot of irrigated area consisting of 12 ha−1 planted to irrigated corn and 53 ha−1 planted to dryland cotton. In this scenario, corn yields averaged 13,250 kg ha−1 with 508 mm of water applied and generated a NPV of $3,254 ha−1. Scenario 5 represented a ¼ pivot (12 ha−1) planted to irrigated cotton and 53 ha planted to dryland cotton. Irrigated cotton yields averaged 1,680 kg ha−1 using 406 mm of water applied, which generated a NPV of NR of $3,153 ha−1 (Table 2). Since both scenarios used the least amount of irrigation, they had the least impact on saturated thickness, which only declined 5 m throughout the time period (Table 3, Figure 4). Net returns for both scenarios were also consistent over time with an annual average income of $122-$118 ha−1, respectively (Table 4, Figure 5). Irrigated area did change due to the fact that irrigation could continue in the long term (Table 5, Figure 6).
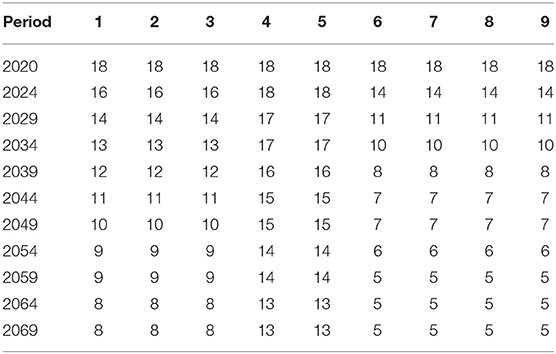
Table 3. Projected saturated thickness (m) across nine field-level scenarios for a representative farm in Hale County, Texas.
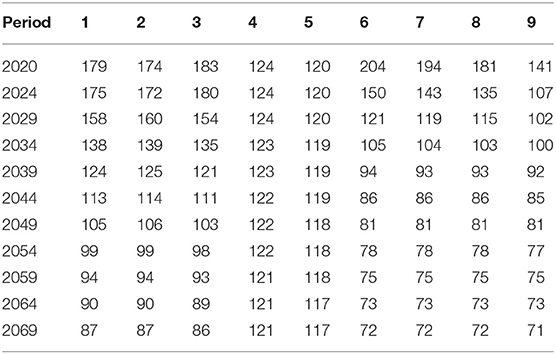
Table 4. Projected net returns ($ ha−1) across nine field-level scenarios for a representative farm in Hale County, Texas.
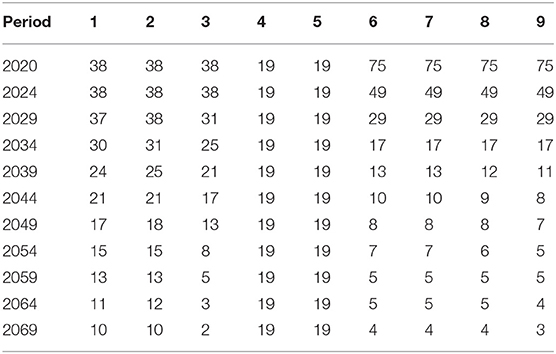
Table 5. Projected irrigated area (%) across nine field-level scenarios for a representative farm in Hale County, Texas.
Scenarios 6–9 were systems with the greatest amount of irrigation with 49 ha−1 and 16 ha−1 of dryland cotton. Scenario 6 represented a whole pivot dedicated to irrigated cotton (49 ha−1) plus 16 ha−1 dryland corners. This scenario generated average cotton yields of 1,610 kg ha−1 using 330 mm of water applied. Scenario 7 was a ¼ pivot (12 ha−1) of corn, ¾ pivot (36 ha−1) of irrigated cotton and dryland corners (16 ha−1) planted to cotton. Irrigated corn averaged 12,560 kg ha−1 with 406 mm of water applied and 1,600 kg ha−1 of cotton irrigated with 330 mm. Scenario 8 was ½ pivot (24 ha−1) of corn, ½ pivot (24 ha−1) of cotton, plus dryland cotton corners (16 ha−1). Irrigated corn in this scenario averaged 12,430 kg ha−1 with 406 mm of irrigation and irrigated cotton averaged 1,580 kg ha−1 with 330 mm. The least revenue-generating scenario assessed was Scenario 9, which was a whole pivot of corn (49 ha−1) and 16 ha−1 of dryland corners. Corn yields averaged 12,240 kg ha−1 with 381 mm of water. Scenarios 6–9 generated $2,946, $2,881, $2,795, and $2,528 ha−1 of NPV, respectively (Table 2). These scenarios had the most irrigated acres, which therefore depleted saturated thickness with a total change of 14 m. Scenarios 6, 7, and 8 had the greatest amount of water use, which resulted in a decline in saturated thickness from 18 m to 5 m (Table 3, Figure 4). Net returns began at $204, $194, $181, and $141 ha−1 and declined to $71 ha−1. Each of these scenarios started as a fully irrigated pivot (Table 4, Figure 5). Within five years of heavy irrigation, a switch to half a pivot would have to occur. Between 2025 and 2035, there may be enough water availability to irrigate a quarter of a pivot before a shift to dryland (Table 5, Figure 6).
Discussion and Conclusion
In a semi-arid environment such as the Texas High Plains, a dryland system of dryland row crops, forages and native grassland will be the most profitable as growers transition out of irrigated row crop production. This analysis produced future time paths to understand the potential food and fiber production possibilities as this region begins to transition to dryland production at both an aggregated county scale and at the micro-level. This research can help to determine the best management practices and technologies to maximize producer profit and increase water use efficiency in deficit irrigation and dryland scenarios. By identifying the comparative advantage of land use, this research will provide a strong foundation for the development of new evidence-based strategies to ensure understanding of areas that are most at risk due to water decline.
Results from this analysis indicate that growers irrigating entire pivots in Hale county will significantly exacerbate aquifer decline and increase the rate of transition to dryland crop production (Scenarios 6 and 9). Irrigating a full pivot (Scenarios 6–9) resulted in average corn yields of 12,240 kg ha−1 and 1,610 kg ha−1 for cotton using 381 mm of irrigation on corn and 330 mm of water applied to cotton. However, a grower could reduce irrigation to a ¼ pivot and maintain deficit irrigation in the long-term (Scenarios 4 and 5). The most profitable crop mixes in the long-term were from irrigating ½ of a pivot. Irrigating half of a pivot (Scenarios 1–3) resulted in an increase of corn yield to 12,740 kg ha−1 on 432 mm of water applied and cotton yields of 1,650 kg ha−1 on 356 mm of water applied. Results indicated the greatest crop yields were achieved when irrigated area was reduced to ¼ of a pivot (Scenarios 4–5), with corn yields averaging 13,240 kg ha−1 irrigated with 508 mm of water applied and 1,680 kg ha−1 of cotton irrigated with 432 mm of water applied. Concentrating irrigation on a smaller area resulted in higher irrigated profitability, but when dryland ha−1 were included as a system, it was actually the least profitable.
Understanding how drought impacts our water use and ability to grow crops/livestock will provide better predictions of human adaptation and inform new social and economic strategies to cope in our dryland future. Irrigated land will need to be monitored closely, but there are options available to extend irrigation crop production and maintain profitability in a dryland environment.
There are some limitations to this study which could impact the results. For example, this analysis assumed no government intervention and did not consider groundwater polices, which could change the rates of water withdrawal. Further, this study did not consider climate impacts or rainfall variability. In this analysis, dryland crop yields were held static over time. Naturally, dryland crop yield will change with regard to the amount of rainfall received and improved technological advancements in genetic productivity over time. Increased rainfall will also impact aquifer recharge, which was assumed to be zero. The crop production functions used in this analysis determine crop yield and thus, profitability. While these functions were estimated using actual producer data from 2005–2018, it might not be reflective of production across the entire county. While it was impossible to analyze all potential crop scenarios, wheat and sorghum rotations can be profitable enterprises. With regard to wheat, we did not analyze the impact of grazing, which should positively impact profitability and can be a good option for growers. Other alternative crops exist, which we did not attempt to analyze here.
Data Availability Statement
The datasets generated for this study are available on request to the corresponding author.
Author Contributions
DM-M was responsible for running the economic model and writing the manuscript. RM assisted with writing the manuscript. PJ provided the production functions. RW helped to conceptualize the paper and assist in writing the manuscript.
Funding
Funding for this project came from the USDA ARS Ogallala Aquifer Program and USDA Project No. 2016-68007-25066, through the National Institute for Food and Agriculture's Agriculture and Food Research Initiative, Water for Agriculture Challenge Area.
Conflict of Interest
The authors declare that the research was conducted in the absence of any commercial or financial relationships that could be construed as a potential conflict of interest.
Acknowledgments
The authors would like to acknowledge Dr. Bridget Guerrero for assistance compiling the economic budgets.
References
Barbato, L. (2008). Ogallala Maps: Estimated Useable Aquifer Lifetime. Texas Tech University Center for Geospatial Technology. Available online at: https://www.depts.ttu.edu/geospatial/center/Ogallala/MapSeries/PDFs/08_useableLifetime_8x11.pdf (accessed January 4, 2021).
Colaizzi, P. D., Gowda, P. H., Marek, T. H., and Porter, D. O. (2009). Irrigation in the Texas high plains: a brief history and potential reductions in demand. Irrigation Drainage 58, 257–274. doi: 10.1002/ird.418
Deeds, N. E., and Hamlin, S. (2015). Final Conceptual Model Report on the High Plains Aquifer System Groundwater Availability Model. Intera, Inc and the Bureau of Economic Geology at the Univeristy of Texas, Austin. Report Prepared for the Texas Water Development Board. Available online at: https://www.twdb.texas.gov/groundwater/models/gam/hpas/HPAS_GAM_Conceptual_Report.pdf (accessed January 4, 2021).
Feng, Y. (1992). Optimal intertemporal allocation of groundwater for irrigation in the Texas high plains (Unpublished Doctoral Dissertation). Texas Tech University, Lubbock, TX, United States.
GAMS Development Corporation (2019). General Algebraic Modeling System (GAMS) Release 71.1.0. Fairfax, VA, USA.
High Plains Water District (2018). Irrigation Assessment-Program Results. Available online at: https://static1.squarespace.com/static/53286fe5e4b0bbf6a4535d75/t/5c9e8711419202f58e5b315a/1553893139473/2018-2019+IAP+Results.pdf (accessed January 21, 2020).
Johnson, J., Johnson, P. N., Segarra, E., and Willis, D. (2009). Water conservation policy alternatives for the ogallala aquifer in Texas. Water Policy 11, 537–552. doi: 10.2166/wp.2009.202
Lascano, R. J., Leiker, G. R., Goebel, T. S., Mauget, S. A., and Glitz, D. C. (2020). Water balance of two major soil types of the Texas high plains: implications for dryland crop production. Open J. Soil Sci. 10, 274–97. doi: 10.4236/ojss.2020.107015
McGuire, V. L. (2017). Water-Level and Recoverable Water in Storage Changes, High Plains Aquifer, Predevelopment to 2015 and 2013–15: U.S. Geological Survey Scientific Investigations Report 2017–5040. Available online at: https://doi.org/10.3133/sir20175040 (accessed January 28, 2020).
Rudnick, D., Irmak, S., Chavez, J. L., Kisekka, I., Marek, T. H., Schneekloth, J. P., et al. (2019). Deficit irrigation management of maize in the high plains aquifer region: a review. J. Am. Water Resour. Assoc. 55, 38–55. doi: 10.1111/1752-1688.12723
Schneekloth, J. P., Kaan, D. A., and Pritchett, J. (2004). “Determining crop mixes for limited irrigation,” in Proceedings of the 2004 Central Plains Irrigation Short Course Exposition (Colby, KS: Central Plains Irrigation Association).
Smith, J. (2014–2018). Texas Crop and Livestock Budgets – District 2 – South Plains. College Station, TX: Department of Agricultural Economics, Texas A&M AgriLife Extension.
Texas Alliance for Water Conservation (TAWC) (2020). About. Available online at: https://www.depts.ttu.edu/tawc/about.php (accessed January 28, 2020).
Texas Water Development Board (TWDB) (2020). Ogallala Aquifer. Available online at: http://www.twdb.texas.gov/groundwater/aquifer/majors/ogallala.asp (accessed January 28, 2020).
United States Department of Agriculture (2019). National Agricultural Statistics Service (NASS). 2019. QuickStats. Available online at: https://www.nass.usda.gov/Quick_Stats/ (accessed January 28, 2020).
Weinheimer, J., Johnson, P., Mitchell, D., Johnson, J., and Kellison, R. (2013). Texas high plains initiative for strategic and innovative irrigation management and conservation. Universities Council on Water Resources. J. Contemp. Water Res. Educ. 151, 42–49. doi: 10.1111/j.1936-704X.2013.03150.x
Wheeler, E., Golden, B., Johnson, J., and Peterson, J. (2008). Economic efficiency of short-term versus long-term water rights buyouts. J. Agric. Appl. Econ. 40, 493–501. doi: 10.1017/S1074070800023786
Williams, J. R., Jones, C. A., and Dyke, P. T. (1984). A modelling approach to determining the relationship between erosion and soil productivity. Trans. Am. Soc. Agric. Eng. 27, 129–144. doi: 10.13031/2013.32748
Xue, Q., Market, T. H., Xu, W., and Bell, J. (2017). Irrigated corn and management in the Texas high plains. J. Contemp. Water Res. Educ. 162, 31–41. doi: 10.1111/j.1936-704X.2017.03258.x
Keywords: ogallala, optimization, profitability, deficit irrigation, dryland
Citation: Mitchell-McCallister D, McCullough R, Johnson P and Williams RB (2021) An Economic Analysis on the Transition to Dryland Production in Deficit-Irrigated Cropping Systems of the Texas High Plains. Front. Sustain. Food Syst. 5:531601. doi: 10.3389/fsufs.2021.531601
Received: 31 January 2020; Accepted: 04 February 2021;
Published: 23 March 2021.
Edited by:
Robert Joseph Lascano, United States Department of Agriculture, United StatesReviewed by:
Cristina Patanè, National Research Council (CNR), ItalyDavid Brauer, United States Department of Agriculture, United States
Copyright © 2021 Mitchell-McCallister, McCullough, Johnson and Williams. This is an open-access article distributed under the terms of the Creative Commons Attribution License (CC BY). The use, distribution or reproduction in other forums is permitted, provided the original author(s) and the copyright owner(s) are credited and that the original publication in this journal is cited, in accordance with accepted academic practice. No use, distribution or reproduction is permitted which does not comply with these terms.
*Correspondence: Donna Mitchell-McCallister, ZG9ubmEubWNjYWxsaXN0ZXJAdHR1LmVkdQ==
 Donna Mitchell-McCallister
 Rebecca McCullough1
 Ryan Blake Williams