 Shraddhanand Shukla1*
 Denis Macharia2
 Gregory J. Husak1
 Martin Landsfeld1
 Catherine Lilian Nakalembe3S. Lucille Blakeley1
 Emily Caitlin Adams4,5Juliet Way-Henthorne1
- 1Climate Hazards Center, University of California, Santa Barbara, Santa Barbara, CA, United States
- 2Regional Center for Mapping of Resources for Development, Nairobi, Kenya
- 3Department of Geographical Sciences, University of Maryland, College Park, MD, United States
- 4SERVIR NASA Science Coordination Office, Marshall Space Flight Center, Huntsville, AL, United States
- 5Earth System Science Center, The University of Huntsville in Alabama, Huntsville, AL, United States
Major strides have been made in the development of remote sensing, reanalysis, and model-based earth observations (EOs), which can be used for long-term climate variability mapping, as well as real-time environmental monitoring and forecasting. Such EOs are particularly valuable for environmental decision-making (e.g., for environmental resources management and disaster mitigation) in the Eastern and Southern Africa (E & SA) region, where ground-based EOs are sparse. Nonetheless, operational application of those EOs to inform decision-making in the region remains limited. This paper reports on a recently concluded (as of June 2019) NASA SERVIR-supported Applied Science Team project that contributed to the uptake of EO applications to inform decision-making in this region. This project was conducted in close collaboration with the Regional Center for Mapping of Resources for Development (RCMRD)—the NASA SERVIR regional hub in E & SA. The capacity-building efforts leveraged RCMRD's existing environmental service capacity, their long experience in capacity building in the region, and their extensive network of regional partners, with the goal of increasing RCMRD and their regional partners' ability to uptake EOs to enhance their environmental services and, hence, improve the environmental decision-making process. The project focused on: (1) Transfer of technology—Transition and implementation of web-based tools to RCMRD to allow easy processing and visualization of EOs and (2) Capacity training—training of representatives from regional and national environmental service agencies in EO application based on targeted case studies. Here, we describe these capacity-building efforts, provide specific examples to demonstrate the benefits of those efforts in terms of enhanced uptake of EOs, and provide recommendations for furthering the uptake of EOs in the region and beyond.
Introduction
Long-term climate change, climate variability, and rising population make Eastern and Southern Africa (E & SA) particularly vulnerable to climate risks. Climate disasters, such as floods and droughts, are frequent in the region, resulting in substantial socioeconomic losses (Washington et al., 2006; Gebremeskel Haile et al., 2019). To mitigate the adverse socioeconomic impacts of these events, decision-making in several particularly vulnerable sectors—including agriculture, water resources, energy, and development—needs to be climate informed (Archer et al., 2017). Major advances have been undertaken in the development of high-quality, high-resolution remote sensing and model-based data sets, referred to here as Earth Observations (EOs) (Jenkerson et al., 2010; Funk et al., 2015, 2019; Das et al., 2018; Szantoi and Strobl, 2019). These EOs allow for long-term climate vulnerability mapping, as well as regular monitoring and forecasting of climate, hydrologic, and vegetation conditions throughout the globe (Jenkerson et al., 2010; Funk et al., 2015; Das et al., 2018). However, challenges remain that limit the application of EOs for decision-making including the lack of access to EO data, and the lack of experience in converting those data sets into meaningful information for decision-makers (Block, 2011; Coughlan de Perez and Mason, 2014; Dinku et al., 2014; Frankel-Reed, 2018; Harvey et al., 2019). For example, in a recent study, only 27% of the surveyed stakeholders in sub-Saharan Africa reported having adequate ecosystem service data needed for decision-making (Willcock et al., 2016). In general, the survey indicated a lack of reliable accuracy and availability of ecosystem service data at varying spatial and temporal resolutions, thereby hindering informed decision-making in the region.
Publicly accessible data sets and models, when applied to inform food security and water resource-related decisions, can help improve monitoring and forecasting of droughts, water availability, and climatic conditions. However, without knowledge of how to access or understand this information, these valuable data sets and models go underused.
To combat this challenge within a NASA and USAID's SERVIR program (https://www.servirglobal.net/) Applied Science Team (AST) project, the Climate Hazards Center (CHC) collaborated with the SERVIR E & SA hub at the Regional Center for Mapping of Resources for Development (RCMRD, https://www.rcmrd.org/) to undertake capacity-building efforts in the region from 2016 to 2019. Collaboration with RCMRD was crucial for these efforts due to RCMRD's long history of partnering with the national and regional environmental service agencies in the region. The RCMRD, established in 1975, is an intergovernmental organization that currently contracts with 20 Member countries in the E & SA regions, including Botswana, Burundi, Comoros, Ethiopia, Kenya, Lesotho, Malawi, Mauritius, Namibia, Rwanda, Seychelles, Somali, South Africa, South Sudan, Sudan, Swaziland, Tanzania, Uganda, Zambia, and Zimbabwe. RCMRD's mission, which is shared by the SERVIR program, is to promote sustainable development in the region through the generation, application, and dissemination of improved Geo-Information and products to the Member States and beyond. For nearly a decade, SERVIR and RCMRD have worked together on four environmental service areas, which include “Agriculture and Food Security,” “Land use, land cover, and ecosystems,” “Water Resources and hydroclimate disasters,” and “Weather and Climate.” Through this partnership, SERVIR and RCMRD have conducted needs assessments in the region and co-developed EO-informed decision support systems and information services. These services were further supported by targeted capacity-building efforts to address those needs and increase the sustainable use of the developed tools for decision-making. The efforts of the SERVIR AST project described below furthered the SERVIR and RCMRD partnership in response to identified needs. Capacity-building activities conducted through this project primarily focused on technology transfer to RCMRD and training environmental service providers in the region, with the goal of enhancing the uptake of EOs to inform decision-making. Below, we provide details on how each aspect of the capacity-building effort was carried out and show specific examples of how these efforts resulted in enhanced EO access to improve environmental services. It is important to note here that the project focused only on publicly accessible EOs (rather than commercial EOs) that are freely available to partners such as RCMRD and to the trainees who participated in our capacity-building activities. Finally, based on the project team's experience, we summarize key recommendations to further ensure sustained EO usage for environmental services and improved decision-making in the regions.
Enhancing EO Access by Technology Transfer
As the first step toward enhancing environmental services in the region of E & SA, and at the request of RCMRD, the project team worked with the RCMRD to implement an instance of the USGS's Early Warning eXplorer (EWX Shukla et al. (2021), https://earlywarning.usgs.gov/fews/software-tools/1) at RCMRD (Figure 1). The EWX is a web-based, single-page application for the exploration of EOs. It enables users to easily visualize and compare different maps of agroclimatic data sets side by side in the same spatial bounding box, as well as extract and visualize spatially aggregated versions (i.e., time-series). Datasets include precipitation, temperature, and NDVI among other EOs. Users can also access temporally aggregated (i.e., averaged over 1, 2, and 3 months) versions of the data sets, as well as the additive and standardized anomalies. Through these evaluations, the agroclimatic EOs contribute to real-time monitoring, as well as long-term change and variability analysis.
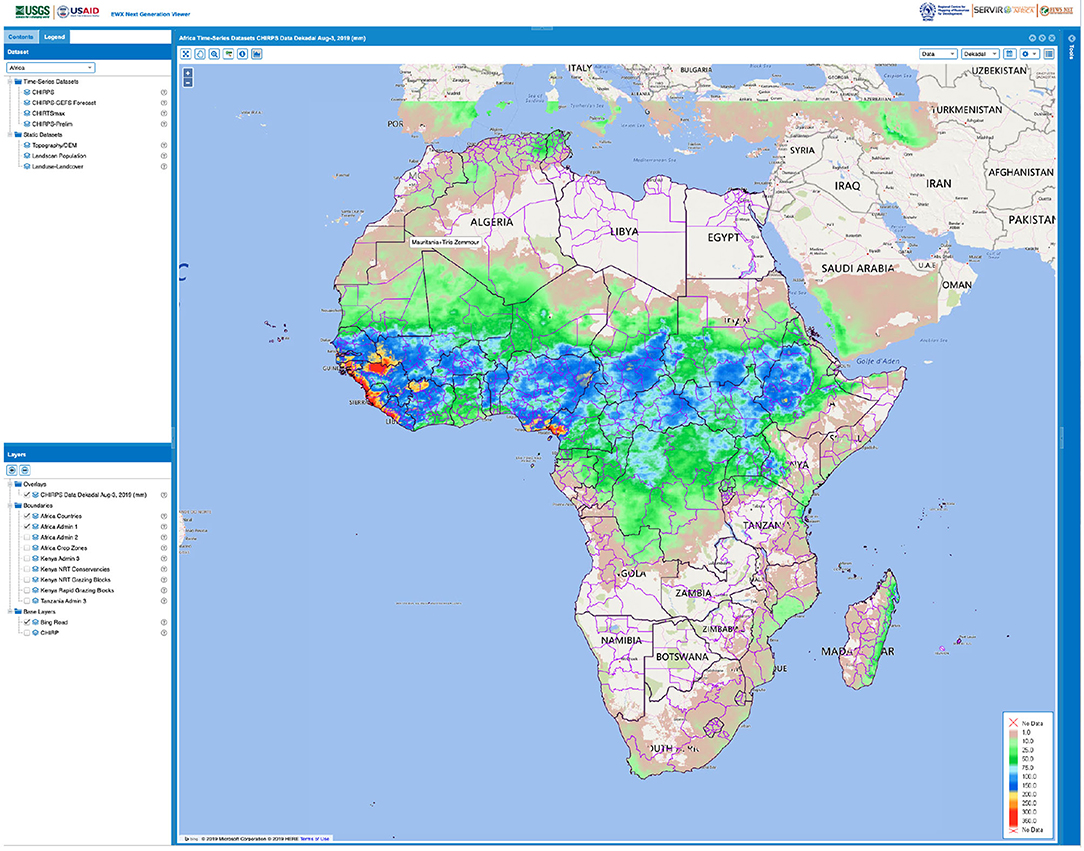
Figure 1. A screenshot of the cloud-based instance of RCMRD's Early Warning Explorer (EWX), implemented and maintained by the RCMRD. This version of EWX currently serves precipitation (CHIRPS), Tmax (CHIRTSmax), and short-term precipitation forecasts (CHIRPS-GEFS) over all of Africa.
Google Analytics-based usage statistics (Figure 2) demonstrate routine access of RCMRD's EWX. From November 2018 to June 2019, there were 278 total page views, 193 of which were unique views. The usage statistics also show at least 20 views per month, peaking during the months of February and March, which marked the start of the long-rain seasons in Eastern Africa. This also coincides with the fourth and final training, conducted in Tanzania in February-March, 2019. As described in section Training Goals and Contents, the EWX was among the primary web services introduced to the selected environmental service providers in the region. Finally, usage statistics also showed that the top-two highest numbers of views came from Kenya and Tanzania (not shown). Other African countries such as Mali, Ethiopia, and South Africa are also among the top six EWX-viewing countries. Further examples of RCMRD's enhanced capacity are detailed in section Regional Center for Mapping of Resources for Development (RCMRD).
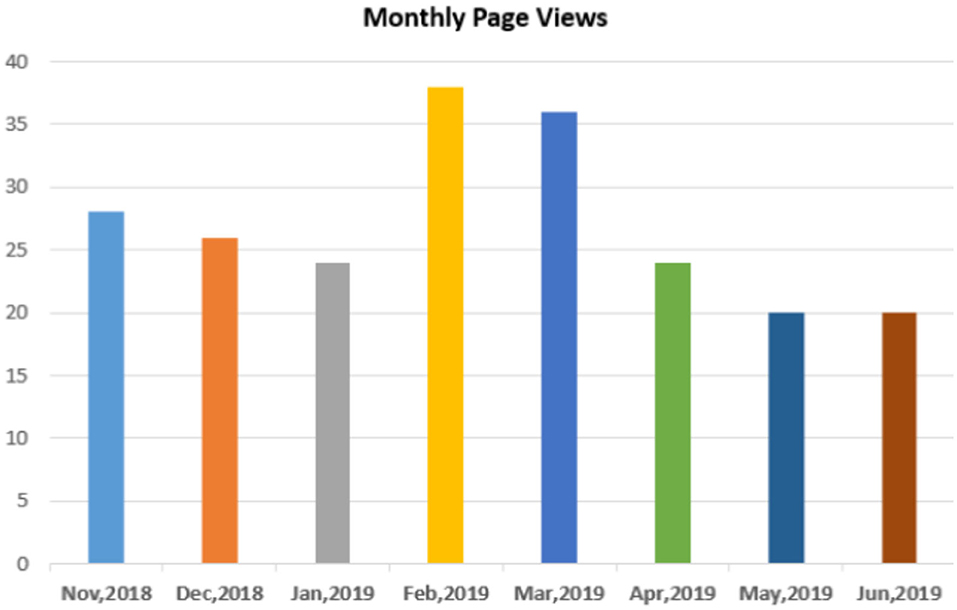
Figure 2. Monthly usage statistics of RCRMD's version of Early Warning Explorer from November 2018 to June 2019 (Source: Google analytics).
Enhancing EO Access Through Capacity Training
Capacity Training Overview
Table 1 summarizes the four training sessions held during the course of the project. The training locations and invited participants were strategically chosen to ensure representation from across E & SA, while also addressing sectors such as agriculture, water resources, climate services, and forestry and land management. Training structure and materials, detailed in section Training Goals and Contents and Table 2, were heavily influenced by the pre-training needs assessment and post-training feedback. Previous participants who demonstrated (through their regular feedback) engagement and active EO user were invited to participate in follow on sessions. The goal behind this approach was to develop a pool of “champion” participants in the region who were well-versed in advanced EOs and web tools with demonstrated access to the (minimal) required infrastructure to use the available tools and had shown examples of adapting their enhanced skills to provide improved information to regional decision-makers.
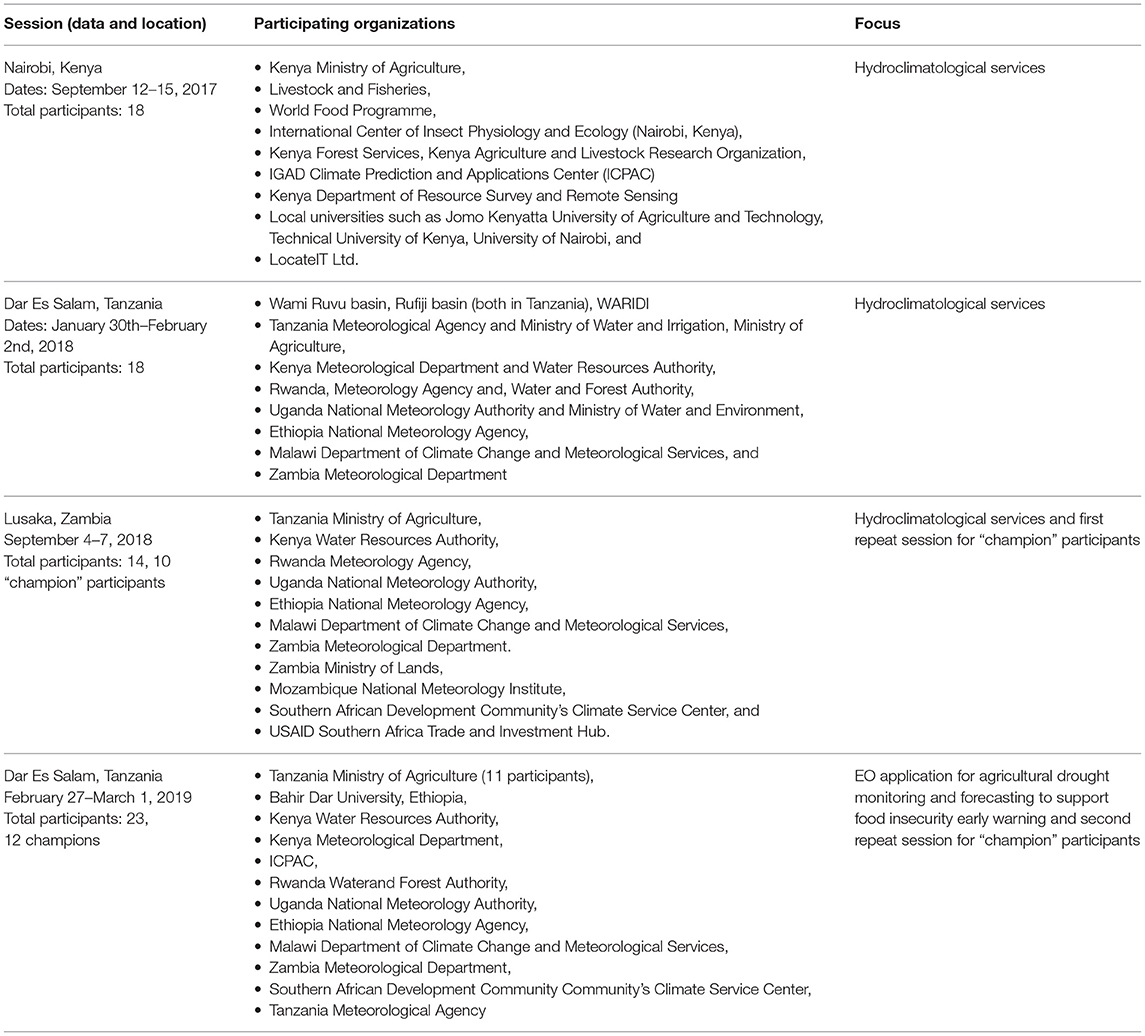
Table 1. Key details on the four training sessions conducted during the SERVIR AST project.
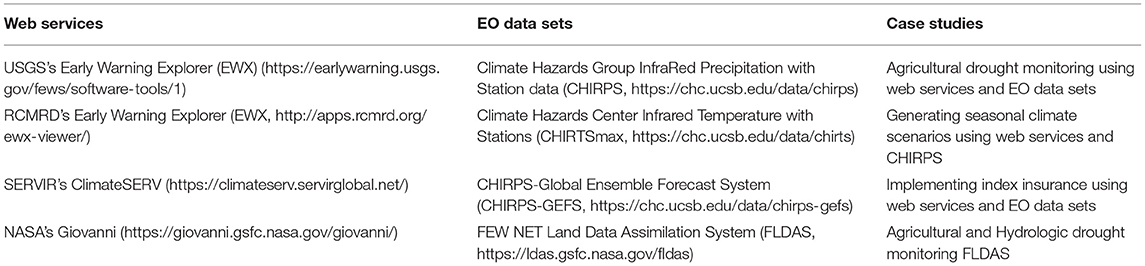
Table 2. List of primary web services, EO data sets, and case studies typically included in the capacity-training.
Needs Assessment
In order to guide the development of the training material to ensure that it directly addressed the participants' needs, we conducted additional needs assessments prior to each training.
Our goal was to (i) better understand the primary environmental services-related responsibilities of the participants (ii) target spatial domains; spatial and temporal resolution (iii) target decision-makers (iv) identify existing gaps in EO knowledge and access (v) identify challenges and opportunities. In the case of “champion” participants, the needs assessment also allowed us to gauge the effectiveness of the previous trainings, as well as the spatial and temporal resolution at which they typically need the EOs, the participants' evolving familiarity with the EO data sets and tools in terms of access and application, as well as their remaining EO-related needs.
The need to more easily access EOs was a primary focus. Here, access means the ability to download or extract EOs, then process and visualize them, and finally, save and export that data to other GIStools. For example, in response to the question “What are the main challenges you face in processing and visualizing EO data sets?” the common answers were:
1. Ability to deal with bulk data sets quickly
2. Accuracy of data sets
3. Extraction of data and details on methods and interpretation
4. Lack of ability to process raster data sets in web services
5. Transportability of output raster data to other GIS software
6. Ability to aggregate data spatially over the user-prescribed polygons
We learned that, in general, the participants knew of the web services but were not regularly using them to access EOs. For example, Figure 3 shows the number of participants (total 17, from training 1) who were familiar with the popular web services, and a general frequency of use of those web services. The primary EO data needs of the participants included the need to access bulk data sets, the need to locate accurate data, and the need for available data in the format portable to the tools (such as QGIS) that the participants were already familiar with.
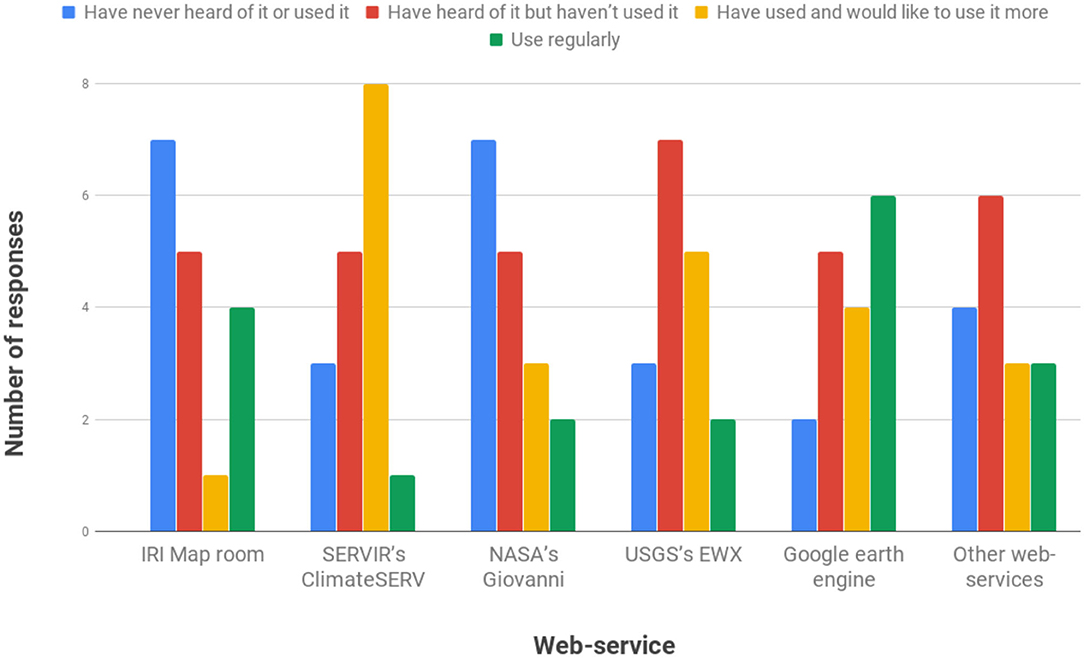
Figure 3. Assessment of participants familiarity with the commonly used web services.
Rainfall data are among the primary EO data needed in the region. Our survey of the participants (total 6) from the Ministry of Agriculture in Tanzania conducted prior to Training 4, show that in general, gauge rainfall data sets are most often used (Figure 4A). We also learned that there is a general lack of familiarity with and access to satellites, as well as satellite and gauge-based rainfall data sets. For real-time applications, the latency of rainfall data sets is an important feature (Figure 4B); however, in general, there are at least 5 to 10 days of latency (Figure 4C), which can be longer in cases when monthly rainfall data reports are made available. This highlights a disconnect in the desired and actual latency of rainfall data sets. Precipitation data sets such as CHIRPS, which leverage both satellite and gauge estimates, are now available at about 5 days' latency through web services such as EWX. Therefore, typically on the first day of training, an introduction to CHIRPS, its methodology, and validations were presented to enhance familiarity of the participants with this data set.
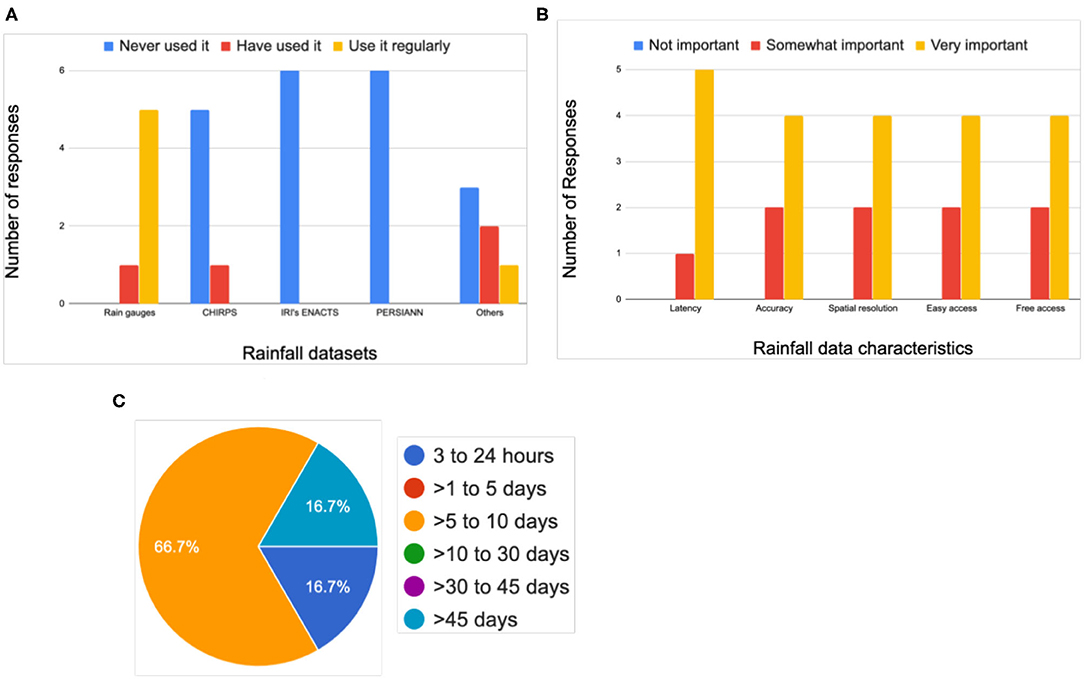
Figure 4. Responses to the questions regarding rainfall data usage assessment of Tanzania MoA. Questions: (A) Which one of these rainfall data sets do you use and how frequently? (B) How important are the following features of a rainfall data set? (C) What's the latency of the rainfall data set that you most often use?
In addition to the above needs, the participants also indicated the need to learn skills to apply EOs in decision-making. For example, one participant mentioned that “we are working on agriculture and we depend on climate data for better performance in agricultural production.” Participants also expressed the need to learn “comprehensive information about farm land at higher resolution,” “different methods to monitor drought,” “use of EO data for crop insurance,” “to process vegetation data,” and emphasized “hands-on training of the tools.”
The participants also indicated the need for easier access to weather forecasts for various applications. For example, one participant stated that “The weather information that can be [gathered] from different models have an important [influence] in day to day in early warning and crop monitoring.” The participants also indicated that they wanted to see details of climate and hydrologic EO data sets and placed equal emphasis on hands-on time to work on prescribed projects, as well as projects that the participants themselves came up with.
Training Goals and Contents
Based on the background of the participants, their needs as compiled in the pre-assessment stage, and the project team's data and research experience in general, we designed training material (Table 2) to:
(1) Enhance familiarity of the participants with EOs
(2) Introduce the participants to web services such as EWX and SERVIR's ClimateSERV to access those EO data sets
(3) Hands-on demonstration of how, through web services, EOs can be accessed, processed, and visualized to provide actionable information to decision-makers in various sectors.
Training duration generally ranged from 3 to 4 days. Day 1 of the training was usually focused on introducing CHIRPS and Climate Hazards Center InfraRed Tmax with Stations (CHIRTSmax) data sets to the participants. The participants were introduced to the methods involved in generating those data sets, along with their evaluations and examples of applications for drought monitoring and long-term climate vulnerability analysis. Following their introduction to these data sets, the participants were introduced to the Early Warning Explorer (EWX). EWX's main features include the ability to access bulk data sets and make spatial maps of absolute values and anomalies, as well as extracting time-series for available polygons (e.g., Administrative boundaries-1 and−2 and crop zones were introduced). Following this presentation, a hands-on exercise on EWX was conducted to familiarize the participants with EWX and allow them to learn firsthand about its features. The EWX exercises were structured in the form of several questions focusing on a given region and drought season (such as Kenya over the 2016-17 rainy season). The participants were advised to answer those questions by accessing EOs (such as CHIRPS and NDVI) data sets through EWX and were encouraged to compare their answers. Teamwork was also encouraged, while ensuring that each of the group members participated in the exercise. This was done by encouraging different members of randomly selected groups to provide answers to the questions in the EWX exercises.
The next days of training generally focused on demonstrating concrete examples of how to use EWX for enhancing environmental services by using case studies. The selection of the case studies was based on the pre-assessment of the participants. For example, the case studies that we most often used helped demonstrate how EWX (and other web services) can be used to access, process, and visualize EOs to (1) conduct real-time drought monitoring (2) generate climate scenarios based on past years' observations (i.e., climatological forecasts) and (3) implement index insurance and calculate payoff amounts and frequencies. Each of the case studies included was accompanied by a presentation introducing the concept with a relevant example. For instance, for the case study on index insurance, FEWS NET's Africa Regional Scientist gave a presentation on the index insurance pilot project then underway in Kenya. The presentation introduced the basic concepts and terminology of index insurance, along with examples of how EOs are used for index insurance implementation. We also brought guest trainers to share their expertise in relation to different training modules.
Typically, during the second half of Day 3 (the second to last day), the participants were encouraged to work on projects of their choosing to demonstrate how the skills and data sets learned during the training could be used to address the environmental services needs that they focus on. Working groups, participants developed small projects focusing on regions and case studies of their own interest.
On the final day of each training, each group of participants presented group projects that were often diverse in nature. For example, during the first training, the participants presented on “Frost Monitoring on Tea Farming,” “Estimation of groundwater recharge,” “Post Drought wildlife assessment,” “Assessment of climate risks based on index insurance,” “Livestock insurance,” “Assessing effect of rainfall on vegetation,” and “Estimation of insurance payouts using rainfall and NDVI data sets.”
Evaluation and Feedback
Following each training, we conducted participant surveys to collect feedback on their experiences to evaluate the effectiveness of the past training and improve consequent training sessions. Overall, the participants had positive feedback. For example, participants of the first training indicated that the training was “very engaging and participatory,” “very interactive, lively and informative,” and that it “broadened my knowledge on the different applications of EWX and how it can be used in various decision making scenarios.” One participant mentioned that “EWX is user friendly and can be a very useful tool for rapid assessments for prompt decision making.” Overall, participants' feedback tended to explain how the training would improve their professional activities, especially as we progressed toward later trainings, where more emphasis on the application of skills learned during the training was provided. For example, one participant stated “It [the training] has introduce[d] me to useful remote sensing tools necessary for my daily works of advising farmer[s] on dealing with climate change impact.” Another participant mentioned specifically of the index insurance that “Index insurance will help us to understand what to discuss with crop insurance schemes and companies.” Some of the participants showed enthusiasm toward sharing the gained skills with their broader team: “I will train my colleagues who develop scenarios at the GHACOFs and showcase the products in the upcoming Scientific Conferences.” In addition to this positive feedback, the participants also indicated the need to repeat the training for greater comprehension and to provide more time for hands-on exercises. For example, one participant mentioned that “time for workshop was short and programs tight so that hands can be performed very well, I recommend for [the] next training to focus on various applications with case study to strengthen hands on.” We received similar comments from other participants, including those that, overall, had a favorable opinion of the training. This feedback was vital in improving the training structure in the following two trainings, as we not only increased the time for hands-on exercises, but also assigned “unstructured” time to allow for the participants to spend more time on any of the case studies presented in the training. We provided such time at the end of each day. As a result of this change, following the third training in Lusaka, all of the responses that we received after the training indicated that they thought that adequate time was provided for hands-on exercises. Similarly, participants' feedback on individual case studies and data sets and tools discussed helped us schedule more time and include further information on the materials that the participants most liked and wanted to see again.
In general, the participants found the web services (such as EWX) able to meet their needs. They liked various features that EWX offers. Most participants of the first training (total of 15 responses) liked the EWX's ability to bulk download EO time series, which were also often used in the participants' projects. The majority of the participants indicated that they would “Very Likely” be using EWX and ClimateSERV for their professional activities. Across all trainings, in general, the participants favored the case studies focusing on “Drought Monitoring,” “Seasonal-scale climate scenarios,” and “Weather forecasts.” This was likely because those case studies were most relevant to the routine professional duties of most participants. The case study “Implementing Index insurance using EWX” also received favorable feedback; however, in general, the participants needed further information. We took this important feedback into account when developing training material for the training in Dar Es Salam, and sought help from a guest trainer who had more experience working in index insurance.
In addition to the above feedback, participants' feedback of planned usage of the newly gained skills was of great interest in that it ensured the sustainable impact of these capacity-building efforts and enhanced application of EOs for informing decisions. For example, a participant noted that they had “been able to apply the skills gained. In January, together with colleagues, we were able to generate scenarios of seasonal rainfall for Malawi for the remainder of the season.” Finally, one of the participants reported that “CHIRPS-GEFS was quite important for monitoring/getting early warning information during the failed MAM season [2019].”
A few months after the fourth and final training, ~30% of the participants (a total 14 responses) indicated that they had been applying the skills and data sets learned to their professional duties at least once a week, 50% at least once a month, and the remainder used their advanced knowledge at least once since the last training. Figure 5 details the frequency with which the participants applied different web services and data sets included in the training sessions.
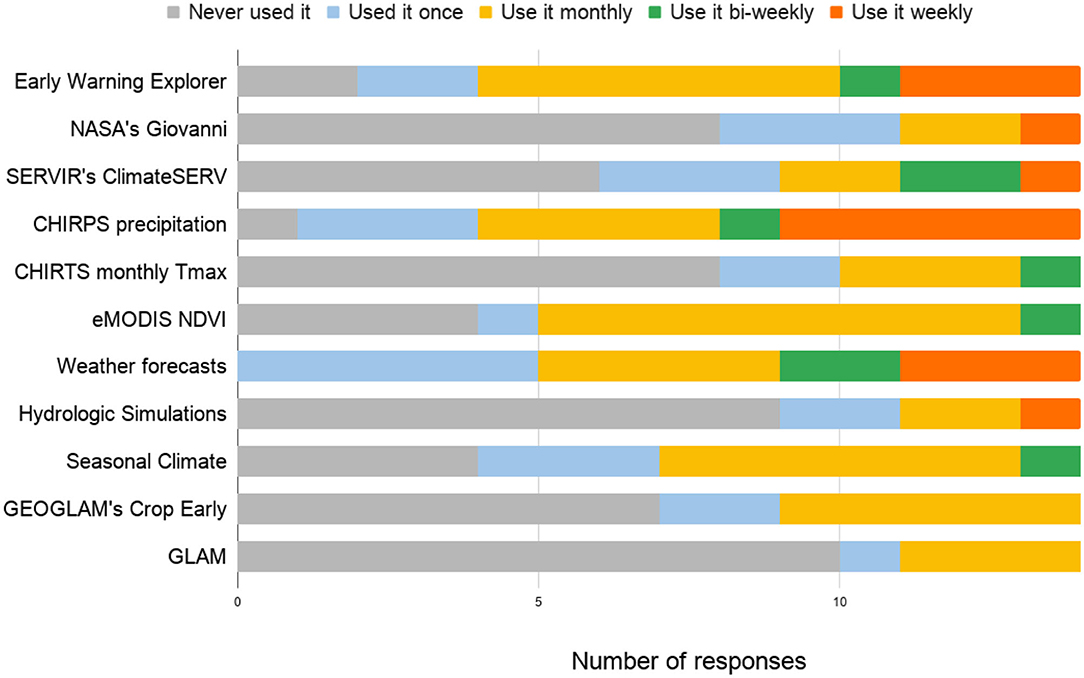
Figure 5. Participants' responses to how often they apply the web services and EO data sets to their professional duties since the last training. This survey was conducted a few months after the final training to gauge the potential of sustainable use of EOs by the participants following the training.
In general, the participants most often used EWX, CHIRPS, and CHIRPS-GEFS weather forecasts. The frequency of use is typically monthly; however, in some cases, especially for EWX, CHIRPS, and weather forecasts, weekly usage was not uncommon. None of the participants reported that they did not use weather forecasts at least once, which speaks to the value of that data set and enhanced access to the data set through EWX and ClimateSERV.
Regarding major challenges that the participants faced in applying newly gained skills to their professional duties, about 60% reported no major challenge, and 50% reported slow internet as a major challenge. Note that the participants were allowed to choose more than one major challenge. About 20% of the participants reported institutional protocols or lack of practice time as their major challenge. About 80% of the participants reported sharing the gained skills with colleagues who did not participate in the training, which exemplifies the “empower-the-trainers” approach, as well as the increased impact and reach of these trainings.
In the section below, we provide a more in-depth description of how the above mentioned capacity-building efforts enhanced EO uses for improved environmental services at selected environmental service agencies across the region.
Examples of Enhanced Environmental Services
This section provides details of selected examples of how environmental services were enhanced and improved in at least four agencies across the E & SA region following the capacity-building efforts. In each case, the existing needs of each of the agencies are described, their typical end users are listed, and how the capacity-building efforts described previously led to clear examples of EOs uptake in improving environmental services to support decision making is discussed.
Regional Center for Mapping of Resources for Development (RCMRD)
RCMRD provides environmental services to 20 member countries in the E & SA region. These services are essential in the region because the GDP of most of these countries is dependent on the climate and natural resources. In the past 6 years, RCMRD has been helping countries develop climate vulnerability maps to support prioritization of resilience building, funding, and project implementation (e.g., https://www.adaptation-fund.org/wp-content/uploads/2017/04/1434UNEPAFPDLakeVictoriaBasinCleanED6February2017-2.pdf). To better characterize climate vulnerability hotspots, consistent long-term climate data sets are required.
RCMRD regularly uses CHIRPS and CHIRTSmax data in vulnerability analysis and has upscaled the use of EWX and the gridded datasets in Tanzania. In Kenya, it is supporting community climate change adaptation initiatives by carrying out climate vulnerability, impacts, and assessments (Figure 6). In Tanzania, weather data from an expanded monitoring network are being used in the further improvement of the gridded data sets provided by the CHC and consequently, are used in the calibration and running of hydrological models to support water planning and allocation and identification of climate risks in the two basins.
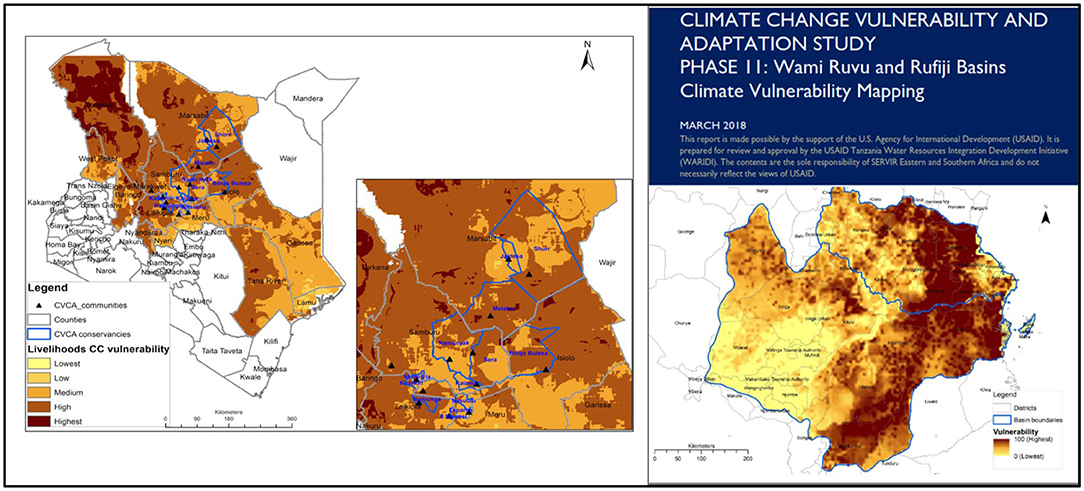
Figure 6. Climate vulnerability maps developed to support resilience building activities in Kenya's northern rangelands (Left) and Tanzania's river basins (Right).
In Kenya, through EWX, RCMRD is supporting the Northern Rangelands Trust and the Laikipia Wildlife Forum, who manage community conservancies in the region by providing vulnerability hotspots maps, current rainfall situations from CHIRPS, as well as forecasts from CHIRPS-GEFS. These products are being used together with a rangelands decision support tool (http://tools.rcmrd.org/) that has been developed to monitor vegetation conditions in the rangelands to complement field observations, which are carried out by the rangelands managers (Figure 6).
Finally, another example of improvement in RCMRD's climate services following these capacity-building efforts is documented in Macharia et al. (2020). Enhanced access to gridded EOs (mainly gridded precipitation and temperature data sets) allowed RCMRD and their partners on USAID's Water Resources Integration Development Initiative (WARIDI) project to provide high-resolution mapping of climate-related risks in several basins in Tanzania. These climate risk assessments were combined with several indicators of socioeconomic conditions to map climate vulnerability in the region and identify “hot spots.”
Zambia Meteorological Department
Zambia Meteorological Department (ZMD) releases a crop weather bulletin every 10 days providing updates on current seasonal rainfall, rainfall outlook, crop available moisture, and crop conditions. Typical end users of this bulletin include the farmers and decision-makers in sectors such as water, energy, and health and are publicly available. Until recently, seasonal rainfall monitoring was done using reports from 41 rain gauges sparsely distributed across the country. Rainfall outlook included in the bulletins relied on coarse resolution global models from the UK, ECMWF, and ARPEGE. Rain gauge sparsity and access to coarse rainfall forecasts limited ZMD's ability to provide rainfall and crop conditions assessments at spatial scales at which decisions are actually made.
Following participation in our training sessions, ZMD now provides seasonal rainfall monitoring assessments based on CHIRPS and provides rainfall outlook assessments based on CHIRPS-GEFS (Figure 7). ZMD is able to provide rainfall monitoring and outlook assessments at the spatial scale of small regions including districts where there are no rain gauges.
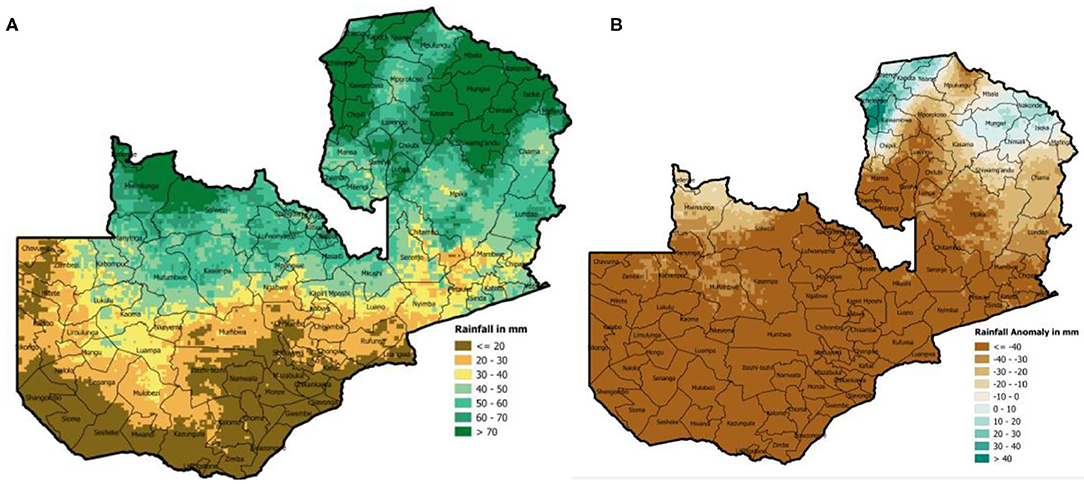
Figure 7. Example of enhanced environmental services by ZMD, as shown in January 2019 crop weather bulletin, following the third training in Lusaka, Zambia. (A) 10 days rainfall forecast amount (B) 10 days rainfall forecast anomaly.
In preparation of this manuscript, we followed up with the participant from the ZMD to assess the impacts of the novel forecast products described above, and they informed us that “The decisions were improved because the farmers are now using the 10-day weather forecast in [their] planning and management of crops. Even the public at large is making use of these daily, 5-and-10-days weather forecasts because of the improvements in accuracy. For example, if insurance companies were to inquire on rainfall received in a certain farm, ZMD would use the information from EWX to give them before a payout would be given, if at all, there is some destruction caused by rainfall.”
Southern Africa Development Community (SADC)'s Climate Service Center (CSC)
The SADC Climate Services Center (SADC-CSC, https://www.sadc.int/sadc-secretariat/services-centres/climate-services-centre/) provides operational monitoring and forecasting of climate extremes in the region of Southern Africa. The meteorological, environmental, and hydro-meteorological products that the Center produces contribute to improved disaster risk management in the region, and mitigate the adverse impacts of climate extremes. Typical end users of these products include National Meteorological services in the SADC region, international cooperating partners who are active in the SADC region (e.g., WFP, FAO, etc.), and international non-governmental organizations (e.g., the Red Cross).
In order to provide the monitoring and forecasting products, the CSC needed to gain routine access to ground station data from SADC Member States, which doesn't frequently occur. Moreover, the Center relies on GFS, ECMWF, and UKMO models to forecast climate extremes and, specifically, heavy rain and heatwave alerts. Yet it has no access to the hindcast data from these models.
Climatologists of the CSC who participated in our training sessions helped the CSC fill some of these gaps, and aiding CSC's mandate of providing climate information to decision-makers. For example, now through EWX, the CSC has regular access to the CHIRPS data, allowing it to generate monthly and seasonal rainfall assessments and disseminate information through bulletins. Using CHIRPS, the CSC also generated historical climate extreme indices (CDD, CWD, R10 mm, R20 mm, R1 day, and R5 days) for the SADC region, which helps it conduct climate vulnerability mapping in the region. Furthermore, as a result of the training sessions, CSC is now producing 2-week dry and wet spell bulletins using the CHIRPS-GEFS data (Figure 8). Finally, the CSC is using the CHIRPS data to downscale the seasonal forecast from the North American Multimodel Ensemble (NMME).
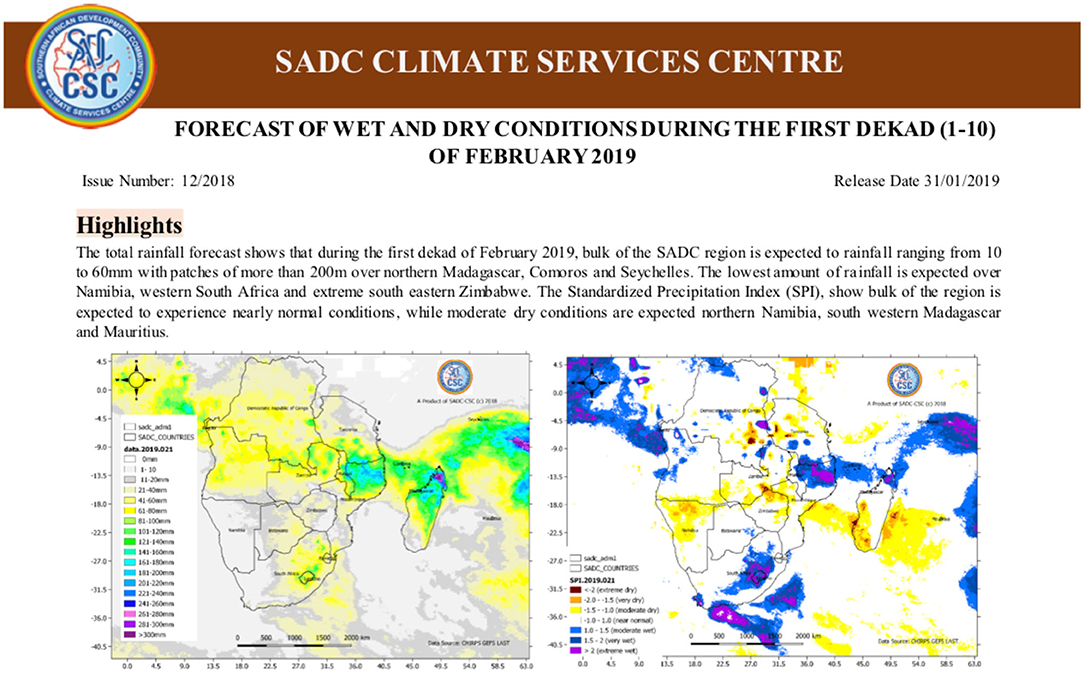
Figure 8. Example of enhanced environmental services by SADC-CSC, as shown in February 2019 bulletin, following the third training in Lusaka, Zambia. Rainfall forecasts for the first dekad of February, 2019 in terms of rainfall amount (left) and Standardized Precipitation Index (SPI).
The National Food Security Division of Tanzania Ministry of Agriculture
The National Food Security Division (NFSD, https://www.kilimo.go.tz/index.php/en/about/national-food-security-division) in the Tanzania Ministry of Agriculture compiles a National Food Security Bulletin for Tanzania. After a series of trainings and introduction to the Global Agriculture Monitoring System (GLAM) for East Africa to assess vegetation and crop conditions, and the development of the Tanzania National Crop Monitor System (https://cropmonitor.org/interfaces/agrisense/login.php), the NFSD has been taking full advantage of EOs in monitoring agriculture across the country. However, until recently, they were relying on the weather data and summary reports from the agrometeorological bulletins from the Tanzania Meteorological Agency (TMA). Although these bulletins provided synoptic information on rainfall distribution and implications in the agriculture sector, the maps and data in the report are not usable for any further in-depth analysis for a specific small-scale region. For example, due to the static nature of the data and map provided through TMA, they are not usable or practical for monitoring and examining rainfall at a district level or at any other specific domain. NFSD needed access to data (not just the maps) to support their operational and routine analysis to inform the NDVI-based crop conditions assessments done in the GLAM system. The combination of NDVI and rainfall information at a district-level, plus additional field information are then combined to make the final assessment in the Tanzania Crop Monitor.
The fourth training in Dar Es Salam was a unique opportunity to address the need to access near real-time rainfall data for NFSD's needs. After the week of this introduction to EWX, which also included a refresher on making crop assessments with the GLAM system and the Tanzania Crop Monitor, the NFSD team immediately applied the newly gained skills to improve Tanzania national-level food insecurity bulletins. EWX allows NFSD to extract and process real-time rainfall data sets for specific regions and districts to analyze the spatial variability of drought (Figure 9A). The use of EWX also allowed NFSD to access rainfall weather forecasts and now include an additional section on forecast in the food insecurity bulletin. They now use EWX products as part of their monthly routine reporting, including a detailed assessment of regions of concern.
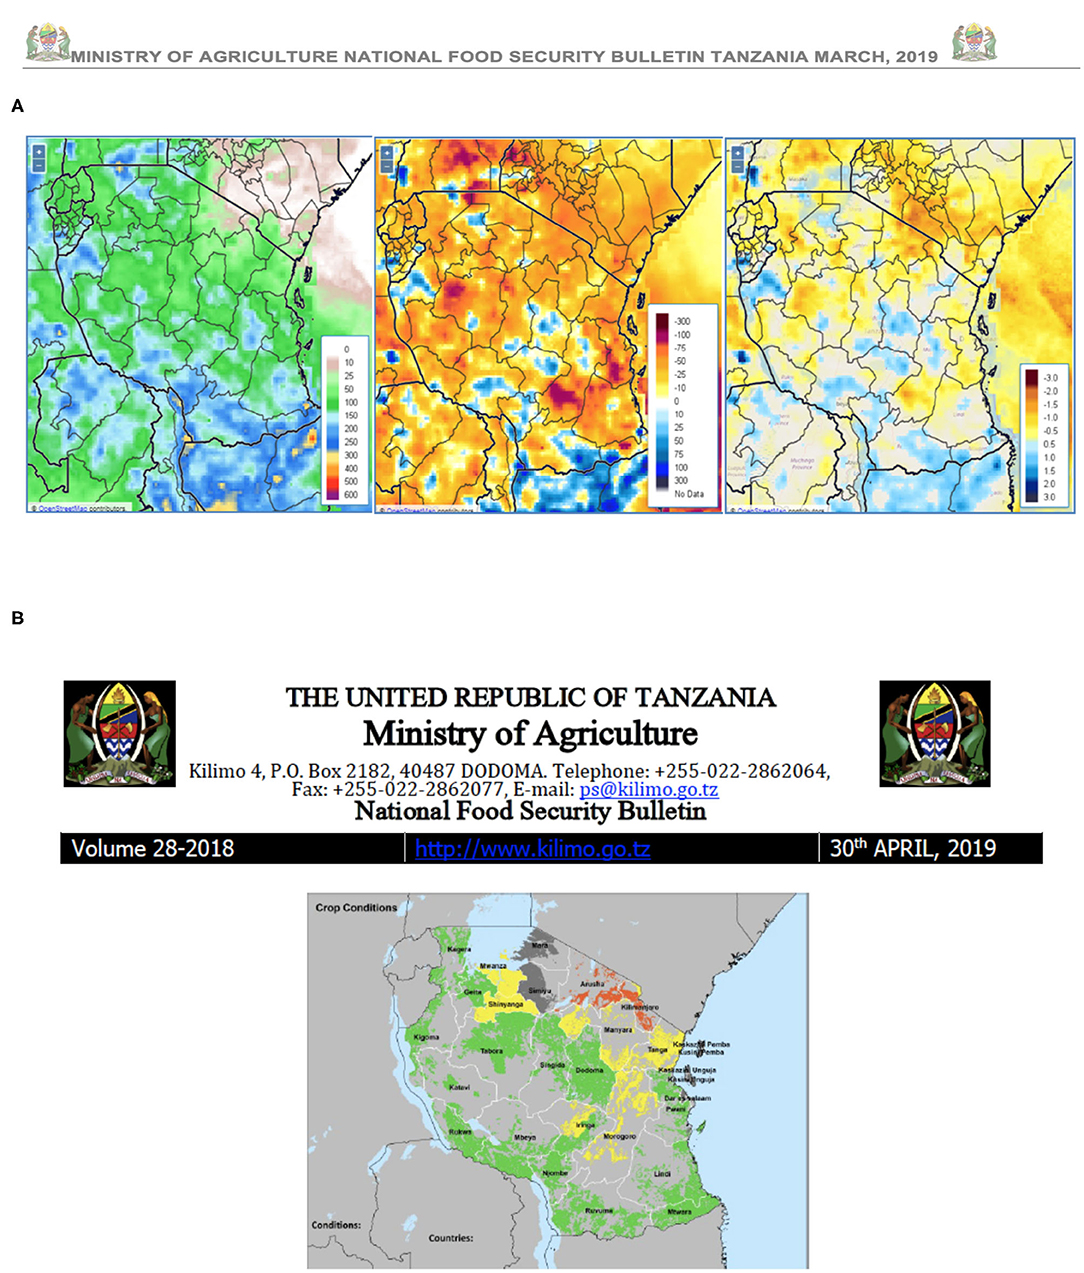
Figure 9. Example of enhanced environmental services by NFSD of Tanzania MoA, as shown in the April 2019 bulletin, following the fourth training in Dar Es Salam. (A) Seasonal rainfall monitoring and (B) Tanzania Crop Monitor Synthesis Report for April 2019.
Finally, access to EWX has enabled more accurate assessment in the Tanzania Crop Monitor. For example, the 30th April 2019, Crop Monitor Synthesis map (Figure 9B) clearly considered the seasonal rainfall monitoring in the preceding month and provided clear evidence of poor conditions in both Arusha and Kilimanjaro Region (in red Figure 9B)—the watch conditions for most of northeastern Tanzania. Both Arusha and Kirlimajoro received between −15 and −50 mm of rainfall compared to the long-term averages during March and April at the start of the Masika rains and planting season for the regions.
Concluding Remarks
Major advancements have been made in the development of global and regional EOs. These EOs are helpful to climate vulnerability mapping (using historical data), as well as real-time monitoring. The EOs can thus support improved decision-making and are crucial in managing environmental resources (such as water, energy, and agriculture) and mitigating climate-related environmental disasters such as floods and droughts. Nonetheless, despite the existence of several EOs, their operational applications, particularly in climate vulnerable and rapidly developing regions of E & SA, have been limited. Here, we describe the capacity-building efforts undertaken by a recently concluded NASA and USAID's SERVIR AST program-supported project that tackled this existing challenge with the goal of enhancing environmental services in this region by integrating EOs. Two main avenues to meet this goal were (a) transfer of technology, mainly a web service (EWX) to easily access, process, and visualize commonly used EOs to RCMRD and (b) capacity training sessions conducted in the region.
By the end of the second year of this project, the EWX was implemented at the RCMRD, allowing RCMRD to be among the primary providers of widely used global EOs (such as CHIRPS, eModis) in the region. This technology transfer will also allow RCMRD to serve any of the other regional EOs (that focus on part of this region) in a similarly consistent manner, as well as provide the EOs for political (e.g., district) and environmental boundary polygons (e.g., small watersheds) suited for different applications that are currently unavailable through the USGS's version of the EWX. The Google Analytics-based usage data indicate regular access to the RCMRD's EWX, where a majority of the users are from within the region.
The capacity-training efforts included four trainings conducted during the project. Each of the training locations and participants were strategically chosen to reach participants from as many diverse environmental agencies and geographical locations as possible. Each of the trainings followed a pre-assessment of the participants to better understand their familiarity with the EOs, their level of EO access, and their existing needs and challenges. The pre-assessment responses, as well as the training educators' research experience, guided the training content. At times, external educators were invited to provide greater emphasis on selected training modules (such as index insurance, GEOGLAM crop monitoring, and hydrologic modeling). After the second training, a pool of about 10 “champion” participants was selected to be invited to the last two trainings to ensure that participants who are active and engaged benefit from repeated, in-depth training experiences, and hence are more likely to apply EOs to improve respective environmental services. Each of the training sessions were also followed by evaluations and feedback from participants to examine the effectiveness of the training, and to make necessary changes in the future training modules and structure. Implementing these training best practices helped ensure uptake and sustainability.
Through the participants' general feedback and four specific examples of enhanced environmental agencies presented here, it is clear that these capacity-building efforts have thus far resulted in positive outcomes and helped enhance the uptake of EOs to improve environmental services' ability to support decision-making. Some of those specific cases have been described in section Examples of Enhanced Environmental Services. With time, there may be more such examples, as well as clear instances of more well-informed decisions due to improved environmental services. Although these specific examples are encouraging, it is also clear that much more needs to be done to expand the extent of the improvement in environmental services across the region. This will require scaling up capacity-building efforts, similar to what is described here, across the region over the long term. Based on the experience gained through the capacity-building efforts of this project, the following are our recommendations on primary ways EO applications can be enhanced in the region.
Routine and Sustained Engagement With the Environmental Service Providers Is Critical
Routine and sustained engagement with the representatives of environmental service provider agencies in the region is important to enhance the application of EOs (Frankel-Reed, 2018). Engagement of the EO researchers with the environmental service providers ensures that the researchers are familiar with the changing needs of the service providers, which can help researchers improve the EOs and/or access to EOs to better meet the needs of the providers. The engagement also makes sure that providers are aware of the cutting-edge EO developments, which can lead them to improve the types and resolution of the environmental services based on the advancements in the EOs. Regular engagement is also needed to facilitate the “train-the-trainer” approach by developing the representative providers into training educators to their colleagues at those agencies, as well as end users.
Web Services for Dynamic and Easier Access to EOs, and Tools to Transform EOs Into Information Are Needed
The environmental service providers need EO maps, as well as underline data to allow them to do further and targeted analysis. The resolution (both spatial and temporal) at which the EOs are needed, varies based on the applications. For example, in some cases, EOs are needed at pixel scale (e.g., for comparison with in situ data or to drive crop and hydrologic models) and in some other cases, they are needed at administrative zone scale (e.g., for broadly accessing food insecurity conditions). In this regard, web services where the provider can upload their own desired polygons for extracting EOs can be very useful. This is a feature offered in SERVIR's ClimateSERV. Web services providing dynamic access to EOs allows the providers to convert the EOs into relevant information for the decision-makers. Tools and skills are also needed to convert EOs into information; for example, tools that can provide crop yield estimates based on rainfall estimates would be highly useful. In this case, rainfall is an EO (i.e., data) and crop yield estimates are information that decision-makers can directly use in their work.
Development of Finer Spatial and Temporal Resolution EOs and Validation of EOs Is Needed
Often, the providers indicate that the resolution of the EOs is too coarse for their needs, especially if they are to be used in conjunction with in situ observations. The providers also indicate that more validation is needed to develop further trust in the EOs, as well as help modify institutional protocols that only allow them to use in situ observations, which often serve as the best representation of the ground truth. Further clarification and analysis on how EOs correspond with information needed for decision-making (e.g., how NDVI relates to crop yield) is also needed for enhancing EO applications in the region.
Finally, we are optimistic about the sustained positive impact of this project, primarily due to the close collaboration with RCMRD. As a prominent environmental service provider in the region and is mandated to provide their services to 20 countries in the region. Leveraging from RCMRD's existing environmental service capacity, their long experience in capacity building in the region (including and beyond the extent of this AST project), and extensive network of regional partners, are crucial for ensuring sustaining impact. As described in greater detail in section Regional Center for Mapping of Resources for Development (RCMRD), this project helped further and continue RCMRD's efforts in (i) responding to various environmental services needs through enhanced access to advanced EOs, and (ii) capacity building as requested by regional stakeholders. Such examples bolster the hope of sustained enhancement of EOs' uptake in the region and hence, improved environmental decision-making. It is important to recognize that future efforts will be needed to scale up and further enhance the uptake of EOs in decision-making in the region. Through the efforts described here, we were able to show specific examples of success in the uptake of EOs, and similar efforts over a long-term should be helpful in the large-scale uptake of EOs in the region. We hope that the lessons learned and recommendations made from the efforts described here will prove helpful for any future efforts of enhancing the uptake of EOs in supporting decision-making.
Data Availability Statement
Publicly available datasets were analyzed in this study. This data can be found at: https://chc.ucsb.edu/data and USGS's Early Warning eXplorer (https://earlywarning.usgs.gov/fews/ewx/index.html).
Author Contributions
SS wrote the manuscript, led the AST project supporting this manuscript. DM, GH, and CN contributed texts, reviewed, and edited the manuscript. JW helped with organization of the manuscript and extensive review and editing of the manuscript. ML, SB, and EA contributed to the project, reviewed, and edited the manuscript. All authors contributed to the article and approved the submitted version.
Funding
This study was supported by NASA SERVIR-AST Grant NNX16AN14G and 80NSSC20K0163 and SERVIR E & SA hub at RCMRD. U.S. Geological Survey's Cooperative Agreement G09AC000001.
Conflict of Interest
The authors declare that the research was conducted in the absence of any commercial or financial relationships that could be construed as a potential conflict of interest.
Acknowledgments
In accordance with UC Santa Barbara institutional policies and procedures, Institutional Review Board approval was not required for the study component involving human participants. Support for this project primarily came from NASA SERVIR-AST Grant NNX16AN14G and 80NSSC20K0163 and SERVIR E & SA hub at RCMRD. Additional support from the U.S. Geological Survey's Cooperative Agreement G09AC000001 is also acknowledged. The authors thank Micah Namukoko (ZMD), Arlindo Meque and the SADC-CSC team for their inputs to this manuscript, and Dr. Amy McNally (NASA/USAID), Chris Shiote (Field Scientist, FEWS NET East Africa) and Dr. Tamuka Magadzire (Field Scientist, FEWS NET Southern Africa), Dr. Faka Dieudonne Nsadisa (SADC-CSC), the GEOGLAM team especially Dr. Jan Dempewolf and Dr. Inbal Becker-Reshef and the Climate Hazards Center for their support with the capacity-training efforts. We are also thankful to the SERVIR E & SA team, particularly Ngugi Kimani, Stella Masese and Patrick Kabatha for their work on transfer of technology as well as for their contributions to the training. The authors would also like to thank the US Geological Survey (USGS) Famine Early Warning Systems Network (FEWS NET) for their efforts on the Early Warning eXplorer.
References
Archer, E. R. M., Landman, W. A., Tadross, M. A., Malherbe, J., Weepener, H., Maluleke, P., et al. (2017). Understanding the evolution of the 2014–2016 summer rainfall seasons in southern Africa: key lessons. Clim. Risk Manage. 16, 22–28. doi: 10.1016/j.crm.2017.03.006
Block, P. (2011). Tailoring seasonal climate forecasts for hydropower operations. Hydrol. Earth Syst. Sci. 15, 1355–1368. doi: 10.5194/hess-15-1355-2011
Coughlan de Perez, E., and Mason, S. J. (2014). Climate information for humanitarian agencies: some basic principles. Earth Perspect. 1:11. doi: 10.1186/2194-6434-1-11
Das, N. N., Entekhabi, D., Dunbar, R. S., Colliander, A., Chen, F., Crow, W., et al. (2018). The SMAP mission combined active-passive soil moisture product at 9 km and 3 km spatial resolutions. Remote Sens. Environ. 211, 204–217. doi: 10.1016/j.rse.2018.04.011
Dinku, T., Block, P., Sharoff, J., Hailemariam, K., Osgood, D., del Corral, J., et al. (2014). Bridging critical gaps in climate services and applications in africa. Earth Perspect. 1:15. doi: 10.1186/2194-6434-1-15
Frankel-Reed, J. (2018). “Reflecting on a decade of collaboration between NASA and USAID: deriving value from space for international development,” in Yearbook on Space Policy 2016: Space for Sustainable Development Yearbook on Space Policy, eds C. Al-Ekabi and S. Ferretti (Cham: Springer International Publishing), 163–174. doi: 10.1007/978-3-319-72465-2_5
Funk, C., Peterson, P., Landsfeld, M., Pedreros, D., Verdin, J., Shukla, S., et al. (2015). The climate hazards infrared precipitation with stations—a new environmental record for monitoring extremes. Sci. Data 2, 1–21. doi: 10.1038/sdata.2015.66
Funk, C., Peterson, P., Peterson, S., Shukla, S., Davenport, F., Michaelsen, J., et al. (2019). A high-resolution 1983–2016 Tmax climate data record based on infrared temperatures and stations by the climate hazard center. J. Clim. 32, 5639–5658. doi: 10.1175/JCLI-D-18-0698.1
Gebremeskel Haile, G., Tang, Q., Sun, S., Huang, Z., Zhang, X., and Liu, X. (2019). Droughts in East Africa: causes, impacts and resilience. Earth Sci. Rev. 193, 146–161. doi: 10.1016/j.earscirev.2019.04.015
Harvey, B., Jones, L., Cochrane, L., and Singh, R. (2019). The evolving landscape of climate services in sub-Saharan Africa: what roles have NGOs played? Clim. Change 157, 81–98. doi: 10.1007/s10584-019-02410-z
Jenkerson, C. B., Maiersperger, T., and Schmidt, G. (2010). eMODIS: A User-Friendly Data Source. U.S. Geological Survey. Available online at: http://pubs.er.usgs.gov/publication/ofr20101055 (accessed September 17, 2019).
Macharia, D., Kaijage, E., Kindberg, L., Koech, G., Ndungu, L., Wahome, A., et al. (2020). Mapping climate vulnerability of river basin communities in Tanzania to inform resilience interventions. Sustainability 12:4102. doi: 10.3390/su12104102
Shukla, S., Martin, L., Michelle, A., Michael, B., Gregory, H. J., James, R., et al. (2021). Enhancing the application of earth observations for improved environmental decision-making using the Early Warning eXplorer (EWX). Front. Clim. 2:583509. doi: 10.3389/fclim.2020.583509
Szantoi, Z., and Strobl, P. (2019). Copernicus Sentinel-2 calibration and validation. Eur. J. Remote Sens. 52, 253–255. doi: 10.1080/22797254.2019.1582840
Washington, R., Harrison, M., Conway, D., Black, E., Challinor, A., Grimes, D., et al. (2006). African climate change: taking the Shorter Route. Bull. Am. Meteorol. Soc. 87, 1355–1366. doi: 10.1175/BAMS-87-10-1355
Keywords: earth observation, capacity building, Eastern Africa, Southern Africa, environmental services, decision-making
Citation: Shukla S, Macharia D, Husak GJ, Landsfeld M, Nakalembe CL, Blakeley SL, Adams EC and Way-Henthorne J (2021) Enhancing Access and Usage of Earth Observations in Environmental Decision-Making in Eastern and Southern Africa Through Capacity Building. Front. Sustain. Food Syst. 5:504063. doi: 10.3389/fsufs.2021.504063
Received: 10 October 2019; Accepted: 18 February 2021;
Published: 13 April 2021.
Edited by:
Kiersten Blair Johnson, United States Agency for International Development, United StatesReviewed by:
Weston Anderson, International Research Institute for Climate and Society (IRI), United StatesElena Lioubimtseva, Grand Valley State University, United States
Philemon Tsele, University of Pretoria, South Africa
Copyright © 2021 Shukla, Macharia, Husak, Landsfeld, Nakalembe, Blakeley, Adams and Way-Henthorne. This is an open-access article distributed under the terms of the Creative Commons Attribution License (CC BY). The use, distribution or reproduction in other forums is permitted, provided the original author(s) and the copyright owner(s) are credited and that the original publication in this journal is cited, in accordance with accepted academic practice. No use, distribution or reproduction is permitted which does not comply with these terms.
*Correspondence: Shraddhanand Shukla, c3NodWtsYUB1Y3NiLmVkdQ==