 Franziska Häfner
 Reiner Ruser1
 Kurt Möller
- 1Department of Fertilization and Soil Matter Dynamics, Institute of Crop Science, University of Hohenheim, Stuttgart, Germany
- 2Programme Area Next-Generation Horticultural Systems, Leibniz Institute of Vegetable and Ornamental Crops (IGZ), Großbeeren, Germany
- 3Department of Farm Management, Institute of Farm Management, University of Hohenheim, Stuttgart, Germany
- 4Center for Agricultural Technology Augustenberg (LTZ), Institute of Applied Crop Science, Rheinstetten-Forchheim, Germany
Anaerobic digestion (AD) can generate biogas while simultaneously producing digestate which can be used as fertilizer. Feedstocks used for AD influence digestate composition, which in turn may affect carbon (C) and nitrogen (N) turn-over in soils and subsequently influence nitrous oxide (N2O) emissions after soil application. Assessment of greenhouse gas emissions from digestates can help to evaluate the overall sustainability of an agricultural production system. The objective of this study was therefore to evaluate and understand the effect of differences in digestate composition on in situ N2O emissions within the 1st weeks after application of seven digestates. The digestates were derived from different feedstocks and 15N-labeled, either in total N or only in ammonium-N. Therefore, the experimental design enabled us to differentiate between potential N2O-N sources (i.e., digestate N or soil N). Furthermore, it allowed to distinguish to some extent between organic-N and ammonium-N as potential N sources for denitrification. Digestates were homogeneously incorporated into the upper 5 cm of microplots in an arable Haplic Luvisol in South Germany at a rate of 170 kg N ha−1. After application, N2O fluxes were measured for ~60 days (May-July) using the closed chamber method in 2 experimental years. Mainly due to higher precipitations in the 1st year, cumulative N2O emissions were higher (312–1,580 g N2O-N ha−1) compared to the emissions (133–690 g N2O-N ha−1) in the 2nd year. Between 16–33% (1st year) and 17–38% (2nd year) of N2O emissions originated from digestate N, indicating that digestate application triggered N2O production and release mainly from soil N. This effect was strongest immediately after digestate application. It was concluded that the first (short term) peak in N2O emissions after digestate application is largely related to denitrification of soil-N. However, the experimental setup does not allow to differentiate between the different denitrification pathways. Weather conditions showed a substantial effect on N2O emissions, where the correlation between N2O and CO2 flux rates hinted on denitrification as main N2O source. The effect of digestate composition, particularly organic N from the digestate, on soil N2O emissions seems to be of minor relevance.
Introduction
In the EU, about 180 million tons of anaerobic digestate are estimated to be produced per year, most of which is used as organic fertilizer (Corden et al., 2019). Digestates have been shown to have the potential to substitute mineral fertilizers and contribute to a sustainable soil management (Gutser et al., 2005; Cavalli et al., 2016; Verdi et al., 2019). However, application of organic as well as mineral nitrogen (N) fertilizers is also known to increase greenhouse gas (GHG) emissions from soils. Globally, agriculture contributes up to 20% to carbon dioxide equivalents (CO2-eq.) from all human activities (2010–2017), with nitrous oxide (N2O) and methane (CH4) as main GHGs (FAO, 2020). About 60% of anthropogenic N2O emissions are emitted by agricultural soils (Ciais et al., 2013), thus it is of high relevance to assess N2O in relation to fertilizer application.
Studies have shown that digestates might lead to a higher risk of N2O formation than manures, which is related to the higher share of ammonium (-N) after AD (Möller and Stinner, 2009). Ammonium is quickly nitrified to nitrate (), which can further be denitrified to dinitrogen gas (N2). Both processes, as well as nitrifier denitrification, bear the risk of producing N2O and are considered as main N2O source from soils (Granli and Bøckman, 1994; Bremner, 1997; Koola et al., 2010). Application of liquid manures like slurry or digestates provides available N and carbon (C), which in turn promotes heterotrophic activity (oxidation of C, N, S, etc.), depleting oxygen (O2) availability in soil, and thus favors creation of anaerobic microsites that ultimately trigger N2O production and release via denitrification (Chadwick et al., 2000; Petersen et al., 2003). Hence, N2O emissions largely depend on the availability of labile organic C (Corg), mineral N, O2 and water in the soil and their subsequent effect on soil microbial processes (Flessa and Beese, 2000; Ruser et al., 2001). However, AD has also been reported to reduce the N2O potential compared to the initial feedstock e.g., by decreasing slurry viscosity or increasing the recalcitrance of organic matter (OM) (Petersen, 1999; Möller, 2015).
The different organic substrates that are used as feedstock for anaerobic digestion (AD) affect the physico-chemical characteristics of the digestate (Fouda et al., 2013; Zirkler et al., 2014). For example, comparing food wastes and maize silage, food wastes are already processed goods with a high degradability and high protein content. Thereby, food waste-based digestates tend to have a higher OM degradability and a higher share of -N than maize silage, that could enhance soil microbial activity (Möller and Müller, 2012; Guilayn et al., 2020).
Based on compositional differences, such as N content, C/N ratio and OM degradability [Corg/organic N (Norg)], it can be assumed that digestates from different feedstocks will show differences in N2O emissions after field application. However, a differentiated consideration of the GHG emission potential for digestates from different feedstocks is currently scarce, and therefore will be the main research focus of this study.
The largest share of N2O release during the growing season usually occurs shortly after field application, with further peaks correlated to rainfall-events (Guzman-Bustamante et al., 2019; Herr et al., 2019) or freeze-thaw periods (Flessa et al., 1995; Rochette et al., 2008). For this reason, the following experiment was conducted to evaluate digestates regarding short-term N2O emissions on fallow land. To calculate the amount of N2O derived from the digestate, 15N-stable isotope labeling was used. The following hypotheses were tested:
(1) Digestates with varying physical and chemical properties will show different temporal N2O and 15N-N2O flux patterns.
(2) Application of these digestates will also result in different cumulative N2O emissions and N2O emission factors.
(3) The amount of N2O-N directly derived from the digestate will differ among the digestate types.
Materials and Methods
15N Labeling and Digestate Production
Labeled anaerobic digestates were prepared by cultivation of 15N-enriched plants in a comparable approach as applied by Schouten et al. (2012). Maize (Zea mays L. cv. Ronaldinio), ryegrass (Lolium perenne L. cv. Kentaur), and sugar beet (Beta vulgaris subsp. vulgaris, Altissima Group) were 15N labeled, by addition of 15N ammonium sulfate ((NH4)2SO4) as fertilizing solution. Ryegrass was cultivated in sand culture in 12 kg boxes of 10 cm height. For fertilization, 96.2 mg N kg −1 as (NH4)2SO4 (30 atom% 15N) solution was applied before sowing ryegrass. We cut the ryegrass three times in 30-days intervals. Sugar beet was grown in Mitscherlich pots with 12 kg sand. After pre-growing sugar beet seedlings in peat, two plants were set for each pot. Four rates of (NH4)2SO4 (50 atom% 15N) solution were applied during growth (in total 1.5 g N per pot). Maize was grown in a hydroponic system with two plants per 10-liter pot. Nutrient solution adapted after Engels (1999) with modified N concentration was exchanged twice a week. Within the first 5 weeks of growth, -N concentration was gradually increased, while -N supply was decreased to acclimate maize plants to primary -N nutrition. After this adaption phase for the plants, the N concentration was kept stable at 0.5 mM -N and 3 mM -N, in the form of calcium nitrate and ammonium sulfate. For 15N labeling, four additions of -N were substituted by 50 atom% 15N- and applied at BBCH stages: 16–19, 30–33, 51–55, and 71. As commonly done for maize, as energy crop, it was harvested at the dough-ripe stage. After harvest, ryegrass, maize sugar beet, as well as sugar beet leaves were immediately cut and homogenized by short blending (Thermomix TM31, Wuppertal, Gemany). The 15N enrichment of crops and harvest residues was determined by IRMS with previous freeze-drying, leading to 19.3 atom% 15N in maize, 26.1 atom% in ryegrass, 43.8 atom% in sugar beet, and 45.3 atom% in sugar beet leaves. After weighing the 15N-plant biomass into small portions, they were frozen at −20°C until anaerobic digestion in a batch reactor as previously described by Brulé (2014), Mönch-Tegeder et al. (2014).
Anaerobic digestion of the 15N-labeled plants and plant residues was carried out at the State Institute of Agricultural Engineering and Bioenergy, at the University of Hohenheim. Before, digestates from maize, grass silage and sugar beet were collected from biogas plants in southern Germany to be used as inoculum for AD of the 15N-feedstocks (maize, ryegrass, sugar beet, and leaves). Digestates were “starved” for 10 days according to the German standard VDI 4630 guideline (2016) to minimize residual gas production. During this starvation phase, the vessels were kept open and stirred to volatilize ammonia (NH3) from the inoculum. By decreasing -N in the digestate, hence total N concentration, a high 15N-signature could be assured, with only marginal N dilution of the added 15N-feedstock. Prior to AD, the inoculum was sieved to produce a homogeneous slurry. 15N-labeled ryegrass, maize, sugar beet, and sugar beet leaves were separately added to the substrate-specific inoculum in a ratio of 1:2.5 organic total solids (oTS) (VDI 4630, 2016). Anaerobic digestion was carried out in 2 liter fed-batch systems under mesophilic temperature at 37.5 ± 1°C for 60 days. During digestion, three feeding portions of 15N enriched plant substrates were added: at the start of the experiment, after 20, and after 40 days, respectively. Due to the amount of oTS added by the digestates, the 15N amount of the feedstocks was diluted by N contained in the inoculum, leading to a lower labeling of the 15N-digestates compared to the initial plant feedstock (Table 1).
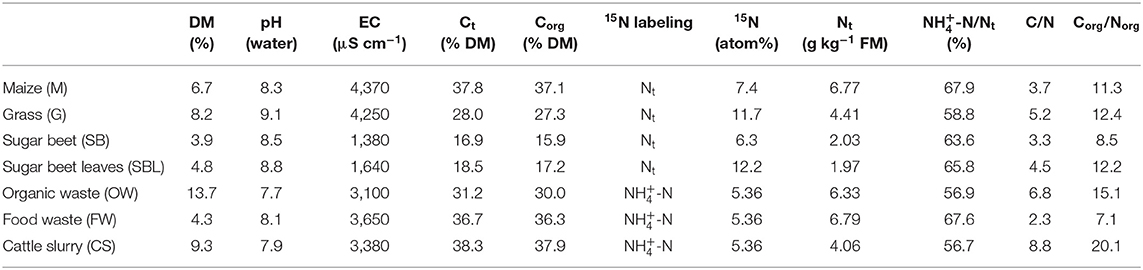
Table 1. Physico-chemical digestate properties, 15N-labeling and 15N abundance.
Additionally, digestates from existing biogas plants were included and the mineral -N fraction was labeled: organic waste digestate, food waste digestate, and cattle slurry digestate. The digestates were analyzed for total N and -N. Each digestate was filled into a glass beaker and put into a rotating water bath for 12 h at 37°C, to volatilize a small amount of NH3. Afterwards the digestates were analyzed again for total N and -N to assess the amount of N that was emitted. The lost N was substituted by addition of 15N-enriched (NH4)2SO4 solution to 5 atom% 15N excess. If more N was lost than resupplied by 15N-, ammonium chloride solution was added.
Experimental Design
The experiment was performed at the research station “Heidfeldhof” at the University of Hohenheim, 13 km south of Stuttgart, in South-Germany. The research station has a mean annual precipitation of 686 mm and a mean annual temperature of 8.8°C, monitored by a local meteorological station. The soil type of the arable field was a Haplic Luvisol (IUSS Working Group, 2015) with a silty loam soil texture (2% sand, 68% silt, and 30% clay), a bulk density of 1.24 g cm−3 in the upper 30 cm. Soil analytical results are presented in Table 2. The micro-plot field experiment (1 × 1 m plot size) was conducted as randomized block design with four replicates per treatment in 2 years 2016 (1st) and 2017 (2nd year) from May to July. The treatments consisted of one unfertilized control and seven 15N-labeled digestates based on maize (M), grass (G), sugar beet (SB), sugar beet leaves (SBL), organic waste (OW), food waste (FW), and cattle slurry (CS) (Table 1).
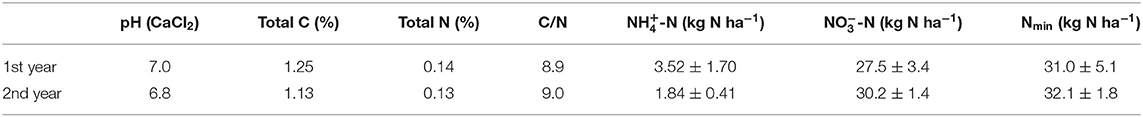
Table 2. Soil characteristic at the beginning of the experiment spring 2016 (1st year) and 2017 (2nd year), mean mineral N (Nmin) (± standard deviation (n = 2).
Gas Measurements and Analysis
The closed chamber system was used to monitor N2O, CO2, and methane (CH4) soil fluxes (Hutchinson and Mosier, 1981). The system consisted of a polyvinyl chloride (PVC) base ring (30 cm inner diameter) and a corresponding chamber (Pfab et al., 2011). Within the center of the 1 m2 micro plot, the PVC base ring was embedded 10 cm deep in the soil. The 15N-labeled digestates (Table 1) were applied at a rate of 170 kg N ha−1, meaning 1.2 g N per base ring and quickly incorporated into the upper 5–10 cm of the soil. In order to do so, a 10 cm deep furrow was dug across the ring, using a spade. Digestate was filled into the furrow, covered by soil and mixed. The same procedure was done for the unfertilized control using water. The amount of water (290 ml) corresponded to the average volume of digestate application. Directly after application, the first gas measurement was performed. For gas sampling between 8.00 and 12.00 am, the base ring was covered with the dark, vented PVC chamber, sealed by a rubber ring to collect the trace gas. The chambers were closed for 45–60 min. The first gas sample was directly taken after closure, followed by additional sampling every 15–20 min using a syringe and transferred into evacuated 20 ml gas vials. At the same time, two additional gas samples were collected into 100 ml vials at the start and end of each measurement for 15N-N2O determination. Soil and chamber temperature were recorded within each block from two random plots at beginning and end of sampling. Within the 1st month, gas samples were taken 3–4 times a week. Afterwards the sampling frequency was reduced to once or twice per week, with additional samplings after strong rainfall events. In both years 20 gas samplings were performed and measured for N2O, CO2, and CH4, whereas 13–15 out of 20 15N-N2O gas samples could be measured due to cost and time reasons in the 1st and 2nd year, respectively.
Gas samples were measured with a gas chromatograph (GC 450 Greenhouse Gas Analyzer, Bruker Daltonic, Bremen, Germany) equipped with electron capture detector (ECD) and flame ionization detector (FID) and an automatic sampler (GX-281, Gilson, Limburg, Germany). During GC measurements, concentrations of N2O and CO2 were analyzed with a 63Ni ECD and CH4 concentrations were determined with the FID. Fluxes of N2O, CO2, and CH4 were calculated by an extended version of the R (R Core Team, 2016) package “gasfluxes” (Fuß and Asger, 2014).
Analysis of Digestate and Soil
Digestates were dried at 105°C for dry matter (DM) analysis. Total C (Ct) was measured by Dumas combustion via elemental analysis (Elementar vario MAX CN, Analysensysteme GmbH, Hanau, Germany). Carbonate content was determined volumetrically using the Scheibler method according to DIN 10693 (2014). Thus, organic C can be calculated as the difference between Ct and Carbonate-C. Total N (Nt) and of fresh matter (FM) digestate sample was determined by Kjeldahl method. Organic N was derived by the difference of from Nt. The pH value was measured in FM digestate using 0.01 mol L−1 calcium chloride solution (1:10 w/w).
Soil mineral N (Nmin)was determined by extraction with 0.5 M potassium sulfate solution (1:4) and measured colorimetrically with a photometer (Flow-injection-analyzer 3 QUAAtro, SEAL Analytical, UK). Bulk density of the top soil was determined using 100 ml stainless steel cylinders in the field.
Total N and C, and 15N-signature of 15N-labeled plant substrates, soil and digestate was measured with a CN-elemental analyzer (EuroVector, HEKAtech, Wegberg, Germany) with Isotope Ratio Mass Spectrometer (IRMS) (Delta plus Advantage, Thermo Finnigan, Bremen, Germany). For the determination of the 15N abundance in N2O we used an IRMS delta plus (Finnigan MAT, Bremen, Germany) coupled with an automated PreCon-Interface (Brand, 1995).
Statistics and Calculations
Trapezoidal linear interpolation of daily gas fluxes (N2O and CH4) was used to calculate total cumulative emissions for the 55–58 days of the experiment in the 1st and 2nd year, respectively. The percentage of N2O-N originating from digestate N (Nd) was calculated by equation (1), with digestate i at sampling time t. Atom%15N excess was calculated by subtraction of the natural abundance of N2O in the atmosphere (0.369 atom%) from the measured 15N. The daily N2O flux rate (μg N2O–N m−2 h−1) was multiplied with Nd in equation (2) to determine the amount of N2O derived from digestate (15N-N2O) as reported by Senbayram et al. (2009). We calculated the recovery (%) of 15N applied by summing up 15N content of the soil at the end of the experiment and cumulative 15N-N2O loss. This sum was then divided by the amount of 15N applied by the digestate as described by Pfab (2011).
Digestate derived fluxes (15N-N2O) were also linearly interpolated to calculate cumulative (cum) 15N-N2O emissions. The total share of N derived from digestate (total Nd) in cumulative N2O was calculated by Equation (3). As suggested by Schleusner et al. (2018), the amount of primed N2O-N lost by fertilizer application was calculated by a simplified approach accounting for cumulative N2O-N emissions of the unfertilized control treatment (Equation 4), without considering other gaseous losses via NH3 or N2.
N2O emission factors (EFs) were calculated according to the IPCC guidelines for direct emissions (Equation 5), meaning total cumulative N2O-N emissions accounted for the control, per applied N (IPCC, 2019). The disaggregated IPCC N2O EF for “other N inputs in wet climates” with the default value of 0.6% was applied for comparison, where other N inputs refer to organic amendments such as digestates. Field conditions of the experimental site showed a positive water balance and fit with IPCC conditions for wet climates (IPCC, 2019). Greenhouse gas emissions of N2O and CH4 were transformed to CO2-eq. to assess the total global warming potential (GWP) of each digestate. The default values of 296 g g−1 CO2 for N2O and 24 g g−1 CO2 for CH4 were applied to the measured emissions. Ammonia (NH3) volatilization within the first 72 h was derived from the ALFAM2 model to calculate potential indirect N2O emissions (Hafner et al., 2019). The model is used to predict NH3-N losses within the first 72 h from animal slurry and therefore holds a higher uncertainty for digestates. Digestate NH3-N losses mainly served as an indicator for the amount of indirect N2O emissions. Indirect emissions from leaching were not accounted for. According to IPCC (2019) 1% of NH3-N losses was assumed to be re-deposited as N2O-N. Soil organic C stocks were presumed to be stable over the experimental period, thus, CO2 fluxes were not considered for the calculation of total GWP (Herr et al., 2020).
Water filled pore space (WFPS) was calculated by Equation (6) using the measured volumetric water content (WCvol) and porosity (P),
where P is depicted as soil bulk density (ρd) and solid particle density (ρs) (Equation 7). For ρs the density of quartz (2.65 g cm−3) was assumed.
For each year, a regression analysis of N2O fluxes was calculated, using a stepwise forward selection in a multiple linear regression approach. Air temperature (2 m height), WFPS and CO2 fluxes were included as independent variables within the model (8). Only significant variables remained in the model (α = 0.05) and the square root of the partial R2 was determined. Same regression procedure was applied for cumulative N2O and 15N-N2O emissions within each year separately. For this approach the effect of digestate composition was determined, using -N share, and the ratios C/N and Corg/Norg in model (9).
where yi is the observation of the ith digestate treatment, μ represents the average response, βn are the parameters of fixed effects, bi is the complete block effect and ei is the error of yi.
Significant differences among treatments for cumulative N2O, CH4, CO2, as well as 15N-N2O and total Nd (%) were determined by the Proc MIXED procedure and the Tukey test (α = 0.05). The MIXED procedure can fit various mixed linear models to data and produces the appropriate statistics (SAS Institute Inc, 2015). All statistical analyses were performed with SAS 9.4 (SAS Institute, Cary NC, USA). Graphics were produced with SigmaPlot 11.0 (Systat Software GmbH, Erkrath, Germany).
Results
Meteorological Conditions
Weather conditions showed distinct differences in precipitation between the 2 experimental years. Over the 1st and 2nd year, 183 and 178 mm of precipitation were measured during the 55 and 58 days when the experiment lasted, respectively (Figure 1). Within the first 30 days of measurements the rainfall pattern differed, showing 155 mm in the 1st compared to 86.2 mm precipitation in the 2nd year. In the 1st year, two strong rainfall events occurred on day 12 (33.2 mm) and day 22 (39.5 mm). In contrast, the 2nd year showed lower rainfall events on day 6 and 27 with 18.8–22.2 mm, and two stronger events at the end of the experiment on day 51 and 52 (32.2–27.4 mm). The mean air temperature over the experimental period was 17.1°C in the 1st and 18.0°C in the 2nd year.
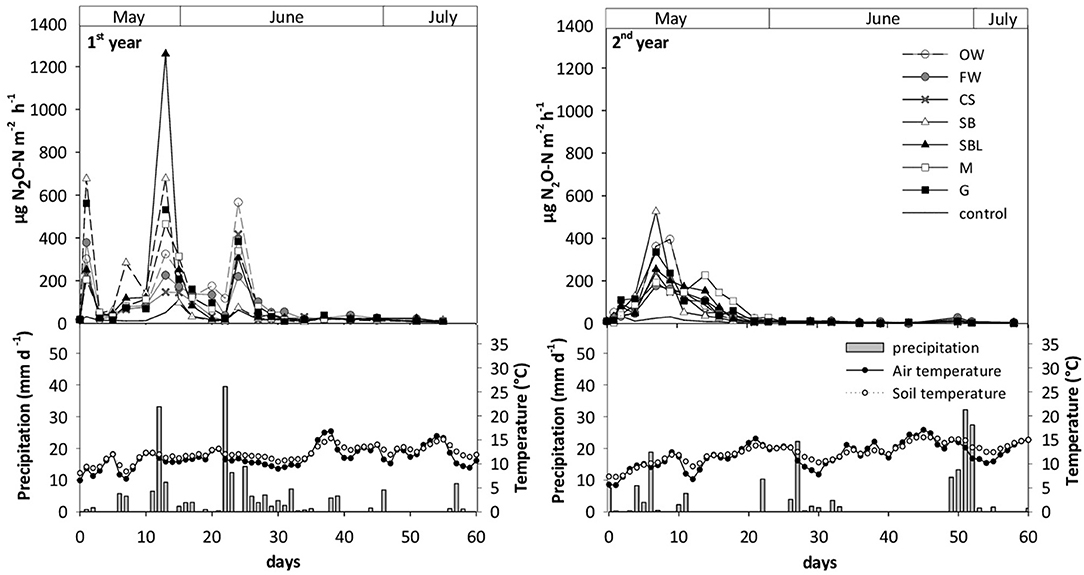
Figure 1. Mean daily N2O fluxes after application of different digestates based on organic waste (OW), food waste (FW), cattle slurry (CS), sugar beet (SB), sugar beet leaves (SBL), maize (M), grass (G), and unfertilized soil (control) measured from May to July 2016 and 2017 (1st and 2nd year) at Heidfeldhof. Digestate application of 170 kg N ha−1 on day 1. Standard error of measurements was excluded due to improved clarity, but shown in 15N fluxes (Figures 2, 3). Climate data with mean daily precipitation on the left y-axis and mean daily temperature on the right y-axis.
Temporal N2O Fluxes
Nitrous oxide fluxes measured in the 2 experimental years showed distinct differences in peak number and flux magnitude. In both years N2O pulses occurred directly after digestate fertilization and after strong rainfall events (Figure 1). Three major peaks were detected in the 1st year: one directly after digestate application, the second and third peak after 13 and 24 days, and a minor peak after 1 week, following strong rainfall events on day 12 and 23. Highest N2O flux rate in the 1st year was measured with the SBL treatment on day 13 (1,260 μg N2O-N m−2 h−1). In the 2nd year, the N2O pulse developing directly after N fertilization did not reach the same magnitude as in the 1st year and appeared 1 day later. Highest N2O flux in the 2nd year followed a rainfall event 1 week after digestate application reaching up to 424 μg N2O-N m−2 h−1 with SB (Figure 1). The peak decreased sharply in case of SB, and gradually until day 14 for the other digestates. After another strong rainfall event on day 22 (2nd year), only FW showed a slight N2O rise (38 μg N2O-N m−2 h−1). Approaching the end of the experiment, 50 days after digestate application, a small peak (5.22–21.9 μg N2O N m−2 h−1) was noted within 4 days of continuous rainfall (Figure 1).
In both years, WFPS showed a significant positive linear correlation with N2O flux rates, r = 0.400 (p < 0.001) and r = 0.454 (p < 0.001) in the 1st and 2nd year, respectively. Similarly, CO2 fluxes correlated with N2O fluxes, exhibiting r = 0.233 (p < 0.001) in the 1st year, and a weaker coefficient of correlation in the 2nd year (r = 0.144, p < 0.001). Soil temperature showed a negative correlation with N2O fluxes (r = −0.340; p < 0.001) in the 2nd year, but no significant correlation in the 1st year. All parameters (WFPS, soil temperature and CO2) combined in a linear regression model (model 8) could account for 28.1 to 20.9 % of the prediction of N2O fluxes in the 1st and 2nd year, respectively (Table 3).
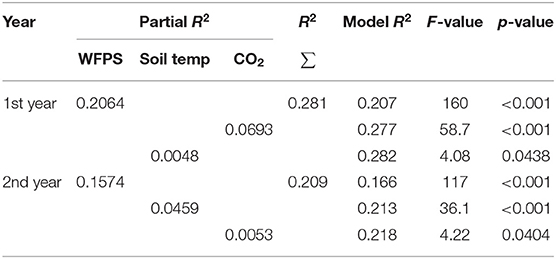
Table 3. Output of (stepwise forward) regression analysis for N2O fluxes in the 1st and 2nd year, testing for the inclusion of parameters CO2 flux, water filled pore space (WFPS), and soil temperature into the model (model 8).
Temporal 15N-N2O Fluxes
Total N2O and digestate derived 15N-N2O fluxes in the 1st year are shown in Figure 2 and the 2nd year data are shown in Figure 3. A comparable trend was observed for both 15Nt- and 15-N-labeled digestates in each year, with variations in flux magnitude of 15N-N2O among digestates (Supplementary Tables 2, 3).
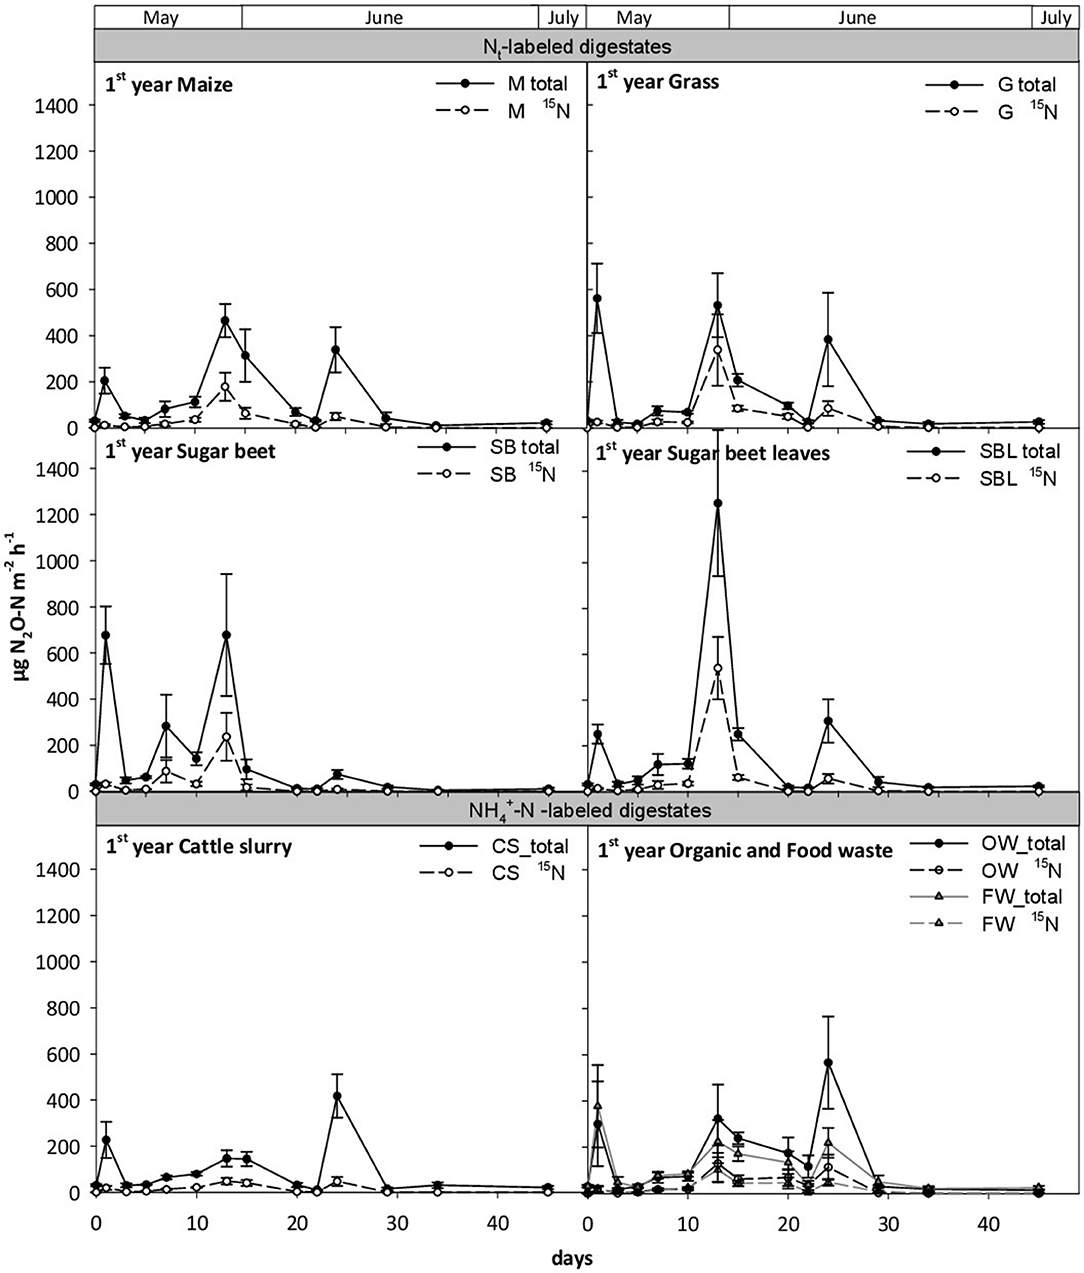
Figure 2. Mean daily N2O fluxes (total) and digestate-derived 15N-N2O fluxes (15N) within the 1st year Digestates from maize (M), grass (G) sugar beet (SB), and sugar beet leaves (SBL) were 15Nt-labeled (mineral and organic N) and digestates based on cattle slurry (CS), organic waste (OW), and food waste (FW), were 15N-labeled only in the -N pool. Error bars indicate the standard error (n = 4).
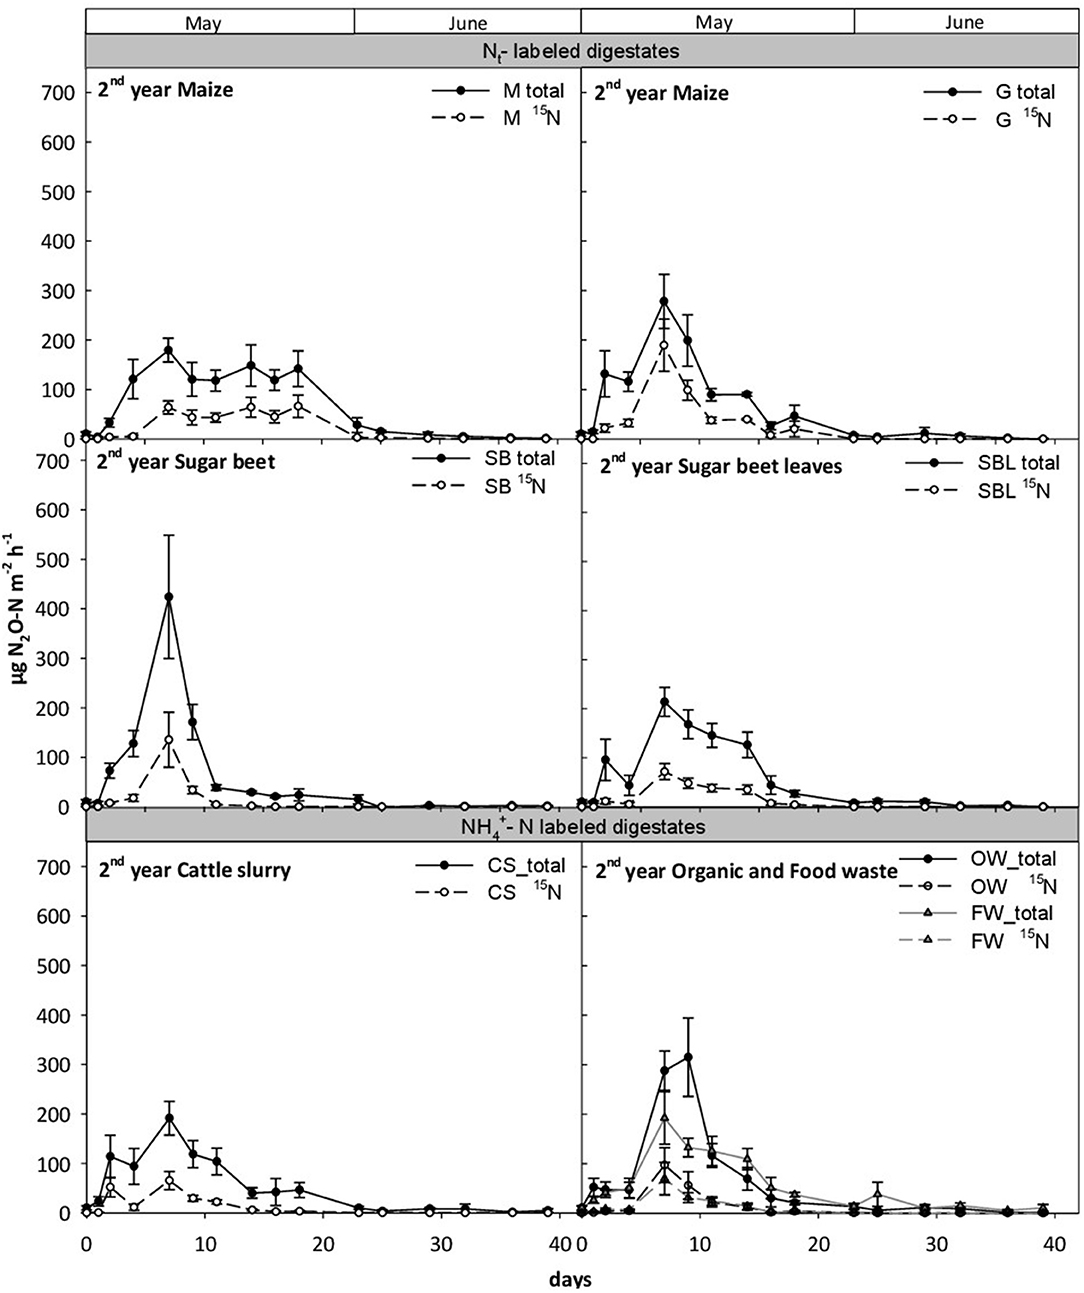
Figure 3. Mean daily N2O fluxes (total) and digestate-derived 15N-N2O fluxes (15N) within the 2nd year Digestates from maize (M), grass (G) sugar beet (SB), and sugar beet leaves (SBL) were 15Nt-labeled (mineral and organic N) and digestates based on cattle slurry (CS), organic waste (OW), and food waste (FW), were 15N-labeled only in the -N pool. Error bars indicate the standard error (n = 4).
In the 1st year, the emerging peak directly after digestate application showed a low 15N signature, indicating that 92.4–96.5% of N2O was derived from soil internal N sources (Supplementary Table 2). Within the first 10 days after digestate application, 15N-N2O fluxes showed no significant differences among treatments (Supplementary Table 2). Only on day 7, a small peak in 15N-N2O (13–87 μg 15N-N2O-N m−2 h−1) appeared, and SB showed significantly higher emissions than M, OW, FW, and CS. On that day, ~18–30% of N2O-N was derived from digestates (Figure 2 and Supplementary Table 2). During the highest peak on day 13, a significant proportion of digestate-based N2O-N (31–59%) was emitted. Highest 15N-N2O among digestates was measured with SBL (539 μg 15N-N2O-N m−2 h−1), not significantly different from G (338 μg 15N-N2O-N m−2 h−1). Following the two peaks on day 7 as well as on day 13, lower total N2O and 15N-N2O fluxes were measured, but the share of digestate-derived N was still relatively high (Supplementary Table 2). The last major peak appeared on day 24 (10–114 μg 15N-N2O-N m−2 h−1), with 10–27% N2O-N originating from digestates. Flux rates peaking on day 24 were comparable among most treatments, and only OW exhibited significantly higher flux rates than SB. Prior to peaks of day 24, OW already indicated a rising flux rate on day 20, being significantly higher than all digestates, except G and FW. The flux rate further increased on day 22, where OW significantly exceeded all other treatments (Figure 2 and Supplementary Table 2). Within the first 3 weeks of measurements, flux pattern of CS digestate significantly differed from the other treatments, where 15N-N2O gradually increased after 7 days and reached its maximum on 13 (Figure 2). At both peaks, on day 13 and 24, 15N-N2O flux rates of CS were in a comparable range (48–40 μg 15N-N2O-N m−2 h−1). The 2nd year showed a similar temporal pattern in 15N-N2O abundance over the duration of the experiment. The first pulse after digestate application was observed 2 days after application with more than 80% soil-borne N2O-N. Only CS showed lower soil-borne N2O-N, thus highest digestate derived N2O-N (45%) among digestates (Supplementary Table 3). The major peak in total N2O and 15N-N2O appeared after 1 week (Figure 3), with highest 15N-N2O flux measured in G (189 μg 15N-N2O-N m−2 h−1) showing 67% digestate-derived N. In contrast, 28–36% of N2O-N was emitted from the other digestate treatments on that day (Supplementary Table 3). From day 7 to day 18, 15N-N2O gradually decreased for all digestates to 0.3–20 μg 15N-N2O-N m−2 h−1, except for M being significantly higher (66.1 μg 15N-N2O-N m−2 h−1 on day 18). From day 18 through 29, the M treatment continued to show higher 15N fluxes compared with the other digestates, even though these emission rates were quite low (from 1.1 to 2.7 μg 15N-N2O-N m−2 h−1).
Cumulative N2O and 15N-N2O Evolution and Emission Factors
Total cumulative N2O emissions in the 1st year (302–1,345 g N2O-N ha−1) were more than twice as high as in the 2nd year (124–613 g N2O ha−1) (Figure 4 and Table 4). In both years, digestates lead to significantly higher N2O emissions than the unfertilized control. Differences among digestates were observed only in the 1st year, with significantly higher N2O emissions for SBL compared to CS and FW (Figure 4). Compared to total N2O emissions, digestate-based 15N-N2O emissions indicated larger differences between the different treatments in both years (Figure 4). In the 1st year, G and SBL emitted significantly more 15N-N2O than CS, while all other treatments did not differ significantly. In the 2nd year, highest 15N-N2O emission was measured with G and M, while all -N-labeled digestates OW, FW and CS, as well as SB and SBL were comparable. Calculated amounts of primed N2O-N showed that significant higher N2O-N losses were induced by SBL compared with CS in the 1st year (Table 4). In the 2nd year, there were no significant differences among digestates. Total Nd emitted by the digestates was 16–33% in the 1st, and 17–38% in the 2nd year (Table 5). Grass digestate tended to show the highest share of digestate derived Nd in both years.
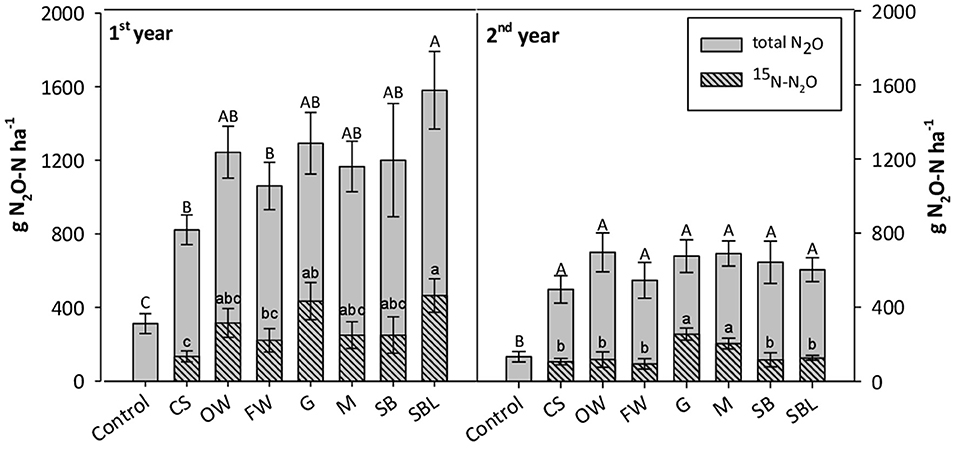
Figure 4. Total cumulative N2O-N emissions derived from digestate (15N-N2O) 55 (1st year) and 58 days (2nd year) after digestate application. In both years, measurements were conducted from May to July. Unfertilized soil served as control. Digestates from cattle slurry (CS), organic waste (OW), food waste (FW) were 15N-labeled only in -N; digestates based on grass (G), maize (M), grass (G), sugar beet (SB), and sugar beet leaves (SBL) were 15Nt-labeled (mineral and organic N). Error bars show standard error (n = 4). Different letters indicate significant differences at p < 0.05 (Tukey Test); Capital letters refer to total N2O and small letters to 15N-N2O.
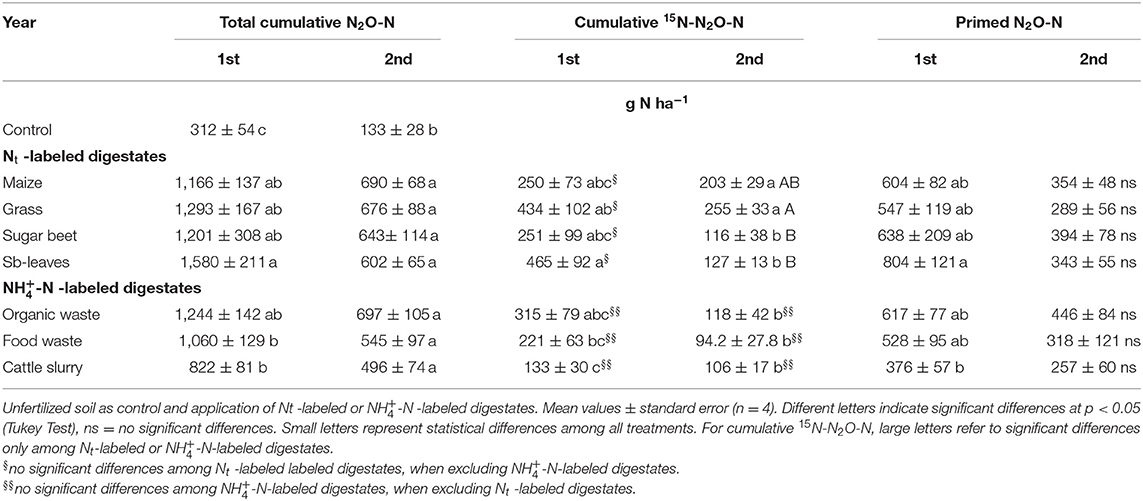
Table 4. Total cumulative N2O-N, 15N-N2O-N emissions, and primed N2O-N emissions after 55 (1st) and 58 days (2nd year).
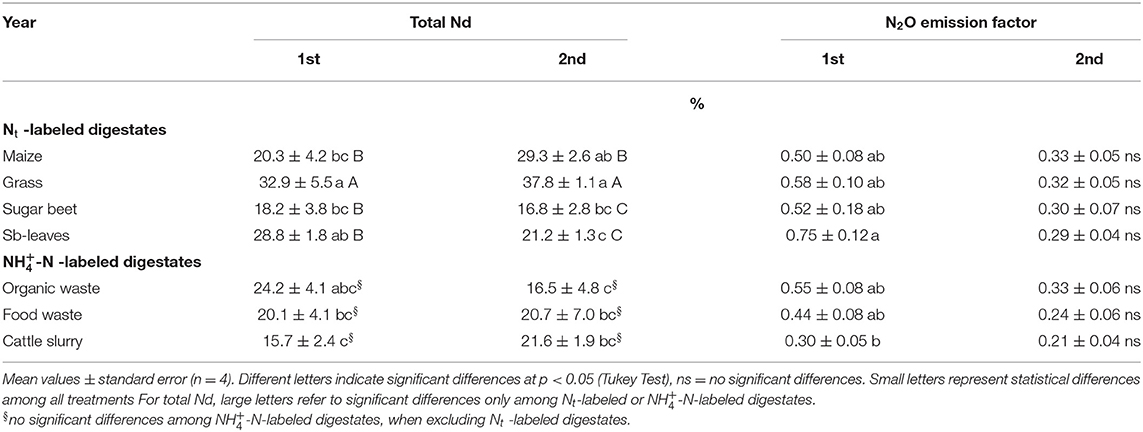
Table 5. Share of digestate derived N2O-N on total N2O emissions (Total Nd) and N2O-N emission factors after 55 (1st) and 58 days (2nd year).
There was no correlation of digestate properties (C/N, Corg/Norg, -N/Nt) with N2O emissions. The respective digestate characteristics did not help to predict cumulative N2O or 15N-N2O emissions in a multiple (stepwise forward) linear regression model (model 9).
According to IPCC guidelines, ~0.6% of the annual amount of total N of organic amendments applied as fertilizer is lost as N2O-N in wet climates (IPCC, 2019). In the 1st year, most digestates approached this IPCC EF within only 55 days and SBL even exceeded it with 0.75% (Table 5). Only FW and CS indicated lower EFs than the IPCC default value in the 1st year, with 0.44 and 0.30%, respectively. Related to the overall lower cumulative N2O emissions of the 2nd year, mean N2O EFs were below 0.33% and in a comparable range for all digestates.
Total 15N recovery within cumulative N2O and soil N at the end of the experiment was 10–57% and 27–64% in the 1st and 2nd year, respectively (Supplementary Table 4). The largest share of digestate 15N remained in the soil.
Total Global Warming Potential
Cumulative CH4-C emissions were significantly higher in the 1st year compared to the 2nd. In both years, unfertilized soil served as CH4 sink (−147 to −184 g CH4-C ha−1) (Table 5). Within the 1st year, emissions among digestates ranged between 0.26 and 1.82 kg CH4-C ha−1 and decreased in the following order SBL ≥ CS ≥ FW, OW, SB ≥ M, G ≥ control. In the 2nd year, digestates as well as unfertilized soil were comparable and digestates indicated CH4-C emissions close to zero (Table 6).
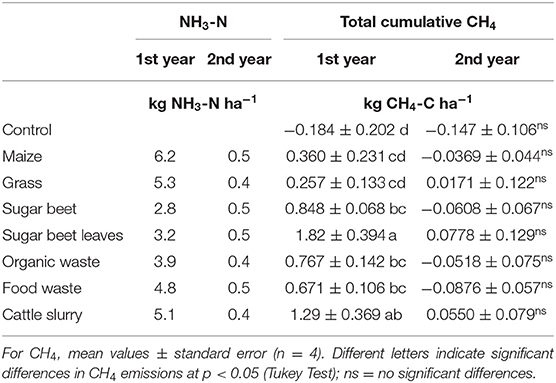
Table 6. Modeled NH3-N losses over the first 72 h after application (ALFAM2 model) and total cumulative CH4 fluxes of digestates and unfertilized soil (control) after 55 (1st) and 58 days (2nd year).
In both years, the release of CO2-eq after digestate application was significantly higher than in the control (Table 7). Significant differences among digestates were only noted in the 1st year, where SBL caused significantly higher total CO2-eq. than M, FW, and CS. In both years, N2O emissions made up the largest share in total GHG emissions, based on CO2-eq, above 85.6% in the 1st and almost 100% in the 2nd year.
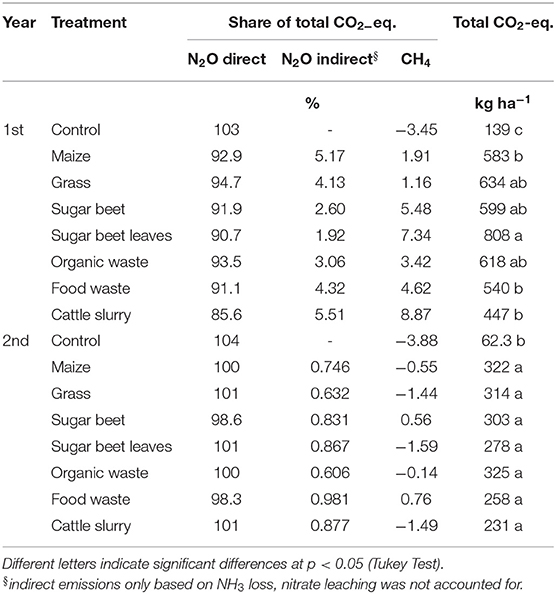
Table 7. Carbon dioxide equivalents (CO2-eq.) of unfertilized soil (control) and soil after application of different digestates, originating from maize, grass, sugar beet, sugar beet leaves, organic waste, food waste, and cattle slurry, based on cumulative N2O and CH4 emissions (kg ha−1) after 55 (1st) and 58 days (2nd year); and indirect N2O emission as NH3-N volatilization over 72 h after application.
Discussion
Temporal N2O and 15N-N2O Fluxes
The high temporal variability of N2O fluxes in this study, with increased flux rates after application of crop residues or organic fertilizers and after rainfall events, was similarly documented in other experiments (Pfab et al., 2012; Herr et al., 2019). Ultimately, N2O fluxes leveled off 30 days after digestate application in both years with drying of the soil during warm periods with low rainfall. Dry conditions with low WFPS have often been reported to result in low N2O emissions from arable soils even if these soils were well-provided with microbial easily degradable C and available N (Möller and Stinner, 2009; Pezzolla et al., 2012). However, in the 2nd year strong rainfall events were recorded 50 days after digestate application and only caused a minor increase in N2O fluxes (Figure 1). Hence, digestate-related effects were short-term and had the highest impact on N2O release within the first 30 days after application.
First Peak After Digestate Application
Peaks evolving shortly after organic N fertilizer application, such as digestates or manures, have been reported by several studies (Wulf et al., 2002; Johansen et al., 2013; Holly et al., 2017). As indicated by 15N measurements in both years, the first N2O peak after digestate application showed a low 15N abundance, demonstrating that more than 90% of N2O-N was derived from soil N (Figures 2, 3). However, the experimental setup does not allow for a differentiation between nitrification and denitrification. Therefore, we can only conclude that the first N2O peak was mainly derived from soil N. The high share of soil-borne N suggests that the addition of OM positively affected microbial activity which further enhanced the turnover of native soil-N, as also stated by Schleusner et al. (2018). Furthermore, digestate or slurry application moistened the soil close to the applied fertilizer, another factor that has been shown to promote denitrification of -N (Comfort et al., 1990). Moreover, CO2 flux rates were elevated directly after digestate fertilization (Supplementary Figure 1), supporting the assumption of increased microbial activity which further stimulated denitrification of by O2 depletion (Buchen-Tschiskale et al., 2020). However, these are only speculations, as soil Nmin and its 15N-signature was not measured during the experiment. It should also be considered that digestates contain carbonate-C ( and ): the higher the total N content, the higher the carbonate-C content (Georgacakis et al., 1982). Carbonate-C in the digestates can also contribute to soil CO2 release within the 1st days after application (Chen et al., 2011). For example, carbonate-C release from digestates can occur after application to acidic soils (Chen et al., 2011), which is not the case in present study, or due to microbial turnover processes (Tamir et al., 2013). Therefore, the immediate effects of digestate application on soil microbial activity and the related CO2 release might be masked by decomposition of carbonate-C to CO2. In order to elucidate the driving processes related to the N turnover processes in the soil shortly after digestate application, a more detailed measurement of the pathways of the different fractions of soil and digestate N (, Norg), as well as digestate C (Corg, carbonate-C), is necessary.
Rainfall-Induced Peaks
The emission pattern found in present study strongly coincided with the precipitation pattern, providing a major indication that the environmental conditions are the main driving factor for soil N2O fluxes. Also the unfertilized control showed a significant increase in N2O flux rates after rainfall, whereas almost no fluxes were observed in dry periods. The occurrence of increased N2O fluxes in conjunction with heavy rainfall events, hence a high soil WFPS, is typical for arable fields and has extensively been described in the literature (Pfab et al., 2011; Senbayram et al., 2014; Ruser et al., 2017).
Contribution of Digestate N and Soil N Pool to N2O Emissions
The largest rainfall-induced N2O peaks in both years, had also the highest 15N abundance, with up to 56–66% of N2O-N derived from the digestate (Figures 3, 4 and Supplementary Tables 2, 3). Although it was shown that even at a high soil moisture of 70% WFPS nitrification may also contribute to the N2O-release from soils (Ruser et al., 2006), the positive correlations between N2O flux rates and CO2 flux rates as well as between N2O fluxes and soil moisture (Table 3) indicate that denitrification is the driving process releasing N2O after rainfall. The contribution of denitrification to the N2O release generally increases with increasing soil moisture (Davidson, 1991). When compared to soil air, the ~10−4 lower diffusion coefficient for atmospheric O2 in soil water (Heincke and Kaupenjohann, 1999) restricts O2 delivery, the creation of anaerobic conditions is favored. Similarly, the turn-over of fresh OM, as indicated by the increased CO2 fluxes, further depletes O2 availability and thus fuels anaerobiosis (Flessa and Beese, 1995).
The largest peaks evolved 13 (1st year) and 7 days (2nd year) after digestate application, where presumably digestate -N was already nitrified (Johansen et al., 2013) and available for denitrification, thus, explaining the high share of digestate-based N2O-N. Senbayram et al. (2009) observed that nitrification of 15N-labeled digestate rapidly increased 1 week after application in a pot experiment initiating a rise in N2O flux rates, as also noted in our study. It cannot be excluded that beside denitrification also nitrification contributed a share of the measured N2O. Yet, Köster et al. (2011) measured the intramolecular 15N distribution in N2O within a 43-days incubation experiment, showing that bacterial denitrification was the main process emitting N2O after application of food waste digestate, driven by C availability. This is in line with other studies, reporting that the largest N2O-N contribution of digestates was caused by denitrification, even at 65% WHC (Senbayram et al., 2009). Later N2O peaks (1st year, day 24) showed lower 15N-N2O fluxes, hence indicating an increasing share of N2O from soil-internal N. This shift in 15N-N2O abundance over the measuring period indicates increased effects of the soil microbial processes, affecting N availability and N2O emissions, and might result from mineralization of digestate 15Norg-N and subsequent processes. A comparable shift was observed by Senbayram et al. (2014).
For both, -N or Nt-labeled digestates, the low shares of fertilizer-derived N2O-N supported the notion that the largest source of N2O was native soil N (> 62%, Table 5). The open hypothesis of an “enhanced soil-derived N2O” stated by Senbayram et al. (2014), regarding the low share of emitted digestate-N, can therefore be confirmed. This triggering effect on N2O emissions due to digestate application was accounted for by a simplified calculation via equation 4. The amount of triggered N2O-N reflects the high share of soil-derived N2O, and was approximately half of total cumulative N2O emissions (Table 4). Significant differences in primed N2O-N among digestates followed the same trend as N2O emissions. For -N-labeled digestates, N2O-N losses which might originate from digestate Norg, were not accounted for. Therefore, the amount of primed N2O-N might be overestimated.
In general, the rather comparable share of total digestate-derived N2O-N losses among the digestates with different labeling approaches indicates that digestate-Norg plays only a minor role in short-term N2O formation. Senbayram et al. (2014) labeled only the mineral N fraction of a digestate and found 31% of N2O-N was derived from the digestate mineral fraction. The share of digestate-derived N2O-N losses among -N-labeled digestates FW, OW and CS ranged from 15.7 to 24.2% over the 2 years. For these digestates as well as for the digestates in the study of Senbayram et al. (2014) it cannot be excluded that non-labeled organic N was mineralized and emitted as N2O. However, the Nt-labeled digestates, M, G, SB, and SBL showed a rather comparable range with 18.2–37.8% digestate-N being emitted as N2O over the 2 years. Similar to our findings, also other studies reported a higher share of N2O-N originating from the soil N pool than from fertilizer N. For instance, only 22% of N2O-N was derived from 15N-labeled manure after 22 days (Ingold et al., 2018) or 40.4% from 15N-urea after 35 days (Roman-Perez and Hernandez-Ramirez, 2020) in incubation experiments. In a field study, -N-labeled cattle slurry was applied, which produced higher fertilizer-derived N2O emissions within the first 10 days, but higher soil-derived N2O 11–22 days after application (Dittert et al., 2001). However, the study was carried out on grassland and using the injection technique (Dittert et al., 2001), which has been reported to increase N2O emissions compared to trail hose application with immediate incorporation (Herr et al., 2019).
N2O Emissions Affected by Fertilizer Type
As previously described, N2O fluxes were shaped and influenced by weather conditions and soil microbial processes. Environmental conditions and soil type may play a more important role than the fertilizer type, as previously suggested by Senbayram et al. (2014): the authors noted no significant differences in N2O emissions between mineral and organic N fertilization. However, in both years, significant differences among digestates were noted on several sampling dates, for N2O as well as 15N-N2O fluxes (e.g., flux rates from M digestate vs. fluxes from SB digestate in Figure 2 and Supplementary Tables 1–3), indicating that digestate composition affects N2O emissions. This supports hypothesis (1), that digestates from different feedstocks will differ in N2O flux rates.
However, regarding cumulative effects, there was no clear indication that the digestate type influenced total N2O emissions. This was supported by the lack of a significant correlation between digestate composition (/N, C/N, Corg/Norg) and cumulative N2O or 15N2O. Only measurements of the 1st year showed significant differences among digestates. Therefore, hypothesis (2) had to be rejected for the 2nd year and could be partly accepted for the 1st year. Yet, when separating cumulative 15N-N2O data into Nt-labeled and -N-labeled digestates, there was a significant effect of C/N ratio in the 1st year, predicting 22.1% of 15N-N2O emissions of 15Nt-labeled digestates (R2 = 0.36, F-value = 3.81, p-value = 0.077). For the 2nd year, Corg/Norg accounted for 39.2% (R2 = 0.56, F-value = 9.85, p-value = 0.0094) of 15N-N2O emissions among 15Nt-digestates (M, G, SB, and SBL). Also Abubaker et al. (2013) noted significantly different cumulative N2O emissions after 24 days between two types of urban waste digestates, which were low or high organic C. For -N-labeled digestates, there was no significant relation of digestate properties to 15N-N2O emissions. Hence, the correlation between digestate properties and N2O emissions seems more strongly related to the total N and Norg content of digestates, than -N. Regarding the total share of digestate-derived N2O-N (Nd), significant differences among digestates (Table 5) could support hypothesis (3).
Ultimately, the results of the present study suggest that the different digestate types influenced cumulative N2O, flux rates and digestate derived N2O-N only marginally. Hence, N2O emissions were more strongly affected by environmental conditions (Table 3). The effect of digestate properties on total N2O emissions was overlaid to some extent by the high amount of N2O from the native soil N pool. Abubaker et al. (2013) incubated two digestates in three soil textures and noted considerable differences regarding emission peaks and cumulative N2O-N emissions among digestates, particularly in the sandy soil. In loam, digestates showed comparable total N2O emissions (Abubaker et al., 2013). Therefore, N2O emissions discussed in this study might differ on soils with different soil textures or amendment history (Rosace et al., 2020). In this context, soil texture, soil amendment history and fertility status, especially OM content, plays a crucial role, exceeding the effect of digestate properties.
Digestate Emission Factors and Practical Consequences
Digestate EFs determined in this study (0.21–0.75%) were all within the range of the IPCC default value, except for SBL in the 1st year (Table 5). However, these EFs will not cover the whole year and might underestimate the total EF of the digestates. Shang et al. (2020) determined 10–30% lower EFs when only the growing season and not the whole year N2O emissions were considered. Moreover, the authors found that the differences between EFs of the whole year and growing season were higher with higher precipitation (Shang et al., 2020). The experimental design of the present study used bare soil, hence there were no crops removing the applied digestate N. Crop N uptake could have decreased available N from the soil as well as soil moisture, which could have lowered digestate-derived N2O emissions and EFs. Thorman et al. (2020) determined annual N2O EFs from different organic amendments, top-dressed to a cereal crop (0.15–0.73% in 2011 and 0.27–0.51% in 2012), which were in a comparable range with our EFs. Most digestate EFs did not show significant differences, except SBL compared with CS in the 1st year, thus hypothesis (2) cannot be fully confirmed.
Soil derived N2O-N contributed to a large extent to digestate EFs. As a consequence of the high share of N2O-N from the native soil pool within the first 30 days after digestate application, crop cultivation should be synchronized with available soil N. In particular, mineral N from the soil pool should be taken up by the crops, before digestates are applied. Thereby, the triggering effect of short-term soil-enhanced N2O emissions by digestates could be decreased. For example, Nmin supply in the present study would be sufficient for maize cultivation in the early growth stage. Digestates could then be top-dressed ~1 month after emergence when most of soil M was already taken up by the crop. Also de Neve (2017) emphasized that in ideal cropping systems fertilizer availability and soil mineral N should be synchronized with crop demand, which could mitigate potential N losses.
Experimental Limitations
Determination of N2O isotopomers in the present study, including the δ18O and site preference of 15N in the N2O molecule, could have helped to understand the underlying soil microbial processes, differentiating between denitrification and nitrification (Köster et al., 2015). Yet, distinguishing nitrifier denitrification from nitrification is not possible using site preference (Köster et al., 2011). A dual isotope labeling approach of 15N and 18O-labeled water would be required (Koola et al., 2010), which is not feasible in field studies (Baggs, 2008). Also the N2O/N2O+ N2 product ratio could have provided a better indication of denitrification in the study (Buchen-Tschiskale et al., 2020). However, measuring N2 in the field is rather difficult due to the high N2 background level in the atmosphere, as well as its spatial and temporal heterogeneity (Groffman et al., 2009). Instead N2 is often studied in incubation experiments using an artificial helium–oxygen atmosphere (Scholefield et al., 1997). Regular soil Nmin and 15Nmin analysis at the sampling dates could have given a hint for respective microbial processes, but would not have completely identified them. Thus, allocating the specific N2O pathways after digestate application in the field is still challenging and needs further research and suitable methods to provide accurate measurements (Well et al., 2019).
Conclusion
The major finding of this study was the large share of N2O-N from the soil pool, showing that digestate application triggers “enhanced soil-derived N2O.” The major driving forces of the emission pattern are the weather conditions, the specific chemical composition of digestates do have only minor effects on the denitrification. The different 15N-labeling approaches of the digestates indicate that contribution of the organic fraction seems to be of very low significance for short-term N2O emissions. The 15N labeling approach helped to determine the source of N2O emissions, but not the underlying processes (nitrifier denitrification or heterotrophic denitrification). Analysis of isotopomers and N2 is needed to further identify the N2O-releasing microbial processes in the soil. Emission factors were comparable for most digestates, but reached and even exceeded the default IPPC EF (0.6%) within only 60 days in the 1st year.
Data Availability Statement
The original contributions presented in the study are included in the article/Supplementary Materials, further inquiries can be directed to the corresponding author/s.
Author Contributions
FH prepared original draft, including statistical analysis, and graph production. RR supported calculation of global warming potential, provided guidance, and new input for determination of indirect N2O emissions. The basis for the experimental idea was based on KM, with further contribution by RR regarding design of the field experiment, sampling frequency, and measurement technique. IC-M supported calculation of 15N abundance in N2O from IRMS data. FH and IC-M conducted the experiment. All authors reviewed and proofread the whole manuscript and gave critical feed-back to all sections.
Funding
The experiment was conducted with financial support of the BMEL and the Fachangentur Nachwachsende Rohstoffe (FNR) e.V. within the project FNR Gärresteigenschaft.
Conflict of Interest
The authors declare that the research was conducted in the absence of any commercial or financial relationships that could be construed as a potential conflict of interest.
Acknowledgments
The anaerobic batch digestion of 15N-labeled plant substrates was performed by the State Institute of Agricultural Engineering and Bioenergy at the University of Hohenheim with the support of the director Dr. Oechsner and the scientist Natalie Böttcher. Analysis of substrates and soil via IRMS, was done by Elke Dachtler, and 15N-gas measurements with support by Wolfgang Armbruster and IC-M. Gas sampling in the field was supported by IC-M, Regina Roth, and student assistants. We are grateful for the help with flux calculation by Christina Herr and RR, as well as the experimental support by Heidi Zimmermann and the working group 340i. Our gratitude to Hans Buegger, from Helmholtz Zentrum Muenich for providing 15N-N2O standards for IRMS gas measurements, and supporting calculation of 15N-N2O.
Supplementary Material
The Supplementary Material for this article can be found online at: https://www.frontiersin.org/articles/10.3389/fsufs.2020.614349/full#supplementary-material
References
Abubaker, J., Odlare, M., and Pell, M. (2013). Nitrous oxide production from soils amended with biogas residues and cattle slurry. J. Environ. Qual. 42, 1046–1058. doi: 10.2134/jeq2012.0247
Baggs, E. M. (2008). A review of stable isotope techniques for N2O source partitioning in soils: recent progress, remaining challenges and future considerations y. Rapid Commun. Mass Spectrom. 22, 1664–1672. doi: 10.1002/rcm.3456
Brand, W. A. (1995). Precon: a fully automated interface for the PRE-GC concentration of trace gases in air for isotopic analysis. Isotopes Environ. Health Stud. 31, 277–284. doi: 10.1080/10256019508036271
Bremner, J. M. (1997). Sources of nitrous oxide in soils. Nutr. Cycle Agroecosyst. 49, 7–16. doi: 10.1023/A:1009798022569
Brulé, M. (2014). The Effect of Enzyme Additives on the Anaerobic Digestion of Energy Crops. (Dissertation), University of Hohenheim, Stuttgart, Germany.
Buchen-Tschiskale, C., Hagemann, U., and Augustin, J. (2020). Soil incubation study showed biogas digestate to cause higher and more variable short-term N2O and N2 fluxes than mineral-N. J. Plant Nutr. Soil Sci. 183, 208–219. doi: 10.1002/jpln.201900075
Cavalli, D., Cabassi, G., Borrelli, L., Geromel, G., Bechini, L., Degano, L., et al. (2016). Nitrogen fertilizer replacement value of undigested liquid cattle manure and digestates. Eur. J. Agron. 73, 34–41. doi: 10.1016/j.eja.2015.10.007
Chadwick, D. R., Pain, B. F., and Brookman, S. K. E. (2000). Nitrous oxide and methane emissions following application of animal manures to grassland. J. Environ. Qual. 29, 277–287. doi: 10.2134/jeq2000.00472425002900010035x
Chen, R., Senbayram, M., Lin, X., and Dittert, K. (2011). Origin of positive δ13C of emitted CO2 from soils after application of biogas residues. Soil Biol. Biochem. 43, 2194–2199. doi: 10.1016/j.soilbio.2011.07.003
Ciais, P., Sabine, C., Bala, G., Bopp, L., Brovkin, V., Canadell, J., et al. (2013). “Carbon and other biochemical cycles,” in Climate Change 2013: The Physical Science Basis. Contribution of Working Group I to the Fifth Assessment Report of the Intergovernmental Panel on Climate Change, eds T. F. Stocker, D. Qin, G.-K. Plattner, M. Tignor, S. K. Allen, J. Boschung, A. Nauels, Y. Xia, V. Bex and P. M. Midgley (Cambridge; New York, NY: Cambridge University Press).
Comfort, S. D., Kelling, K. A., Keeney, D. R., and Converse, J. C. (1990). Nitrous oxide production from injected liquid dairy manure. Soil Sci. Soc. Am. J. 54, 421–427. doi: 10.2136/sssaj1990.03615995005400020021x
Corden, C., Bougas, K., Cunningham, E., Tyrer, D., Kreißig, J., Zetti, E., et al. (2019). Digestate and Compost as Fertilisers: Risk Assessment and Risk Management Options. 121, 128, B2, D13. Available online at: https://ec.europa.eu/environment/chemicals/reach/pdf/40039%20Digestate%20and%20Compost%20RMOA%20-%20Final%20report%20i2_20190208.pdf (accessed December 21, 2020).
Davidson, E. A. (1991). “Fluxes of nitrous oxide and nitric oxide from terrestrial ecosystems,” in Microbial Production and Consumption of Greenhouse Gases: Methane, Nitrogen Oxides and Halomethanes, eds J. E. Rogers, and W. B. Whitman (Washington, DC: American Society of Microbiology), 219–335.
de Neve, S. (2017). “Organic matter mineralization as a source of nitrogen BT -advances in research on fertilization management of vegetable crops,” in, eds F. Tei, S. Nicola, and P. Benincasa (Cham: Springer International Publishing), 65–83. doi: 10.1007/978-3-319-53626-2_3
DIN 10693 (2014). Soil quality - Determination of carbonate content - Volumetric method (ISO 10693:1995). German version EN ISO 10693:2014.
Dittert, K., Bol, R., King, R., Chadwick, D., and Hatch, D. (2001). Use of a novel nitrification inhibitor to reduce nitrous oxide emission from 15N-labelled dairy slurry injected into soil. Rapid Commun. Mass Spectrom. 15, 1291–1296. doi: 10.1002/rcm.335
Engels, C. (1999). Regulation of xylem transport of calcium from roots to shoot of maize by growth-related demand. J. Plant Nutr. Soil Sci. 162, 287–294.
FAO (2020). FAOSTAT Emissions Shares. Available online at: www.fao.org/faostat/en/#data/REM (accessed August 20, 2020).
Flessa, H., and Beese, F. (1995). Effects of sugarbeet residues on soil redox potential and nitrous oxide emission. Soil Sci. Soc. Am. J. 59, 1044–1051. doi: 10.2136/sssaj1995.03615995005900040013x
Flessa, H., and Beese, F. (2000). Laboratory estimates of trace gas emissions following surface application and injection of cattle slurry. J. Environ. Qual. 29, 262–268. doi: 10.2134/jeq2000.00472425002900010033x
Flessa, H., Dörsch, P., and Beese, F. (1995). Seasonal variation of N2O and CH4 fluxes in differently managed arable soils in southern Germany. J. Geophys. Res. Atmos. 100, 23115–23124. doi: 10.1029/95JD02270
Fouda, S., Von Tucher, S., Lichti, F., and Schmidhalter, U. (2013). Nitrogen availability of various biogas residues applied to ryegrass. J. Plant Nutr. Soil Sci. 176, 572–584. doi: 10.1002/jpln.201100233
Fuß, R., and Asger, R. P. (2014). Greenhouse Gas Flux Calculation From Chamber Measurements. R Packag. Version 0.1. Available online at: https://bitbucket.org/ecoRoland/gasfluxes/src/master/ (accessed August 8, 2016).
Georgacakis, D., Sievers, D. M., and Iannotti, E. L. (1982). Buffer stability in manure digesters. Agric. Wastes 4, 427–441. doi: 10.1016/0141-4607(82)90038-5
Granli, T., and Bøckman, O. C. (1994). Nitrous oxide from agriculture. Nor. J. Agric. Sci. Suppl. 12, 1–128.
Groffman, P. M., Butterbach-Bahl, K., Fulweiler, R. W., Gold, A. J., Morse, J. L., Stander, E. K., et al. (2009). Challenges to incorporating spatially and temporally explicit phenomena (hotspots and hot moments) in denitrification models. Biogeochemistry 93, 49–77. doi: 10.1007/s10533-008-9277-5
Guilayn, F., Rouez, M., Crest, M., Patureau, D., and Jimenez, J. (2020). Valorization of digestates from urban or centralized biogas plants: a critical review. Rev. Environ. Sci. Biotechnol. 19, 419–462. doi: 10.1007/s11157-020-09531-3
Gutser, R., Ebertseder, T., Weber, A., Schraml, M., and Schmidhalter, U. (2005). Short-term and residual availability of nitrogen after long-term application of organic fertilizers on arable land. J. Plant Nutr. Soil Sci. 168, 439–446. doi: 10.1002/jpln.200520510
Guzman-Bustamante, I., Winkler, T., Schulz, R., Müller, T., Mannheim, T., Laso Bayas, J. C., et al. (2019). N2O emissions from a loamy soil cropped with winter wheat as affected by N-fertilizer amount and nitrification inhibitor. Nutr. Cycl. Agroecosystems 114, 173–191. doi: 10.1007/s10705-019-10000-9
Hafner, S. D., Pacholski, A., Bittman, S., Carozzi, M., Chantigny, M., Génermont, S., et al. (2019). A flexible semi-empirical model for estimating ammonia volatilization from field-applied slurry. Atmos. Environ. 199, 474–484. doi: 10.1016/j.atmosenv.2018.11.034
Heincke, M., and Kaupenjohann, M. (1999). Effects of soil solution on the dynamics of N2O emissions: a review. Nutr. Cycle Agroecosyst. 55, 133–157. doi: 10.1023/A:1009842011599
Herr, C., Mannheim, T., Müller, T., and Ruser, R. (2019). Effect of cattle slurry application techniques on N2O and NH3 emissions from a loamy soil. J. Plant Nutr. Soil Sci. 182, 964–979. doi: 10.1002/jpln.201800376
Herr, C., Mannheim, T., Müller, T., and Ruser, R. (2020). Effect of nitrification on N2O effect of nitrification inhibitors on N2O emissions after cattle slurry application. Agron. J. 40, 876–884. doi: 10.3390/agronomy10081174
Holly, M. A., Larson, R. A., Powell, J. M., Ruark, M. D., and Aguirre-Villegas, H. (2017). Greenhouse gas and ammonia emissions from digested and separated dairy manure during storage and after land application. Agric. Ecosyst. Environ. 239, 410–419. doi: 10.1016/j.agee.2017.02.007
Hutchinson, G. L., and Mosier, A. R. (1981). Improved soil cover method for field measurement of nitrous oxide fluxes. Soil Sci. Soc. Am. J. 45, 311–316. doi: 10.2136/sssaj1981.03615995004500020017x
Ingold, M., Khanal, G., Dyckmans, J., Wachendorf, C., and Buerkert, A. (2018). NH3 volatilization, N2O emission and microbial biomass turnover from 15N-labeled manure under laboratory conditions. Commun. Soil Sci. Plant Anal. 49, 537–551. doi: 10.1080/00103624.2018.1431271
IPCC (2019). 2019 Refinement To the 2006 IPCC Guidelines for National Greenhouse Gas Inventories. eds S. Calvo Buendia, E. Tanabe, K. Kranjc, A. Baasansuren, J. Fukuda, M. Ngarize, et al. (Switzerland: IPCC).
IUSS Working Group (2015). World Reference Base for Soil Resources 2014, Update 2015. International Soil Classification System for Naming Soils and Creating Legends for Soil Maps. World Soil Resources Reports No. 106. Rome: FAO.
Johansen, A., Carter, M. S., Jensen, E. S., Hauggard-Nielsen, H., and Ambus, P. (2013). Effects of digestate from anaerobically digested cattle slurry and plant materials on soil microbial community and emission of CO2 and N2O. Appl. Soil Ecol. 63, 36–44. doi: 10.1016/j.apsoil.2012.09.003
Koola, D. M., Wragec, N., Zechmeister-Boltensternd, S., Pfefferd, M., Brusa, D., van Groenigen, J. W., et al. (2010). Special issue article Nitrifier denitrification can be a source of N2O from soil: a revised approach to the dual-isotope labelling method. Eur. J. Soil Sci. 61, 759–772. doi: 10.1111/j.1365-2389.2010.01270.x
Köster, J. R., Cárdenas, L., Senbayram, M., Bol, R., Well, R., Butler, M., et al. (2011). Rapid shift from denitrification to nitrification in soil after biogas residue application as indicated by nitrous oxide isotopomers. Soil Biol. Biochem. 43, 1671–1677. doi: 10.1016/j.soilbio.2011.04.004
Köster, J. R., Cárdenas, L. M., Bol, R., Lewicka-Szczebak, D., Senbayram, M., Well, R., et al. (2015). Anaerobic digestates lower N2O emissions compared to cattle slurry by affecting rate and product stoichiometry of denitrification—An N2O isotopomer case study. Soil Biol. Biochem. 84, 65–74. doi: 10.1016/j.soilbio.2015.01.021
Möller, K. (2015). Effects of anaerobic digestion on soil carbon and nitrogen turnover, N emissions, and soil biological activity. A review. Agron. Sustain. Dev. 35, 1021–1041. doi: 10.1007/s13593-015-0284-3
Möller, K., and Müller, T. (2012). Effects of anaerobic digestion on digestate nutrient availability and crop growth: a review. Eng. Life Sci. 12, 242–257. doi: 10.1002/elsc.201100085
Möller, K., and Stinner, W. (2009). Effects of different manuring systems with and without biogas digestion on soil mineral nitrogen content and on gaseous nitrogen losses (ammonia, nitrous oxides). Eur. J. Agron. 30, 1–16. doi: 10.1016/j.eja.2008.06.003
Mönch-Tegeder, M., Lemmer, A., Jungbluth, T., and Oechsner, H. (2014). Effects of full-scale substrate pretreatment with a cross-flow grinder on biogas production. Agric. Eng. Int. CIGR J. 16, 138–147.
Petersen, S. O. (1999). Nitrous oxide emissions from manure and inorganic fertilizers applied to spring barley. J. Environ. Qual. 28, 1610–1618. doi: 10.2134/jeq1999.00472425002800050027x
Petersen, S. O., Nissen, H. H., Lund, I., and Ambus, P. (2003). Redistribution of slurry components as influenced by injection method, soil, and slurry properties. J. Environ. Qual. 32, 2399–2409. doi: 10.2134/jeq2003.2399
Pezzolla, D., Bol, R., Gigliotti, G., Sawamoto, T., López, A. L., Cardenas, L., et al. (2012). Greenhouse gas (GHG) emissions from soils amended with digestate derived from anaerobic treatment of food waste. Rapid Commun. Mass Spectrom. 26, 2422–2430. doi: 10.1002/rcm.6362
Pfab, H. (2011). Nitrous oxide emission and mitigation strategies—measurements on an intensively fertilized vegetable cropped loamy soil. (Dissertation). University of Hohenheim, Stuttgart, Germany.
Pfab, H., Palmer, I., Buegger, F., Fiedler, S., Müller, T., and Ruser, R. (2011). N2O fluxes from a Haplic Luvisol under intensive production of lettuce and cauliflower as affected by different N-fertilization strategies. J. Plant Nutr. Soil Sci. 174, 545–553. doi: 10.1002/jpln.201000123
Pfab, H., Palmer, I., Buegger, F., Fiedler, S., Müller, T., and Ruser, R. (2012). Influence of a nitrification inhibitor and of placed N-fertilization on N2O fluxes from a vegetable cropped loamy soil. Agric. Ecosyst. Environ. 150, 91–101. doi: 10.1016/j.agee.2012.01.001
R Core Team (2016). R: A Language and Environment for Statistical Computing. Vienna: R Foundation for Statistical Computing.
Rochette, P., Angers, D. A., Chantigny, M. H., Gagnon, B., and Bertrand, N. (2008). N2O fluxes in soils of contrasting textures fertilized with liquid and solid dairy cattle manures. Can. J. Soil Sci. 88, 175–187. doi: 10.4141/CJSS06016
Roman-Perez, C. C., and Hernandez-Ramirez, G. (2020). Sources and priming of N2O production across a range of moisture contents in a soil with high organic matter. J. Environ. Qual. doi: 10.1002/jeq2.20172. [Epub ahead of print].
Rosace, M. C., Veronesi, F., Briggs, S., Cardenas, L. M., and Jeffery, S. (2020). Legacy effects override soil properties for CO2 and N2O but not CH4 emissions following digestate application to soil. GCB Bioenergy 12, 445–457. doi: 10.1111/gcbb.12688
Ruser, R., Flessa, H., Russow, R., Schmidt, G., Buegger, F., and Munch, J. C. (2006). Emission of N2O, N2 and CO2 from soil fertilized with nitrate: effect of compaction, soil moisture and rewetting. Soil Biol. Biochem. 38, 263–274. doi: 10.1016/j.soilbio.2005.05.005
Ruser, R., Flessa, H., Schilling, R., Beese, F., and Munch, J. C. (2001). Effect of crop-specific field management and N fertilization on N2O emissions from a fine-loamy soil. Nutr. Cycl. Agroecosyst. 59, 177–191. doi: 10.1023/A:1017512205888
Ruser, R., Fuß, R., Andres, M., Hegewald, H., Kesenheimer, K., Köbke, S., et al. (2017). Nitrous oxide emissions from winter oilseed rape cultivation. Agric. Ecosyst. Environ. 249, 57–69. doi: 10.1016/j.agee.2017.07.039
Schleusner, P., Lammirato, C., Tierling, J., Lebender, U., and Rütting, T. (2018). Primed N2O emission from native soil nitrogen: a 15N-tracing laboratory experiment. J. Plant Nutr. Soil Sci. 181, 621–627. doi: 10.1002/jpln.201700312
Scholefield, D., Hawkins, J. M. B., and Jackson, S. M. (1997). Development of a helium atmosphere soil incubation technique for direct measurement of nitrous oxide and dinitrogen fluxes during denitrification. Soil Biol. Biochem. 29, 1345–1352. doi: 10.1016/S0038-0717(97)00021-7
Schouten, S., van Groenigen, J. W., Oenema, O., and Cayuela, M. L. (2012). Bioenergy from cattle manure? Implications of anaerobic digestion and subsequent pyrolysis for carbon and nitrogen dynamics in soil. GCB Bioenergy 4, 751–760. doi: 10.1111/j.1757-1707.2012.01163.x
Senbayram, M., Chen, R., Mühling, K. H., and Dittert, K. (2009). Contribution of nitrification and denitrification to nitrous oxide emissions from soils after application of biogas waste and other fertilizers. Rapid Commun. Mass Spectrom. 23, 2489–2498. doi: 10.1002/rcm.4067
Senbayram, M., Chen, R., Wienforth, B., Herrmann, A., Kage, H., Mühling, K. H., et al. (2014). Emission of N2O from biogas crop production systems in Northern Germany. Bioenergy Res. 7, 1223–1236. doi: 10.1007/s12155-014-9456-2
Shang, Z., Abdalla, M., Kuhnert, M., Albanito, F., Zhou, F., Xia, L., et al. (2020). Measurement of N2O emissions over the whole year is necessary for estimating reliable emission factors. Environ. Pollut. 259:113864. doi: 10.1016/j.envpol.2019.113864
Tamir, G., Shenker, M., Heller, H., Bloom, P. R., Fine, P., and Bar-Tal, A. (2013). Organic N mineralization and transformations in soils treated with animal waste in relation to carbonate dissolution and precipitation. Geoderma 209–210, 50–56. doi: 10.1016/j.geoderma.2013.05.028
Thorman, R. E., Nicholson, F. A., Topp, C. F. E., Bell, M. J., Cardenas, L. M., Chadwick, D. R., et al. (2020). Towards country-specific nitrous oxide emission factors for manures applied to arable and grassland soils in the UK. Front. Sustain. Food Syst. 4:62. doi: 10.3389/fsufs.2020.00062
VDI 4630 (2016). Fermentation of Organic Materials—Characterisation of the Substrate, Sampling, Collection of Material Data, Fermentation Tests. Berlin: The Association of German Engineers (VDI).
Verdi, L., Kuikman, P. J., Orlandini, S., Mancini, M., Napoli, M., and Dalla Marta, A. (2019). Does the use of digestate to replace mineral fertilizers have less emissions of N2O and NH3? Agric. For. Meteorol. 269–270, 112–118. doi: 10.1016/j.agrformet.2019.02.004
Well, R., Maier, M., Lewicka-Szczebak, D., Köster, J. R., and Ruoss, N. (2019). Underestimation of denitrification rates from field application of the 15N gas flux method and its correction by gas diffusion modelling. Biogeosciences 16, 2233–2246. doi: 10.5194/bg-16-2233-2019
Wulf, S., Maeting, M., and Clemens, J. (2002). Application technique and slurry co-fermentation effects on ammonia, nitrous oxide, and methane emissions after spreading. J. Environ. Qual. 31, 1795. doi: 10.2134/jeq2002.1795
Keywords: anaerobic digestion, biogas slurry, organic fertilizer, greenhouse gas emissions, stable isotope, field experiment
Citation: Häfner F, Ruser R, Claß-Mahler I and Möller K (2021) Field Application of Organic Fertilizers Triggers N2O Emissions From the Soil N Pool as Indicated by 15N-Labeled Digestates. Front. Sustain. Food Syst. 4:614349. doi: 10.3389/fsufs.2020.614349
Received: 05 October 2020; Accepted: 14 December 2020;
Published: 20 January 2021.
Edited by:
Matthew Tom Harrison, University of Tasmania, AustraliaReviewed by:
David Pelster, Agriculture and Agri-Food Canada (AAFC), CanadaAna Meijide, University of Göttingen, Germany
Copyright © 2021 Häfner, Ruser, Claß-Mahler and Möller. This is an open-access article distributed under the terms of the Creative Commons Attribution License (CC BY). The use, distribution or reproduction in other forums is permitted, provided the original author(s) and the copyright owner(s) are credited and that the original publication in this journal is cited, in accordance with accepted academic practice. No use, distribution or reproduction is permitted which does not comply with these terms.
*Correspondence: Franziska Häfner, aGFlZm5lci5mcmFuemlza2FAZ21haWwuY29t