
95% of researchers rate our articles as excellent or good
Learn more about the work of our research integrity team to safeguard the quality of each article we publish.
Find out more
ORIGINAL RESEARCH article
Front. Sustain. Food Syst. , 30 November 2020
Sec. Sustainable Food Processing
Volume 4 - 2020 | https://doi.org/10.3389/fsufs.2020.559510
This article is part of the Research Topic Structured Edible Oil: Towards a New Generation of Fat Mimetics View all 8 articles
 Andres Silvestre Gallegos Soto1*
 Renata Santos Rabelo1
 Eliana Marcela Vélez-Erazo1
 Paulo Túlio de Souza Silveira2
 Priscilla Efraim2
 Miriam Dupas Hubinger1*
The complexation of polymeric materials can be an alternative to trapping oil in a physical network for formulating foods with reduced saturated fat content. In this research, we have evaluated the use of different polymer ratios of Sodium Alginate (ALG), Carrageenan predominance iota (CR1) and Carrageenan predominance kappa (CR2) complexed with Chitosan (CHI) at a fixed polymer concentration (2% w/v) to formulate complex hydrogels and assess their oil holding capacity. The objective was to determine the polymer ratios of CHI to anionic polysaccharides (75:25, 50:50, and 25:75), determining the oil retention capacity in different ratios, and how this can affect the stability, microstructure and rheology of to produce low saturated chocolate with trapped canola oil. The stability of the hydrogels was characterized, considering the water retention and retention of canola oil in polysaccharides complexes. The more stable system was the hydrogel CHI:CR2 in a polymer ratio of 25:75. This formulation, when added of 20% of canola oil presented an apparent viscosity of 0.631 Pa.s at 300 s−1, and its use as replacer of saturated fat allowed the production of dark chocolate with 16% reduction in fat content and 80% of added cocoa butter. Stability studies showed that polysaccharides complexes network can retain the edible oil in chocolate formulation for 60 days. It has been proven that polysaccharides complexes can be incorporated to partially replace the fatty phase in chocolates without considerable changes in relevant characteristics as consumer acceptance evaluated by sensory tests and rheological properties.
In the last years, food scientists have made a great effort to obtain fat substitutes with potential applications in foods due to consumers' interest in finding healthier options. Some of these efforts have involved the substitution of trans and saturated fats for polyunsaturated oils using different kinds of structurants. Recently, the use of carbohydrate-based systems as fat substitutes have been studied because hydrocolloids are widely used in the food industry and have demonstrated satisfactory results. For example, the inulin was used as a carbohydrate-based fat replacer, with good fat imitating properties when combined with water due to the ability to form a gel (O'Brien et al., 2003). In chocolate formulations, Skelhon et al. (2013) reduced the product's fat content replacing 50% cocoa butter content with 2% agar microgels (containing 20% of sunflower oil).
The combined use of different polysaccharides can also be an interesting alternative as fat substitutes. They can provide improved functional properties over individual polymers. Some examples were presented by Rather et al. (2015, 2016) and Alnemr et al. (2016), who made blends of some food-grade polysaccharides, such as guar, xanthan, locust, and kappa-carrageen gum to partially replace saturated fat in different food products. They explored the synergism between polysaccharides as an alternative to formulate new fat substitutes. With the use of chitosan, electrostatic interaction between different polysaccharides could be also explored in this kind of application.
Chitosan (CHI) is a cationic polysaccharide that can function as dietary fiber with hypocholesterolemic effects and reduce lipid absorption and increase cholesterol elimination (Maezaki et al., 1993; Gallaher et al., 2002). The complexation of chitosan with anionic polymers and its interaction with lipid matrices have already been evaluated by Rabelo et al. (2018, 2019). In these works, the optimal conditions for polymeric complexation were obtained, showing that even at low temperatures and in concentrations where pure polymers do not gel, CHI complexes with ALG and CRG could form structured polymeric networks. It has also been observed that CHI, at higher temperatures, exposes hydrophobic groups that entrap the lipids, preventing or at least reducing their expulsion in formulations with lipid particles.
The use of polymeric complexes and complex hydrogels obtained from the complexation of chitosan with alginates and carrageenans were also investigated by other authors (Goycoolea et al., 2000; Espinosa-Andrews et al., 2007, 2010, 2013; Sæther et al., 2008; Volod'ko et al., 2012, 2014, 2016; Kulig et al., 2016, 2017; Afzal et al., 2018). However, none of these works has evaluated the use of these complexes as fat substitutes in dark chocolate formulations, which is the purpose of this study.
The chocolate application was proposed because there is a need to find innovative technological solutions to establish a chocolate formulation with low saturated fat content, keeping adequate fractions of solid volume and flow properties. For this purpose, the influence of the polymer ratio of biopolymers in the reticulation degree of the polymer network, the retention of oil in the polysaccharides complexes without emulsifying properties, the microstructure, stability and rheological properties of the formulated chocolates were studied, leading to interesting to formulate dark chocolate with 80% less cocoa fat added.
Sodium Alginate (ALG, Grindsted Alginate FD 175) was donated by Danisco Brazil Ltda (Pirapozinho, SP, Brazil), Carrageenans (CR1 predominance iota and CR2 predominance kappa) were donated by Alibra Ingredientes Ltda (Campinas, SP, Brazil), and Chitosan (CHI, Deacetylation degree of 85%) was purchased from Sigma Aldrich Inc. (USA). Soy Lecithin (Bunge Alimentos S.A., Gaspar-SC, Brazil), Acetic Acid (Dinâmica, Química Contemporânea Ltda, Campinas, SP, Brazil), and Canola oil (CO, Vitaliv®, ADM do Brazil Ltda, Brazil) were purchased from industries located in Brazil. All experiments were performed with Milli-Q water (Milli-Q system, Millipore, USA); other reagents were of analytical grade. The molecular weight and polydispersity of Sodium Alginate (7.83 × 10⁴ g/mol, 1.18) and Chitosan (1.51 × 10⁵ g/mol, 1.44) were obtained from the previous study carried out by Rabelo et al. (2019).
Polymeric dispersions were prepared at a polymer concentration of 2.0% (w/v) in water, except for CHI, which was dispersed in acetic acid solution (2% v/v). Then, the dispersions were heated up to 60°C and stirred for 30 min to obtain a clear and homogeneous solution. After preparation, all solutions were stirred overnight (300 rpm) at room temperature for 12 h to ensure complete hydration of the biopolymers. Before use, the pH of all the solutions was adjusted to 3.5, where both polysaccharides are protonated. All experiments were conducted at low ionic strength, to favor the polymer complexation.
CHI solutions were prepared and mixed with CR1, CR2, or ALG solutions to obtaining CHI:polysaccharide ratios of 25:75, 50:50, and 75:25 (w/w). All samples were homogenized for 10 min at 18,000 rpm using an UltraTurrax IKA® T18B (IKA-Werke GmbH & Co. KG, Germany) equipped with a dispersing rotor S18N-19G. Then, the drying of the samples was carried out in a heating oven (ORION 515, FANEM, São Paulo, Brazil) at 70°C for 48 h. The drying process was monitored by weight loss along time and stopped when the sample reached a moisture content of 25% (on dry basis).
The process of oil addition to hydrogels formulation is presented in Figure 1. Initially, the solutions of CHI:ALG, CHI:CR1 and CHI:CR2 complexes were heated at 80°C using a jacketed beaker connected to a bath MA 126/BD (Marconi Ltda, Brazil) to reduce the viscosity and improve mixing with oil (canola oil) to obtain appropriate ratios of 80:20, 50:50, and 20:80 oil/dry hydrogel (w/w). After that, the canola oil with 1% lecithin (final formulation weight) was added gradually and homogenized for 2 min at 18,000 rpm using a UltraTurrax IKA® T18B (IKA-Werke GmbH & Co. KG, Germany). Finally, the samples were stored in a refrigerated chamber at 25°C for further analysis.
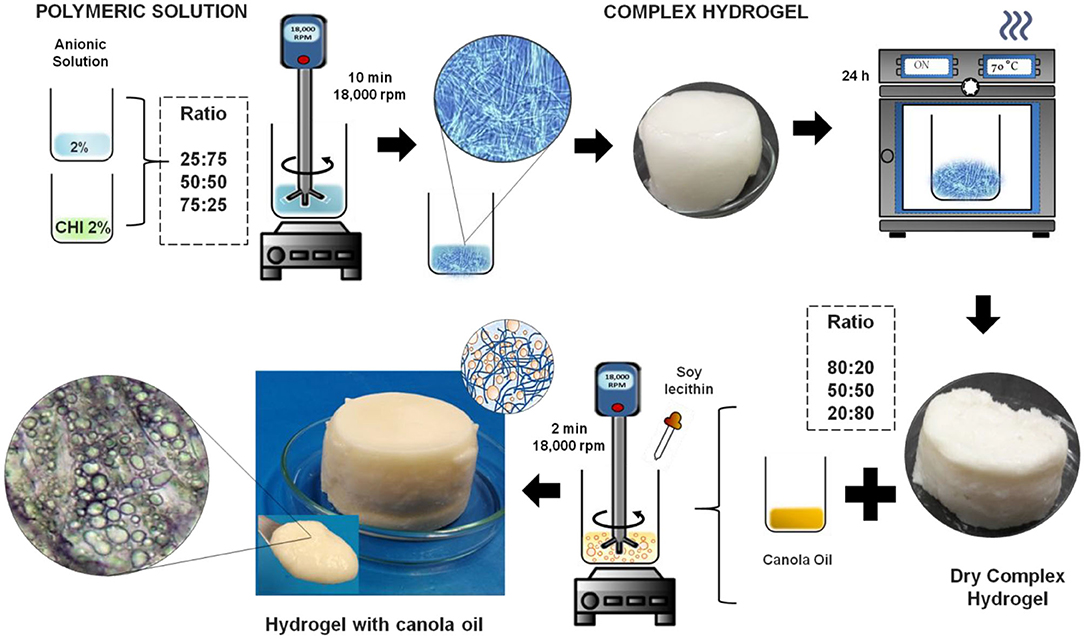
Figure 1. Process of oil addition to hydrogels formulation.
The microstructure of complex hydrogels with and without added oil was visualized using an optical microscope Carl Zeiss Axio Scope A1 (Gottingen, Germany), with a 10 and 40x objective. The images were analyzed using software Zen 2.3 (Zeiss, Germany).
Stability of formulations was evaluated by measuring the water and oil retention of samples (hydrogels with or without oil added). Measurement was performed in triplicate according to the methodology proposed by Wijaya et al. (2017) and Paglarini et al. (2018) with some modifications. The water or oil retention was measured after 30 days of storage in a refrigerated chamber with controlled temperature (25 ± 1°C). Approximately 2 g of sample were weighed in centrifuge tubes and then centrifuged for 1 h at 2,000 rpm, and 25°C. The total amount of water or oil released was expressed as a percentage of the weight of the sample.
The rheological analysis for the pure polymeric solutions and of hydrogels with or without added oil were carried out on an advanced rheometer AR 1500 ex (TA Instruments, Elstree, UK), with a stainless-steel cone-plate geometry (4 cm diameter, and GAP of 58 μm). Measurements were done in triplicate. Flow curve measurements were performed at 25°C, in three stages (up, down and up) cycles, with a shear rate ranging from 0 to 300 s−1. Viscosity was calculated as the instantaneous ratio of shear stress and shear rate. The third flow curve data were fitted to the models Herschel–Bulkley fluids Equation (3).
Where: σ is the shear stress (Pa), σ0 the initial shear stress, γ the shear rate (1/s), and the consistency index (KHB), as well as the behavior index (n), are model constants.
Two formulations of dark chocolate were produced. The control chocolate (CC) was produced with 29.5% refined sugar, 60% natural liquor and 10% deodorized cocoa butter (IBC- Indústria Brasileira de Cacau, SP, Brazil), 0.5% soy lecithin (Bunge Alimentos SA, SC, Brazil). The chocolate containing hydrogel added with canola oil was produced with the same ingredients and quantities of CC, with 80% of the cocoa butter being replaced by hydrogel added with canola oil, allowing a 16% reduction in the total fat content of the formulation (Reduced fat chocolate, RFC). CC was processed following the steps described by Afoakwa et al. (2009) and Biswas et al. (2017). The ingredients (sugar, cocoa liquor and cocoa butter) were mixed, refined and conched using a Melanger Spectra 11 (Spectra, India) equipped with two adjustable cylindrical granite stones and a double scraper arm. The period of the process (7 h) was defined to obtain a maximum particle size < 25 μm monitored by a digital micrometer (Mitutoyo, Japan). During this period the temperature of the chocolate mass was close to 60°C. After particle size has been reached, soy lecithin was added and the chocolate was mixed for 1 more hour. For RFC processing, the hydrogel added with canola oil was added with the soy lecithin after particle size has been reached and the chocolate was mixed for 1 additional hour. The tempering was performed in an ACMC temper machine (model D45134, United States). The tempering conditions were defined by pre-tests using a ChocoMeter (AastedApS-Farum, Denmark). Temper Index of 5.0 ± 1.0 was accepted. First, the mass was completely melted up to 40°C, and then cooled at a rate of 2°C min−1, until it reached 28°C and was kept in this condition for 10 min. After this period, the temperature has been raised to 31°C and maintained for 5 min to allow unstable crystals melting. The chocolates were molded in rectangular molds (18 g) and cooled in a cooling chamber at 15°C. Then samples were packed in aluminum paper and stored in chambers with controlled temperature (24 ± 1°C) for further characterization at 1, 15, 30, 45, and 60 days of storage (when applied).
Evaluated by Karl Fisher method (701 KF Titrino, Metrohm, Herisau Switzerland) (AOAC, 2016). The samples were melted at 40°C and then ~0.1 g was weighed in chloroform: methanol (1:1) solution for analysis.
A Hunterlab/ColorQuest II (Hunter Association, Inc., USA) colorimeter was used to quantify the changes on the surface of the chocolate samples at storage times 1, 15, 30, 45, and 60 days (11). The equipment measured the L*, a* and b* values for 10 times and the tests were performed in triplicate (totalizing 30 readings for each formulation). The values obtained were converted to whiteness index (WI) values according to Lohman and Hartel (1994), presented in Equation 1:
The visualization of the surface structure and cross-section of chocolate samples was performed by scanning electron microscopy (SEM), in a table-type microscope, Hitachi High Technologies America, Inc., model TM-3000 (Japan), according to the methodology described by Miyasaki (2013). The samples were sectioned in the dimensions of 20 × 20 mm, to be observed on the surface, as well as in the cross-section, in the Analy mode (automatic of the equipment) with an increase of × 500, × 1,500, and × 2,500 times.
The measurement procedure was based on the method described by Biswas et al. (2017) with minor modifications. A Rheometer AR 1500ex (TA Instruments, Elstree, United Kingdom) fitted with a stainless steel flat plate geometry (4 cm in diameter) was used. Approximately 2 g of the chocolate sample were melted at 50°C for 1 h and were placed on a pre-heated plate with a height of 1 mm. The bottom plate temperature was adjusted to 40°C to prevent solidification of the fat crystals. A stepped flow procedure was applied, increasing the shear rate logarithmically from 2 to 110 s−1. Yield stress (Pa) and viscosity (Pa.s) were measured at 65 s−1 using the Casson's model (Equation 3) (Afoakwa et al., 2008a).
where τ is the yield stress; τCA is the Casson yield stress; μCA is the Casson viscosity; and γis the shear rate.
The determinations were performed according to the methodology described by Quast et al. (2013) in a TA-XT2i texture analyser (Stable Micro Systems, Surrey, United Kingdom) equipped with an HDP/3PB -probe. Measurements were performed after 1, 15, 30, 45, and 60 days of storage; with 10 replicates per sample in a controlled temperature room (20 ± 0.5°C). The conditions used were: distance between bar supports: 6 cm; pre-test speed: 3 mm s−1; test speed: 1.7 mm s−1; post-test speed: 10 mm s−1. The breaking force applied in the center of the bars, expressed in kgf, was obtained from the force vs. deformation graphs.
The melting profile of dark chocolate was measured using a differential scanning calorimetry (DSC Modulated 2920, TA Instruments- New Castle, Delaware, USA), following the method of Biswas et al. (2017) with minimal modifications. Two samples of chocolate bars were randomly selected and were comminuted and homogenized, transferring 4 ± 0.5 mg of the samples to an aluminum pan hermetically sealed, using a covered and empty aluminum pan as a reference. When the system reached equilibrium conditions at 20°C, the pan was placed in the DSC cell and the fusion thermograms were recorded by heating from −20 to 70°C at a rate of 5°C/min. Each sample was analyzed in triplicate. The initial melting temperature (Tonset), the final temperature (Tend) and the maximum peak temperature (Tmax), the melting enthalpy (ΔH) were calculated from the melting thermogram using the DSC software.
The gravimetric analyzes to determine the nutritional information of the chocolate samples were carried out in an accredited external laboratory, following the methodologies: Protein by DUMAS (CBAA, 2013: method 45), Total Fat by acid hydrolysis (AOCS, 2017; CBAA, 2017: method 12), Saturated Fat and Fat Trans (AOAC, 2016), Sodium by Atomic Absorption (CBAA, 2013: method 40) and Dietary Fiber by enzymatic-gravimetric method (ADOLFO LUTZ, 2008), the carbohydrate and total energy values were obtained by difference calculation. Each analysis was performed in duplicate.
For the sensory analysis, carried out at the Sensory Analysis Laboratory in the Department of Food and Nutrition (School of Food Engineer- UNICAMP), chocolate samples were labeled with three-digit codes and, along with the questionnaire, were given to 120 untrained evaluators with a minimum age of 18 years. Two samples were evaluated (1) control chocolate (CC) and (2) reduced fat chocolate (RFC). The sensory attributes: appearance, sweetness, waxiness, general flavor, texture (snap), mouth-feel (melting) and overall acceptability were evaluated using a 9-point hedonic scale (9 = “extremely more intense than I like it” to 1 = “extremely less intense than I like it”). The order of presentation of the plates to each evaluator was different in a random sequence. Bottled drinking water at room temperature was also provided to clean the palate between each sample. At the end of the test, an assessment was also made between CC and RFC to evaluate the purchase intention using a 5-point structured scale (1 = would certainly buy to 5 = certainly would not buy). The assessors recorded their responses on an evaluation sheet designed to indicate the score of the sample of each formula.
The data were statistically analyzed by the Tukey test using Minitab® 18.1 Statistic (Minitab Inc., USA). Differences between means were considered significant at a 95% confidence level (p ≤ 0.05). Excel Solver Microsoft 2010® was used for the adjustment of the models Herschel–Bulkley Equation (1). The XLSTAT 2017 software (Addinsoft, France 2017) for Microsoft Excel was used for data analysis and statistical solution of the results obtained in the sensory analysis.
The microstructure of complex hydrogels is shown in Figure 2, where each micrograph corresponds to the optical image of samples at 40x magnification. The ability of polysaccharides to form a three-dimensional structure, independent on the polymer ratio (25:75, 50:50, and 75:50) was observed to all hydrogels (CHI:ALG, CHI:CR1, and CHI:CR2). In particular, the increase of the reticulation degree observed in Figure 2 can be described in the following order: 75:25 < 50:50 < 25:75. This behavior is in agreement with Rabelo et al. (2019), who reported the maximal complexation of CHI with sodium alginate and carrageenan around of 25:75 (in mass proportion) and discussed the contribution of the electrostatic interaction and the hydrogen bonding in the complexation of these polymers.
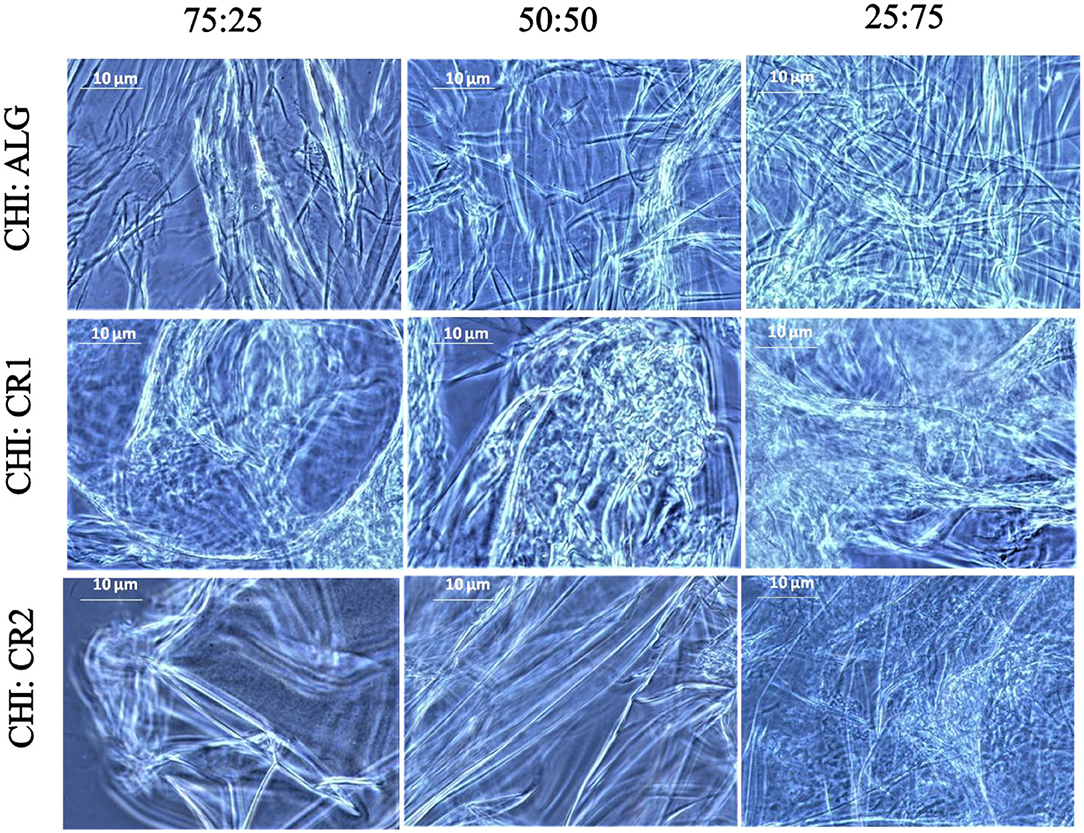
Figure 2. Optical micrograph of the complexes CHI:ALG, CHI:CR1, and CHI:CR2 at different polymer ratio (75:25, 50:50, and 25:75).
Still, in Figure 2, the hydrogels CHI:ALG show a more organized structure than the other ones (CHI:CR1 and CHI:CR2), which may be associated with the aggregation and gel formation kinetics of these hydrogels. However, the greater compaction of the polymeric network of CHI:CR1, when compared with CHI:CR2 may result from the presence of an additional sulfate group in the molecular structure of CR1 (predominance iota) in relation to CR2 (predominance kappa), which contributes to the formation of tight binding between CHI and CR1 (Volod'ko et al., 2016).
The hydrogels are materials characterized by their strong water retention capacity, and one of the main factors that contributes to this is the presence of hydrophilic functional groups (i.e., carboxyl, hydroxyl, amide and sulfonic groups) in the molecular structure of their polymer constituents (Peppas and Khare, 1993; Künzler, 2002). The reticulation degree, particle size and ionic osmotic pressure are also important factors that can influence on the water retention capacity of hydrogels (Ahmed, 2015). Here, the water retention for CHI:ALG, CHI:CR1, and CHI:CR2 in three different polymers ratio (75:25, 50:50, and 25:75) are presented in Figure 3, where the effect of the composition and reticulation degree of polymers in the hydrogels was observed. In this context, CHI:CR2 formulated at a polymer ratio of 25:75 (more reticulate) presented the highest water retention among the complex hydrogels, while CHI:CR1 presented the lower water retention, independent of the polymer ratio (Figure 3). This behavior is attributed to the formation of a tight binding between CHI and CR1, as previously mentioned. These tight junctions are associated with the formation of amorphous precipitated structures with low solvent retention capacity (Comert et al., 2016).
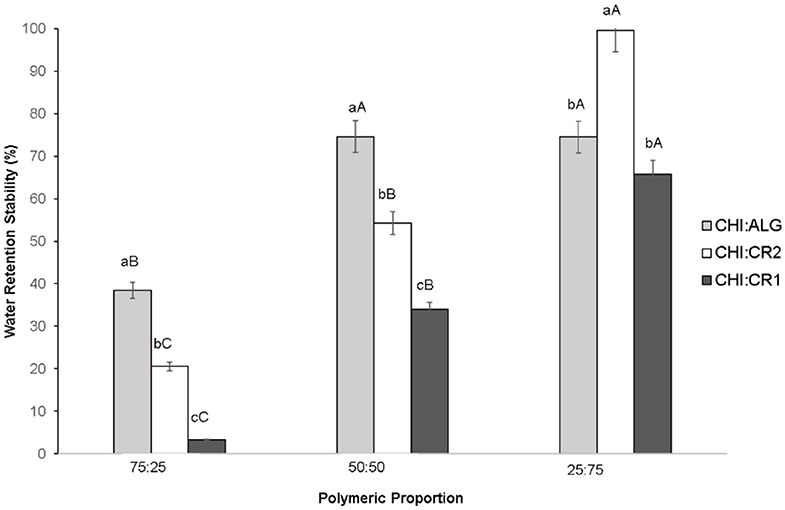
Figure 3. Water retention of the complex hydrogels (CHI:ALG, CHI:CR1, and CHI:CR2) at different polymer ratios (75:25, 50:50, and 25:75). Different uppercase letters indicate a significant difference (p ≤ 0.05) in the same complex at different polymer ratios. Different lowercase letters indicate a significant difference (p ≤ 0.05) in the same polymer ratio of different Complexes.
For CHI:ALG, the change in the polymer ratio from 50:50 to 25:75 increases the reticulation degree and the firmness of hydrogel (Figure 4), but has no significant effect on the water retention (Figure 3).
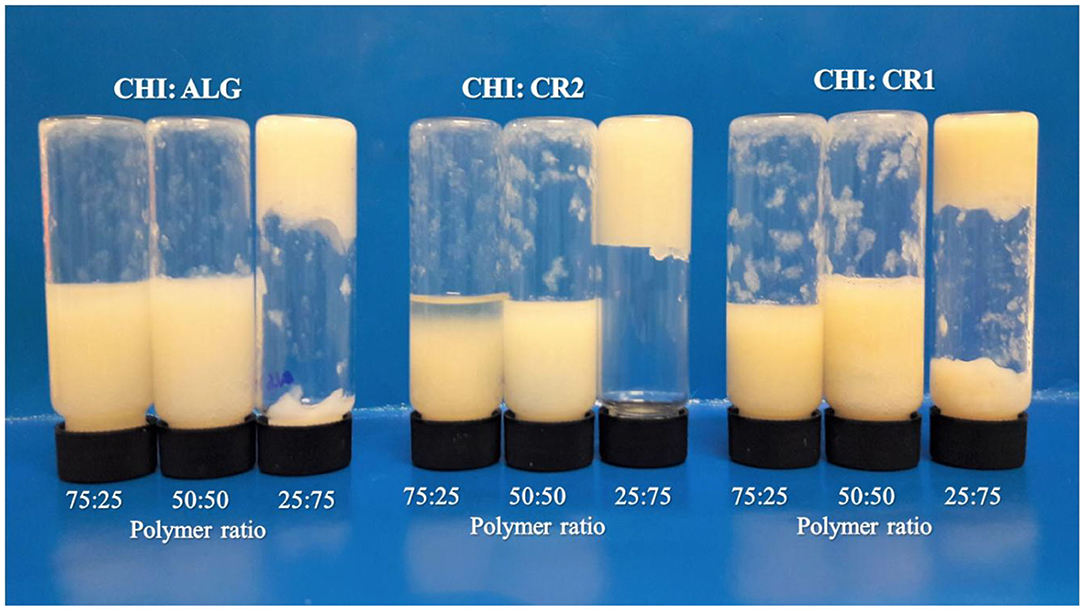
Figure 4. Visual image of complex hydrogels (CHI:ALG, CHI:CR1, and CHI:CR2) at different polymer ratios (75:25, 50:50, and 25:75).
The greater water retention of both hydrogels obtained at a polymer ratio of 25:75 (Figure 3) is in agreement with the more reticulated network structure presented by these formulations (Section Optical microscopy of complex hydrogels, Figure 2). Those results are in accordance with the profile presented in Figure 4, where the samples were inverted to observe the phase separation of hydrogels before centrifugation. The hydrogels 75:25 and 50:50 flowed into the mouth of the bottle, while the formulations 25:75 remained (totally or partially) in the base of the bottle, indicating the formation of a gel-like state. All these results contributed to the hydrogels obtained at a polymer ratio of 25:75 to be selected to continue this study.
The oil retention of formulations after 30 days of storage at 25 ± 1°C is shown in Figure 5. Samples with 80% of CO (canola oil) showed bigger oil release, while formulations with 50% CO presented oil retention higher than 80% for CHI:ALG and CHI:CR2. The greatest oil retention was observed for CHI:CR2 (99.83%), CHI:ALG (98.63%), and CHI:CR1 (85.58 %), respectively, both with 20% of canola oil. This result is important to exemplify that hydrogels based on polysaccharides without interfacial activity cannot retain large oil amounts in their structure, hampering the formulation of structured oils. On the other hand, the results still reached a good oil trap, which is attributed to the addition of lecithin (1%).
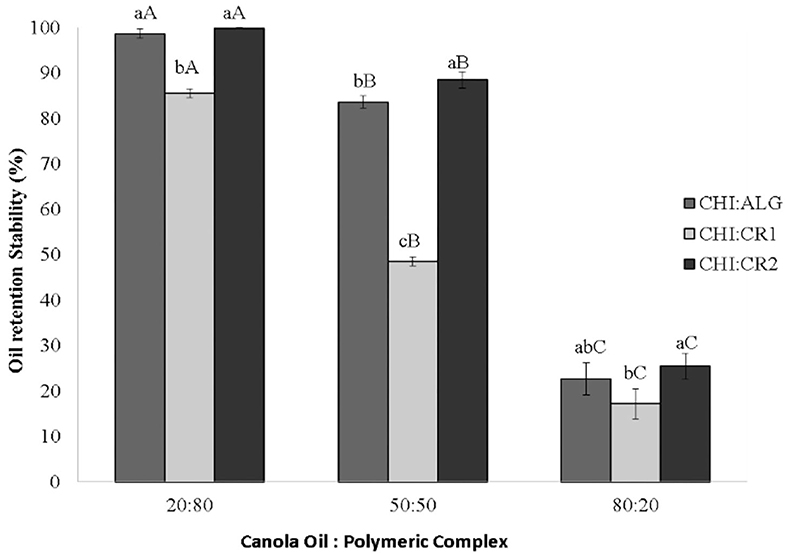
Figure 5. Oil retention of polysaccharides complexes (CHI:ALG, CHI:CR1, and CHI:CR2) at three different percentages of canola oil (80, 50, and 20%) in the formulation. Different uppercase letters indicate a significant difference (p ≤ 0.05) in the same formulation at different oil ratio. Different lowercase letters indicate a significant difference (p ≤ 0.05) in the same oil ratio in different formulations.
The formulations CHI:ALG and CHI:CR2 promoted oil retention higher than 98%. The best performance of these formulations when compared with the CHI:CR1 can be also attributed to the tight binding between CHI and CR1, which may not be favorable for the oil entrapped into the polysaccharides complexes.
In Figure 6 the microstructure of the hydrogel with 20% of canola oil is shown. The micrograph corresponds to the optical projection of the sample at 10 and 40 x magnifications. The CHI:ALG presented a more organized 3D structure, allowing more uniform oil droplets trapping. CHI:CR2 shows a large number of oil droplets trapped in its polymeric structure when compared with CHI:CR1, but the way oil was trapped in the polymer network was similar. However, it is known that in order to achieve effective steric stabilization with for good oil entrapment, the size and structure of the carbohydrate play an important role. Small sugar molecules or low molecular weight polysaccharides are not as effective as high molecular weight or branched molecules (Wong et al., 2011). Presumably, the polysaccharides complex' steric properties to produce oil entrapment has an important contribution in preventing the oil release of all these formulations. These polysaccharide molecules could provide an additional steric barrier between the emulsion droplets when the complex is adsorbed at emulsion interfaces.
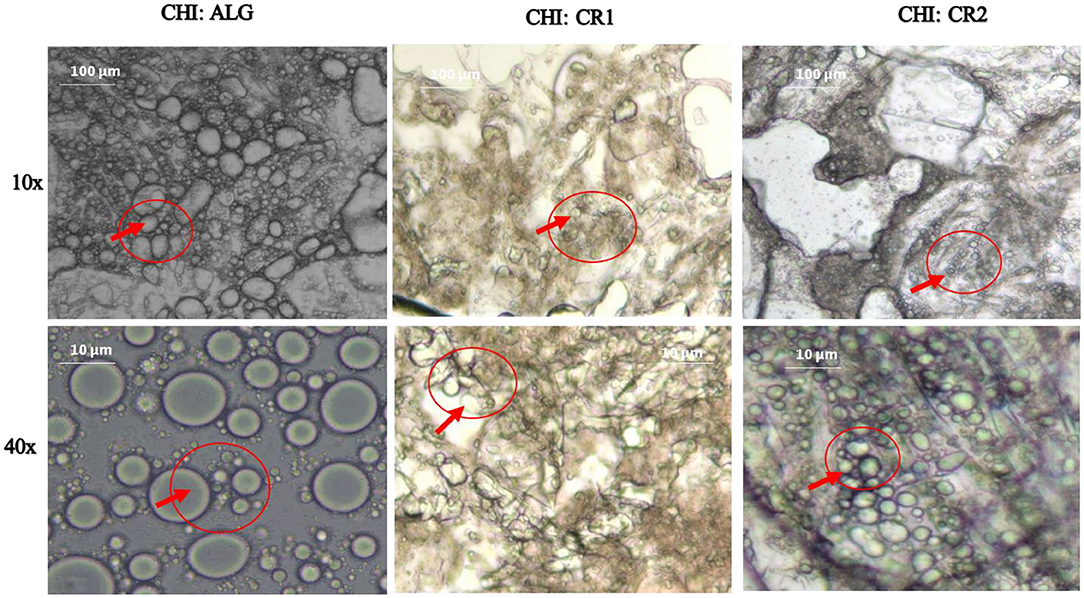
Figure 6. Optical micrograph of CHI:ALG, CHI:CR1, and CHI:CR2 (polymer ratio = 25:75) with 20% w/w of canola oil.
Steady-state flow analysis was performed to investigate the apparent viscosity of polysaccharides (dispersion), conventional hydrogels and hydrogel with added oil, in which the HB model showed high correlations for all samples (R2 > 98%).
For polysaccharides dispersions at 2% (w/w), the initial shear stress values (σo) were zero for CHI and ALG, but 2.71 for CR1 and 44.45 for CR2, indicating the necessity of an initial force for the CR1 and CR2 dispersions to begin to flow (Table 1). The flow behavior index (n) is related to the shear-thinning or elastic behavior. All dispersions presented shear-thinning behavior with a significant difference in the n values between them. CHI with n = 0.816 is the closest one to the Newtonian behavior (n = 1), coinciding with that reported by Shepherd et al. (1997), and the CR2 is the most shear-thinning system. The consistency index (k) has a relationship with viscosity. It can be observed that the higher the k value, the higher the σo and the apparent viscosity, and the lower the n value, characterizing the CR2 dispersion as the more structured dispersion.
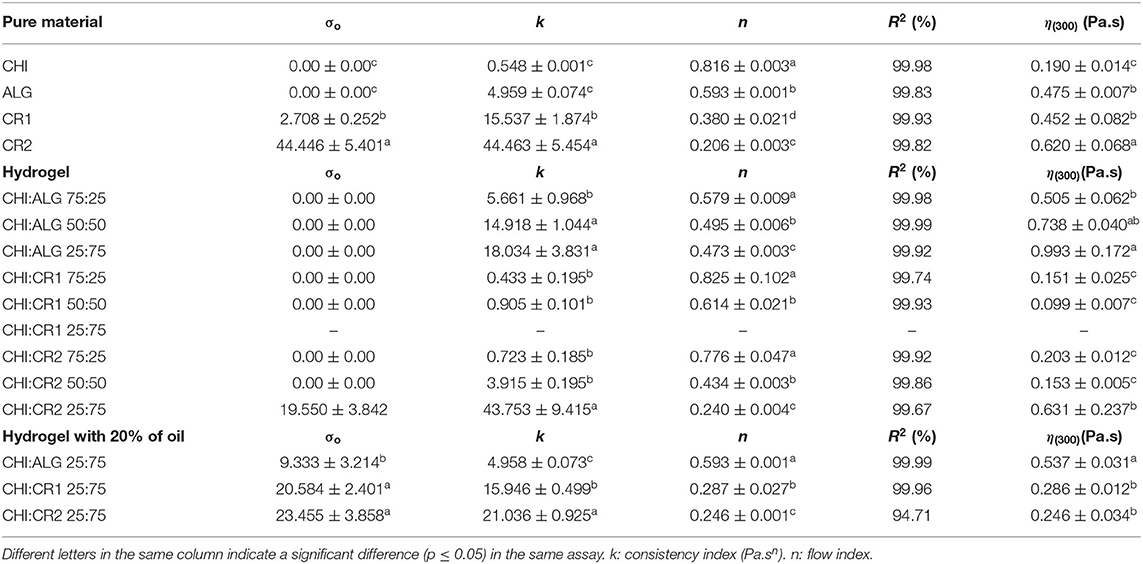
Table 1. Rheological parameters (HB model) and apparent viscosity at a shear rate of 300 s−1 (η(300)) of pure materials (2% w/v), complex hydrogels (CHI:ALG, CHI:CR1, and CHI:CR2) at different polymer ratios (75:25, 50:50, and 25:75), and hydrogels (CHI:ALG 25:75; CHI:CR1 25:75, and CHI:CR2 25:75) with 20% of canola oil.
Each dispersion's characteristics may have influenced on all hydrogels' behavior stabilized by electrostatic complexes of CHI (cationic) with ALG, CR1, or CR2 (anionic). The increase in CHI concentration in the hydrogel increases the n value, resulting in softer complex hydrogels. In the CHI:CR1 (25:75), it was impossible to perform the test on the parameters determined for this rheological analysis, reminding that it was the hydrogel that showed the least stability (compared with CHI:ALG and CHI:CR2 at 25:75). Only the hydrogel at CHI:CR2 25:75 showed σo (19.55 Pa) and the lower n value, presenting similar characteristics with the CR2 dispersion.
Additionally, both the hydrogel (with or without oil) formulated with CHI:CR2 at 25:75 ratio have the lower n among all formulations and apparent viscosity (~ 0.240 Pa.s), indicating a greater variation in viscosity with an increasing shear rate. This may be related to the breakdown of structure and reordering of the tangled units through the dynamic shear forces (Patel et al., 2013). Analyzing the hydrogels with added oil, it is possible to observe that when the water concentration decreases, the σo increases significantly and the k decreases compared with the values of their respective hydrogels. For this reason, hydrogels with 20% of canola oil have a more coherent structure, requiring greater force to begin to flow.
Most processes in the food industry use shear rate values between 300 and 500 s−1 (Steffe, 1996); for this reason, a shear rate of 300 s−1 was considered to measure the apparent viscosity of hydrogels with or without oil (Table 1), once the fabrication of a low saturated fat chocolate-based product with similar flow behavior could be feasible under the formulation conditions used in this study. Complex hydrogels with CHI:ALG and CHI:CR2 presented the biggest apparent viscosity values, especially at a polymer ratio of 25:75, with an apparent viscosity of 0.993 Pa.s for CHI:ALG and 0.631 Pa.s for CHI:CR2. These values were significantly higher than the ones observed for the pure polymers or in hydrogels containing canola oil. CHI:CR2 with added oil presented an apparent viscosity of 0.246 Pa.s, lower than respective formulations CHI:ALG (0.537 Pa.s) and CHI:CR1 (0.286 Pa.s), but presenting the biggest σo (23.45 Pa), being the formulation with the more coherent structure.
A relationship between the microstructure and the rheological parameters of the hydrogels with oil was observed since the more organized the structure, the higher the viscosity and n value, and the lower the σo (CHI:ALG 25:75). It is possible that stronger gelling effects have occurred in CR1 and CR2 than in ALG, resulting in the n and σo observed values, and the difference in the apparent viscosity could be related to the possible free oil observed in the CR1 and CR2 micrographs; however, the thickening and gelling properties of these polysaccharides avoided the oil expulsion.
This study considered the values obtained from water retention and oil retention to choose the formulation CHI:CR2 for application in chocolate. Future applications may also be evaluated for the use of alginate-based hydrogels, which also showed excellent performance.
The average particle size obtained for the control chocolate (CC) and reduced fat chocolate (RFC) was 22.7 ± 3.71 and 24.4 ± 5.82 μm, respectively. The temper index was 4.13 ± 0.50 (CC) and 4.57 ± 1.25 (RFC), within the recommended range for appropriately tempered chocolates. The moisture content was 2.12% ± 0.04 (CC) and 2.07% ± 0.05 (RFC). The results indicate suitable processing conditions, without significant differences (p ≤ 0.05) between treatments by the Tukey test at 95% confidence level.
The whiteness index correlates the variations in the reflected light with the development of fat bloom. The manifestation of white, gray spots and loss of characteristic luster of chocolate, due to the formation of crystals extended to the surface, causes diffusion in the reflection of light, thus interfering in the colorimetry of chocolate (Bricknell and Hartel, 1998).
The values obtained for the Whiteness Index (WI – Whiteness Index) of CC and RFC formulations after 1, 15, 30, 45, and 60 days of storage at 24 ± 1°C under controlled conditions, are shown in Table 2, observing that there was a significant difference through the storage time between the samples. If the means and deviations between the formulations were evaluated, it can be noticed that there was no significant difference between the two formulations. There was a change in WI over time, but this change has not been caused necessarily by the presence of canola oil.
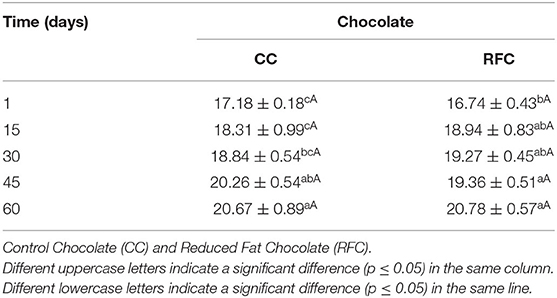
Table 2. Whiteness index of chocolate samples during the stability study (samples stored at 24 ± 1°C).
The microstructural analysis of the CC and RFC samples (surface and cross-section) at 1st storage day is shown in Figure 7. A more irregular surface can be observed for CC, while RFC presented a smoother surface (A3, C3). This suggests a uniform spatial distribution of numerous stable β polymorph crystals in a network with well-defined crystalline connections, characteristic of chocolates with good temper (Afoakwa et al., 2009). The cross-sectional image of chocolate formulated with hydrogels (D1, D2 and D3) also showed apparently encapsulated structures, which may be related to the particles of structured oil drops dispersed in the chocolate, but we assumed that there is no homogeneous distribution throughout the sample. Similar structures were reported by Skelhon et al. (2013) who replaced 50% cocoa butter content with 2% agar microgels (containing 20% of sunflower oil).
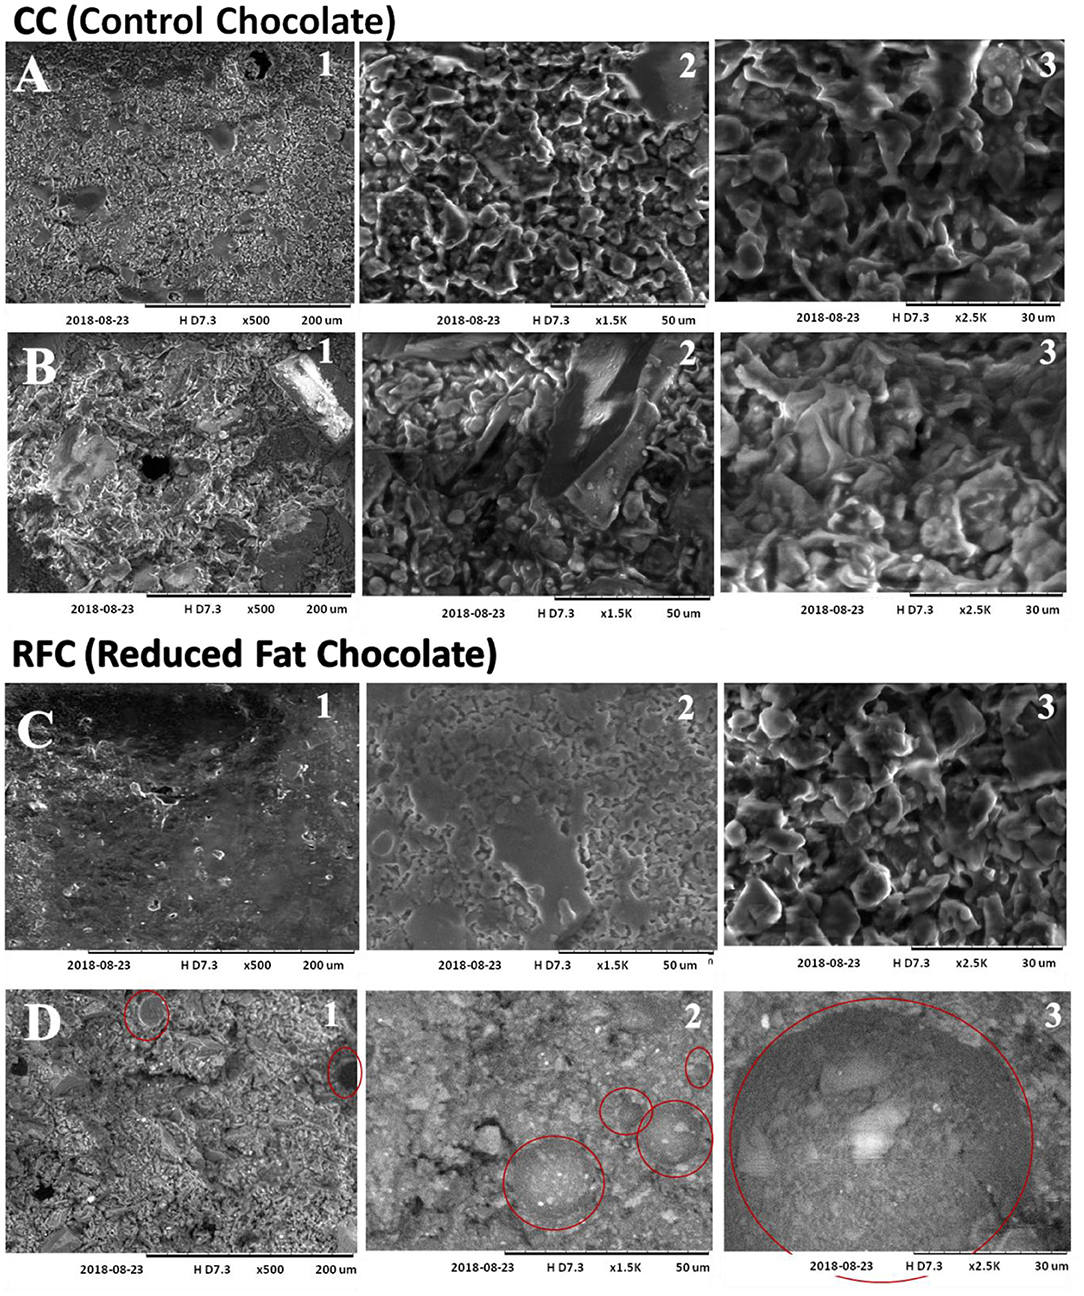
Figure 7. Optical micrograph of control chocolates (CC) and reduced fat chocolate (RFC): Surface (A,C); Cross section (B,D) in three different increments 500 × (1), 1,500 × (2), and 2,500 × (3) on day 1 of storage.
Figure 8 shows the presence of small dots or circular white spots that are not homogeneous and without a defined shape (A1, C2) giving the appearance of marble on the surface, and on the other hand, small “needles” can be seen in micrographs E2 and E3, which may be related to the formation of new crystals, referring to 60 days of storage. In RFC samples, small holes were observed on the surface (Figure 8; C1, C2, and C3). The encapsulated structures found in micrographs H1 and H2 appear to be rougher compared to the cross-sectional images of Figure 7 (D1, D2, and D3).
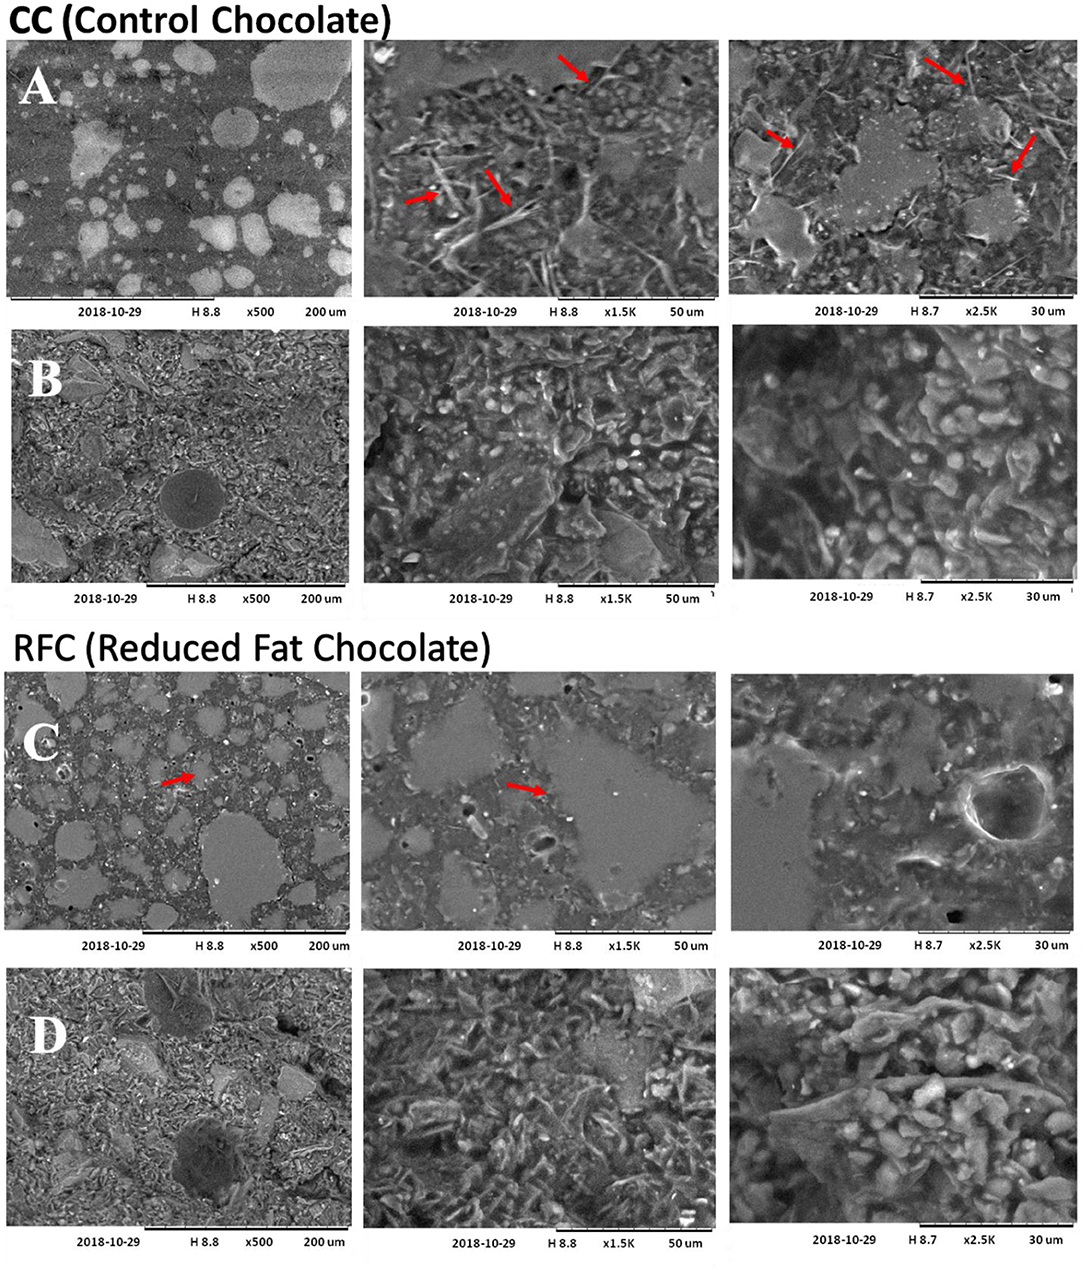
Figure 8. Optical micrograph of control chocolates (CC) and reduced fat chocolate (RFC): Surface (A,C); Cross section (B,D) in three different increments 500 × (1), 1,500 × (2), and 2,500 × (3) on day 60 of storage.
On the other hand, comparing sections A1 and A2 with C1 and C2 in Figure 7, we observe that in RFC, there is apparently a “covering” effect at the surface, perhaps due to the presence of fat substitutes. But when we look closer (amplification x2.5K), we do not see much difference between the CC and RFC samples. In Figure 8, this “covering” effect provided by fat substitutes is clearer and this probably contributed positively to avoid the unwanted visual changes caused by the polymorphic transition from β5 to β6 that occurs with storage. Furthermore, if we compare Figure 8, B3 with D3, we notice that the presence of fat substitutes did not cause considerable changes internally to the chocolate, but only at its surface.
In Figure 8 (A2, A3) needle-like crystals are observed, according to Rousseau; Smith (2008); crystals already present if the food of triacylglycerols in liquid form forming needle-like crystals that emerge on the chocolate surface, so that changes can be observed with the naked eye on the chocolate surface. On the other hand, in regular chocolate, the existing crystals will feed on the available liquid state triglycerides, leading to large needles that extend outside the surface. Although different in appearance and in the flowering and kinetic path of fat, both solid and filled chocolates will appear flowery to the naked eye.
However, further studies using Scanning Electron Microscopy, for a better visualization and X-Ray Diffraction to understand the polymorphic forms of the lipid phase could contribute to a better understanding of the influence of the substitution of part of the chocolate cocoa butter by the hydrogels with 20% of canola oil.
Yield stress parameters and plastic viscosity are shown in Table 3. It can be seen that the plastic viscosity of the RFC formulation was greater than CC for all the evaluated conditions. However, the values found for both formulations remained within the range that covers the vast majority of commercial chocolates, from 2 to 4 Pa.s (Beckett, 2009). The differences between the formulations are possibly related with the reduction of the fat content (16%) for RFC. Industrial-scale processing, as well as the use of emulsifiers, can reduce differences in the rheological properties of the formulations.
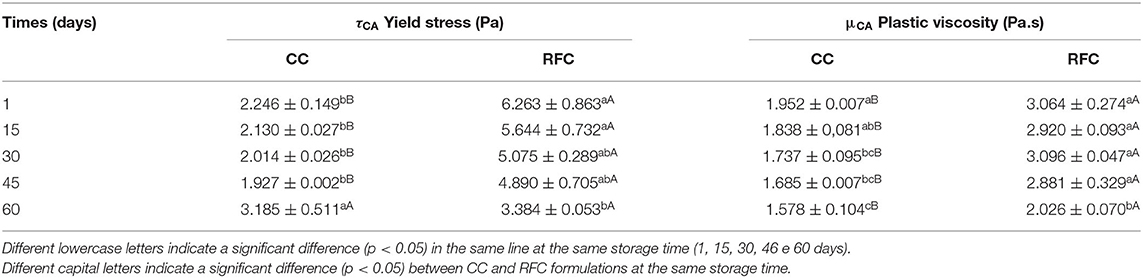
Table 3. Yield stress (τCA) and plastic viscosity (μCA) of the control chocolate (CC) and reduced fat chocolate (RFC) obtained by the Casson model.
The CC yield stress did not show significant variations on day 1 and 45 of storage, but at 60 days of storage, the CC yield stress got a significant increase maintaining a more coherent profile compared with the RFC, always showing higher values than the CC. The flow limit is affected by the particle-particle interaction, the quantity and specific surface area of the particles, emulsifiers and moisture content (Do et al., 2007; Ashrafie et al., 2014). The trend observed for the flow limit between treatments may be the result of changes caused by the increase in total solids content together with the reduction of the fatty phase in chocolate in RFC.
Plastic viscosity is always higher in RFC (values from 2.02 to 3.06 Pa.s) than in CC (between 1.57 and 1.95 Pa.s), and decreases in both treatments through the storage time. The effect of the fat is proportionally bigger for the plastic viscosity than for the yield stress. For example, the extra fat in the CC is added to the free fat molecules and this causes the particles, when they flow, to stick together. This free fat has a great effect on the flow lubrication when it occurs and then the plastic viscosity decreases (Ashrafie et al., 2014). And even with these differences found between treatments, very similar values to those reported in the literature were obtained (Lee et al., 2009; Skelhon et al., 2013).
The tension and breaking strength of the CC and RFC is shown in Table 4 after 1, 15, 30, 45, and 60 days of storage at 24 ± 1°C. We can observe that the values of tension and force decreased, in both formulations, according to the storage time. After 60 days of monitoring, we can see that the CC had greater variations in tension (from 2.17 to 1.17 kgf/cm2) and breaking strength (from 44.32 to 20.87 N) with significant differences in 15–60 days of storage. On the other hand, RFC, even though the values decreased from 1.95 to 1.46 kgf/cm2 and 45.29 to 32.12 did not present significant differences.
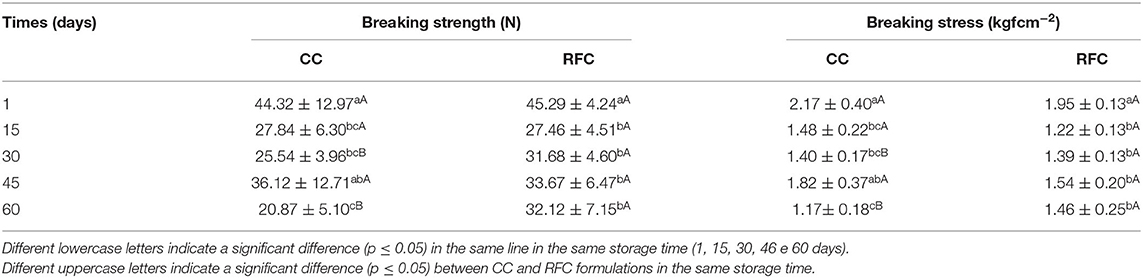
Table 4. Breaking stress (kgf cm-2) and breaking strength (N) of control chocolate bars (CC) and reduced fat chocolate (RFC).
The values obtained coincide with those reported for chocolates with partial substitution of cocoa butter by alternative fats such as Cocoa Butter Substitute (CBS) (Biswas et al., 2017), and Cocoa Butter Replacer (CBR) (Quast et al., 2013). The different concentrations of cocoa butter have not been shown to influence the mechanical strength of chocolate in the two formulations, despite the differences found in the treatments. Afoakwa et al. (2009) mention that the force necessary to penetrate the chocolate is dependent on the interaction that exists between the particles; this interaction is a result of the particle size in the chocolate and also the type and quantity of fat.
The study of the melting profile of chocolate allows assume about melting characteristics in the mouth of this product when consumed. According to Clercq et al. (2014), the melting profile of dark chocolate should have a narrow melting peak, leading to a rapid melting at 37°C (body temperature), producing a feeling of freshness and softness in the mouth. This is also related to the type of polymorphic shape of the crystals formed during tempering. Table 5 shows the thermodynamic data obtained by DSC for the CC and RFC samples, after periodic monitoring for 60 days. The parameters for the evaluation of the melting properties were Tonset (temperature at which the corresponding crystalline form starts to melt), Tend (temperature at which the sample liquefaction is completed), ΔHmelt (amount of energy required for the complete sample fusion) and Tmax (temperature at which maximum melting occurs) (Afoakwa et al., 2009).
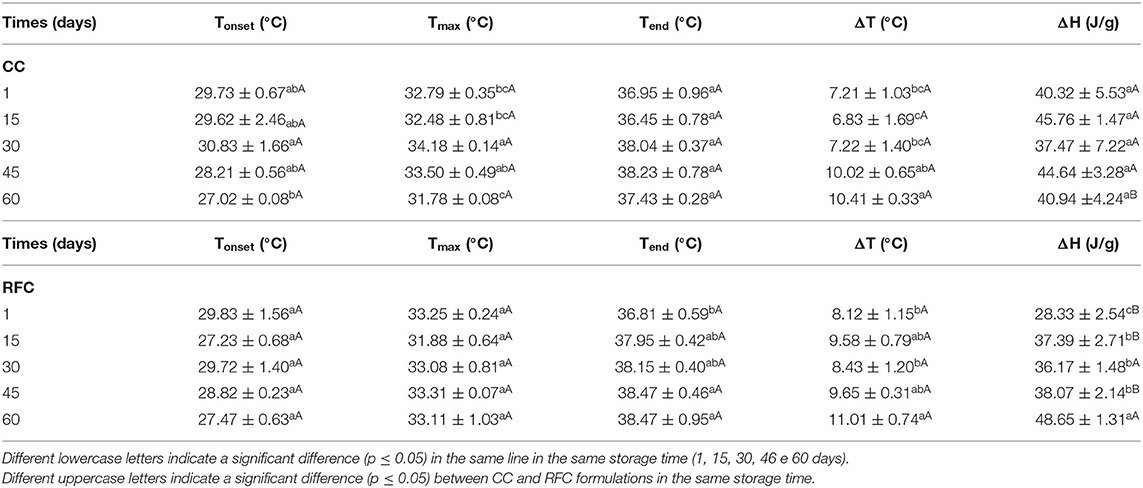
Table 5. Overview of the melting profile of control chocolate (CC) and modified chocolate (RFC).
The CC had the highest crystallization temperature on the 30th (30.83°C) and the lowest on the 60th day of storage (27.02°C); this behavior was also observed at the maximum melting temperature (Tmax) with values between 31.78 and 34.18°C. In RFC, there is a slight variation in the values of Tonset and Tmax, but there is no significant difference with time. At the final sample liquefaction temperatures (Tend), there were significant variations with values between 36.81 and 38.47°C through the storage times. The values obtained are slightly higher than the results presented by Afoakwa et al. (2008b); they carried out tests using DSC for chocolates with different levels of lecithin and fat, but with a total cocoa butter content above 34%, obtaining melting curves for maximum peak temperatures in the range of 32.3–32.5°C. Some authors comment that the specific solid-solid transition to a higher stable crystal structure formation culminates in the development of fat bloom (Lonchampt and Hartel, 2004), and as a consequence, consumers of chocolate need to spend more time for complete melting under the temperature of the mouth (Rousseau, 2007). It can be assumed that this is related to the composition of chocolate. In this case, RFC produced from the CHI:CR2 complex with 20% CO needs a higher temperature to reach the final melting point during storage. It was noted that the enthalpy value increases, with a significant difference, during the storage time from 28.33 J/g on day 1 to 48.65 J/g on day 60, the last one showing the greatest stability due to greater energy adsorbed in the fusion process. Moreover, we observe that the addition of hydrogels with canola oil, in the melting enthalpy values, was initially lower in relation to CC. At the end of the stability evaluation period, it was higher, indicating the polymorphic transition to more stable crystal forms, which coincides with what is displayed in Figures 7, 8.
In general, a very similar behavior can be observed between CC and RFC, without a significant difference in the parameters Tonset, Tmax, Tend. These three temperatures are related to the type of crystal and the melting properties, which may be the result of the polymorphic stabilization of chocolates. It is interesting to note that the standard deviation of the enthalpy of fusion is higher compared to other parameters. Literature reported that depending on the crystallization technique, a greater distribution of different polymorphic forms in the fat matrix may occur, which would result in less dense and heterogeneous crystalline fat structures. As a result, this variability in polymorphism and heterogeneous crystals would be reflected in the variation found in the fusion parameters (Svanberg et al., 2011). This does not mean that variations observed for RFC reflect a negative effect compared to CC, but possibly CC takes less time to reach stability in the first moment.
The nutritional information of the two chocolate formulations (control chocolate and modified chocolate) is shown in Table 6. The values obtained from the energy value (523.3 Kcal/100 g) and total fat value (36.8 g/100 g) of the modified chocolate are slightly lower than the control. This was an expected result, due to the partial substitution of cocoa butter in the final product. On the other hand, modified chocolate is the one that presents a higher value of sodium content (38.0 mg/kg) and carbohydrates (38.2 g/100 g), possibly due to the influence of polysaccharides (included in the carbohydrates group), and the lower saturated fat of RFC than CC. Even with these slight differences, RFC has a caloric and fat reduction advantage in the nutritional profile, and above all the decrease of 4.4 g of saturated fat corresponding to 16% less than the control chocolate. This makes it a final product with an interesting nutritional profile to be explored in the healthier market for the consumer, with a low content of saturated fat.
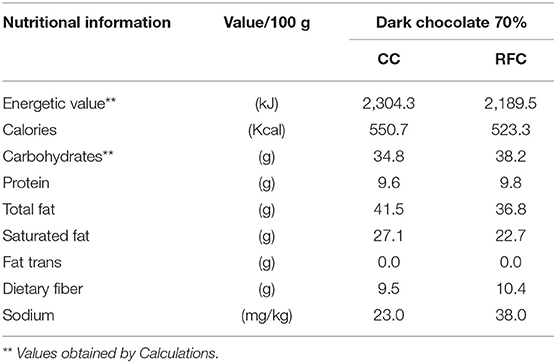
Table 6. Comparison of the nutritional profile of control chocolate (CC) with reduced fat chocolate (RFC).
Figure 9 presents the results from the sensory evaluation of CC and RFC. There was no significant difference (p ≤ 0.05) between CC and RFC regarding the appearance and flavor (cocoa and fat aroma). For all of the attributes evaluated, average values between 6.39 and 7.40 were obtained, indicating on the hedonic scale that most tasters defined that they “liked the chocolates a little” and “liked the chocolates a lot” (numerical values between 6 and 8). This result is considered good, indicating that addition of hydrogels with 20% of canola oil did not influence the sensory acceptance of chocolate.
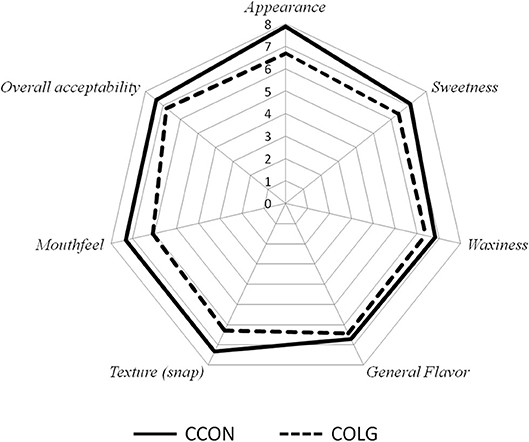
Figure 9. Sensory evaluation of the attributes of — control chocolate (CC) and − − − reduced fat chocolate (RFC).
On the other hand, the results show that the attributes of sweetness, and mainly mouthfeel, were the most affected by the partial substitution of cocoa butter proposed in this work. Values for both attributes present significant differences. Among the total number of evaluators, 47% would certainly buy CC and 40% would certainly buy RFC.
However, although there is a significant difference in the general impression of the different treatments, this difference was not very large, considering that RFC is a “new” product, so it is interesting to study attributes that are the most affected in the technological process, such as the melting, and which represent a significantly greater difference for the consumer, compared to CC.
It should be noted that the results presented are only the result of the sensory evaluation of the products attributes (color, aroma, taste, and texture); therefore, they are not decisive in defining the purchase intention of the product. In addition to the fundamental role of sensory properties, there are other factors, such as type of consumer, packaging, messages on labels (for example: health benefits, absence of additives, traditional and distinct production) and, to a large extent, price (Carneiro et al., 2005; Haddad et al., 2007).
We demonstrated that polymeric materials such as sodium alginate and carrageenans for the production of complex hydrogels with chitosan allow obtaining cross-linked systems to form a 3D structure with good physical stability, using polysaccharides without emulsifying properties. However, due to the fact that these polymers do not have an active surface, the systems cannot retain large amounts of oil. Nevertheless, the oil retention in hydrogels CHI:ALG (25:75) and CHI:CR2 (25:75) with 20% of canola oil was considered effective. CHI:CR2 hydrogel with 20% of canola oil was used as a partial substitute for cocoa fat in the formulation of 70% dark chocolate with a reduction of 16% of saturated fat in the final product (compared to control). Also, a technical differential for chocolate production was the “covering” effect observed with the reformulation of chocolate, which brings positive contributions to avoid the unwanted visual changes caused by the polymorphic transition of the β5 to β6 crystals that occurs with storage. We hope that these findings generate great interest in the polymeric materials used in this study, due to the natural, non-toxic, and food-grade nature, which guarantees greater exploration, as a strategy for structuring foods with lower fat content.
The raw data supporting the conclusions of this article will be made available by the authors, without undue reservation.
The studies involving human participants were reviewed and approved by Comitê de Ética em Pesquisa da Universidade Estadual de Campinas. The patients/participants provided their written informed consent to participate in this study.
All authors listed have made a substantial, direct and intellectual contribution to the work, and approved it for publication.
The authors gratefully acknowledge the financial support for this research from The National Council for the Support of Research CAPES (Finance Code 001) and CNPq (170289/2017-6, 306461/2017-0) for fellowship and FAPESP for financial support (projects 2018/20466-8, 2009/54137-1).
The authors declare that the research was conducted in the absence of any commercial or financial relationships that could be construed as a potential conflict of interest.
Afoakwa, E. O., Paterson, A., and Fowler, M. (2008a). Effects of particle size distribution and composition on rheological properties of dark chocolate. Eur. Food Res. Technol. 226, 1259–1268. doi: 10.1007/s00217-007-0652-6
Afoakwa, E. O., Paterson, A., Fowler, M., and Vieira, J. (2008b). Characterization of melting properties in dark chocolates from varying particle size distribution and composition using differential scanning calorimetry. Food Res. Int. 41, 751–757. doi: 10.1016/j.foodres.2008.05.009
Afoakwa, E. O., Paterson, A., Fowler, M., and Vieira, J. (2009). Influence of tempering and fat crystallization behaviours on microstructural and melting properties in dark chocolate systems. Food Res. Int. 42, 200–209. doi: 10.1016/j.foodres.2008.10.007
Afzal, S., Maswal, M., and Dar, A. A. (2018). Rheological behavior of pH responsive composite hydrogels of chitosan and alginate: characterization and its use in encapsulation of citral. Colloids Surfaces B: Biointerf. 169, 99–106. doi: 10.1016/J.COLSURFB.2018.05.002
Ahmed, E. M. (2015). Hydrogel: preparation, characterization, and applications: a review. J. Adv. Res, 6, 105–121. doi: 10.1016/j.jare.2013.07.006
Alnemr, T., Helal, A., Hassan, A., and Elsaadany, K. (2016). Utilizing the functions of hydrocolloids as fat mimetic to enhance the properties of low-fat domiati cheese. J. Food Proces. Technol. 7, 105–121. doi: 10.4172/2157-7110.1000637
AOAC (2016). “Cocoa beans and its products,” in International Official Methods of Analysis of AOAC International Guidelines for Standard Method Performance Requirement, ed P. S. ARIA (Gaithersburg: AOAC International).
Ashrafie, N., T., Azizi, M. H., Taslimi, A., Mohammadi, M., Neyestani, T. R., et al. (2014). Development of reduced-fat and reduced-energy dark chocolate using collagen hydrolysate as cocoa butter replacement agent. J. Food Nutrit. Res. 53, 13–21.
Beckett, S. T. (2009). Industrial Chocolate Manufacture and Use: Fourth Edition. Oxford: Blackwell Publishing Ltd.
Biswas, N., Cheow, Y. L., Tan, C. P., and Siow, L. F. (2017). Physical, Rheological and sensorial properties, and bloom formation of dark chocolate made with cocoa butter substitute (CBS). LWT - Food Sci. Technol. 82, 420–428. doi: 10.1016/j.lwt.2017.04.039
Bricknell, J., and Hartel, R. W. (1998). Relation of fat bloom in chocolate to polymorphic transition of cocoa butter. J. Am. Oil Chem. Soc. 75, 1609–1615.
Carneiro, J. D. S., Minim, V. P. R., Deliza, R., Silva, C. H. O., Carneiro, J. C. S., and Leão, F. P. (2005). Labelling effects on consumer intention to purchase for soybean oil. Food Qual. Prefer. 16, 275–282. doi: 10.1016/j.foodqual.2004.05.004
Clercq, N., De., Depypere, F., Delbaere, C., Nopens, I., Bernaert, H., et al. (2014). Influence of cocoa butter diacylglycerols on migration induced fat bloom in filled chocolates. Eur. J. Lipid Sci. Technol. 116, 1388–1399. doi: 10.1002/ejlt.201300476
Comert, F., Malanowski, A. J., Azarikia, F., and Dubin, P. L. (2016). Coacervation and precipitation in polysaccharide-protein systems. Soft Matter 12, 4154–4161. doi: 10.1039/c6sm00044d
Do, T. A. L., Hargreaves, J. M., Wolf, B., Hort, J., and Mitchell, J. R. (2007). Impact of particle size distribution on rheological and textural properties of chocolate models with reduced fat content. J. Food Sci. 72, 541–552. doi: 10.1111/j.1750-3841.2007.00572.x
Espinosa-Andrews, H., Báez-González, J. G., Cruz-Sosa, F., and Vernon-Carter, E. J. (2007). Gum Arabic-chitosan complex coacervation. Biomacromolecules 8, 1313–1318. doi: 10.1021/bm0611634
Espinosa-Andrews, H., Enríquez-Ramírez, K. E., García-Márquez, E., Ramírez-Santiago, C., Lobato-Calleros, C., and Vernon-Carter, J. (2013). Interrelationship between the zeta potential and viscoelastic properties in coacervates complexes. Carbohyd. Poly. 95, 161–66. doi: 10.1016/j.carbpol.2013.02.053
Espinosa-Andrews, H., Sandoval-Castilla, O., Vázquez-Torres, H., Vernon-Carter, E. J., and Lobato-Calleros, C. (2010). Determination of the gum arabic–chitosan interactions by fourier transform infrared spectroscopy and characterization of the microstructure and rheological features of their coacervates. Carbohyd. Poly. 79, 541–546. doi: 10.1016/j.carbpol.2009.08.040
Gallaher, D. D., Gallaher, C. M., Mahrt, G. J., Carr, T. P., Hollingshead, C. H., Hesslink, R., et al. (2002). A glucomannan and chitosan fiber supplement decreases plasma cholesterol and increases cholesterol excretion in overweight normocholesterolemic humans. J. Am. College Nutrit. 21, 428–433. doi: 10.1080/07315724.2002.10719246
Goycoolea, F. M., Argüelles-Monal, W., Peniche, C., and Higuera-Ciapara, H. (2000). Effect of chitosan on the gelation of K-Carrageenan under various salt conditions. Hydrocolloids 2000, 211–216. doi: 10.1016/B978-044450178-3/50087-1
Haddad, Y., Haddad, J., Olabi, A., Shuayto, N., Haddad, T., and Toufeili, I. (2007). Mapping determinants of purchase intent of concentrated yogurt (Labneh) by conjoint analysis. Food Qual. Preference 18, 795–802. doi: 10.1016/j.foodqual.2007.01.009
Kulig, D., Zimoch-Korzycka, A., Jarmoluk, A., and Marycz, K. (2016). Study on alginate-chitosan complex formed with different polymers ratio. Polymers 8, 1–17. doi: 10.3390/polym8050167
Kulig, D., Zimoch-Korzycka, A., Kr,ó, Z., Oziembłowski, M., and Jarmoluk, A. (2017). Effect of film-forming alginate/chitosan polyelectrolyte complex on the storage quality of pork. Molecules 22:98. doi: 10.3390/molecules22010098
Künzler, J. F. (2002). “Hydrogels,” in Encyclopedia of Polymer Science and Technology (Hoboken, NJ: John Wiley & Sons, Inc.). Available online at: https://onlinelibrary.wiley.com/page/book/10.1002/0471440264/homepage/editorscontributors.html
Lee, S., Biresaw, G., Kinney, M. P., and Inglett, G. E. (2009). Effect of cocoa butter replacement with a β-glucan-rich hydrocolloid (C-Trim30) on the rheological and tribological properties of chocolates. J. Sci. Food Agri. 89, 163–167. doi: 10.1002/jsfa.3424
Lohman, M. H., and Hartel, R. W. (1994). Effect of milk fat fractions on fat bloom in dark chocolate. J. Am. Oil Chem. Soc. 71, 267–276. doi: 10.1007/BF02638052
Lonchampt, P., and Hartel, R. W. (2004). Fat bloom in chocolate and compound coatings. Eur. J. Lipid Sci. Technol. 106, 241–274. doi: 10.1002/ejlt.200400938
Maezaki, Y., Tsuji, K., Nakagawa, Y., Kawai, Y., Akimoto, M., Tsugita, T., et al. (1993). Hypocholesterolemic effect of chitosan in adult males. Biosci. Biotechnol. Biochem. 57, 1439–1444. doi: 10.1271/bbb.57.1439
Miyasaki, E. K. (2013). Avaliação a Adição de Emulsificantes do Tipo Lecitinas Modificadas na Cristalização de Manteiga de Cacau e de Chocolate Amargo. [master's thesis]. Universidade Estadual de Campinas.
O'Brien, C. M., Muller, A., Scannell, A. G. M., and Arendt, E. (2003). Evaluation of the effects of fat replacers on the quality of wheat bread. J. Food Eng. 56, 265–267. doi: 10.1016/S0260-8774(02)00266-2
Paglarini, C., de, S., Furtado, G., de, F., Biachi, J. P., Silva, V. A. V., Martini, S., et al. (2018). Functional emulsion gels with potential application in meat products. J. Food Eng. 222, 29–37. doi: 10.1016/j.jfoodeng.2017.10.026
Patel, A. R., Schatteman, D., Lesaffer, A., and Dewettinck, K. (2013). A foam-templated approach for fabricating organogels using a water-soluble polymer. RSC Adv. 3, 22900–22903. doi: 10.1039/c3ra44763d
Peppas, N. A., and Khare, A. R. (1993). Preparation, Structure and diffusional behavior of hydrogels in controlled release. Adv. Drug Delivery Rev. 11, 1–35. doi: 10.1016/0169-409X(93)90025-Y
Quast, L. B., Luccas, V., Ribeiro, A. P. B., Cardoso, L. P., and GuenterKieckbusch., T. (2013). Physical properties of tempered mixtures of cocoa butter, CBR and CBS fats. Int. J. Food Sci. Technol. 48, 1579–1588. doi: 10.1111/ijfs.12127
Rabelo, R. S., Oliveira, I. F., Da Silva, V. M., Prata, A. S., and Hubinger, M. D. (2018). Chitosan coated nanostructured lipid carriers (NLCs) for loading vitamin D: A physical stability study. Int. J. Biol. Macromol. 119, 902–912. doi: 10.1016/J.IJBIOMAC.2018.07.174
Rabelo, R. S., Tavares, G. M., Prata, A. S., and Hubinger, M. D. (2019). Complexation of chitosan with gum arabic, sodium alginate and κ-carrageenan: effects of pH, polymer ratio and salt concentration. Carbohyd. Poly. 223:115120. doi: 10.1016/j.carbpol.2019.115120
Rather, S. A., Masoodi, F. A., Akhter, R., Rather, J. A., Gani, A., Wani, S. M., et al. (2015). Effects of guar-xanthan gum mixture as fat replacer on the physicochemical properties and oxidative stability of goshtaba, a traditional indian meat product. J. Food Proces. Preserv. 39, 2935–2946. doi: 10.1111/jfpp.12545
Rather, S. A., Masoodi, F. A., Akhter, R., Rather, J. A., Gani, A., Wani, S. M., et al. (2016). Application of guar–xanthan gum mixture as a partial fat replacer in meat emulsions. J. Food Sci. Technol. 53, 2876–2886. doi: 10.1007/s13197-016-2270-4
Rousseau, D. (2007). “The microstructure of chocolate,” in Understanding and Controlling the Microstructure of Complex Foods. ed Woodhead Publishing. (Ryerson University: Woodhead Publishing).
Sæther, H. V., Holme, H. K., Maurstad, G., Smidsrød, O., and Stokke, B. T. (2008). Polyelectrolyte complex formation using alginate and chitosan. Carbohyd. Poly. 74, 813–821. doi: 10.1016/j.carbpol.2008.04.048
Shepherd, R., Reader, S., and Falshaw, A. (1997). Chitosan functional properties. Glycoconj. J. 14, 535–542. doi: 10.1023/A:1018524207224
Skelhon, T. S., Olsson, P. K. A., Morgan, A. R., and Bon, S. A. F. (2013). High internal phase agar hydrogel dispersions in cocoa butter and chocolate as a route towards reducing fat content high internal phase agar hydrogel dispersions in cocoa butter and chocolate as a route towards reducing fat content. Food Funct. 44, 1279–1422. doi: 10.1039/c3fo60122f
Smith, J. (2008). Post-Structuralist Discourse Relative to Phenomological Pursuits in the Deconstructivist Arena. [dissertation/master's thesis]. (Chicago, IL: University of Chicago).
Steffe, J. F. (1996). Rheological Methods in Food Process Engineering, 2nd edition. East Lansing, MI: Freeman Press.
Svanberg, L., Ahrn,é, L., Lorén, N., and Windhab, E. (2011). Effect of sugar, cocoa particles and lecithin on cocoa butter crystallisation in seeded and non-seeded chocolate model systems. J. Food Eng. 104, 70–80. doi: 10.1016/j.jfoodeng.2010.09.023
Volod'ko, A. V., Davydova, V. N., Barabanova, A. O., Soloveva, T. F., and Ermak, I. M. (2012). Formation of soluble chitosan-carrageenan polyelectrolyte complexes. Chem. Nat. Comp. 48, 353–357. doi: 10.1007/s10600-012-0250-0
Volod'ko, A. V., Davydova, V. N., Chusovitin, E., Sorokina, I. V., Dolgikh, M. P., Tolstikova, T. G., et al. (2014). Soluble chitosan–carrageenan polyelectrolyte complexes and their gastroprotective activity. Carbohydr. Poly. 101, 1087–1093. doi: 10.1016/j.carbpol.2013.10.049
Volod'ko, A. V., Davydova, V. N., Glazunov, V. P., Likhatskaya, G. N., and Yermak, I. M. (2016). Influence of structural features of carrageenan on the formation of polyelectrolyte complexes with chitosan. Int. J. Biol. Macromol. 84, 434–441. doi: 10.1016/j.ijbiomac.2015.12.031
Wijaya, W., Van der Meeren, P., Wijaya, C. H., and Patel, A. R. (2017). High internal phase emulsions stabilized solely by whey protein isolate-low methoxyl pectin complexes: effect of pH and polymer concentration. Food Funct. 8, 584–594. doi: 10.1039/c6fo01027j
Keywords: canola oil, polymer network, polysaccharide, alginate, carrageenan, structured oil
Citation: Gallegos Soto AS, Rabelo RS, Vélez-Erazo EM, de Souza Silveira PT, Efraim P and Hubinger MD (2020) Application of Complex Chitosan Hydrogels Added With Canola Oil in Partial Substitution of Cocoa Butter in Dark Chocolate. Front. Sustain. Food Syst. 4:559510. doi: 10.3389/fsufs.2020.559510
Received: 06 May 2020; Accepted: 16 October 2020;
Published: 30 November 2020.
Edited by:
Stephen Robert Euston, Heriot-Watt University, United KingdomReviewed by:
Guillermo Alfredo Picó, Institute of Biotechnological and Chemical Processes Rosario (IPROBYQ), ArgentinaCopyright © 2020 Gallegos Soto, Rabelo, Vélez-Erazo, de Souza Silveira, Efraim and Hubinger. This is an open-access article distributed under the terms of the Creative Commons Attribution License (CC BY). The use, distribution or reproduction in other forums is permitted, provided the original author(s) and the copyright owner(s) are credited and that the original publication in this journal is cited, in accordance with accepted academic practice. No use, distribution or reproduction is permitted which does not comply with these terms.
*Correspondence: Andres Silvestre Gallegos Soto, YW5kcmVzLnNpbGdhc29AZ21haWwuY29t; Miriam Dupas Hubinger, bWh1YkB1bmljYW1wLmJy
Disclaimer: All claims expressed in this article are solely those of the authors and do not necessarily represent those of their affiliated organizations, or those of the publisher, the editors and the reviewers. Any product that may be evaluated in this article or claim that may be made by its manufacturer is not guaranteed or endorsed by the publisher.
Research integrity at Frontiers
Learn more about the work of our research integrity team to safeguard the quality of each article we publish.