 Nazmus Sazib
 lliana E. Mladenova
 John D. Bolten
94% of researchers rate our articles as excellent or good
Learn more about the work of our research integrity team to safeguard the quality of each article we publish.
Find out more
ORIGINAL RESEARCH article
Front. Sustain. Food Syst., 23 October 2020
Sec. Land, Livelihoods and Food Security
Volume 4 - 2020 | https://doi.org/10.3389/fsufs.2020.509914
This article is part of the Research TopicDemocratizing Earth Observations-Based Science to Improve Agriculture, Food Security and Resilience, from Village to Globe: Volume IView all 8 articles
The El Niño–Southern Oscillation (ENSO) is one of the strongest drivers of climate variability that directly influences agricultural production. The aim of this study is to assess the impact of ENSO on agriculture in Southern and Eastern Africa by (1) exploring the association between ENSO, vegetation condition and soil moisture, and (2) analyzing the difference in soil moisture and vegetation conditions for two extreme ENSO phases (El Niño and La Niña). Our results indicate that vegetation conditions are strongly associated with ENSO and show a clear dipole pattern that is reversed between El Niño and La Niña. Lagged correlation analysis confirms the ability of soil moisture and ENSO to predict vegetation conditions with 1–3 months of lead-time. The temporal and spatial evolution of soil moisture and vegetation responses showed the expected dipole pattern during the El Niño and subsequent La Niña events. Results indicate that ENSO impact on crop yield varies with geographical location, crop types, and ENSO phases. For example, yields in La Niña years have been higher in Southern Africa but lower in Eastern Africa. Maize yield decreases associated with El Niño events were usually larger than corresponding yield increases during La Niña events over Southern Africa. Our findings highlight the impact of ENSO on agricultural production, which has significant potential to enhance the early warning system for agriculture and food security.
Agriculture plays a valuable role in improving food security not only by increasing the quantity and diversity of food but also by maintaining a strong economy, providing a livelihood of 38.3% of the world's workforce. While agricultural technologies are advancing recently, the climate is still the most critical factor in agricultural production (Rosenzweig et al., 2001). Global climate anomalies such as El Niño-Southern Oscillation (ENSO) leads to variability in the agro-climate variables affecting vegetation condition and contribute to one-third of the annual crop yield variability, varying across crop types and locations (Ray et al., 2015).
The ENSO is one of the most significant phenomena in the Earth's climate system, which explains variations in tropical Pacific sea surface temperatures (SST). Such variations affect tropical weather patterns but can have a global effect (Hanley et al., 2003). There are three phases to ENSO-El Niño, La Niña, and Neutral. In the central and eastern Pacific, the SSTs are substantially warmer than usual during the El Niño phase, where a La Niña phase happens when the SSTs are slightly cooler than normal. Neutral condition applies to the situation where neither El Niño nor La Niña occurs, and the SSTs are near-average in the equatorial Pacific. Higher sea surface temperatures warm the atmosphere during the El Niño phase, resulting in greater convection and rainfall over Eastern Africa. By contrast, a continental high-pressure system dominates Southern Africa and suppresses regional atmospheric convection and rainfall (Mulenga et al., 2003). Such changes in precipitation due to ENSO directly affect root-zone soil moisture (RZSM), which represents the available water within the plant's root zone of one meter or less and regulates vegetation growth and density (Wang et al., 2007). As a result, dry RZSM conditions due to lower precipitation and higher temperatures result in water stress for plants and reduce vegetation greenness and productivity, while favorable soil moisture conditions are associated with increased vegetation activity.
ENSO-related climate variability is especially important in Southern and Eastern Africa, where agriculture is the main economic sector; contributing to ~17% of regional GDP and 60% of the region's population rely on the sector for their livelihood (Nhamo et al., 2019). ENSO has been affecting the climate regime of Eastern Africa, causing frequent drought during past decades, and is the main natural hazard that contributes to food insecurity and poverty (Qu et al., 2019). The Eastern Africa region has experienced eight droughts over the last 16 years, and the drought frequency has doubled from once every 6 years to once every 3 years since 2005 (Ayana et al., 2016). The 2010–11 Eastern Africa drought was one of the most recent extreme events that affected over 20 million people and caused a wider range of food insecurity situations in that region (AghaKouchak, 2015). The recent 2015–2016 El Niño event led to major hydrological crises in Eastern and Southern Africa, where 29 million people faced food insecurity due to the extreme drought conditions. Because of extensive crop failures and associated insecure food supply, humanitarian assistance was required for millions of people in Zimbabwe, Malawi, Mozambique, and Madagascar until 2017 (Guimarães Nobre et al., 2019).
The impact of ENSO on agricultural production has been investigated over different geographical regions across Eastern and Southern Africa. Crop yields tend to decrease toward the positive phase of ENSO (El Niño) in a large proportion of Southern Africa, while yields seem to increase toward the positive phase in Eastern Africa (Heino et al., 2019). Alemu and DirbaKorecha (2018) analyzed the effect of ENSO on the yields of major cereal crops in central Ethiopia's Upper Awash Basin area and recorded a 16% reduction in cereal yields during the El Niño period. Stige et al. (2006) found strong associations between year-and-year variability in ENSO and yields of maize, sorghum, millet, and groundnuts in Southern Africa, and reported a 20–50% decrease in crop yields in extreme El Niño years. Favorable rainfall conditions associated with El Nino resulted in a 17% increase in corn production in Kenya during 2015–2017 ENSO. However, much of Southern Africa experienced extreme drought conditions in 2015–2016 resulted in a 50% reduction in corn production from the 5-year average.
Earth observation data have been widely used to evaluate ENSO's impact on agricultural production as it provides continuous, consistent, and timely information on meteorological, hydrological, and biophysical variables, regardless of the location and economic development of the country. Several studies analyzed and described vegetation response to ENSO-related anomalous climatic conditions using remote sense data (Anyamba et al., 2002; Peters et al., 2003; Glennie and Anyamba, 2018). Among the several methods and indices proposed for quantifying remote sensing based vegetation properties, the Normalized Difference Vegetation Index (NDVI) is extensively used to explore the relationship between vegetation conditions and various large-scale climatic indices (Nagai et al., 2007; Shuai et al., 2016). For example, Anyamba et al. (2018) studied the spatio-temporal evolution of NDVI and precipitation anomalies over Southern and Eastern Africa during 2015–2017 ENSO cycle and found that countries in Southern (Eastern) Africa experienced dry (wet) conditions during El Niño and wet (dry) conditions during La Niña phase. This precipitation deviation from normal conditions resulted in increased vegetation activity in Southern Africa particularly in Botswana, Zimbabwe, and Central and Northern South Africa. During the same period, the dry conditions associated with La Niña led to a decrease in vegetation activity in East Africa. Winkler et al. (2017) used the Standardized Precipitation Index (SPI) and the Vegetation Condition Index (VCI) to monitor and analyze major episodes of drought linked to ENSO events across Eastern and Southern Africa between 2000 and 2016. They identified a mixed pattern of drought in Eastern Africa, where areas with two growing seasons were primarily affected by droughts during La Niña, and unimodal rainfall regimes were found to have drought at the beginning of El Niño. By comparison, most of the Southern Africa endured drought conditions during ENSO events, and the temporal-spatial evolution of the drought pattern varied significantly during the events.
Most of the above studies investigated specific El-Niño events that could not provide an adequate assessment of vegetation sensitivity to ENSO as the extent of ENSO-affected areas may not be consistent between different ENSO events (Propastin et al., 2010). In addition, understanding the effects of large-scale climate oscillations on land surface phenology is useful for early warning and drought risk reduction, particularly in Southern and Eastern Africa countries, where 95% of agriculture is rain-fed. The objectives of this work are to present a comprehensive picture of the agricultural responses to ENSO and demonstrate the potential of ENSO and earth observation data for early warning and food security over Eastern and Southern Africa. The correlation between ENSO and NDVI was computed to understand how changes in vegetation activity are associated with changes in climate variability. To illustrate the impact of ENSO at different stages of vegetation growth, we explored the relationship between ENSO and NDVI on a monthly time step. Apart from the correlation analysis, we examined the spatio-temporal evolution of the precipitation, root-zone soil moisture (RZSM), and NDVI departure during major ENSO events to evaluate the impact of ENSO on different sub-regions. This will help to assess the vulnerability of ENSO affected areas and improve food supply planning in times of food shortages, promote effective drought strategies, and disaster risk programs at national and county levels. To complement the analysis, the impacts of ENSO on the major crops (maize, sorghum, soybean, wheat, and barely) were quantified over Eastern and Southern Africa. Following this introduction, the remainder of the paper is divided into four further sections. The data and methods employed in the study are described in section Materials and Methods. Section Results describes the impact of ENSO on NDVI and crop yield, and sections Discussion and Conclusion provide some discussion of the results and conclusion, respectively.
The ENSO impact on vegetation was performed over eastern and Southern Africa, which are characterized by a wide range of topographic, climatic, and ecological diversity. Annual rainfall in Southern Africa varies from 2,100 mm over the north-west region to <20 mm over the Namibian desert, while the mean annual temperature ranges from 9 to 31°C. The Intertropical Convergence Zone (ITCZ) primarily controls the climate of Eastern Africa, where annual rainfall varies from 1,500 mm over the highlands to 200 mm in the lowlands of northeastern Kenya and Somalia. The vegetation of Southern Africa ranges from the dry savanna biome in Angola to Mediterranean vegetation in western South Africa, which accounts for more than 40% of the flora diversity in the southern hemisphere (Lawal et al., 2019). The vegetation of Eastern Africa is dominated by the open grassland and shrub land distributed over eastern Ethiopia, northern Somalia, and Kenya, but closed evergreen forest occur in the southwestern part of Ethiopia (Abera et al., 2018).
Agriculture is the primary source of livelihood, and crop production in Eastern and Southern Africa and depends strongly on seasonal rainfall as it determines the crop yield. Southern Africa displays large monthly precipitation variability, where most of the regions receive the majority of precipitation during austral summer (December–February), and the dry season generally lasts from May to September. Summer rainfall over Southern Africa is well-known to be modulated by the phase change in the ENSO. On the other hand, much of Eastern Africa experiences the main rainfall from March through May and a brief rainy period from October through December. This short rainy season is characterized by the high inter-annual variability associated with the ENSO and the Indian Ocean Dipole (Bowden and Semazzi, 2007). Seasonal rainfall patterns in those regions determine the vegetation activity. Most of Southern Africa region experiences single vegetation growing season spans from approximately December to May. Conversely, most of Eastern Africa has two growing seasons each year, the primary growing season runs from March to August and the second growing season spans from September to February. Maize, sorghum, millet, wheat, barley, rice, and teff are the principal crops in Eastern Africa, where maize and sorghum are the most significant in the context of regional food security, as both together account for more than 70% of the total cereal production (Rojas et al., 2005). South Africa's core agricultural is composed of five major crops: maize, millet, sorghum, barley, and wheat. Maize one of the main staple crops, which accounts for 70% of total produced grains and covers about 60% of the cropping area in South Africa (Akpalu et al., 2008).
In this study, ENSO phases were categorized according to Oceanic El Niño Index (ONI), which is based on a 3-month running mean of Sea Surface Temperature (SST) anomaly in the Niño 3.4 region (5°S−5°N, 120°-170°W). The region overlaps with two other regions—namely, Niño-3 (5°S−5°N, 90°-150°W) and Niño-4 (5°S−5°N, 160°E−150°W), and is considered to be most sensitive to fluctuations, duration, and magnitude of ENSO events (Erasmi et al., 2009). An El Niño event is characterized when the index values in a given ENSO year exceed 0.5°C, while a La Niña event is defined as or below the −0.5°C anomaly (Center, 2011).
Soil moisture and NDVI data used in this study were obtained from the NASA's Global Inventory Modeling and Mapping Studies (GIMMS) Global Agricultural Monitoring (GLAM) system (Tucker et al., 2005). The soil moisture data set is developed by incorporating Soil Moisture Ocean Salinity (SMOS) Level 3 soil moisture observations into the two-layer Palmer model using a Kalman Filter (EnKF) data assimilation approach (Bolten et al., 2010). The Palmer Model is a water balance model that accounts for the water gained through precipitation and lost by evapotranspiration and driven by daily precipitation data and daily minimum and maximum temperature observations provided by the U.S. Air Force 557th Weather Wing (Sazib et al., 2018). Before integration with the Palmer model, SMOS Level 3 soil moisture products were gridded into daily composites by NOAA NESDIS Soil Moisture Operational Products System (Bolten and Crow, 2012; Mladenova et al., 2019). The GIMMS system provides various soil moisture products: surface and root zone soil moisture, soil moisture profile, surface, and root zone soil moisture anomalies, which are available in 3-days composites with 0.25° spatial resolution. Root-zone soil moisture product for the period of 2010-present was used for this study.
NDVI, which is defined as the ratio of the difference between the near-infrared and red bands of the spectrum over the sum of the near-infrared and red bands, is used as a vegetation index (Tucker, 1979). Among other vegetation indices, NDVI was selected to use for this study as it is an operational, global-based vegetation index, known to be very well-correlated with the relative abundance of green biomass, including leaf area index and density of chlorophyll in plants and most widely used to investigating the effects of ENSO on vegetation conditions across different geographical regions across the globe (Sellers et al., 1997; Kogan, 2000; Behrenfeld et al., 2001; Propastin et al., 2010). Other similar vegetation indices such as Enhanced Vegetation Index (EVI) could have been used for this study and we expect would have produced similar results, though a comparison of multiple vegetation indices is beyond our scope. The NDVI data set is generated using the Resolution Imaging Spectroradiometer (MODIS) Terra surface reflectance products provided by National Aeronautics and Space Administration (NASA) Goddard Space Flight Center (GSFC) MODIS Adaptive Processing System (MODAPS) (Tucker et al., 2005).
The precipitation data sets were obtained from the Climate Hazards Group Infrared Precipitation with Station (CHIRPS) database developed by the United States Geological Survey (USGS) in collaboration with Earth Resource Observation and Science (EROS) center. CHIRPS was developed through the combination of satellite imagery and in-situ observations from various national and regional meteorological departments. The data sets are available from 1981 to near present at pentadal, decadal, and monthly temporal resolution with a spatial resolution of 0.05° and a quasi-global coverage of 50° S-50° N, 180° E-180° W (Funk et al., 2015). Information on the land cover type was obtained from the ESA's global land cover data developed using the Medium Resolution Imaging Spectrometer (MERIS) data collected by the Environmental Satellite (ENVISAT) (Arino et al., 2012). The land cover map contains 22 land cover classes as defined by the Food and Agriculture Organization of the United Nations (FAO) Land Cover Classification System (LCCS). Crop yield data for eastern and Southern Africa was obtained from the United Nations FAOSTAT database (http://faostat.fao.org). The FAOSTAT is a collection of online databases containing primary crop data for all countries and regions in the world (Food and Agriculture Organization of the United Nations, 2016). All data products used in this study were averaged to monthly composites and then resampled to 0.25° grid spacing to ensure similar temporal and spatial resolution between different datasets.
We performed two types of analysis to assess the impact of ENSO on agriculture over eastern and Southern Africa. First, we computed the Spearman's rank correlation coefficient between ENSO and NDVI for each pixel to characterize how ENSO associated with land surface dynamics over the study regions. The Spearman's rank correlation was chosen as the other statistical methods such (e.g., Pearson correlation, Linear regression) has the tendency to underestimate or overestimate the significance of the relationship when the interaction is not linear (de Beurs and Henebry, 2008). Moreover, these statistical approaches assume that soil moisture, NDVI, and ENSO anomalies follow a Gaussian distribution, whereas they exhibit non-Gaussian behavior. Spearman's rank correlation uses the rank of the data to measure the correlation coefficient does not make such assumptions, and is more suitable for non-normally distributed ENSO, vegetation indices, and soil moisture anomalies data. Correlations were also computed between monthly overlapping, 3-month ENSO values over the Niño-3.4 region, and monthly NDVI values at different time lag to address the delayed vegetation response to climate disruptions (Philippon et al., 2014). The sensitivity of NDVI to root zone soil moisture was also evaluated to understand the origin of the ENSO signal observed in the NDVI. In addition, precipitation, soil moisture, and NDVI anomalies were compared for the most recent 2015–2017 ENSO cycle, which was the second strongest event within the available ~165-year Pacific Ocean SST record (Welhouse et al., 2016; Kolusu et al., 2019). Monthly precipitation, soil moisture and NDVI data were standardized to isolate the inter-annual variability from the seasonal cycle. For each time series, monthly anomalies have been estimated with the use of Z-score (xi – μ)/(std), where μ and std represent the mean and standard deviation values of the data for that month over all the years and xi is the data value for a given month in year i.
In the second set of analyses, we evaluated the impact of ENSO on major crops in the agricultural region over Eastern and Southern Africa. Associations between yield anomalies and ENSO phase were explored through the spread of yields among ENSO phases. Crop yield data were detrended before analysis in order to understand the ENSO effect alone precisely as several other non-climate factors such as changes in agricultural technologies, institutional changes, trade policy, and financing have an impact on crop yield variations. It was achieved by subtracting an average yield of 5 years from the annual yield values and then dividing it by 5-year averages in order to obtain proportional annual deviation from the normal values (Iizumi et al., 2014).
The correlation between ENSO and NDVI was carried out to reveal the vegetation response during ENSO because ecological processes can be better predicted by large-scale climate indices than local weather and climate (Bastos et al., 2017). We observed a dipole correlation pattern over Southern Africa with negative values over the majority of the region and positive values over the northern parts of Angola, Zambia, and Mozambique (Figure 1). The significant negative values indicate that vegetation activity tends to decline during the ENSO. ENSO is generally considered the dominant mode of inter-annual climate variability with the greatest effect on summer rainfall in Southern Africa, often leading to drought conditions. ENSO is also associated with higher land surface temperatures that last longer than the drought condition and contribute to higher evaporation and drier soils. However, we found an exception to the general pattern along the southern coast of South Africa and the northern part of Southern Africa (Figure 1). These ecologically and climatologically distinct regions had a positive association with ENSO, which could be attributed to the underlying variations in local topography and the regional ocean influence on vegetation (Anyamba et al., 2018). The correlation between ENSO and NDVI anomalies was mainly positive in Eastern Africa, resulting in increased vegetation growth during ENSO. Regions with significant positive correlation were distributed over the arid part of Somalia and the semi-arid part of eastern Ethiopia and Kenya. During ENSO, these areas experienced higher than normal rainfall and an increase in the number of wet days, which enhanced vegetation growth.
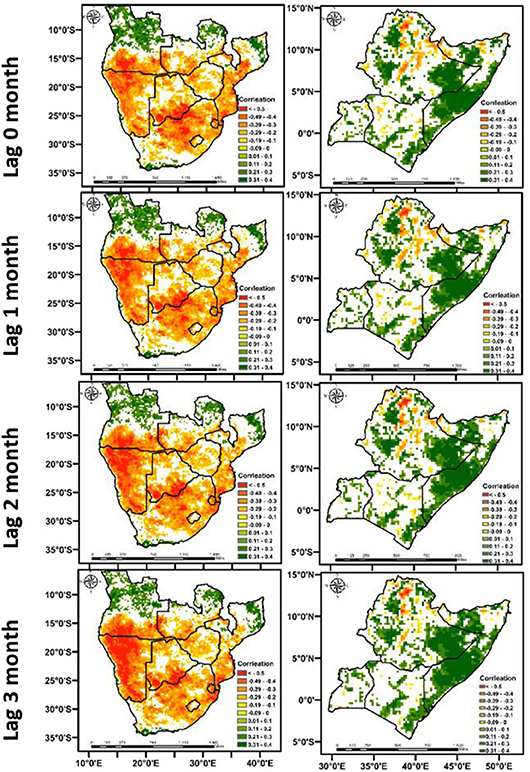
Figure 1. Correlation between ENSO and standardized NDVI anomalies over Southern Africa and Eastern Africa for the period of 2010–2019. The white areas are the pixels for which the correlation is not significant at the 90% level.
The lag correlation analysis showed slightly higher correlation values when ENSO precedes NDVI by zero to 3 months, especially over Southern Africa, which means that ENSO impacts the spatio-temporal evolution of vegetation productivity. The number of significant pixels reached a peak when the time lag was 3 months for the Eastern African region. Delayed vegetation response to ENSO may be due in part to growth rates of different vegetation types but, more importantly, to mediation between rainfall and vegetation growth through soil moisture. A large percentage of areas with significant correlation was found for the Southern Arica region compare to the Eastern Africa region. As shown in Figure 1, the relationship was significant for 78% of the pixels across Southern Africa, while about 59% of the pixels exhibited a significant correlation in the Eastern Africa region.
We performed a correlation analysis between the 3 months ENSO and monthly NDVI to assess the impact of the climate oscillation on different growth stages, which is essential for yield determination. During the starting phase of ENSO (July–September), negative correlations were observed between NDVI and ENSO over Eastern Africa, but positive relationships were recorded over Southern Africa (Table 1). The correlation coefficients were statistically significant (p < 0.01) and appeared to have a stronger negative impact during the peak phase of ENSO (December–March), rising from around −0.16 in October to −0.47 in March over Southern Africa. As for Eastern Africa, the NDVI was most strongly influenced ENSO during the December–March. These findings indicate that the peak phase of ENSO is critical for the vegetation growth over the study regions. The correlation during the post phase of ENSO (April–June) was also positive but weaker over Eastern Africa, as only 10% of the pixels showed a significant relationship between ENSO and NDVI over the region. East Africa's rainfall climatology is dominated in most parts by rainy seasons from March to May (long rains) and from October to December (short rains). Relative to the long rainfall, the short rainfall appears to have higher inter-annual variability and a close association with ENSO resulting in a weaker vegetation effect of ENSO during or shortly after the ENSO post-phase compared to the peak phase (Wenhaji Ndomeni et al., 2018).
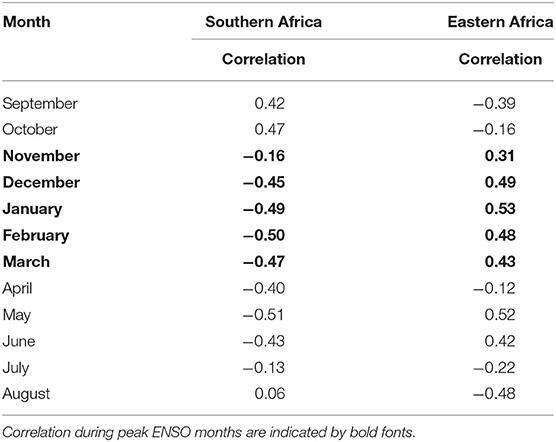
Table 1. Monthly correlation coefficients between ENSO and standardized NDVI anomalies during the study period of 2010–2019 in Eastern and Southern Africa.
The association between the RZSM and NDVI anomalies varied with geographic location and lag. Over most of the areas, NDVI and RZSM anomalies have positive correlations, which implies that an increase in soil moisture due to the ENSO could promote vegetation greenness (Figure 2). Generally, the positive significant correlation values varied significantly with changing time lags, indicating a tendency to have higher correlation values with shorter lags and lower correlation values with longer lags. The lagged relationship between root-zone soil moisture and NDVI illustrates that root-zone soil moisture can be used to predict vegetation anomalies at 1–3 months lead time, essential for early warning and food security (Asoka and Mishra, 2015).
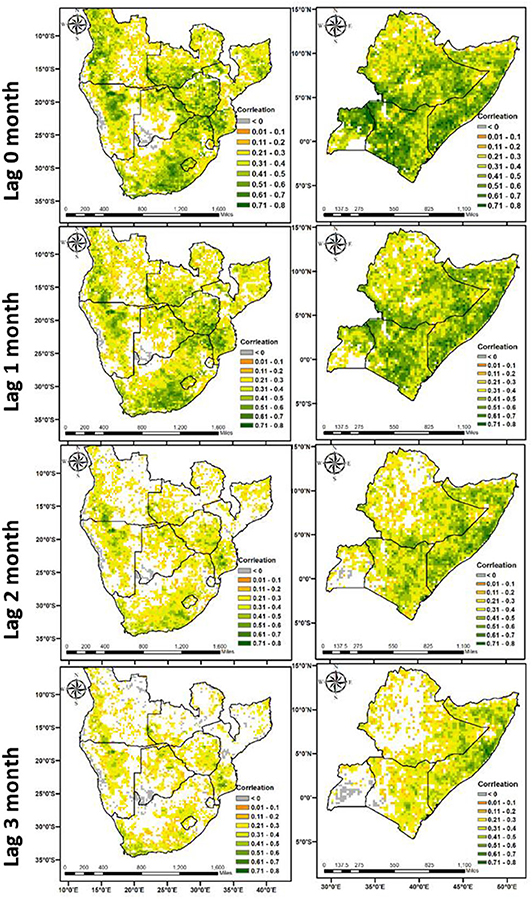
Figure 2. Correlation coefficient between RZSM and NDVI anomalies for different lag times over Southern Africa (top) and Eastern Africa (bottom) for the study period of 2010–2019. The white areas are the pixels for which the correlation is not significant at the 90% level.
We noticed stronger correlations between RZSM and NDVI anomalies in the semiarid and arid regions (e.g., Western Cape of South Africa, Kenya) compare to the humid area (e.g., Angola, central Ethiopia). Humid areas have much higher vegetation densities than semiarid or arid regions, and the availability of soil water is not a major factor regulating vegetation growth. In water-limited areas, such as the eastern part of Ethiopia and Somalia, a sudden change in the RZSM resulted in a rapid vegetation change. Based on the correlation values given in Table 2, it is obvious that areas with crop land has better association between RZSM and NDVI compare to other land cover types since cropland roots are located in shallow depths and are more sensitive to soil moisture changes than deep-rooted plants such as forests.
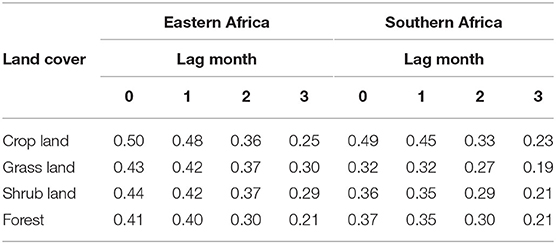
Table 2. Correlation coefficients computed between root-zone soil moisture and NDVI anomalies for different land cover types over Eastern and Southern Africa.
The 2015–2016 drought is one of the strongest drought events in the Southern Africa region driven by one of the strongest El Niño events of the last 50 years since 2016. During the 2015–2016 El Niño event, below normal rainfall condition was evident over the eastern parts of South Africa, central Botswana, as well as southern Mozambique and most of Zimbabwe and southern Mozambique. In Zambia, situated in the latitudinal center of Southern Africa, a dry condition was observed in the south of the country, while wetter or normal conditions prevailed in the north (Figure 3). Dry conditions during the El Niño event are associated with abnormal cyclonic circulation over the central Indian Ocean, which diverts moisture from the landmass and reduces precipitation and soil moisture (Ratnam et al., 2014). In contrast, Eastern Arica, particularly Kenya, Somalia, and southern Ethiopia, had above average-rainfall conditions during December–March. The maximum rainfall departures were in the range of one to three standardized deviation. The pattern of soil moisture and NDVI anomalies closely followed the precipitation anomalies, notably with the largest increases in Kenya, Somalia, and southeast Ethiopia during the El Niño phase, as shown in Figure 4.
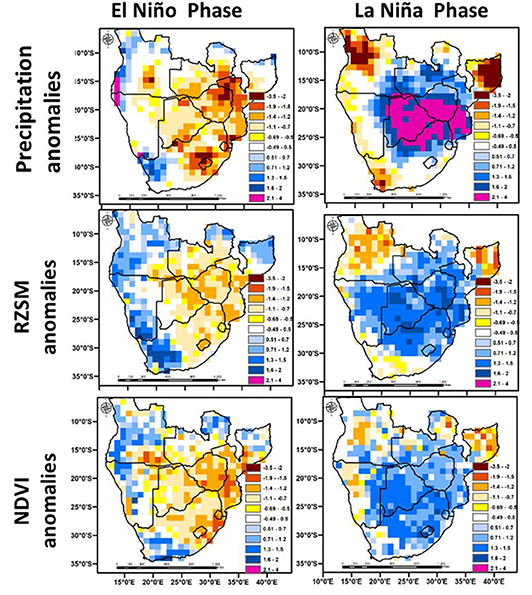
Figure 3. Standardized precipitation, root-zone soil moisture and NDVI anomalies at peak El Niño (top) condition from November 2015 to January 2016 and La Niña condition (bottom) from November 2016 to January 2017 in Southern Africa.
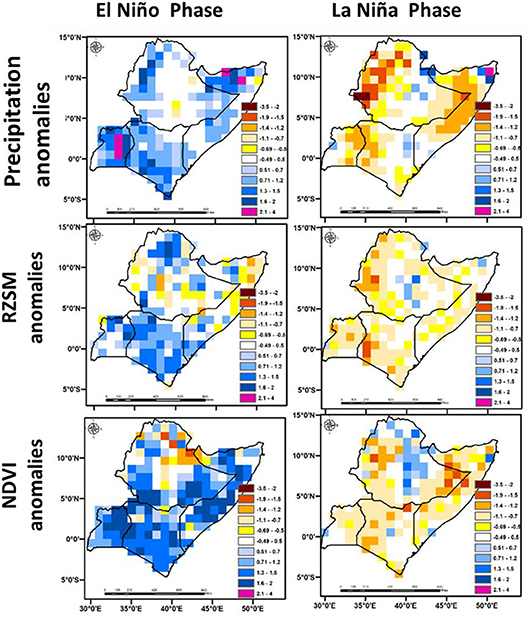
Figure 4. Standardized precipitation, root-zone soil moisture and NDVI anomalies at peak El Niño (top) condition from November 2015 to January 2016 and La Niña condition (bottom) from November 2016 to January 2017 in Eastern Africa.
On the other hand, Southern Africa exhibited a wetter condition commonly associated with the La Niña phase of the ENSO cycle. The wet conditions were concentrated over the Botswana, Mozambique, and eastern South Africa. During La Niña events, most of the parts of South Africa experienced above-normal precipitation except the south Western Cape. The South Western Cape is a winter rainfall region with a peak rainfall during May–July and is primarily influenced by mid-latitude systems instead of ENSO. Drier than normal condition were observed in Eastern Africa during the La Niña phase, and the lowest precipitation anomalies were distributed over the western part of Ethiopia and the eastern part of Somalia. Large area with negative NDVI deviations was a result of low soil moisture conditions, with maximum NDVI departures by approximately −2 standardized anomalies below average. Although dry and wet conditions spatial pattern indicated by soil moisture, precipitation and NDVI agreed largely, there were a number of apparent inconsistencies in the space/time structure of the anomalies. For example, rainfall anomalies values were higher compared to the soil moisture and NDVI anomalies during the La Niña event over Southern Africa. On the contrary, soil moisture and NDVI values showed relatively wetter conditions than the rainfall anomaly values in Eastern Africa during the El Niño event. This difference may be expected as rainfall anomalies were derived over a much longer time scale compared to the soil moisture and NDVI anomalies. Soil moisture anomalies are based on physical water balance model using both precipitation and temperature as input and take the precedent soil moisture condition and properties into account, in contrast to rainfall anomalies, which is based only on precipitation data. NDVI anomalies are also affected not only by water availability from precipitation but also by human activities in the form of agricultural practices for land use changes, and by natural influences like extreme temperatures, fires, pests, or plant diseases (Du et al., 2013).
Evaluating the impact of ENSO phase on crop yields is important for food security monitoring and assessment particularly in food-insecurity areas of the world where precipitation is often the main limiting factor for vegetation growth. Our results indicated that the impacts of ENSO on crop yield varied with the geographic locations, crop types, and ENSO phases. In general, El Niño and La Niña conditions lead to a decrease and increase, respectively, in yield with respect to the normal condition in all of the crops over Southern Africa (Figure 5). For example, average corn yield was 12 and 19% lower compared to average yield during El Niño years over South Africa and Zimbabwe, respectively. In contrast, maize production increased by 11% over South Africa during La Niña years. Crop requires adequate soil moisture with no extreme temperature during the growing season, in order to produce higher yield, our results suggest that these conditions are likely to occur during La Niña events in South Africa and Zimbabwe. While in the same phase of ENSO (La Niña), Zimbabwe experienced a 17% reduction in sorghum production (Figure 5), which might be associated with fertilizer leaching and increased water levels due to excessive rainfall (Hansen et al., 1999).
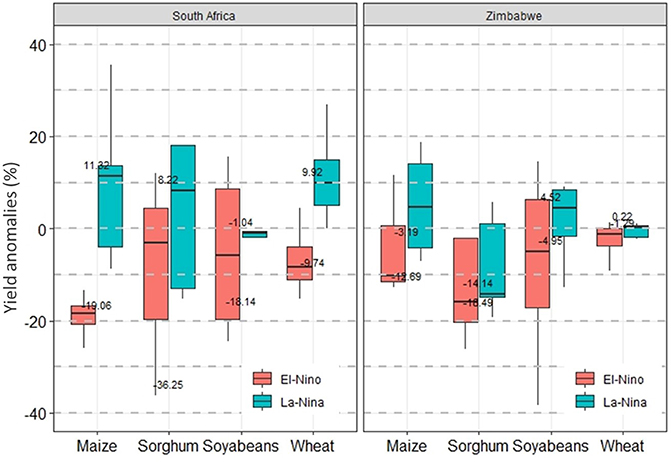
Figure 5. Box plots showing 0, 25, 50, 75, and 100th percentiles, and means (solid line) of yield anomalies for major crops in Southern Africa during El Niño and La Niña years.
In Ethiopia and Kenya, the El Niño condition is usually characterized by the above-normal rainfall and likely to cause higher yields in most of the crops. In contrast, lower crop yields compared to normal conditions were observed during the La Niña period (Figure 6). Kenya experienced a 4% increase in maize yields during El Niño years, and a 5% decrease during La Niña years. Dry and warm conditions during La Niña phases were associated with lower wheat production in Ethiopia (6%) and Kenya (4%). Regional differences in the ENSO impact could be partly explained by differences in crop planting dates, cropping patterns, soil type, different agricultural management practices, and various market demands. Another factor that may have contributed to the regional differences in the ENSO impact is the coarse resolution of the earth observation data, which might incorporate mixed information from different surfaces and vegetation types, making it difficult to distinguish particular crop types, given that most croplands in Eastern and Southern Africa are small and regularly multi-cropped.
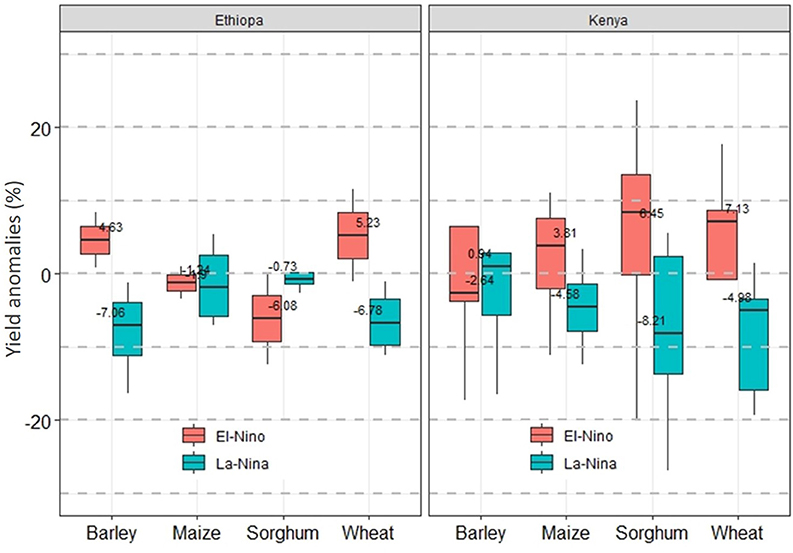
Figure 6. Box plots showing 0, 25, 50, 75, and 100th percentiles, and means (solid line) of yield anomalies for major crops in Eastern Africa during El Niño and La Niña years.
Understanding the ENSO impact on agriculture production is critical for improving the food system's resilience to climate-related shocks over Eastern and Southern Africa. In this study, we evaluated vegetation response to changes in the climate conditioned in eastern and southern Africa. In general, a strong association between ENSO and NDVI was observed, with NDVI typically lagging behind ENSO by zero to 3 months. The magnitude of the correlation indicates the vulnerability of vegetation to ENSO; areas with higher correlation are more susceptible to climate variability caused by ENSO. A strong negative correlation across Southern Africa suggests a substantial decline in the vegetation productivity and, as a result, food insecurity. Our lagged correlation analysis indicates the relationships get stronger during the growing season, which is particularly essential for determining next season's yields. Hence, the NDVI-ENSO correlation is an important estimate of the impact of climate oscillation on overall agricultural productivity.
Previous studies have found a similar pattern of vegetation response between El Niño and La Niña in Eastern and Southern Africa. For example, Anyamba et al. (2018) found a statistically significant relationship between ENSO and NDVI at all lag intervals in both Eastern and Southern Africa for the 2015–2017 period. They also identified NDVI–ENSO north–south correlation pattern while mapping the evolution of NDVI anomalies during the ENSO years 1986–89 and 1997–98 over that region. Philippon et al. (2014) also found the highest correlation between ENSO and NDVI during December–February and lowest during the March–May in the Southern Africa region. However, areas with no significant relationship indicating that ENSO is not the major factor that influences the vegetation response to climate variability. Due to the interplay between global atmospheric and oceanic circulations and their variable regional effects, various factors such as ecological characteristics and land use can play an important role for ENSO impact on vegetation response (Propastin et al., 2010; Hawinkel et al., 2016).
We also analyzed the spatial pattern of vegetation response for the 2015–2017 ENSO cycle, with one of the strongest warm events (El Niño) on record followed by a short and weak cold event (La Niña). Overall, the spatial evolution of vegetation responses showed the expected dipole pattern, with reduced vegetation activity during El Niño 2015–2016 and enhanced vegetation activity subsequent to La Niña 2016–2017 over Southern Africa. The NDVI anomalies revealed stronger drought conditions over South Africa, central Botswana, southern Mozambique, and most of Zimbabwe and southern Mozambique, which resulted in delays in planting and subsequent reductions of maize crop productions. Fortunately, the drought was mitigated by the rain caused by La Niña during the growing season 2016–2017 and led to a record-breaking corn production of 16.4 million metric tons, doubling the previous season (Anyamba et al., 2018). The present approach of the spatial evolution of drought events points out areas that are vulnerable to ENSO-related climate extremes and can be used to improve the capacity of local farmers, politicians, and national governments to respond effectively to ENSO's effects on agriculture.
Our results demonstrated that climate anomalies substantially affect crop yield variability in Eastern and Southern Africa. On average, El Niño shocks are likely to cause a reduction in crop yield in Southern Africa. La Niña episodes, on the other hand, are associated with increased wheat and maize production. Our results show that maize production is more vulnerable to El Niño effects in the South Africa region, with productivity approximates 20% below the country's long-term average. These effects concern Southern Africa, especially where maize is the primary food crop, and about 60% of people in the study area derive their livelihood from maize cultivation. Low productivity of maize, wheat, and sorghum resulting from La Niña condition substantially influences food supply and security of over Eastern Africa. In general, the sign of the impacts of ENSO reported here is consistent with previous studies and have implication for the farmer, government, and commercial entities; however, the magnitude of the effects of ENSO on the yields varies with the analysis methods. For example, Nhamo et al. (2019) reported the positive effects of El Niño on the wheat yields in the Eastern Africa region and the negative impacts of La Niña on the wheat yields in the Southern Africa region. Stige et al. (2006) found a strong association between ENSO and yields of maize over Southern Africa region and production is expected to drop by 27 and 31% in extreme 2015–2016 El Niño event.
Our findings suggest that early predictions can be made about how ENSO will affect the agriculture production and potentially help farmers and others decision maker to mitigate the adverse weather effects on agriculture. It can be accomplished by (1) evaluating different types of irrigation system optimum for the crop types, (2) enhancing the efficiency and ease of maintenance of existing irrigation system, (3) using conservation strategies that minimize runoff and facilitate water infiltration into the soil, and (4) growing crops that are resistant to drought condition. As different crops respond to climatic conditions differently, advanced knowledge of vegetation activity offers information about the productivity of various crop patterns. Individual farmers to identify best cropping patterns can use such knowledge. In addition, governments and non-governmental organizations can be better prepared for potential shortages and advised where to organize strategic staple food reserves.
The ENSO is one of the main factors influencing global climate variability and consequently has a significant effect on agriculture production. Hence, a better understanding of the impact of ENSO is required for identifying how agriculture is vulnerable to these changes, and ultimately to guide the development of strategies for reducing risk in the face of changing climatic conditions. We quantified the impact of a different phase of ENSO on NDVI and major crop yields in Eastern and Southern Africa. Our results confirmed that both regions vegetation conditions were significantly correlated with ENSO and exhibited a clear dipole pattern that reverses between warm and cold ENSO events. The lagged correlation analysis showed a positive correlation between NDVI and root-zone soil moisture, demonstrate the ability of soil moisture to predict vegetation growth with 1–3 months lead-time, which could be used in food security early warning and proper planning and monitoring in water resources and agricultural sectors. The two regions experienced significant but opposite effects; Southern Africa was normally warm, dry, and Eastern Africa was usually cold and wet during El Niño events. During the events in La Niña, the impacts were reversed. Years of strongly positive SST anomaly (El Niño years) were associated with lower than average crop yields but years of negative SST anomalies (“La Niña” years) were associated with higher than average crop yields in Southern Africa. Our results provide implications for farmers, policymakers, and governments, and enable them to take the necessary steps to mitigate the adverse impact and take advantage of favorable ENSO conditions, which is particularly relevant over the food insecurity region of eastern and southern Africa. The spatial map presented here is useful for the identification of vulnerable areas affected by the extreme climate condition. It can be applied in improving the adaptation capability to climate variability and change. Finally, the analyses and methods provided can be applied to other regions around the world to better understand ENSO's local agricultural effects.
Although the study has successfully demonstrated the ENSO impact on agriculture, findings in this study are subject to some limitations. First, we considered all types of ENSO phases while estimating the correlation between ENSO and NDVI, which might cause underestimating of the strength of the correlation areas where vegetation conditions are more (less) sensitive to El Niño and less (more) sensitive to La Niña. For further research, partial correlation analyses are suggested, separately examining the relation of vegetation condition to El Niño and La Niña events. Second, we used NDVI data for vegetation responses, which has a tendency of saturation in densely vegetated areas as well as observed atmospheric interferences related to aerosols and clouds (Zargar et al., 2011). Finally, ENSO effects on the crop yield were carried out for four major crops in the study region due to the availability of data. If more crops were considered in our analysis, the value of ENSO impact to agriculture sector would probably be greater. Despite those limitations, the findings and information highlighted by this study will improve our understanding of the ENSO impact on agriculture in Eastern and Southern Africa.
Publicly available datasets were analyzed in this study. This data can be found here: https://gimms.gsfc.nasa.gov/.
NS, IM, and JB designed the work. NS and IM undertook the data analysis. All authors contributed equally to the final version of the paper.
The NASA Applied Sciences Program supports this work.
NS was employed by the company Science Application International Corporation (SAIC).
The remaining authors declare that the research was conducted in the absence of any commercial or financial relationships that could be construed as a potential conflict of interest.
Abera, T. A., Heiskanen, J., Pellikka, P., and Maeda, E. E. (2018). Rainfall–vegetation interaction regulates temperature anomalies during extreme dry events in the Horn of Africa. Glob. Planet. Change 167, 35–45. doi: 10.1016/j.gloplacha.2018.05.002
AghaKouchak, A. (2015). A multivariate approach for persistence-based drought prediction: Application to the 2010–2011 East Africa drought. J. Hydrol. 526, 127–135. doi: 10.1016/j.jhydrol.2014.09.063
Akpalu, W., Hassan, R. M. and Ringler, C. (2008). Climate variability and maize yield in South Africa. Environment and Production Technology Division. IFPRI Paper, 843.
Alemu, A., DirbaKorecha, and Mohamod, M. (2018). Impacts of various ENSO phases on cereal crop productivity in the upper awash basin, central high land of Ethiopia. Int. J. Res. Stud. Agric. Sci. 4, 36–49. doi: 10.20431/2454-9444.0404002
Anyamba, A., Glennie, E., and Small, J. (2018). Teleconnections and interannual transitions as observed in African vegetation: 2015–2017. Remote Sens.10:1038. doi: 10.3390/rs10071038
Anyamba, A., Tucker, C. J., and Mahoney, R. (2002). From El Niño to La Niña: vegetation response patterns over East and Southern Africa during the 1997–2000 period. J. Clim. 15, 3096–3103. doi: 10.1175/1520-0442(2002)015<3096:FENOTL>2.0.CO;2
Arino, O., Perez, R., Julio, J., Kalogirou, V., Bontemps, S., Defourny, P., et al. (2012). Global Land Cover Map for 2009 (GlobCover 2009). European Space Agency (ESA), Université catholique de Louvain (UCL); PANGAEA. doi: 10.1594/PANGAEA.787668
Asoka, A., and Mishra, V. (2015). Prediction of vegetation anomalies to improve food security and water management in India. Geophys. Res. Lett. 42, 5290–5298. doi: 10.1002/2015GL063991
Ayana, E. K., Ceccato, P., Fisher, J. R., and deFries, R. (2016). Examining the relationship between environmental factors and conflict in pastoralist areas of East Africa. Sci. Total Environ. 557, 601–611. doi: 10.1016/j.scitotenv.2016.03.102
Bastos, A., Ciais, P., Park, T., Zscheischler, J., Yue, C., Barichivich, J., et al. (2017). Was the extreme Northern Hemisphere greening in 2015 predictable? Environ. Res. Lett. 12:044016. doi: 10.1088/1748-9326/aa67b5
Behrenfeld, M. J., Randerson, J. T., McClain, C. R., Feldman, G. C., Los, S. O., Tucker, C. J., et al. (2001). Biospheric primary production during an ENSO transition. Science 291, 2594–2597. doi: 10.1126/science.1055071
Bolten, J. D., and Crow, W. T. (2012). Improved prediction of quasi-global vegetation conditions using remotely-sensed surface soil moisture. Geophys. Res. Lett. 39:19406. doi: 10.1029/2012GL053470
Bolten, J. D., Crow, W. T., Zhan, X., Jackson, T. J., and Reynolds, C. A. (2010). Evaluating the utility of remotely sensed soil moisture retrievals for operational agricultural drought monitoring. Selected topics in applied earth observations and remote sensing. IEEE J. 3, 57–66. doi: 10.1109/JSTARS.2009.2037163
Bowden, J. H., and Semazzi, F. H. (2007). Empirical analysis of intraseasonal climate variability over the greater Horn of Africa. J. Clim 20, 5715–5731. doi: 10.1175/2007JCLI1587.1
Center, C. P. (2011). Cold and warm episodes by season. Consultado el 12. Available online at: https://origin.cpc.ncep.noaa.gov/products/analysis_monitoring/ensostuff/ONI_v5.php (accessed on October 2019).
de Beurs, K. M., and Henebry, G. M. (2008). Northern annular mode effects on the land surface phenologies of Northern Eurasia. J. Climate 21, 4257–4279. doi: 10.1175/2008JCLI2074.1
Du, L., Tian, Q., Yu, T., Meng, Q., Jancso, T., Udvardy, P., et al. (2013). A comprehensive drought monitoring method integrating MODIS and TRMM data. Int. J. Appl. Earth Observ. Geoinform. 23, 245–253. doi: 10.1016/j.jag.2012.09.010
Erasmi, S., Propastin, P., Kappas, M., and Panferov, O. (2009). Spatial patterns of NDVI variation over indonesia and their relationship to ENSO warm events during the period 1982–2006. J. Clim. 22, 6612–6623. doi: 10.1175/2009JCLI2460.1
Food and Agriculture Organization of the United Nations (2016). FAOSTAT Statistical Database. Rome: FAO.
Funk, C., Peterson, P., Landsfeld, M., Pedreros, D., Verdin, J., Shukla, S., et al. (2015). The climate hazards infrared precipitation with stations—a new environmental record for monitoring extremes. Sci. Data 2:150066. doi: 10.1038/sdata.2015.66
Glennie, E., and Anyamba, A. (2018). Midwest agriculture and ENSO: a comparison of AVHRR NDVI3g data and crop yields in the United States Corn Belt from 1982 to 2014. Int. J. Appl. Earth Observ. Geoinform. 68, 180–188. doi: 10.1016/j.jag.2017.12.011
Guimarães Nobre, G., Muis, S., Veldkamp, T. I. E., and Ward, P. J. (2019). Achieving the reduction of disaster risk by better predicting impacts of El Niño and La Niña. Prog. Disaster Sci. 2:100022. doi: 10.1016/j.pdisas.2019.100022
Hanley, D. E., Bourassa, M. A., O'Brien, J. J., Smith, S. R., and Spade, E. R. (2003). A quantitative evaluation of ENSO indices. J. Clim. 16, 1249–1258. doi: 10.1175/1520-0442(2003)16<1249:AQEOEI>2.0.CO;2
Hansen, J. W., Jones, J. W., Kiker, C. F., and Hodges, A. W. (1999). El Niño–Southern oscillation impacts on winter vegetable production in florida. J. Clim. 12, 92–102. doi: 10.1175/1520-0442-12.1.92
Hawinkel, P., Thiery, W., Lhermitte, S., Swinnen, E., Verbist, B., van Orshoven, J., et al. (2016). Vegetation response to precipitation variability in East Africa controlled by biogeographical factors. J. Geophys. Res. Biogeosci. 121, 2422–2444. doi: 10.1002/2016JG003436
Heino, M., Guillaume, J. H. A., Müller, C., Iizumi, T., and Kummu, M. (2019). A multi-model analysis of teleconnected crop yield variability in a range of cropping systems. Earth Syst. Dyn. Discuss. 2019, 1–25. doi: 10.5194/esd-2019-8
Iizumi, T., Luo, J.-J., Challinor, A. J., Sakurai, G., Yokozawa, M., Sakuma, H., et al. (2014). Impacts of El Niño Southern Oscillation on the global yields of major crops. Nat. Commun. 5:3712. doi: 10.1038/ncomms4712
Kogan, F. N. (2000). Satellite-observed sensitivity of world land ecosystems to El Nino/La Nina. Remote Sens. Environ. 74, 445–462. doi: 10.1016/S0034-4257(00)00137-1
Kolusu, S. R., Shamsudduha, M., Todd, M. C., Taylor, R. G., Seddon, D., Kashaigili, J. J., et al. (2019). The El Niño event of 2015–2016: climate anomalies and their impact on groundwater resources in East and Southern Africa. Hydrol. Earth Syst. Sci. 23, 1751–1762. doi: 10.5194/hess-23-1751-2019
Lawal, S., Lennard, C., Jack, C., Wolski, P., Hewitson, B., and Abiodun, B. (2019). The observed and model-simulated response of southern African vegetation to drought. Agric. Forest Meteorol. 279:107698. doi: 10.1016/j.agrformet.2019.107698
Mladenova, I. E., Bolten, J. D., Crow, W. T., Sazib, N., Cosh, M. H., Tucker, C. J., et al. (2019). Evaluating the operational application of SMAP for global agricultural drought monitoring. IEEE J. Select. Top. Appl. Earth Observ. Remote Sens. 12, 3387–3397. doi: 10.1109/JSTARS.2019.2923555
Mulenga, H., Rouault, M., and Reason, C. (2003). Dry summers over northeastern South Africa and associated circulation anomalies. Clim. Res. 25, 29–41. doi: 10.3354/cr025029
Nagai, S., Ichii, K., and Morimoto, H. (2007). Interannual variations in vegetation activities and climate variability caused by ENSO in tropical rainforests. Int. J. Remote Sens. 28, 1285–1297. doi: 10.1080/01431160600904972
Nhamo, L., Matchaya, G., Mabhaudhi, T., Nhlengethwa, S., Nhemachena, C., and Mpandeli, S. (2019). Cereal production trends under climate change: impacts and adaptation strategies in Southern Africa. Agriculture 9:30. doi: 10.3390/agriculture9020030
Peters, A. J., Ji, L., and Walter-Shea, E. (2003). Southeastern U.S. vegetation response to ENSO events (1989–1999). Clim. Change 60, 175–188. doi: 10.1023/A:1026081615868
Philippon, N., Martiny, N., Camberlin, P., Hoffman, M. T., and Gond, V. (2014). Timing and patterns of the ENSO signal in Africa over the last 30 years: insights from normalized difference vegetation index data. J. Clim. 27, 2509–2532. doi: 10.1175/JCLI-D-13-00365.1
Propastin, P., Fotso, L., and Kappas, M. (2010). Assessment of vegetation vulnerability to ENSO warm events over Africa. Int. J. Appl. Earth Observ. Geoinform. 12, S83–S89. doi: 10.1016/j.jag.2009.10.007
Qu, C., Hao, X., and Qu, J. J. (2019). Monitoring extreme agricultural drought over the horn of africa (hoa) using remote sensing measurements. Remote Sens. 11:902. doi: 10.3390/rs11080902
Ratnam, J. V., Behera, S. K., Masumoto, Y., and Yamagata, T. (2014). Remote effects of El Niño and modoki events on the austral summer precipitation of Southern Africa. J. Clim. 27, 3802–3815. doi: 10.1175/JCLI-D-13-00431.1
Ray, D. K., Gerber, J. S., MacDonald, G. K., and West, P. C. (2015). Climate variation explains a third of global crop yield variability. Nat. Commun. 6:5989. doi: 10.1038/ncomms6989
Rojas, O., Rembold, F., Royer, A., and Negre, T. (2005). Real-time agrometeorological crop yield monitoring in Eastern Africa. Agron. Sustain. Dev. 25, 63–77. doi: 10.1051/agro:2004056
Rosenzweig, C., Iglesias, A., Yang, X. B., Epstein, P. R., and Chivian, E. (2001). Climate change and extreme weather events; implications for food production, plant diseases, and pests. Glob. Change Hum. Health 2, 90–104. doi: 10.1023/A:1015086831467
Sazib, N., Mladenova, I., and Bolten, J. (2018). Leveraging the google earth engine for drought assessment using global soil moisture data. Remote Sens. 10:1265. doi: 10.3390/rs10081265
Sellers, P., Dickinson, R., Randall, D., Betts, A., Hall, F., Berry, J., et al. (1997). Modeling the exchanges of energy, water, and carbon between continents and the atmosphere. Science 275, 502–509. doi: 10.1126/science.275.5299.502
Shuai, J., Zhang, Z., Tao, F., and Shi, P. (2016). How ENSO affects maize yields in China: understanding the impact mechanisms using a process-based crop model. Int. J. Climatol. 36, 424–438. doi: 10.1002/joc.4360
Stige, L. C., Stave, J., Chan, K.-S., Ciannelli, L., Pettorelli, N., Glantz, M., et al. (2006). The effect of climate variation on agro-pastoral production in Africa. Proc. Natl. Acad. Sci. U.S.A. 103:3049. doi: 10.1073/pnas.0600057103
Tucker, C. J. (1979). Red and photographic infrared linear combinations for monitoring vegetation. Remote Sens. Environ. 8, 127–150. doi: 10.1016/0034-4257(79)90013-0
Tucker, C. J., Pinzon, J. E., Brown, M. E., Slayback, D. A., Pak, E. W., Mahoney, R., et al. (2005). An extended AVHRR 8-km NDVI dataset compatible with MODIS and SPOT vegetation NDVI data. Int. J. Remote Sens. 26, 4485–4498. doi: 10.1080/01431160500168686
Wang, X., Xie, H., Guan, H., and Zhou, X. (2007). Different responses of MODIS-derived NDVI to root-zone soil moisture in semi-arid and humid regions. J. Hydrol. 340, 12–24. doi: 10.1016/j.jhydrol.2007.03.022
Welhouse, L. J., Lazzara, M. A., Keller, L. M., Tripoli, G. J., and Hitchman, M. H. (2016). Composite analysis of the effects of ENSO events on Antarctica. J. Climate 29, 1797–1808. doi: 10.1175/JCLI-D-15-0108.1
Wenhaji Ndomeni, C., Cattani, E., Merino, A., and Levizzani, V. (2018). An observational study of the variability of East African rainfall with respect to sea surface temperature and soil moisture. Quart. J. R Meteorol. Soc. 144, 384–404. doi: 10.1002/qj.3255
Winkler, K., Gessner, U., and Hochschild, V. (2017). Identifying droughts affecting agriculture in Africa based on remote sensing time series between 2000–2016: rainfall anomalies and vegetation condition in the context of ENSO. Remote Sens. 9:831. doi: 10.3390/rs9080831
Keywords: agriculture, soil moisture, ENSO, food security, earth observation
Citation: Sazib N, Mladenova lE and Bolten JD (2020) Assessing the Impact of ENSO on Agriculture Over Africa Using Earth Observation Data. Front. Sustain. Food Syst. 4:509914. doi: 10.3389/fsufs.2020.509914
Received: 04 November 2019; Accepted: 15 September 2020;
Published: 23 October 2020.
Edited by:
Molly E. Brown, University of Maryland, College Park, United StatesReviewed by:
Christopher Edward Latimer, The Nature Conservancy, United StatesCopyright © 2020 Sazib, Mladenova and Bolten. This is an open-access article distributed under the terms of the Creative Commons Attribution License (CC BY). The use, distribution or reproduction in other forums is permitted, provided the original author(s) and the copyright owner(s) are credited and that the original publication in this journal is cited, in accordance with accepted academic practice. No use, distribution or reproduction is permitted which does not comply with these terms.
*Correspondence: Nazmus Sazib, bmF6bXVzLnMuc2F6aWJAbmFzYS5nb3Y=
Disclaimer: All claims expressed in this article are solely those of the authors and do not necessarily represent those of their affiliated organizations, or those of the publisher, the editors and the reviewers. Any product that may be evaluated in this article or claim that may be made by its manufacturer is not guaranteed or endorsed by the publisher.
Research integrity at Frontiers
Learn more about the work of our research integrity team to safeguard the quality of each article we publish.