Abstract
Agricultural production estimate represents a key element in food security analysis, but before the agricultural statistics services process and release the data some precious early warning time is lost. While many remote sensing derived yield estimation methods are used operationally we're still in search of a robust remote sensing based cropped area estimate. ESA-CCI (European Space Agency–Climate Change Initiative) released in late 2016 the S2 prototype Land Cover map at 20 m for Africa the first high resolution product of its kind. The objective of the current study is to evaluate how well the 20-m ESA-CCI S2 prototype LC represents cropland; in case the results turn out satisfactory the cropland class could be used as a crop mask that could be used along with yield estimate to assess crop production. The assessment method consisted of (1) selecting six equal size polygons so that the Sahelian and Sudanian zones of West Africa are represented at each of the three basins of the Sahel (Western, Central and Eastern), (2) generating four hundred dots randomly overlaid on the sample polygon (3) using Sentinel 2A 10 m or Google Earth images as ground truth. A dot count is then obtained for each one of the map being assessed and the reference. The process is repeated 10 times bringing the total number of dots used to four thousand for each of the 6 sample polygons. The number of classes is reduced to two (cropland and other). Binary confusion matrices are build and the accuracy, the precision and the sensitivity or recall calculated. Since our main goal is to see how good the classification of cropland is, the analysis focuses on the precision and the recall. Values for both indicators are almost similar for the Sudanian zone, but significantly different for the Sahelian zone, where the higher values of the recall are not an indication of cropland classification performance but rather the result of the relatively small proportion of the actual cropland dots. Therefore, the precision remains here the privileged cropland classification performance indicator. Analysis of the precision indicates that the S2 prototype LC cropland in the Sahelian zone is <3% correct in East Sahel, <7% in West Sahel and about a third of the time correct for the Center Sahelian. This is easily explained by the fact that the S2 prototype LC has mistaken the sand dunes and degraded land that makes up a significant part of the cropland. Even in the Sudanian zone where the analysis shows a better cropland classification performance, the highest precision indicates that the cropland classification is incorrect for a little over 28% of cases. Therefore, the ESA-CCI S2 prototype land cover map can't be used as a crop mask.
Introduction
At a global scale changes in Land Use and Land Cover close monitoring is extremely important considering their intricate relationship with global change and global warming. Such changes have major implications for sustainable development and livelihood systems as they affect the biogeochemical cycles of the planet Earth resulting in significant changes in the atmospheric greenhouse and other trace gases concentrations (Turner et al., 1995).
The population of our planet is steadily growing and Africa, where the population is expected to double that of 2016 by the year 2035 (Bello-Schünemann, 2017), has the highest growth rate. West Africa's population accounts for 30% of Africa's population and has increased by about five-folds from 1950 to 2015 and is expected to increase from a little above 367 million to about 570 million by 2035. Such a rapid demographic growth has been partially the cause of poverty and lack of economic opportunities, which has in turn resulted in an increased pressure on the natural resources.
This high population growth in West Africa results in increased demand for food to meet the needs. Agriculture has been the main driver of the economy in a region where opportunities are limited. Therefore, a higher demand in food has led to an expansion of cropland. A recent Land Use-Land Cover collaborative study between the Inter State Committee for Drought Control CILSS1 and USGS/EROS2 (CILSS, 2016) revealed that agricultural expansion accounts for most of the changes that occurred from 1975 to 2013. During this period cropland doubled to reach a total of 1,100,000 km2 or 22.4% of the land surface. According to Hollinger and Staatz (2015) agricultural growth in West Africa over the 1980–2009 period has been overwhelmingly driven by area expansion. They showed that during this period area planted to cereal crops increased by 3.9% whereas yield increased by only 1.2%. With such drastic agricultural land expansion fallow technique is practically overlooked; therefore, cropland and cropped area are almost synonymous.
Changes in cropland represent a good indicator in many environmental issues such as climate change, deforestation, desertification, land degradation, etc. Pollution from the use of chemical agricultural input has yet to reach disturbing levels. However, the rapid increase of cropland has a compounding effect on the land degradation resulting from global change and global warming problems. Accurate estimate of cropland and particularly cropped area and monitoring its changes is also extremely important in food security analysis.
Production estimation is an important part of the activities of the growing period monitoring and food security watch systems. Production is obtained from yield and cropped area estimates both obtained through the agricultural statistics surveys conducted annually by the ministries of agriculture in the region. Yield estimation is relatively easy, however, the estimation of cropped area, is a real challenge. It involves intensive labor efforts as the enumerators working under precarious conditions with no incentive measures have to identify and measure all sampled farmers' parcels. To ensure the data quality in such conditions an efficient control system is in order, which is impossible to have given the limited resources allocated to the agricultural surveys. Data collected by the agricultural statistics in the region are, therefore, doubtful.
The use of remote sensing products to estimate cropped area represents a cost effective alternative that has been receiving increased attention. A collaborative effort between CILSS and USGS/EROS has resulted in a fairly accurate coarse resolution (2-km) land use land cover map for West Africa region (CILSS, 2016). With the increased availability of moderate and high resolution remote sensing data land cover mapping has become less of a challenge and many studies have been conducted to address the issue. A significant improvement in accuracy has been achieved (Feng et al., 2018), however, the challenge partly remains as comparisons show low agreement over a large part of the African continent (Xu et al., 2018).
A prototype of high resolution land cover map known as the “S2 prototype LC map at 20 m of Africa 2016” has been developed and released by the ESA-CCI (European Space Agency—Climate Change Initiative) Land Cover team. Its high resolution (20-m) makes it a good potential candidate for use as crop mask in the Sahelian and Sudanian zones where agricultural production is closely linked to food security and livelihood of most rural populations. An internal evaluation of the product has been conducted in four African countries (LACO-Wiki, 2019), but did not include any Sahelian country. This study is an effort to evaluate this LC map with a particular focus on cropland, which is of primary interest to FEWS NET (Famine Early Warning System Network). The legend includes 10 classes, however, for the interest of this study we considered a cropland class and put all the other 9 classes in one class named other. Given the size of the region only few polygons thought to represent a different agro-ecological zone each were picked and analyzed.
The Material and Evaluation Method
The ESA-CCI S2 prototype LC map of which six sample polygons have been picked is the land cover image subject of this evaluation study, whereas Sentinel 2A 10 m or Google Earth images have been used as the reference. The remote sensing techniques in ArcMap environment (Parece et al., 2017) have been used to create the random points, make the extractions at dot locations from S2 prototype LC map and project the same points over Sentinel 2A images for validation.
Six confusion matrices have been created one for each of the sample polygons using the GIS analysis results. Accuracy, precision, sensitivity or recall and Fβ measure (Ukrainski, 2016; Narkhede, 2018; Tufféry, 2007; Raschka and Mirjalili, 2017) are calculated and analyzed to evaluate the S2 prototype LC map classification.
According the CCI land cover team (https://www.esa-landcover-cci.org/?q=node/187) the high resolution land cover 20 m map over Africa was built using Sentinel-2A observations of December 2015 to December 2016 period and its coordinate reference system is based on the World Geodetic System 84 (WGS84). This classification in which 10 generic classes (“trees cover areas,” “shrubs cover areas,” “grassland,” “cropland,” “vegetation aquatic or regularly flooded,” “lichen and mosses/sparse vegetation,” “bare areas,” “built up areas,” “snow and/or ice,” and “open water”) were identified, was the result of a combination of the Random Forest (RF) and Machine Learning (ML) classification algorithms outputs.
Sentinel-2A images for the 21 April−29 May 2017 period considered as the ground truth (Iwao et al., 2006; Cavur et al., 2019) were used to categorize the dots as “cropland” or “other” classes through visual interpretation. In a very few cases when Sentinel image quality was not good enough to allow for a clear cut decision of whether the dot is over a cropland or not Google Earth imagery is used instead.
A region-wide evaluation of the product over West Africa would be ideal, however, the required labor to perform it was prohibitive. Therefore, the study area was reduced to six 78,622 km2 large rectangles picked to represent the different agro-climatological zones of the region (Figure 1) and also to account for the eventual differences that might exist between the western, central and eastern parts of the region (Brogaard and Olafsdottir, 1997). The evaluation method consisted of considering each one of these 6 sample polygons as the constraining feature to generate a random validation point shapefile using ArcGIS tool “Create Random Points.” Input to the dialog box includes: the constraining feature or extent within which the random validation point sample was to be created, the number of dots, the minimum allowed distance between the dots and the output file name. The minimum number of dots for one of these constraining features is calculated using the formula (Giezendanner, 2012; StataCorp, 2017) for a confidence level of 95% with t = 1.96 and e = 0.05. The proportion of cropland is taken to be equal to half of the rest of the classes (p = 0.5) on the total area of West Africa. With these values the formula above gives n=384 points that is rounded to (400 points) the nearest hundred.
Figure 1
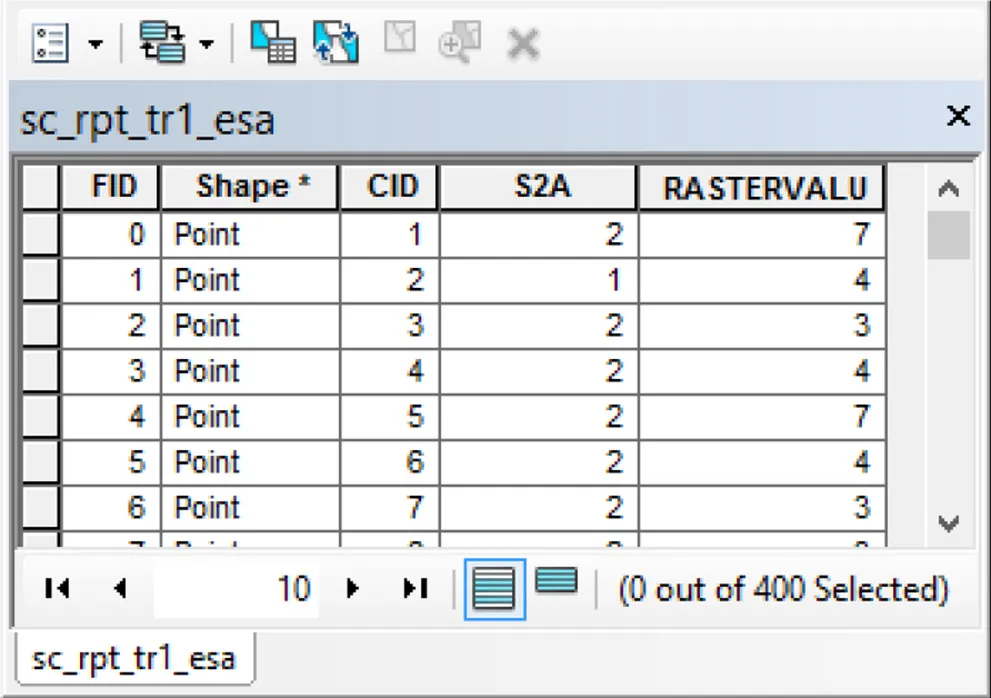
First, the sample dot shapefile is overlaid on the Sentinel 2A image (Figure 2), a new field created (Table 1) and filled with 1s for dots that are over a cropland and 2s for dots that are over any of the other land cover classes based on visual interpretation.
Figure 2
Table 1
 |
|---|
Attribute table the shapefile with LC classes.
The shapefile is then overlaid on the ESA-CCI S2 prototype LC geotiff map to extract the class values at the dot locations using the ArcGIS “Extract Values to Points” tool. This tool automatically creates a field in the random validation point shapefile attribute table to which it assigns the name RASTERVALU and report the class value at each dot location (Table 1). The process is repeated 10 times which brings the total number of dots to 4,000 for each one of the sample polygons. In each time the following four queries are applied to the attribute table content using ArcGIS:
Cropland in both Sentinel 2A and ESA-CCI S2
Cropland in Sentinel 2A and Other ESA-CCI S2
Other in Sentinel 2A and Cropland in ESA-CCI S2
Other in both.
Query results are reported in Table 2, the last row of which is used to build the confusion matrix for the 10 drawings.
Table 2
| Drawing | S2A = crop S2 = crop | S2A = crop S2 = other | S2A = other S2 = crop | S2A = other S2 = other |
|---|---|---|---|---|
| 1 | 37 | 5 | 67 | 291 |
| 2 | 28 | 7 | 84 | 281 |
| 3 | 27 | 3 | 70 | 300 |
| 4 | 22 | 5 | 81 | 292 |
| 5 | 45 | 7 | 56 | 292 |
| 6 | 51 | 12 | 39 | 298 |
| 7 | 39 | 8 | 56 | 297 |
| 8 | 40 | 1 | 65 | 294 |
| 9 | 24 | 11 | 57 | 308 |
| 10 | 20 | 8 | 79 | 293 |
| Total | 333 | 67 | 654 | 2,946 |
Query results for Center Sahel.
The accuracy, the precision, the sensitivity or recall and Fβ measure are calculated from the confusion matrices using the following formulae based on Table 3 symbolic entries of a typical binary confusion matrix (Géron, 2017).
Accuracy = (TP+TN)/N
Precision = TP/(TP+FP)
Sensitivity or Recall = TP/(TP+FN)
Fβ = Precision*Recall/((1- β)*Precision + β*Recall)
Table 3
| ESA-CCI S2 | Total | |||
|---|---|---|---|---|
| Other | Cropland | |||
| Sentinel 2A | Other | True Negative (TN) | False Positive (FP) | TN+FP |
| Cropland | False Negative (FN) | True Positive (TP) | FN+TP | |
| Total | TN+FN | FP+TP | N = TP+FP+TN+FN | |
Conventional naming of typical binary confusion matrix entries.
The accuracy gives the proportion of correct classification from all the random dots; therefore, it could be considered as a measure of how good is the S2 prototype LC map classification. Whereas, the precision gives the proportion of correct cropland classifications from the dots that are classified as cropland. It is a measure of how correct is this Land Cover map cropland classification. In other words of the number of dots that fall over a space classified as cropland how many are on actual cropland. Finally, the sensitivity or recall gives the proportion of correct cropland classifications from the dots that are actually cropland. It is a measure of how well the actual cropland is classified as cropland by the S2 prototype LC map. In clear how many of the dots that are actually cropland are correctly classified as cropland. Finally, Fβ measure the weighted harmonic mean of the precision and recall is calculated for β= 0.75 by which precision is given three times as much weight as recall and used to compare the classification performance at the different sample polygons. The various indicators are calculated and the results reported in Table 5.
Results and Discussion
The same process leading to a confusion matrix, combining Tables 2, 3 is repeated for all the 6 sample areas and the resulting matrices are in Table 4.
Table 4
| West Sahelian | Center Sahelian | East Sahelian | ||||||||
|---|---|---|---|---|---|---|---|---|---|---|
| ESA-CCI S2 | ESA-CCI S2 | ESA-CCI S2 | ||||||||
| Other | Crop | Total | Other | Crop | Total | Other | Crop | Total | ||
| (A) | ||||||||||
| Sentinel 2A | Other | 1,605 | 2,206 | 3,811 | 2,946 | 654 | 3,600 | 1,507 | 2,408 | 3,915 |
| Crop | 32 | 157 | 189 | 67 | 333 | 400 | 15 | 68 | 83 | |
| Total | 1,637 | 2,363 | 4,000 | 3,013 | 987 | 4,000 | 1,522 | 2,476 | 3,998 | |
| (B) | ||||||||||
| Sentinel 2A | Other | 3,727 | 78 | 3,805 | 2,318 | 402 | 2,720 | 3,573 | 148 | 3,721 |
| Crop | 74 | 121 | 195 | 267 | 1,013 | 1,280 | 90 | 189 | 279 | |
| Total | 3,801 | 199 | 4,000 | 2,585 | 1,415 | 4,000 | 3,663 | 337 | 4,000 | |
Confusion matrices for (A) Sahelian (B) Sudanian sample polygons.
The accuracy values are quite high for the Center Sahelian (0.8198), Center Sudanian (0.8328), the East Sudanian (0.9405), and the West Sudanian with the highest value (0.9620). They are lowest for East Sahel and West Sahel with 0.3939 and 0.4405, respectively. This basically means the ESA-CCI S2 LC classification performs better in the Sudanian zone than it does in the Sahelian zone. However, it should be noted that the class “cropland” represents a small proportion of the total based on dot number. It is <10% for all polygons at the exception of Center Sudanian where it is 32%. Because of the disproportionate size of the class “other,” accuracy is not a good classification performance indicator; therefore, it is necessary to continue the analysis with other indicators.
The precision values (Table 5) confirm a better performance of the classification in the Sudanian zone where the West Sudanian, Center Sudanian, and East Sudanian have precision values of 0.608, 0.716, and 0.561, respectively. It's particularly bad for East Sahel and West Sahel with a precision of 0.0275 and 0.0664, respectively. This means that the classification of cropland is <3% correct in East Sahel and <7% in West Sahel. Even in Center Sahel where precision is the highest, cropland classification is only correct in about 1 out of 3 cases. Such a bad performance is easily explained by the fact that this ESA-CCI S2 prototype classification mistakes the sand dunes that are present in the northern part of the Sahelian zone for cropland. The bad land cover mapping of the Sahel is in agreement with previous findings (Xiong et al., 2017; Xu et al., 2018). Xu et al. (2018) compared three previous study results found the Sahel among the region with the highest uncertainty. Also cropland computed by Xiong et al. (2017) was found to largely underestimate and a look at the map giving Niger almost cropland less is another indication that the Sahel the worst performance place.
Table 5
| Accuracy | Precision | Recall or sensitivity | Fβ (β = 0.5) | Fβ (β = 0.75) | |
|---|---|---|---|---|---|
| West Sahelian | 0.4405 | 0.0664 | 0.8307 | 0.1230 | 0.0863 |
| Center Sahelian | 0.8198 | 0.3374 | 0.8325 | 0.4802 | 0.3963 |
| East Sahelian | 0.3939 | 0.0275 | 0.8193 | 0.0531 | 0.0362 |
| West Sudanian | 0.962 | 0.608 | 0.6205 | 0.6142 | 0.6111 |
| Center Sudanian | 0.8328 | 0.7159 | 0.7914 | 0.7518 | 0.7334 |
| East Sudanian | 0.9405 | 0.5608 | 0.6774 | 0.6136 | 0.5860 |
Calculated classification performance indicators.
Center Sahel has 400 dots of actual cropland, the highest in the Sahelian zone for 189 for West Sahel and only 83 for East Sahel. The relative better performance of the classification for Center Sahel is explained by the higher proportion of actual cropland and other characteristics that are particular to this area. Throughout West Africa transhumant nomad herders remain stationed in the northern part of the Sahel, including West Sahel and East Sahel areas, that becomes a vast pasture land with adequate water resources and no insects harmful to livestock during the rainy season. As soon as the rainy season ends and water resources become scarce they move southward during the dry season, starting at the end of crop harvest, in search for better pasture and water availability. The only exception is the Center Sahel where the nomadic livestock remains stationed during the dry season and move further north during the rainy season. This way areas with manure enriched soil suitable for cropping are left behind during the rainy season, which encourages farming activities.
The recall or sensitivity touches another aspect of the classification performance that of looking at how correct is the classification of the actual cropland. The values are quite high particularly for the Sahelian zone (Table 5). However, this is not necessarily an indication of classification performance. The low precision values indicate that the cropland classification has been mostly incorrect. Since the actual cropland proportion with respect to the total samples of other classes is very small, even a small proportion of correctly classified values could result in high values of the sensitivity. Therefore, the analysis of the precision is sufficient to reach a good conclusion.
This is too bad of a performance, because even in the best case of the Sudanian zone the best precision indicate that the cropland classification is only correct for a little over 71% of cases, meaning that in a little over 28% of cases the cropland classification is incorrect. Therefore, this map can't be used as a crop mask.
A combination of the precision and recall through Fβ with β = 0.75 to give three times as much weight to the precision provides results that are almost similar to the precision. It also allows comparison of the ESA-CCI S2 prototype LC map cropland classification performance over the different polygons.
East Sahel polygon is considered for comparison of the current study with previous but recent land cover classifications. Cropland is found to represent up to 60.5% of the total polygon area according to ESA-CCI S2 prototype LC map (Figure 3, left panel), whereas (CILSS, 2016) findings indicate this class represents 7.04% (Figure 3, right panel) and only about 2% identified as cropland based on Sentinel 2A. Despite its coarse resolution, CILSS-USGS/EROS (CILSS, 2016) LULC classification is, therefore, a lot closer to Sentinel 2A cropland (Figure 3, left panel pink dots). This means ESA-CCI S2 prototype LC exaggeratedly overestimates cropland in the Sahelian zone and particularly in East Sahel.
Figure 3
The ESA-CCI S2 prototype LC map internal validation also took place as part of the CrowdVal project in four African countries among including Cote d'Ivoire a West African country for which the overall accuracy was found to be 47%. All of the ESA-CCI S2 prototype land cover classes have been used it this validation whereas in our study we got only two classes “cropland” and “other.” Therefore, results from these two studies don't lend themselves to fair comparison. However, the simultaneous participation of many workshop participants under the supervision of two experts, the use of in situ land cover data and geo-tagged photographs are all strengths of the internal validation. Therefore, this internal validation should be extended to the Sahelian countries and particularly Chad where the 20 m ESA-CCI S2 prototype LC shows the worst results.
Conclusion
The ESA-CCI S2 prototype 20 m LC classification is assessed over West Africa using Sentinel 2A 10 m as the reference. The main objective is to see whether the cropland classification part is good enough to be used as a crop mask in harvest assessment or not. A sample of 6 polygons are picked to represent the Sahelian and Sudanian zone in each one of the western, central and eastern market and trade basins.
Random validation point samples are created and overlaid on the sample polygons of the map to be assessed and the reference. Over each of ESA-CCI S2 prototype and the reference map a count is made of the dots that fall over cropland and those that fall over the other classes pulled together into one class named other. Queries were used to get the number of dots that fall over cropland on both maps, the ones that are over cropland in one and over other class in the other and vice versa and the ones over the other class on both. Confusion matrices are made out of these and the accuracy, precision, recall and F measure are calculated and used to assess the ESA-CCI S2 performance on cropland classification.
Results show that the ESA-CCI S2 prototype 20 m LC map classification performs better over the Sudanian zone than it does over the Sahelian zone. Precision, which is the most relevant indicator in our context show very poor performance of the cropland classification in the Sahel: <3% correct in East Sahel and <7% correct for West Sahel. It does better in Center Sahel where it is correct in about one out of 3 cases. In the best case of the Sudanian zone the cropland classification is correct in a little over 71% of the time. This is relatively good, but still too poor of a performance to consider using the ESA-CCI S2 prototype LC map as a crop mask in harvest assessments.
Statements
Data availability statement
Publicly available datasets were analyzed in this study. This data can be found here: http://2016africalandcover20m.esrin.esa.int/download.php.
Author contributions
AA have conceived the project, participated in counting and classification of the dots, writing up the results, and sometimes translating the co-authors contributions. IK has carried out all GIS related operations such as using ArcGIS to generate the dots, participated in the dot counting and classifying, and generated some tables and the figures. MK has helped with the required dot number for achieving a 95% confidence level and has been in charge of the statistical processing. All authors contributed to the article and approved the submitted version.
Conflict of interest
The authors declare that the research was conducted in the absence of any commercial or financial relationships that could be construed as a potential conflict of interest.
Footnotes
1.^CILSS – Comité Inter-Etats de Lutte Contre la Sécheresse au Sahel.
2.^USGS/EROS – United States Geological Survey/Earth Resources Observation and Science.
References
1
Bello-SchünemannJ. (2017). Africa's Population Boom: Burden or Opportunity? The Broker Available online at: http://www.thebrokeronline.eu/Blogs/Sahel-Watch-a-living-analysis-of-the-conflict-in-Mali/Population-boom-in-West-Africa-burden-or-opportunity.
2
BrogaardS.OlafsdottirR. (1997). Ground-truths or Ground-lies?: Environmental Sampling for Remotesensing Application Exemplified by Vegetation Cover Data. (Lund electronic reports in physical geography; Vol. 1). Department of Physical Geography, Lund University. Available online at: lup.lub.lu.se/search/ws/files/4487884/4173478.pdf
3
CavurM.DuzgunH. S.KemecS.DemirkanD. C. (2019). Land Use and Land Cover Classification of Sentinel 2-A: St Petersburg Case Study. Available online at: https://www.int-arch-photogramm-remote-sens-spatial-inf-sci.net/XLII-1-W2/13/2019/isprs-archives-XLII-1-W2-13-2019.pdf
4
CILSS (2016). Landscapes of West Africa – A Window on a Changing World. Garretson, SD: U.S. Geological Survey EROS.
5
FengD. L.YuL.ZhaoY.ChengY.XuY.LiC.et al. (2018). A multiple dataset approach for 30-m resolution land cover mapping: a case study of continental Africa. Int. J. Remote Sens.39:12. 10.1080/01431161.2018.1452073
6
GéronA. (2017). Hands-on Machine Learning With Scikit-Learn and Tensorflow: Concepts, Tools, and Techniques to Build Intelligent Systems. Sebastopol, CA: O'REILLY.
7
GiezendannerF. D. (2012). Taille d'un échantillon aléatoire et marge d'erreur. http://icp.ge.ch/sem/cms-spip/spip.php?article1641.
8
HollingerF.StaatzJ. M. (2015). Agricultural Growth in West Africa. Market and Policy Drivers. Paris: FAO, African Development Bank, ECOWAS. Pobrano pazdziernik.
9
IwaoK.NishidaK.YamagataY. (2006). Training Scheme for Land-Cover Mapsvalidation by Ground-Truth. Available online at: https://www.isprs.org/proceedings/XXXVI/part6/157_XXXVI-part6.pdf.
10
LACO-Wiki (2019). Accuracy Assessment of 20 m Land Cover Map of Africa, Deliverable 4. Final Report of the Crowdval Project Using Crowdsourcing and Innovative Approaches to Evaluate and Validate ESA's Land Cover Products.
11
NarkhedeS. (2018). Understanding Confusion Matrix. Towards Data Science. Available online at: https://towardsdatascience.com/understanding-confusion-matrix-a9ad42dcfd62 (accessed September 16, 2019).
12
PareceT.CampbellJ. B.McGeeJ. (2017). Remote Sensing in an ArcMap Environment, 2nd Edition. Available online at: https://www.abebooks.com/9781549796111/Remote-Sensing-Analysis-ArcMap-Environment-1549796119/plp.
13
RaschkaS.MirjaliliV. (2017). Python Machine Learning: Machine Learning and Deep Learning with Python, Scikit-Learn and Tensorflow, Packt, Second edition.
14
StataCorp (2017). Stata: Release 15. Statistical Software. College Station, TX: StataCorp LLC.
15
TufféryS. (2007). Data Mining et statistique décisionnelle: L'intelligence des données, Editions TECHNIP, Nouvelle édition revue et augmentée.
16
Turner IIB. L.SkoleD.SandersonS.FischerG.FrescoL.LeemansR. (1995). Land-Use and Land-Cover Change: Science/Research Plan. Stockholm: International Geosphere-Biosphere Programme.
17
UkrainskiP. (2016). Classification Accuracy Assessment, Confusion Matrix Method. SCGIS, Remote Sensing. Available online at: http://www.50northspatial.org/classification-accuracy-assessment-confusion-matrix-method/ (accessed October 03, 2019).
18
XiongJ.ThenkabailP. S.GummaM. K.TeluguntlaP.PoehneltJ.CongaltonR. G.et al. (2017). Automated cropland mapping of continental Africa using Google Earth Engine cloud computing. ISPRS J. Photogrammetry Remote Sens.126, 225–244. 10.1016/j.isprsjprs.2017.01.019
19
XuY.YuL.FengD.PengD.LiC.HuangX.et al. (2018). Comparison of three recent moderate resolution African land cover datasets: CGLS-LC100, ESA-S2-LC20, and FROM-GLC-Africa30. Int. J. Remote Sens.40, 6185–6202. 10.1080/01431161.2019.1587207
Summary
Keywords
classification, ESA-CCI S2 prototype LC 20 m map, accuracy, precision, recall and Fβ measure
Citation
Alkhalil A, Kadaoure I and Kouadio M (2020) An Evaluation of 20-m ESA-CCI S2 Prototype LC Product. Front. Sustain. Food Syst. 4:504334. doi: 10.3389/fsufs.2020.504334
Received
11 October 2019
Accepted
31 August 2020
Published
23 October 2020
Volume
4 - 2020
Edited by
Patrick Meyfroidt, Catholic University of Louvain, Belgium
Reviewed by
Molly E. Brown, University of Maryland, College Park, United States; Le Yu, Tsinghua University, China
Updates
Copyright
© 2020 Alkhalil, Kadaoure and Kouadio.
This is an open-access article distributed under the terms of the Creative Commons Attribution License (CC BY). The use, distribution or reproduction in other forums is permitted, provided the original author(s) and the copyright owner(s) are credited and that the original publication in this journal is cited, in accordance with accepted academic practice. No use, distribution or reproduction is permitted which does not comply with these terms.
*Correspondence: Alkhalil Adoum alkhalil.adoum@gmail.com
This article was submitted to Land, Livelihoods and Food Security, a section of the journal Frontiers in Sustainable Food Systems
Disclaimer
All claims expressed in this article are solely those of the authors and do not necessarily represent those of their affiliated organizations, or those of the publisher, the editors and the reviewers. Any product that may be evaluated in this article or claim that may be made by its manufacturer is not guaranteed or endorsed by the publisher.