
94% of researchers rate our articles as excellent or good
Learn more about the work of our research integrity team to safeguard the quality of each article we publish.
Find out more
ORIGINAL RESEARCH article
Front. Sustain. Food Syst., 17 September 2020
Sec. Crop Biology and Sustainability
Volume 4 - 2020 | https://doi.org/10.3389/fsufs.2020.00135
This article is part of the Research TopicCrop Biofortification for Food Security in Developing CountriesView all 9 articles
 Munir H. Zia1
 Iftikhar Ahmed2
 Elizabeth H. Bailey3R. Murray Lark3Scott D. Young3
 Nicola M. Lowe4Edward J. M. Joy5Lolita Wilson3Mukhtiar Zaman6
 Martin R. Broadley3*
Background: Biofortification of wheat with zinc (Zn) through breeding and agronomy can reduce Zn deficiencies and improve human health. “High-Zn” wheat varieties have been released in India and Pakistan, where wheat is consumed widely as a dietary staple. The aim of this study was to quantify the potential contribution of a “high-Zn” wheat variety (Triticum aestivum L. var. Zincol-2016) and Zn fertilizers to improving dietary Zn supply under field conditions in Pakistan.
Methods: Grain Zn concentration of Zincol-2016 and local reference varieties were determined at three sites of contrasting soil Zn status: Faisalabad (Punjab Province; diethylenetriamine pentaacetate- (DTPA-)extractable Zn, 1.31 mg kg−1 soil; gross plot size 13.3 m2; n = 4; reference var. Faisalabad-2008), Islamabad (Capital Territory; 0.48 mg kg−1; 4.6 m2; n = 5; reference var. NARC-2011), and Pir Sabak (Khyber Pakhtunkhwa, KPK, Province; 0.12 mg kg−1 soil; 9.1 m2; n = 4; reference vars. Pirsabak-2015, Wadhan-2017). Eight Zn fertilizer treatment levels were tested using a randomized complete block design: control; soil (5 or 10 kg ha−1 ZnSO4.H2O; 33% Zn applied at sowing); foliar (0.79 or 1.58 kg of ZnSO4.H2O ha−1 applied as a 250 L ha−1 drench at crop booting stage); three soil × foliar combinations.
Results: At the Faisalabad site, the grain Zn concentration of Zincol-2016 was greater than Faisalabad-2008, with no yield penalty. Zincol-2016 did not have larger grain Zn concentrations than reference varieties used at Islamabad or Pir Sabak sites, which both had a lower soil Zn status than the Faisalabad site. Foliar Zn fertilization increased grain Zn concentration of all varieties at all sites. There were no significant effects of soil Zn fertilizers, or variety·fertilizer interactions, on grain Zn concentration or yield.
Conclusions: Environment and management affect the performance of “high-Zn” wheat varieties, and these factors needs to be evaluated at scale to assess the potential nutritional impact of Zn biofortified crops. Designing studies to detect realistic effect sizes for new varieties and crop management strategies is therefore an important consideration. The current study indicated that nine replicate plots would be needed to achieve 80% power to detect a 25% increase in grain Zn concentration.
Zinc (Zn) is an essential micronutrient for all organisms (Broadley et al., 2007). Recommended dietary intake values vary depending on demographic and dietary factors, however, a weighted Estimated Average Requirement (EAR) of 10.3 mg d−1 has been estimated at a global scale (Kumssa et al., 2015). The EAR is the quantity of a nutrient required to meet the needs of half the individuals in an age- and sex-specific population group. For most individuals, the primary route of intake of Zn is from food sources. An estimated 17% of the global population is at risk of Zn deficiency due to inadequate supplies of Zn in national food systems (Wessells and Brown, 2012; Kumssa et al., 2015). The risk of Zn deficiency increases in areas where the consumption of animal source foods is limited, including many countries in South Asia and sub-Saharan Africa. Estimates of the prevalence of Zn deficiency from food supply are likely to be conservative, based on evidence from population-based surveys of biomarkers of Zn status (Zn concentration in blood plasma or serum) and the incidence of proxies of Zn deficiency including diarrhea and stunting (low height for age in children), which indicate that Zn deficiency risks are larger (King et al., 2016).
Wheat (Triticum aestivum L.) is an important cereal crop and a major source of dietary Zn globally, especially in South Asia where risks of dietary Zn deficiency are likely to be large. For example, Akhtar (2013) found that the prevalence of Zn deficiency exceeded 40% among women and children in India and Pakistan, based on surveys of blood plasma/serum Zn status. In India, Zn concentration in wheat grain, among a panel of 36 diverse genotypes grown in experimental plots on contrasting soil types, ranged from 24.9 to 34.8 mg kg−1 (Khokhar et al., 2017, 2018). In Pakistan, the concentration of Zn in wheat grain collected from farmers' fields in 75 locations ranged from 15.1 to 39.7 mg kg−1 (Joy et al., 2017). Among a panel of 28 wheat genotypes of Pakistani origin, grown over two seasons at a single location, grain Zn concentration ranged from 21.2 to 33.3 mg kg−1 with a mean of 27.5 mg kg−1 (Rehman et al., 2018b). Assuming a whole-grain Zn concentration of 30 mg kg−1, an energy density for wheat grain of 3,400 kcal kg−1, and a dietary wheat supply of 517 and 903 kcal capita d−1 in India and Pakistan, respectively [Food and Agriculture Organization of the United Nations (FAO), 2020], the supply of Zn from whole-grain wheat represents 4.6 and 8.0 mg capita−1 d−1, i.e., 45 and 78% of the weighted EARs, for India and Pakistan, respectively.
The HarvestPlus programme and their partners have used conventional breeding to develop and release new “high-Zn” wheat varieties in India and Pakistan, a process known as genetic biofortification (Velu et al., 2015; Singh and Velu, 2017). These new varieties have been developed from synthetic wheat lines derived from wild wheat relatives, including Aegilops tauschii (D genome donor of wheat), Triticum spelta, and wild T. dicoccon, and crosses with T. durum. The HarvestPlus target was to enhance the Zn concentration in grain of existing wheat varieties by 8–12 mg kg−1, above a notional baseline whole-grain Zn concentration of 25 mg kg−1, without reducing yield or quality (Velu et al., 2015). In India, “high-Zn” varieties have been developed and released in the North Eastern Plain Zone (NEPZ): Abhay (Zinc Shakthi, Chitra), Akshai (BHU-3), and BHU-6, and in the North Western Plain Zone (NWPZ): WB02 and HPBW-01 (Velu et al., 2015; Singh and Velu, 2017). In Pakistan, a “high-Zn” wheat variety Zincol-2016, developed by National Agriculture Research System (NARS) from a background NARC-2011 variety, was released by the Pakistan Agriculture Research Council (PARC) in 2016.
In addition to genetic approaches, grain Zn concentration in wheat can also be increased with Zn-containing fertilizers, a process termed agronomic biofortification or agro-fortification (Cakmak, 2008; White and Broadley, 2009; Zhao et al., 2019). In a review of nine published field studies, Joy et al. (2015b) noted that foliar Zn (ZnSO4) fertilizers, applied as a drench to field-grown wheat, increased the whole-grain Zn concentration by a median of 63%. Soil-applied Zn fertilizers can also increase grain Zn concentrations, albeit to a much lesser extent than foliar-applied Zn fertilizers but may also increase crop yield in some settings (Cakmak, 2008; Zou et al., 2012). In a review of 14 published field studies, soil-applied Zn fertilizers increased whole-grain Zn concentration of field-grown wheat by a median of 19% (Joy et al., 2015b). In Pakistan, soil-applied Zn fertilizers led to an increase in the Zn concentration of whole-grain chapati flatbread, from 18 ± 2 to 24 ± 2 mg kg−1 (mean ± SD) (Ahsin et al., 2019). In India, wheat agro-fortified with foliar Zn fertilizer and supplied as a Zn-enriched flour for 6 months to women and children aged from 4 to 6 years resulted in a 17 and 40% reduction in self-reported incidences of pneumonia and vomiting, respectively (Sazawal et al., 2018).
There is a lack of information in the literature on how new HarvestPlus wheat varieties perform under field conditions in India and Pakistan compared to widely-grown varieties. However, there is evidence from pot studies that there are likely to be strong genotype (G) × environment (E) × management (M) effects on grain Zn concentration. In a recent pot-study, using an alkaline calcareous soil with a small concentration of plant-available Zn (0.7 mg kg−1) diethylenetriamine pentaacetate- (DTPA-) extractable Zn, Hussain et al. (2018) reported that Zincol-2016 (~22 mg kg−1) had a larger grain Zn concentration than Faisalabad-2008 (~18 mg kg−1). When Zn fertilizer was added to soils, the differences in grain Zn between Zincol-2016 (~36 mg kg−1) and Faisalabad-2008 (~25 mg kg−1) increased markedly. In a pot study by Yousaf et al. (2019), Zincol-2016 (33.9 mg kg−1) had a much larger grain Zn concentration than Faisalabad-2008 (23.8 mg kg−1) in unfertilized soils. However, genotypic differences were not evident when foliar or soil Zn fertilizers were added and which increased the grain Zn concentration in both varieties. In a pot study by Yaseen and Hussain (2020), Zincol-2016 had a greater grain Zn concentration than a reference variety, Jauhar-2016, when Zn fertilizers were added to alkaline calcareous soils although there was no genotypic difference in grain Zn concentration under control conditions. The aim of this study was to quantify the potential contribution of Zincol-2016 to improving the dietary supply of Zn under experimental field conditions. Field experiments were established in Pakistan at three sites of contrasting soil Zn status, where Zincol-2016 was grown in replicated plots and compared with local reference lines, with and without soil and/or foliar Zn fertilizers.
Experiments were established at three sites of contrasting Zn status. The site at Faisalabad had a high DTPA-extractable Zn concentration, whereas the sites at Islamabad and Pir Sabak had medium and low DTPA-extractable Zn concentration, respectively. A DTPA-extractable soil Zn concentration of 0.8–1.0 mg kg−1 is considered adequate for the growth of most crops (Lindsay and Norvell, 1978). Soils at all three sites had high pH, which is typical of calcareous soils in the region. Properties of the soil at the three locations are given in Table 1.
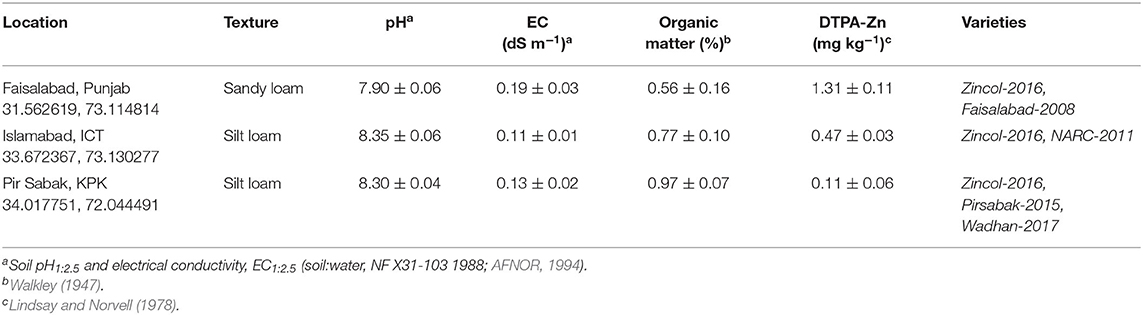
Table 1. Locations (latitude, longitude), soil properties (median ± standard deviation), and cultivars of wheat.
The experiments sought to test the effect of variety and Zn fertilizers on wheat grain yields and Zn concentration at each of the three sites. The choice of variety was site-specific, so that the performance of Zincol-2016 could be compared directly with reference varieties used routinely by farmers in the same locations (Table 1). At all sites, eight Zn fertilizer treatment levels were tested (Table 2): control; soil-applied (5 or 10 kg ha−1 ZnSO4.H2O; 33% Zn applied at sowing); foliar-applied (0.79 or 1.58 kg of ZnSO4.H2O ha−1 applied as a 250 L ha−1 drench at crop booting stage, Zadoks' scale 45–50; Zadoks et al., 1974); and three combinations of soil- and foliar-applied ZnSO4.H2O comprising 5 + 0.79 kg ha−1 soil + foliar, 10 + 0.79 kg ha−1 soil + foliar, and 10 + 1.58 kg ha−1 soil + foliar. A randomized complete block design (RCBD) was adopted at each site, comprising four replicates at Faisalabad and Pir Sabak, and five replicates at Islamabad. Treatment:plot allocations are provided in Supplementary Information.
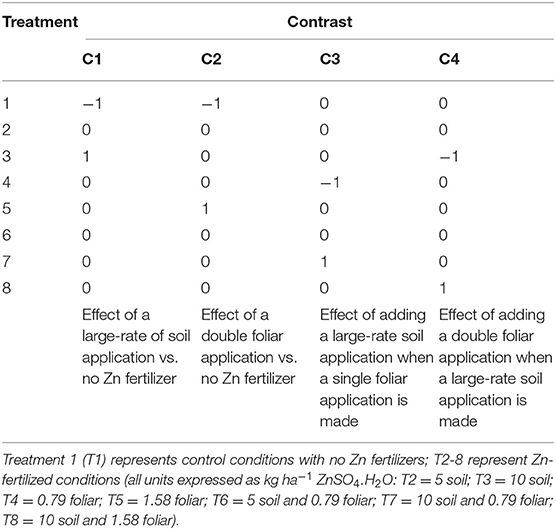
Table 2. Contrasts tested in this study four contrasts (C1–C4) represent non-orthogonal components of the fertilizer effect.
The gross plot sizes were: Faisalabad 13.3 m2 (3.35 × 3.96 m), Islamabad 4.6 m2 (1.52 × 3.05 m), and Pir Sabak 9.1 m2 (2.13 × 4.27 m). Soil was plowed three times then leveled by planking. Plot boundaries were marked manually at all the sites. Seed of the selected varieties (Table 1) were sown using a seed rate of 125 kg ha−1 using row spacing of ~25 cm. The crop was sown on 24 November 2018 at Pir Sabak, 02 December 2018 at Islamabad, and 08 December 2018 at Faisalabad. A total of five irrigations were made during crop growth at Pir Sabak and Faisalabad, with three irrigations at Islamabad which received greater rainfall.
General fertilizer applications comprised basal phosphorus (di-ammonium phosphate, P2O5 46%) at 115 kg P2O5 ha−1, and potassium (muriate of potash, K2O 60%) at 75 kg K2O ha−1 at Faisalabad and Pir Sabak. Potassium was not applied at Islamabad as soil testing indicated adequate potassium status. Basal fertilizers were applied at time of soil preparation, prior to sowing. Nitrogen (urea at 110 kg ha−1) was split in to two halves, one half-applied at time of first irrigation (Zadoks' scale ~25) whereas the remaining half at Zadoks' scale ~40). Soil-applied Zn fertilizer was broadcast uniformly in the designated treatment plot(s) and incorporated into the soil before sowing. The foliar treatment for Zn fertilizers was applied in the early morning hours to reduce risk of leaf-scorch.
Prior to harvest (May 2019), crop measurements were taken at five random locations within the plot to exclude border effects. These included plant height, number of tillers per square meter, spike length, number of grains in 10 spikes, grain weight for 10 spikes, and crop biomass. After on-site harvest/threshing of whole treatment plot, wheat grain yield was determined for each treatment and then converted into kg ha−1. A 500 g subsample was taken out of well-mixed threshed grain from each treatment plot, out of which 50 g was preserved for the analysis of grain Zn and other elemental concentrations.
Grain digestion and elemental analysis methods are described in Khokhar et al. (2018, 2020). Briefly, approximately 10 grains (whole-grain) were dried, weighed, and soaked in 3 mL 70% Trace Analysis Grade (TAG) HNO3 and 2 mL H2O2, at room temperature overnight, in perfluoroalkoxy (PFA) tubes (Anton Paar GmbH, Graz, Austria). The tubes were then placed into polyethylethylketone (PEEK) pressure jackets and digested in a Multiwave 3000 microwave system with a 48-vessel MF50 rotor (Anton Paar Gmbh). Whole-grain Zn concentration was determined by inductively coupled plasma-mass spectrometry (ICP-MS; Thermo Fisher Scientific iCAPQ, Thermo Fisher Scientific, Bremen, Germany). The Zn recovery from nine samples of a Certified Reference Material (CRM; Wheat flour SRM 1567b, NIST, Gaithersburg, MD, US; 11.61 mg kg−1) was 94.4% (first run) and 91.2% (second run). The Limit of Detection (LOD) for Zn, equivalent to 3 times the standard deviation (SD) of the concentrations of all of the operational blanks and a notional dry weight of 0.35 g was 4.45 and 2.47 mg kg−1 for the first and second analysis runs, respectively. The full range of elements reported from the ICP-MS were Ag, Al, As, B, Ba, Be, Ca, Cd, Cr, Co, Cs, Cu, Fe K, Li, Mg, Mn, Mo, Na, Ni, P, Pb, Rb, S, Se, Sr, Ti, Tl, U, V, and Zn (Supplementary Information). Data for Zn, Fe, Cd, and Ca are reported here.
All statistical analyses were conducted on the R platform (R Core Team, 2017). First, analysis of variance (ANOVA) was used to test the main effects of variety, fertilizer treatments, and their interaction. Exploratory plots (histograms and QQ plots of the residuals for the analysis) were then examined to check the plausibility of the assumption that these are drawn from a normal distribution, and the plot of residuals against fitted values was examined to check the plausibility that the variance of the residuals was homogeneous. At this point a decision would be made to transform the data to make these assumptions plausible, although that was not needed for the analyses reported in this study.
If the main effect of fertilizer appeared significant, then it was examined further by testing a set of contrasts among levels of the fertilizer factor against the Residual Mean Square (RMS) for the overall ANOVA. The treatments used in the study do not naturally partition into a set of informative orthogonal contrasts. Therefore, we examined a set of non-orthogonal contrasts, controlling the family-wise error rate with Holm's modification of Bonferroni's method (Holm, 1979), and we reported adjusted p-values. Sokal and Rohlf (2012) recommend this approach when examining non-orthogonal contrasts. Given that power is lost for each additional test, four informative contrasts were selected (Table 2) and the treatment by variety interaction was not partitioned for the contrast analyses. Effect sizes for all four contrasts, and a (pooled) standard error are reported. R scripts are provided in Supplementary Information).
The contrasts were defined before any data from the experiment were examined. The rationale for this choice of contrasts was to explore the largest respective effects of soil application and foliar application (C1 and C2) relative to the no-fertilizer control, and then to examine the evidence for an incremental improvement from a large-rate soil application when a single foliar application is in use (C3, “with a standard foliar application, is there any benefit in applying Zn to the soil as well?”), and from adding a double foliar application when a large-rate soil application is in use (C4, “when applying Zn to the soil, is there a supplementary benefit of applying a foliar dose as well?”). As is noted above, these 4 contrasts, each with 1 degree of freedom, are not orthogonal. That is to say the contrasts are not independent of each other, and so do not give independent tests on components of the sum of squares for treatments.
The outputs of the ANOVA for treatment factors, their interactions, and selected contrasts, for the variates of yield and grain Zn, Fe, Ca, and Cd concentration are presented in Table 3. Arithmetic means across the plots for these same variates are plotted in Figure 1; individual plot-level data, including yield components, are provided as Supplementary Information. Fertilizer treatment means, and the effects sizes of the chosen contrasts, are presented in Tables 4, 5, respectively. The interpretation of the effects sizes is conditional on the signs (i.e., a positive value for C1 would indicate that the mean for the soil Zn treatment is larger than the mean for the control). The standard error is obtained from the pooled RMS, so it is the same where replication sizes are equal.
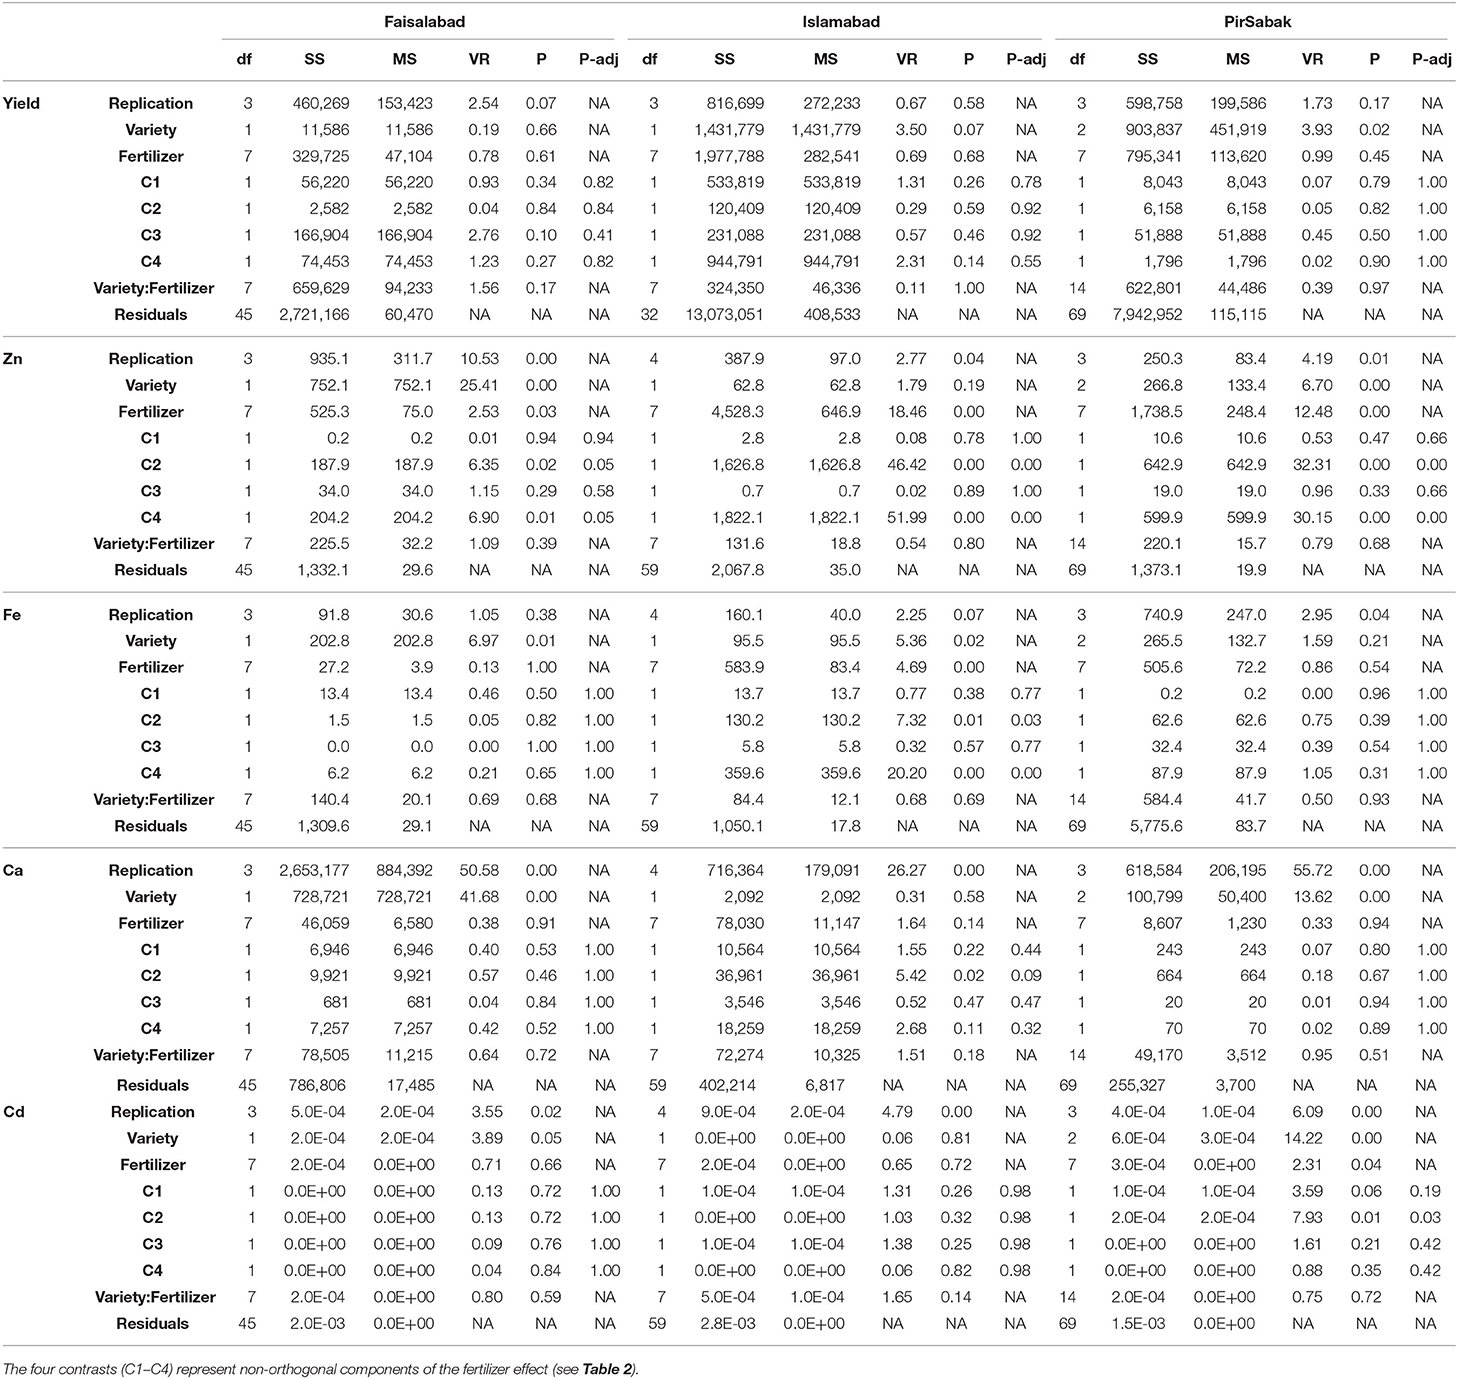
Table 3. Analysis of variance tables for crop yield and element concentrations in grain.
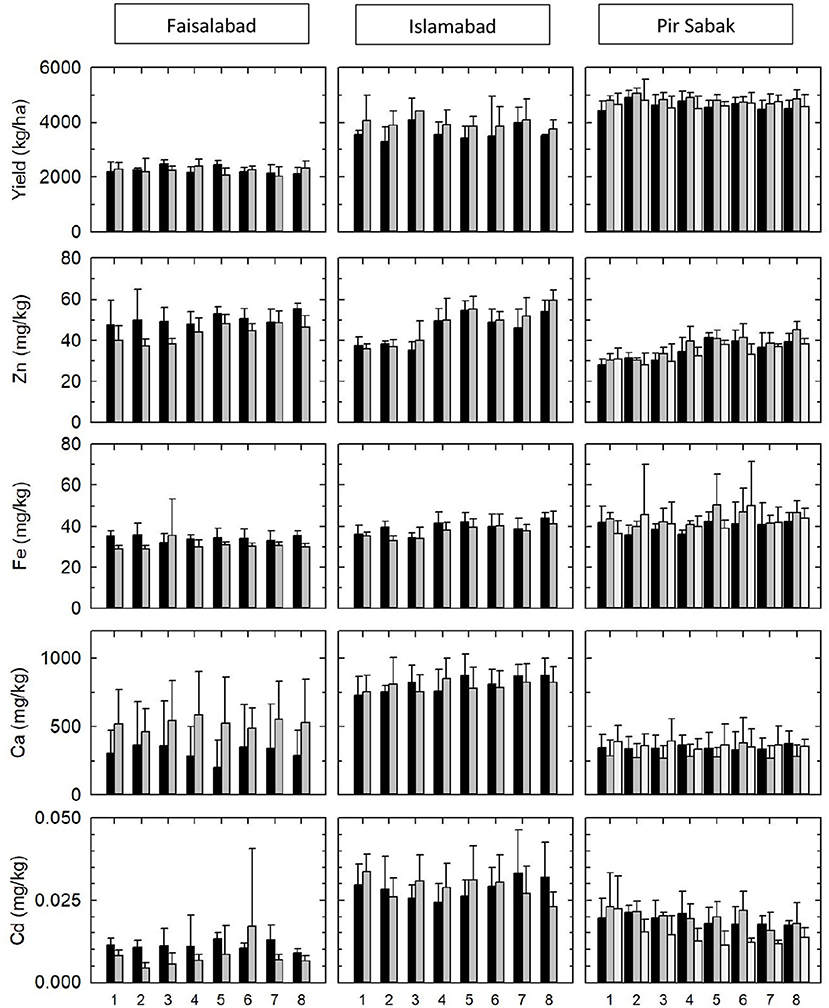
Figure 1. Arithmetic means (±standard deviation, SD) of grain yield and mineral concentration of wheat at three sites under control (Treatment 1, T1) or Zn-fertilized conditions (all units expressed as kg ha−1 ZnSO4.H2O: T2 = 5 soil; T3 = 10 soil; T4 = 0.79 foliar; T5 = 1.58 foliar; T6 = 5 soil and 0.79 foliar; T7 = 10 soil and 0.79 foliar; T8 = 10 soil and 1.58 foliar). Black bars are Zincol-2016; gray bars are local reference varieties (Faisalabad-2008 at Faisalabad; NARC-2011 at Islamabad; Wadhan-2017 and Pirsabak-2015—lighter gray—at Pir Sabak).
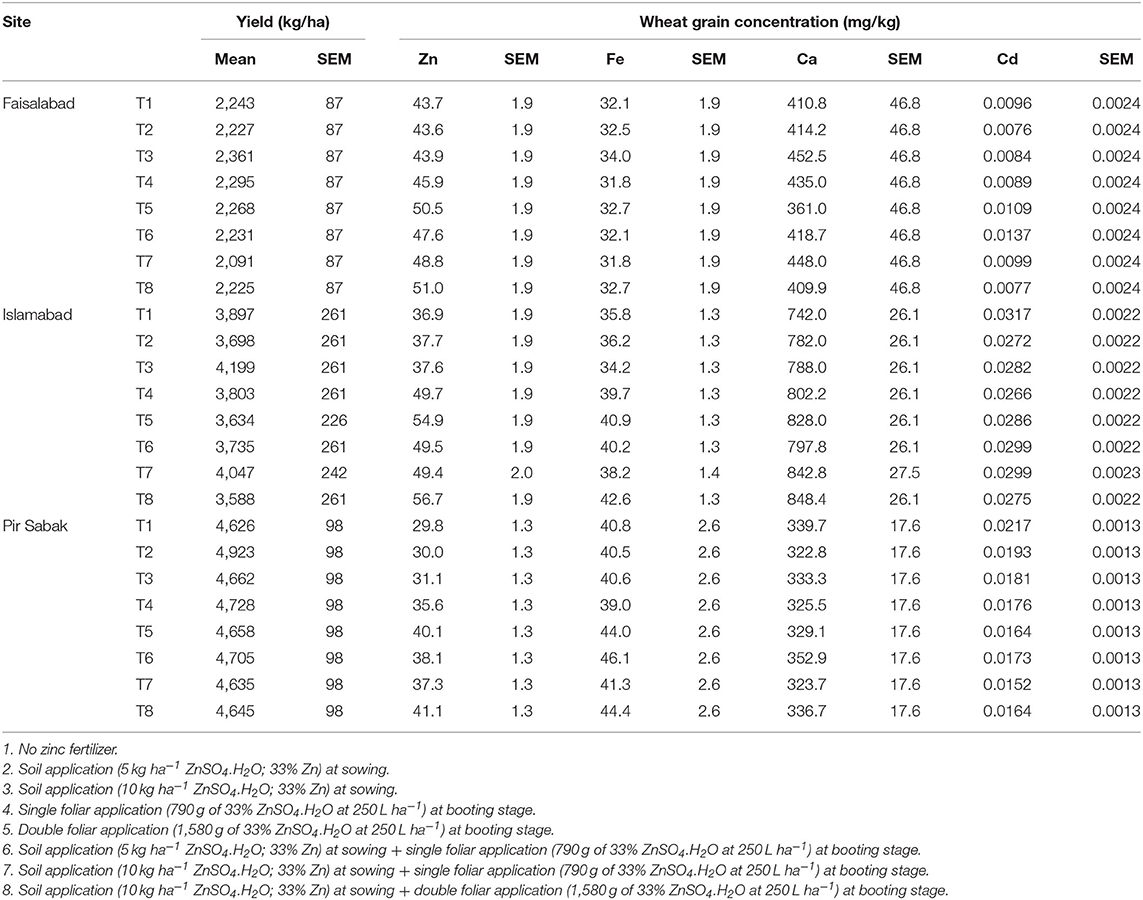
Table 4. Estimated treatment means (± standard error of the mean, SEM) of grain yield and mineral concentration of wheat at three sites under control (Treatment 1, T1) or Zn-fertilized conditions (all units expressed as kg ha−1 ZnSO4.H2O: T2 = 5 soil; T3 = 10 soil; T4 = 0.79 foliar; T5 = 1.58 foliar; T6 = 5 soil and 0.79 foliar; T7 = 10 soil and 0.79 foliar; T8 = 10 soil and 1.58 foliar).
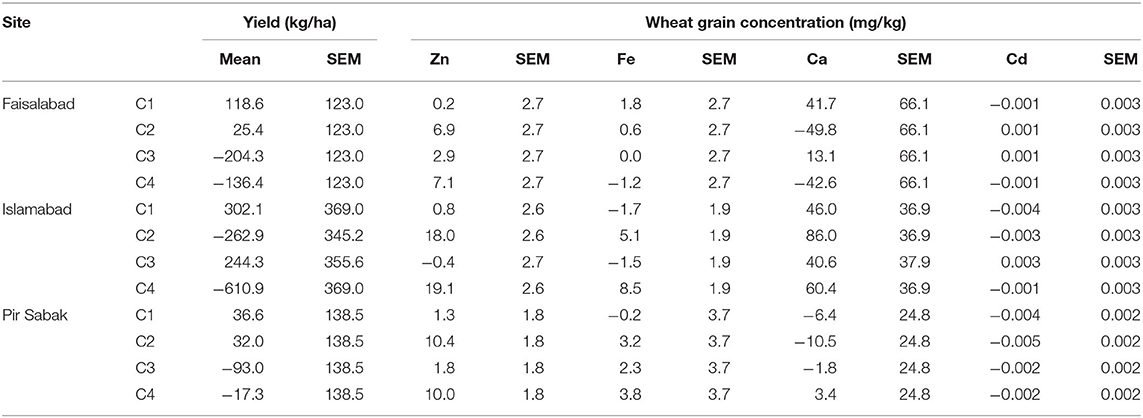
Table 5. Mean effect size and standard error (SEM) of each the four contrasts (C1–C4) representing non-orthogonal components of the fertilizer effect (see Table 2).
At all three sites, there was no evidence to reject the null hypothesis of no effect of Zn fertilizer application, or variety·Zn fertilizer interaction, on yield (Table 3). The lack of yield responses to Zn fertilizers was unexpected given that wheat is generally responsive to Zn fertilizers on calcareous soil types in Pakistan (e.g., Joy et al., 2017; Rehman et al., 2018a; Asif et al., 2019). At the Faisalabad and Islamabad sites, there was no evidence to reject the null hypothesis of no difference in mean yield among varieties, however, there was some evidence to reject this null hypothesis at the Pir Sabak site (p = 0.024; Table 3), with Wadhan-2017 having a slightly greater yield than Pirsabak-2015 and Zincol-2016. Notably, the overall grain yield of Zincol-2016 and Faisalabad-2008 was ~50% of those observed for Zincol-2016 and reference varieties at Islamabad and Pir Sabak. The two main reasons for this are that (1) the soil texture at the Faisalabad site is “sandy loam,” where one would always expect a yield penalty compared to the “silt loam” textured soils at the other locations, and (2) the crop was late-sown. Furthermore, there was also a yellow rust attack at the time of grain formation/development at the Faisalabad site and surrounding area in 2019. The salinity of the irrigation water was not a yield-limiting factor at Faisalabad, based on electrical conductivity (EC, Table 1).
There was strong evidence to reject the null hypothesis of no difference in grain Zn concentration between the varieties at the Faisalabad (p < 0.001) and Pir Sabak (p = 0.002) sites (Table 3). At Faisalabad, Zincol-2016 had a consistently larger grain Zn concentration than Faisalabad-2008; a difference of ~16% averaged across all 8 fertilizer treatment levels (Figure 1; Supplementary Information). At Pir Sabak, grain Zn concentration decreased in the order Wadhan-2017 > Zincol-2016 > Pirsabak-2015. At Islamabad, there was no evidence to reject the null hypothesis of no difference in grain Zn concentration between the varieties (p = 0.186; Table 3).
There was evidence to reject the null hypothesis of no effect of Zn fertilizer application on grain Zn concentration at all three sites (Table 3): Faisalabad (p = 0.028), Islamabad (p ≤ 0.001), and Pir Sabak (p = 0.002). Application of foliar Zn fertilizer increased grain Zn concentration at all three sites (Tables 3–5). Thus, at Faisalabad, foliar Zn fertilizer application increased grain Zn concentration by 6.9 (Contrast 2, C2) and 7.1 (C4) mg kg−1. At Islamabad, foliar Zn fertilizer application increased grain Zn concentration by 18.0 (C2) and 19.1 (C4) mg kg−1. At Pir Sabak, foliar Zn fertilizer application increased grain Zn concentration by 10.4 (C2) and 10.0 (C4) mg kg−1. There was no evidence of any significant effect of soil Zn fertilizer application on grain Zn concentration at any of the sites based on the analyses of C1 or C3 contrasts (Table 3). There was no evidence of variety·Zn fertilizer interactions on grain Zn concentration at any of the three sites (Table 3).
There was evidence to reject the null hypothesis of no difference among the varieties with respect to grain Fe concentration at the Faisalabad (p = 0.011) and Islamabad (p = 0.024) sites. At Faisalabad, Zincol-2016 had a larger grain Fe concentration than Faisalabad-2008; a difference of ~12% averaged across all 8 fertilizer treatment levels (Figure 1; Supplementary Information). At Islamabad, Zincol-2016 had a larger grain Fe concentration than NARC-2011; a difference of ~6% averaged across all 8 fertilizer treatment levels (Figure 1; Supplementary Information). At the Pir Sabak site, the null hypothesis of no difference among the varieties with respect to grain Fe concentration was retained (p = 0.212; Table 3).
There was no evidence to reject the null hypothesis of no effect of Zn fertilizer application on grain Fe concentration at Faisalabad (p = 0.995) or Pir Sabak (p = 0.540) sites (Table 3). However, there was evidence to reject this null hypothesis at the Islamabad site (p < 0.001; Table 3), with the contrasts effect sizes being 5.1 (C2) and 8.5 (C4) mg kg−1. There was no evidence of any significant effect of soil Zn fertilizer application on grain Fe concentration, at Islamabad or the other two sites based on the analyses of C1 or C3 contrast (Table 3). There was no evidence of variety·Zn fertilizer interactions on grain Fe concentration at any of the three sites (Table 3).
There was evidence to reject the null hypothesis of no difference among the varieties with respect to grain Ca concentration at the Faisalabad (p < 0.001) and Pir Sabak (p < 0.001) sites (Table 3). At Faisalabad, Faisalabad-2008 had a larger grain Ca concentration than Zincol-2016; a difference of ~68% averaged across all 8 fertilizer treatment levels (Figure 1; Supplementary Information). At Pir Sabak, Zincol-2016 had a larger grain Ca concentration than Wadhan-2017; a difference of ~20% averaged across all 8 fertilizer treatment levels (Figure 1; Supplementary Information). However, at Pir Sabak, Pirsabak-2015 had a larger grain Ca concentration than Zincol-2016; a difference of ~5% averaged across all 8 fertilizer treatment levels. At the Islamabad site, there was no evidence for varietal differences in grain Ca concentration (p = 0.582; Table 3). There was no evidence of any effects of Zn fertilizer, or variety·Zn fertilizer interactions, on grain Ca concentration at any of the three sites (Table 3).
There was evidence to reject the null hypothesis of no difference among the varieties with respect to grain Cd concentration at the Pir Sabak site (p < 0.001; Table 3). Zincol-2016 had a larger grain Cd concentration than Pirsabak-2015; a difference of ~34% averaged across all fertilizer treatments. However, Wadhan-2017 had a larger grain Cd concentration than Zincol-2016; also a difference of ~34% averaged across all 8 fertilizer treatment levels (Figure 1; Supplementary Information). There was no evidence for varietal differences in grain Cd concentration at the Faisalabad (p = 0.055) and Islamabad (p = 0.805) sites (Table 3). The null hypothesis of no effect of Zn fertilizer application on grain Cd concentration was retained at Faisalabad (p = 0.660) and Islamabad (p = 0.716) sites; there was weak evidence to reject this null hypothesis at the Pir Sabak site (p = 0.035; Table 3), with an effect size of −0.005 mg kg−1 in contrast C2 (Tables 4, 5). There was no evidence of variety·Zn fertilizer interactions on grain Cd concentration at any of the three sites (Table 3).
The primary focus of this study was to determine the effects of growing location and Zn fertilizers on the grain Zn concentration of a variety of biofortified wheat, Zincol-2016, compared to local elite reference varieties. Experiments were conducted at three sites of contrasting soil Zn status in Pakistan. In the absence of Zn fertilizers, the grain Zn concentration of Zincol-2016 was greater than the local variety at only one of the sites, Faisalabad. At the other two sites, Islamabad and Pir Sabak, Zincol-2016 did not have a greater grain Zn concentration than the local varieties. Grain yields were markedly lower at Faisalabad than Islamabad and Pir Sabak, however, there was no evidence for differences in yield between the varieties at the Faisalabad site. Conversely, there were yield differences between the varieties at the Islamabad site, but no evidence for differences in grain Zn concentration between the varieties. These observations indicate that variation in grain Zn concentration is not simply reflecting a yield dilution effect.
The experiments reported in this current study were not designed to test for effects of site on varietal performance. However, it is noteworthy that soils at Faisalabad had a larger concentration of DTPA-extractable soil Zn than the soils at the other two sites. Several studies have reported significant positive correlations between DTPA-extractable soil Zn concentration and wheat grain Zn concentrations under field conditions. For example, in a recent study in China, wheat grain Zn concentration correlated positively with available soil Zn in single wheat, wheat-maize, and rice-wheat cropping systems (Huang et al., 2019). Similar positive correlations have also been reported under field conditions in Iran (Karami et al., 2009), France (Oury et al., 2006), and Slovakia (Krauss et al., 2002). However, whilst available soil Zn clearly has predictive power, wheat grain Zn concentration is a complex trait which is influenced by many additional soil, varietal, and climatic factors (Karami et al., 2009; Huang et al., 2019).
Foliar Zn fertilization increased the grain Zn concentration of all varieties at all sites. This observation is consistent with a large body of evidence that foliar Zn fertilizers are an effective method to increase the grain Zn concentration of field-grown wheat and other crops, and in many countries (Zou et al., 2012; Joy et al., 2015b; Ram et al., 2016). The largest increase in grain Zn concentration in the current study, as a result of foliar Zn fertilizers, was a 49% increase at the Islamabad site. Despite their potential effectiveness, including in studies from which self-reported health benefits have been noted (Sazawal et al., 2018), the use of foliar Zn fertilizers to enrich wheat grain is yet to be widely adopted by wheat growers in subsistence or commercial settings.
There were no significant effects of soil Zn fertilizers, or variety·fertilizer interactions, on grain Zn concentration at any of the sites. The use of soil Zn fertilizers has been reported to increase wheat grain Zn concentration in other field studies, albeit to a smaller extent than foliar Zn fertilizers (Joy et al., 2015b). For example, an average increase in grain Zn concentration of 12% was reported across 23 site-year combinations, spanning seven countries (Zou et al., 2012). Soil Zn fertilizers have also been reported to increase available Zn, for example, in a field study in Punjab Province, Pakistan, Ahsin et al. (2019) reported greater soil concentrations of DTPA-extractable Zn (1.1 ± 0.1 mg kg−1; mean ± standard deviation, SD) in soils treated with Zn, than when no Zn fertilizers were applied (0.8 ± 0.1 mg kg−1). Soil applications of Zn fertilizers have specifically been shown to be effective at increasing the grain Zn concentration of Zincol-2016 in pot experiments (Yousaf et al., 2019; Yaseen and Hussain, 2020). However, further research is needed to understand the potential value of longer-term soil fertility building with soil Zn fertilizers with new Zn-biofortified wheat varieties under field conditions, including the potential for multi-year effects, and the use of other nutrients to augment Zn uptake and translocation to grain. For example, farmer management such as an increased use of nitrogen fertilizers (Xue et al., 2012) and organic inputs (Wood et al., 2018) can increase wheat grain Zn concentration in field settings. Similarly, an increased use of organic materials (Manzeke et al., 2019) and nitrogen fertilizers (Manzeke et al., 2014, 2020) has been reported to increase grain Zn concentration in field-grown maize in smallholder farming systems.
It is important to understand how new varieties of biofortified wheat perform on different soils and under different farm-management practices. This will enable the potential impact of biofortified wheat to be evaluated in terms of dietary Zn intake, in addition to farmer adoption rates (e.g., Joy et al., 2017). Dietary Zn intake is a key indicator for assessing population Zn status, because Zn status in humans is influenced by inflammation (Likoswe et al., 2020; McDonald et al., 2020), whilst health and development outcomes linked to Zn deficiency, such as pneumonia, diarrhea, and stunting, have complex etiologies beyond Zn status (King et al., 2016).
Large ranges of wheat grain Zn concentration, from 14 to 59 mg kg−1 were reported from a survey of 599 locations in China (Huang et al., 2019), and from 15.1 to 39.7 mg kg−1 in a survey of 75 farmers' fields in Pakistan (Joy et al., 2017). However, despite the considerable nutritional significance of this variation with respect to population-level dietary requirements for Zn, the contribution of different components genotype, environment, and management (G × E × M) to variation in grain Zn concentration remains poorly understood.
In terms of dietary Zn intake, even small changes in Zn concentration in staple foods can translate into large effects on estimates of population-level prevalence of Zn deficiency. In the current study, an increase in grain Zn concentration of 1 mg kg−1 would increase dietary Zn intake by 0.27 mg capita−1 d−1, assuming a current dietary intake of Zn from wheat of 8 mg capita−1 d−1 arising from a grain consumption of 266 g capita−1 d−1 in Pakistan. An increase in grain Zn concentration of 4 mg kg−1 would increase dietary intakes by an average of >1 mg capita−1 d−1 which is >10% of the EAR for Zn of ~10.3 mg capita−1 d−1 in Pakistan (Kumssa et al., 2015). There is therefore clear scope for the agriculture sector to mitigate a projected 9% decrease in wheat grain Zn concentration arising due to greater atmospheric CO2 (mid-21st Century scenario of 550 ppm; Smith and Myers, 2018). Intriguingly, a ~30% larger maize grain Zn concentration attributed to a particular Vertisol soil type in Malawi (Chilimba et al., 2011; Joy et al., 2015a), corresponded with a larger inherent dietary Zn intake of 1.6 mg capita−1 d−1 based on composite dietary analyses among smallholder farming communities (Siyame et al., 2013). However, it was not possible to link this elevated Zn intake among farmers growing crops on the Vertisols to differences in Zn status based on biomarkers, likely because Zn concentrations in blood plasma/serum are under tight homeostatic control. Similarly, Sazawal et al. (2018) did not observe a change in biomarkers of Zn status among individuals consuming wheat grain with a 50% greater Zn concentration, following foliar Zn fertilizer application, although self-reported health improvements were noted over their 6-month study period. These studies highlight the need to consider dietary Zn intake as part of decision support for managing Zn deficiency.
Given the importance of understanding (potentially subtle) effects of G × E × M contributions to grain Zn concentrations, to thereby enable accurate estimates of potential improvements to dietary Zn intake, it is critical that experiments and field surveillance activities are designed appropriately. In the current study, grain Zn concentration at the Islamabad site had a control treatment mean of 36.9 mg kg−1 and a residual mean square of 35.1 based on the overall ANOVA. A power analysis for an effect size of 50, 33, or 25% in a simple control/treatment experiment is shown in Figure 2. This was done with the Fpower function from the daewr package for the R platform (Lawson, 2014). For a 25% effect size (i.e., an increase in grain Zn concentration of 9.2 mg kg−1, from 36.9 to 46.1 mg kg−1), nine or more replicates would be required to achieve 80% experimental power. The replication in the current study (n = 5) is powered sufficiently to detect an effect size smaller than 50% but larger than 33%. Therefore, the power to detect subtle treatment effects in this study is small compared to the potential dietary importance of these effects.
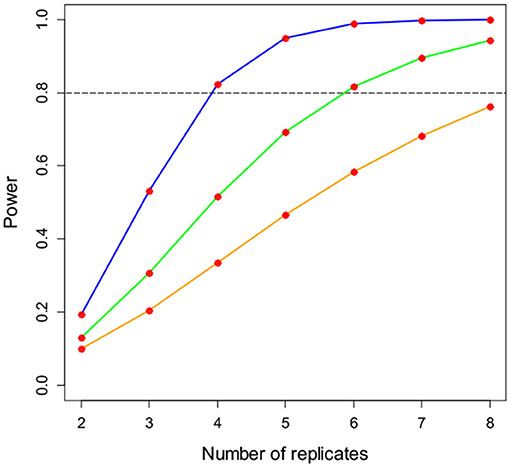
Figure 2. Power analysis for a simple control/treatment experiment for an effect size of 50% (blue line), 33% (green line), or 25% (orange line). Data are based on a treatment mean grain Zn concentration of 36.9 mg kg−1 and a residual mean square of 35.1, as observed at the Islamabad site.
Beyond Zn, wheat is an important dietary source of a range of other mineral micronutrients. Positive correlations between grain Zn and Fe concentrations have been reported when different varieties of wheat are being phenotyped (e.g., Khokhar et al., 2020). Interventions to increase dietary Zn intake through breeding might therefore have added nutritional benefits. For Fe, Zincol-2016 had a larger grain Fe concentration than the local varieties at two of the three sites, Faisalabad (cf . Faisalabad-2008) and Islamabad (cf . NARC-2011), but not at Pir Sabak. For Ca, another important human micronutrient, Zincol-2016 had a larger grain Ca concentration than Faisalabad-2008 and Wadhan-2017, at Faisalabad and Pir Sabak, respectively. In contrast, Zincol-2016 had a smaller grain Ca concentration than Pirsabak-2015 at the Pir Sabak site. Whilst there was limited evidence that Zn fertilizer applications affected grain Fe (or Ca) concentrations, the site-specific varietal responses reported in this study show the importance of phenotyping grain for multiple nutrient elements during biofortification breeding programmes.
The grain concentrations of 19 mineral elements are reported in this current study (Supplementary Information). Beyond the traits of grain Zn, Fe, and Ca concentration, which are heritable and amenable to crop breeding (Khokhar et al., 2018), the grain concentration of other essential dietary micronutrients, such as selenium (Se), have low heritability and are influenced to a far greater extent by the soil environment in which the crop is grown (White and Broadley, 2009). Interestingly, grain Se concentration across all plots at Faisalabad (median 0.082 mg kg−1; range 0.060–0.119) was almost five-fold greater than at Pir Sabak (median 0.017 mg kg−1; range 0.008–0.033), dwarfing any potential effect of variety or agronomy in the current study. It will be interesting to discover if further evidence emerges of systematic—and nutritionally important—spatial variation in grain Se concentration across the major wheat growing areas of Pakistan, as has been observed in sub-Saharan Africa for wheat and teff (Eragrostis tef (Zucc.) Trotter; (Gashu et al., 2020)), and also for maize (Ligowe et al., 2020).
Beyond elements of nutritional value, it is also important to consider how G × E × M factors might affect the concentrations of potentially toxic elements in wheat grain. For example, Zincol-2016 accumulated more Cd when grown in heavily contaminated soils in pots (Qaswar et al., 2017). In the current study, there was no evidence that Zincol-2016 systematically accumulated more Cd in its grain than local varieties. At Faisalabad or Islamabad, there were no significant varietal differences in grain Cd concentration. Significant varietal differences in grain Cd concentration were observed at Pir Sabak, however, Zincol-2016 had an intermediate grain Cd concentration compared to the two local varieties. The median grain Cd concentrations at all three sites (Faisalabad, 0.008 mg kg−1; Islamabad, 0.027 mg kg−1; Pir Sabak, 0.018 mg kg−1) were below the maximum permissible grain Cd concentration of 0.2 mg kg−1 (WHO/FAO, 2019).
In addition to potentially toxic elements, it will also be important to determine how G × E × M factors will influence the concentration of phytate and other anti-nutritional factors which can inhibit the bioavailability of Zn, Fe, and other mineral nutrients in the human gut. Anti-nutritional factors were not considered in the current study. Interestingly, in the recent study of Yaseen and Hussain (2020), using alkaline calcareous soils, there were no genotypic differences in grain Zn or phytate concentration under control conditions between Zincol-2016 and the reference variety Jauhar-2016. However, Zincol-2016 had a greater grain Zn concentration and a lower phytate concentration than Jauhar-2016 when Zn fertilizers were added, indicating that the bioavailable Zn would be greater in Zincol-2016.
Zincol-2016 is a new variety of wheat which has been released in Pakistan, having been bred to have a greater concentration of Zn in its grain. In field experiments conducted at three sites, the grain Zn concentration of Zincol-2016 was greater than the local variety at just one of the sites. Varieties responded similarly to Zn fertilizers, with substantial increases in grain Zn concentration when foliar Zn fertilizers were applied. Soil Zn fertilizers had no significant effect on grain Zn concentration in this study. When evaluating the potential nutritional impact of biofortified crops it is important to understand how varietal performance is influenced by environmental and management factors, including soil type and crop management. Experiments and surveys should be powered appropriately for both target (in this case Zn) and non-target nutrient quality traits.
All datasets generated for this study are included in the article/Supplementary Material.
MHZ, RL, and MB designed the study. MHZ, IA, EB, SY, and LW conducted the field experiments and sample analyses. MHZ, RL, and MB analyzed the data. MHZ, RL, EJ, and MB wrote the manuscript. MHZ, NL (BiZiFED principal investigator), MZ, and MB secured funding for the research, with the support of the other co-authors. All authors edited and approved the final version of the manuscript.
This work was supported by the Biotechnology and Biological Sciences Research Council (BBSRC)/Global Challenges Research Fund (GCRF) programme, in the project Examining the effectiveness and acceptability of the use of bio-fortified crops in alleviating micronutrient deficiencies in Pakistan (BiZiFED) [BB/P02338X/1]. We are grateful for in-kind contributions from Fauji Fertilizer Company (FFC) Limited for crop management and production, field support teams of National Agriculture Research Center (NARC) Islamabad and Cereal Crops Research Institute (CCRI) Pir Sabak for layout and assistance in agronomic operations during the trials period, to HarvestPlus Pakistan for supplying the Zincol-2016 wheat grain for sowing, and for additional funding from the University of Central Lancashire and the University of Nottingham.
MHZ is employed by Fauji Fertilizer Company Ltd., Pakistan.
The remaining authors declare that the research was conducted in the absence of any commercial or financial relationships that could be construed as a potential conflict of interest.
The Supplementary Material for this article can be found online at: https://www.frontiersin.org/articles/10.3389/fsufs.2020.00135/full#supplementary-material
AFNOR (1994). “Détermination du pH dans L'eau,” in Méthode Électrométrique. Qualité des Sols. Paris: Association Française de Normalisation.
Ahsin, M., Hussain, S., Rengel, Z., and Amir, M. (2019). Zinc status and its requirement by rural adults consuming wheat from control or zinc-treated fields. Environ. Geochem. Health 42, 1877–1892. doi: 10.1007/s10653-019-00463-8
Akhtar, S. (2013). Zinc status in South Asian populations – an update. J. Health Popul. Nutr. 31, 139–149. doi: 10.3329/jhpn.v31i2.16378
Asif, M., Tunc, C. E., Yazici, M. A., Tutus, Y., Rehman, A., Rehman, A., et al. (2019). Effect of predicted climate change on growth and yield performance of wheat under varied nitrogen and zinc supply. Plant Soil 434, 231–244. doi: 10.1007/s11104-018-3808-1
Broadley, M. R., White, P. J., Hammond, J. P., Zelko, I., and Lux, A. (2007). Zinc in plants. New Phytol. 173, 677–702. doi: 10.1111/j.1469-8137.2007.01996.x
Cakmak, I. (2008). Enrichment of cereal grains with zinc: agronomic or genetic biofortification? Plant Soil 302, 1–17. doi: 10.1007/s11104-007-9466-3
Chilimba, A. D. C., Young, S. D., Black, C. R., Rogerson, K. B., Ander, E. L., Watts, M. J., et al. (2011). Maize grain and soil surveys reveal suboptimal dietary selenium intake is widespread in Malawi. Sci. Rep. 1:72. doi: 10.1038/srep00072
Food and Agriculture Organization of the United Nations (FAO) (2020) FAOSTAT Food Balance Sheets. Available online at: www.faostat.org (accessed January 6 2020).
Gashu, D., Lark, R. M., Milne, A. E., Amede, T., Bailey, E. H., Chagumaira, C., et al. (2020). Spatial prediction of the concentration of selenium (Se) in grain across part of Amhara Region, Ethiopia. Sci. Total Environ. 733:139231. doi: 10.1016/j.scitotenv.2020.139231
Huang, T., Huang, Q., She, X., Ma, X., Huang, M., Cao, H., et al. (2019). Grain zinc concentration and its relation to soil nutrient availability in different wheat cropping regions of China. Soil Till. Res. 191, 57–65. doi: 10.1016/j.still.2019.03.019
Hussain, S., Qaswar, M., and Ahmad, F. (2018). Zinc application enhances grain zinc density in genetically-zinc-biofortified wheat grown on a low-zinc calcareous soil. J. Sci. Agric. 2, 107–110. doi: 10.25081/jsa.2018.v2.20181512
Joy, E. J. M., Ahmad, W., Zia, M. H., Kumssa, D. B., Young, S. D., Ander, E. L., et al. (2017). Valuing increased zinc (Zn) fertiliser-use in Pakistan. Plant Soil 411, 139–150. doi: 10.1007/s11104-016-2961-7
Joy, E. J. M., Broadley, M. R., Young, S. D., Black, C. R., Chilimba, A. D. C., Ander, E. L., et al. (2015a). Soil type influences crop mineral composition in Malawi. Sci. Total Environ 505, 587–595. doi: 10.1016/j.scitotenv.2014.10.038
Joy, E. J. M., Stein, A. J., Young, S. D., Ander, E. L., Watts, M. J., and Broadley, M. R. (2015b). Zinc-enriched fertilisers as a potential public health intervention in Africa. Plant Soil 389, 1–24. doi: 10.1007/s11104-015-2430-8
Karami, M., Afyuni, M., Khoshgoftarmanesh, A. H., Papritz, A., and Schulin, R. (2009). Grain zinc, iron, and copper concentrations of wheat grown in Central Iran and their relationships with soil and climate variables. J. Agric. Food Chem. 57, 10876–10882. doi: 10.1021/jf902074f
Khokhar, J. S., King, J., King, I. P., Young, S. D., Foulkes, M. J., De Silva, J., et al. (2020). Novel sources of variation in grain Zinc (Zn) concentration in bread wheat germplasm derived from Watkins landraces. PLoS ONE 15:e0229107. doi: 10.1371/journal.pone.0229107
Khokhar, J. S., Sareen, S., Tyagi, B. S., Singh, G., Chowdhury, A. K., Dhar, T., et al. (2017). Characterising variation in wheat traits under hostile soil conditions in India. PLoS ONE 12:e0179208. doi: 10.1371/journal.pone.0179208
Khokhar, J. S., Sareen, S., Tyagi, B. S., Singh, G., Wilson, L., King, I. P., et al. (2018). Variation in grain Zn concentration, and the grain ionome, in field-grown Indian wheat. PLoS ONE 13:e0192026. doi: 10.1371/journal.pone.0192026
King, J. C., Brown, K. H., Gibson, R. S., Krebs, N. F., Lowe, N. M., Siekmann, J. H., et al. (2016). Biomarkers of nutrition for development (BOND) – Zinc review. J. Nutr. 146, 858S−885S. doi: 10.3945/jn.115.220079
Krauss, M., Wilcke, W., Kobza, J., and Zech, W. (2002). Predicting heavy metal transfer from soil to plant: potential use of Freundlich-type functions. J. Plant Nutr. Soil Sci. 165, 3–8.
Kumssa, D. B., Joy, E. J. M., Ander, E. L., Watts, M. J., Young, S. D., Walker, S., et al. (2015). Dietary calcium and zinc deficiency risks are decreasing but remain prevalent. Sci. Rep. 5:10974. doi: 10.1038/srep10974
Ligowe, I. S., Phiri, F. P., Ander, E. L., Bailey, E. H., Chilimba, A. D. C., Gashu, D., et al. (2020). Selenium (Se) deficiency risks in sub-Saharan African food systems and their geospatial linkages. Proc. Nutr. Soc. doi: 10.1017/S0029665120006904. [Epub ahead of print].
Likoswe, B. H., Phiri, F. P., Broadley, M. R., Joy, E. J. M., Patson, N., Maleta, K. M., et al. (2020). Inflammation adjustment by two methods decreases the estimated prevalence of zinc deficiency in Malawi. Nutrients 12:1563. doi: 10.3390/nu12061563
Lindsay, W. L., and Norvell, W. A. (1978). Development of a DTPA soil test for zinc, iron, manganese, and copper. Soil Sci. Soc. Am. J. 42, 421–448. doi: 10.2136/sssaj1978.03615995004200030009x
Manzeke, G. M., Mtambanengwe, F., Nezomba, H., and Mapfumo, P. (2014). Zinc fertilization influence on maize productivity and grain nutritional quality under integrated soil fertility management in Zimbabwe. Field Crops Res. 166, 128–136. doi: 10.1016/j.fcr.2014.05.019
Manzeke, M. G., Mtambanengwe, F., Watts, M. J., Broadley, M. R., Lark, R. M., and Mapfumo, P. (2020). Nitrogen applications improve the efficiency of agronomic zinc biofortification in smallholder cropping. Agron. J. 112, 2256–2274. doi: 10.1002/agj2.20175
Manzeke, M. G., Mtambanengwe, F., Watts, M. J., Hamilton, E. M., Lark, R. M., Broadley, M. R., et al. (2019). Fertilizer management and soil type influence grain zinc and iron concentration under contrasting smallholder cropping systems in Zimbabwe. Sci. Rep. 9:6445. doi: 10.1038/s41598-019-42828-0
McDonald, C. M., Suchdev, P. S., Krebs, N. F., Hess, S. Y., Wessells, K. R., Ismaily, S., et al. (2020). Adjusting plasma or serum zinc concentrations for inflammation: Biomarkers Reflecting Inflammation and Nutritional Determinants of Anemia (BRINDA) project. Am. J. Clin. Nutr. 111, 927–937. doi: 10.1093/ajcn/nqz304
Oury, F. X., Leenhardt, F., Remesy, C., Chanliaud, E., Duperrier, B., Balfourier, F., et al. (2006). Genetic variability and stability of grain magnesium, zinc and iron concentrations in bread wheat. Eur. J. Agron. 25, 177–185. doi: 10.1016/j.eja.2006.04.011
Qaswar, M., Hussain, S., and Rengel, Z. (2017). Zinc fertilisation increases grain zinc and reduces grain lead and cadmium concentrations more in zinc-biofortified than standard wheat cultivar. Sci. Total Environ. 605–606, 454–460. doi: 10.1016/j.scitotenv.2017.06.242
R Core Team (2017). R: A Language and Environment for Statistical Computing. Vienna: R Foundation for Statistical Computing. Available online at: https://www.R-project.org/ (accessed October 16, 2019)
Ram, H., Rashid, A., Zhang, W., Duarte, A. P., Phattarakul, N., Simunji, S., et al. (2016). Biofortification of wheat, rice and common bean by applying foliar zinc fertilizer along with pesticides in seven countries. Plant Soil 403, 389–401. doi: 10.1007/s11104-016-2815-3
Rehman, A., Farooq, M., Naveed, M., Nawaz, A., and Shahzad, B. (2018a). Seed priming of Zn with endophytic bacteria improves the productivity and grain biofortification of bread wheat. Eur. J. Agron. 94, 98–107. doi: 10.1016/j.eja.2018.01.017
Rehman, A., Farooq, M., Nawaz, A., As-Sadi, A. M., Al-Hashmi, K. S., Nadeem, F., et al. (2018b). Characterizing bread wheat genotypes of Pakistani origin for grain zinc biofortification potential. J. Sci. Food Agric. 98, 4824–4836. doi: 10.1002/jsfa.9010
Sazawal, S., Dhingra, U., Dhingra, P., Dutta, A., Deb, S., Kumar, J., et al. (2018). Efficacy of high zinc biofortified wheat in improvement of micronutrient status, and prevention of morbidity among preschool children and women - a double masked, randomized, controlled trial. Nutr. J. 17:86. doi: 10.1186/s12937-018-0391-5
Singh, R., and Velu, G. (2017). Zinc-Biofortified Wheat: Harnessing Genetic Diversity for Improved Nutritional Quality. Science Brief: Biofortification, No. 1 (May 2017). Bonn: CIMMYT, HarvestPlus, and the Global Crop Diversity Trust.
Siyame, E. W. P., Hurst, R., Wawer, A. A., Young, S. D., Broadley, M. R., Chilimba, A. D. C., et al. (2013). A high prevalence of zinc- but not iron-deficiency among women in rural Malawi: a cross-sectional study. Int. J. Vitam. Nutr. Res. 83, 176–187. doi: 10.1024/0300-9831/a000158
Smith, M. R., and Myers, S. S. (2018). Impact of anthropogenic CO2 emissions on global human nutrition. Nat. Clim. Chang 8, 834–839. doi: 10.1038/s41558-018-0253-3
Velu, G., Singh, R., Balasubramaniam, A., Mishra, V. K., Chand, R., Tiwari, C., et al. (2015). Reaching out to farmers with high zinc wheat varieties through public-private partnerships – an experience from Eastern-Gangetic Plains of India. Adv. Food Technol. Nutr. Sci. Open J. 1, 73–75. doi: 10.17140/AFTNSOJ-1-112
Walkley, A. (1947). A critical examination of a rapid method for determining organic carbon in soils: effect of variations in digestion conditions and of organic soil constituents. Soil Sci. 63, 251–263.
Wessells, K. R., and Brown, K. H. (2012). Estimating the global prevalence of zinc deficiency: results based on zinc availability in national food supplies and the prevalence of stunting. PLoS ONE 7:e50568. doi: 10.1371/journal.pone.0050568
White, P. J., and Broadley, M. R. (2009). Biofortification of crops with seven mineral elements often lacking in human diets-iron, zinc, copper, calcium, magnesium, selenium and iodine. New Phytol. 182, 49–84. doi: 10.1111/j.1469-8137.2008.02738.x
WHO/FAO (2019). General Standard for Contaminants and Toxins in Food and Feed (CODEX STAN 193-1995). Rome; Geneva: Food and Agriculture Organization; World Health Organization. Available online at: http://www.fao.org/fao-who-codexalimentarius/codex-texts/list-standards/en/ (accessed August 24, 2020).
Wood, S. A., Tirfessa, D., and Baudron, F. (2018). Soil organic matter underlies crop nutritional quality and productivity in smallholder agriculture. Agric. Ecosyst. Environ. 266, 100–108. doi: 10.1016/j.agee.2018.07.025
Xue, Y. F., Yue, S. C., Zhang, Y. Q., Cui, Z. L., Chen, X. P., Yang, F. C., et al. (2012). Grain and shoot zinc accumulation in winter wheat affected by nitrogen management. Plant Soil 361, 153–163. doi: 10.1007/s11104-012-1510-2
Yaseen, M. K., and Hussain, S. (2020). Zinc-biofortified wheat required only a medium rate of soil zinc application to attain the targets of zinc biofortification. Arch. Agron. Soil Sci. doi: 10.1080/03650340.2020.1739659
Yousaf, S., Akhtar, M., Sarwar, N., Ikram, W., and Hussain, S. (2019). Sustaining zinc bioavailability in wheat grown on phosphorus amended calcisol. J. Cereal Sci. 90:102846. doi: 10.1016/j.jcs.2019.102846
Zadoks, J. K., Chang, T. T., and Konzak, C. F. (1974). A decimal code for the growth stages of cereals. Weed Res. 14, 415–421. doi: 10.1111/j.1365-3180.1974.tb01084.x
Zhao, A., Wang, B., Tian, X., and Yang, X. (2019). Combined soil and foliar ZnSO4 application improves wheat grain Zn concentration and Zn fractions in a calcareous soil. Eur. J. Soil Sci. 71, 681–694. doi: 10.1111/ejss.12903
Keywords: biofortification, calcium (Ca), cadmium (Cd), environment, genotype, G×E×M, iron (Fe), selenium (Se)
Citation: Zia MH, Ahmed I, Bailey EH, Lark RM, Young SD, Lowe NM, Joy EJM, Wilson L, Zaman M and Broadley MR (2020) Site-Specific Factors Influence the Field Performance of a Zn-Biofortified Wheat Variety. Front. Sustain. Food Syst. 4:135. doi: 10.3389/fsufs.2020.00135
Received: 07 June 2020; Accepted: 29 July 2020;
Published: 17 September 2020.
Edited by:
Abdul Wakeel, University of Agriculture Faisalabad, PakistanReviewed by:
Levent Ozturk, Sabancı University, TurkeyCopyright © 2020 Zia, Ahmed, Bailey, Lark, Young, Lowe, Joy, Wilson, Zaman and Broadley. This is an open-access article distributed under the terms of the Creative Commons Attribution License (CC BY). The use, distribution or reproduction in other forums is permitted, provided the original author(s) and the copyright owner(s) are credited and that the original publication in this journal is cited, in accordance with accepted academic practice. No use, distribution or reproduction is permitted which does not comply with these terms.
*Correspondence: Martin R. Broadley, bWFydGluLmJyb2FkbGV5QG5vdHRpbmdoYW0uYWMudWs=
Disclaimer: All claims expressed in this article are solely those of the authors and do not necessarily represent those of their affiliated organizations, or those of the publisher, the editors and the reviewers. Any product that may be evaluated in this article or claim that may be made by its manufacturer is not guaranteed or endorsed by the publisher.
Research integrity at Frontiers
Learn more about the work of our research integrity team to safeguard the quality of each article we publish.