 Luitfred Donacian Kissoly
 Sabina Khatri Karki
 Ulrike Grote2
- 1Department of Economics and Social Studies, School of Spatial Planning and Social Sciences, Ardhi University, Dar es Salaam, Tanzania
- 2Institute of Environmental Economics and World Trade, Faculty of Business and Economics, Leibniz University Hannover, Hanover, Germany
Farm production diversity is widely promoted as a strategy for enhancing smallholders' food and nutrition security. Nonetheless, empirical evidence from the rural smallholder context is still mixed. This study compares the nature, determinants and influence of farm production diversity on household dietary diversity in rural and peri-urban settings in Kenya and Tanzania. Descriptive and econometric analyses are employed using household-level survey data from four counties in Kenya (n = 1212) and two districts in Tanzania (n = 899). Results show notable variations in farm production diversity in the two countries as well as varying levels of household dietary diversity. For both countries, results further show that, farm production diversity has a positive and significant influence on indicators of household dietary diversity. However, this influence is more pronounced to households in remote rural settings. In peri-urban and rural areas with better market access, production diversity is generally lower but dietary diversity higher. These findings imply that although production diversity remains an important factor in ensuring enhanced household dietary diversity, it is imperative for policies related to food and nutrition security to consider context specific production and market-related aspects of smallholder agriculture. That is, while interventions focusing on farm production diversity may be important in rural contexts with poor market access, addressing market related bottlenecks can be more beneficial in rural and urban areas with better market access.
Introduction
Enhancing smallholder farm production diversity has recently gained increased attention owing to its potential to enhance rural households' food and nutrition security (Fanzo et al., 2013; Koppmair et al., 2017; Ecker, 2018). This comes against the backdrop of persistent undernourishment and increasing vulnerability of rural households, particularly in developing countries, due to climate change and weather related shocks (FAO et al., 2014; Grote, 2014). Despite the fact that challenges of food and nutrition security are global in nature, the magnitude of the problem is immense in Sub-Saharan Africa. For example, prevalence of undernourishment is the highest where about 23% of the population is undernourished (FAO and ECA, 2018). In Kenya and Tanzania, in particular, the prevalence of undernourishment in the total population stands at about 29.4 and 30.7%, respectively (FAO et al., 2019). In rural areas, undernourishment is generally more pronounced than in urban settings.
Agricultural diversification is among widely advocated strategies to address the above challenges (Powell et al., 2015; Burlingame and Dernini, 2012; Pellegrini and Tasciotti, 2014; Bahadur et al., 2015; Koppmair et al., 2017). For smallholders, agriculture plays an important role in their food security and livelihood outcomes (Herrero et al., 2010; IFAD UNEP., 2013). Essentially, it is a lifeline for rural households as it enhances food security through direct consumption of food from own production as well as from incomes obtained from sale of farm produce which is used for purchases of food (World Bank, 2007). Farm production diversity, which entails a variety of plant and animal species maintained at the farm, is seen as a potential strategy for improving smallholders' food and nutritional outcomes, and thus assumed to enhance smallholders' access to a diversity of food products (Burlingame and Dernini, 2012; Fanzo et al., 2013). Agricultural diversification is thus.
Numerous recent studies, however, acknowledge that the relationship between farm production diversity and dietary diversity is complex and inherently confounded by various other factors such as market access (Jones et al., 2014; Sibhatu et al., 2015). Indeed, empirical literature on this relationship reveals mixed results. On the one hand, several studies find that smallholder farm production diversity is positively related to household dietary diversity (Jones et al., 2014; Pellegrini and Tasciotti, 2014; Kumar et al., 2015). In this strand of literature, increased dietary diversity is linked to farm production diversity mainly through direct subsistence consumption of own farm produce and through purchase of food from markets using farm income obtained from selling part of their agriculture produce. On the other hand, there is substantial literature which shows that farm production diversity is not always associated with dietary diversity (Bahadur et al., 2015; Sibhatu et al., 2015; Ng'endo et al., 2016). This strand argues that, apart from production diversity, markets play a major role in enhancing dietary diversity. Essentially markets offer opportunities to rural farm households to sell their farm produce as well as purchase different food varieties.
The present study contributes to this literature by comparatively assessing the nature, determinants and role of farm production diversity on household dietary diversity using the case of agricultural households in Kenya and Tanzania. A few studies look at the relationship between farm production diversity and dietary diversity at sub-national levels (e.g., Herforth, 2010; Jones et al., 2014). Despite important insights generated, these studies are limited in terms of representing diverse market and agro-ecologic contexts. Other existing comparative studies mainly refer to country averages (e.g., Pellegrini and Tasciotti, 2014; Sibhatu et al., 2015). We use survey data from smallholder households conducted in various regions in Kenya and Tanzania, hence capturing diverse market and agro-ecological contexts. For Tanzania, this include villages in (1) Kilosa district which poses semi-humid agro-ecology and relatively better market access and (2) Chamwino district which has less market access with semi-arid agro-ecological characteristics (Environment Statistics, 2015). For the case of Kenya, the survey covered Kiambu and Nakuru counties—representing peri-urban characteristics—and Kisii and Kakamega representing a rural context. In addition, we analyze the role of farm production diversity on seasonal dietary diversity of smallholders. Recent studies on agricultural diversification have also focused on the potential benefits of farm production diversity on seasonal dietary diversity of smallholder households (see for example Herforth, 2010; Ng'endo et al., 2016). However, empirical evidence on this potential is still limited. We therefore use dietary diversity indicators in planting, pre-harvest and post-harvest agricultural seasons. This is especially important given the seasonal food insecurity experienced by most rural households (Vaitla et al., 2009; Bacon et al., 2014).
Against this background, this comparative study intends (1) to examine the nature and determinants of farm production diversity and (2) to analyze the influence of farm production diversity on household dietary diversity using the diverse market and agro-ecological contexts of Kenya and Tanzania. The rest of the study is organized as follows. The next section describes the study areas and data, while section three elaborates on the conceptual framework and methodology used in this study. Results and discussion are presented in section four. Section 5 summarizes the main results and gives concluding remarks.
Methods
Study Areas and Data
This study uses household-level survey data from Kenya and Tanzania collected in 2014. For Kenya, the data was collected from four counties namely Kisii, Kakamega, Kiambu and Nakuru (See Figure 1). These counties were classified into rural and peri-urban based on the proximity to the main urban centers. Kisii and Kakamega counties represent a rural context while Kiambu and Nakuru counties can be classified as peri-urban. From respective counties, sub-counties and divisions were selected based on the information from district agricultural offices. Then locations/wards were selected randomly from each selected divisions. Finally, households were randomly selected from these locations resulting into a total sample size of 1,150 households where 766 households belong to rural counties and 384 households are from peri-urban counties.
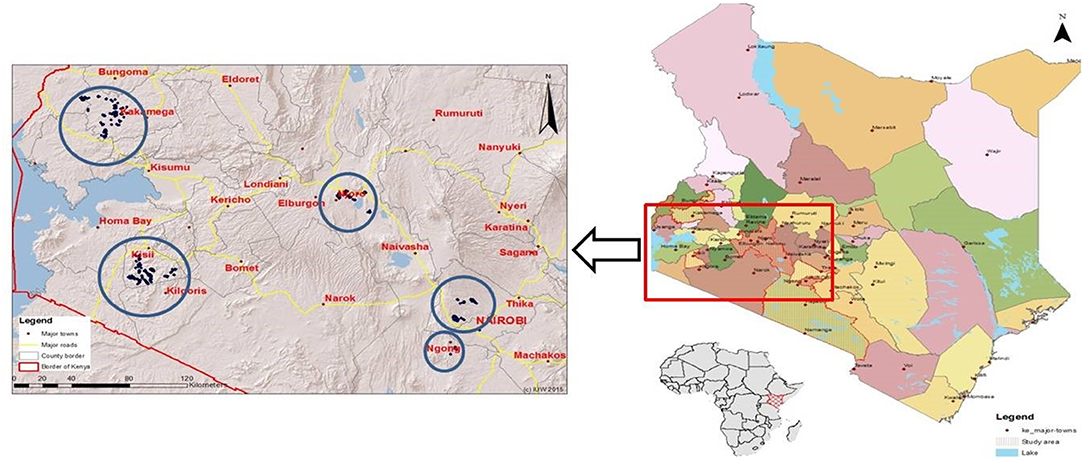
Figure 1. Map of study area-Kenya. Source: HORTINLEA survey, 2014.
In Tanzania, data was collected from smallholders in two districts, Kilosa and Chamwino (See Figure 2). Three villages were selected from each district based on several criteria. These included having (1) rain-fed cropping systems, (2) livestock integration in the production system, (3) similar climate by district, (4) different market access characteristics and (5) village size between 800 and 1500 households. The villages include Changarawe, Nyali and Ilakala in Kilosa district and Ilolo, Ndebwe, and Idifu in Chamwino district. Household lists were prepared covering all households in the respective villages. From these lists, 150 households were randomly selected to participate in the survey with distribution within each village being proportional to sub-village sizes. In total 900 households were interviewed.
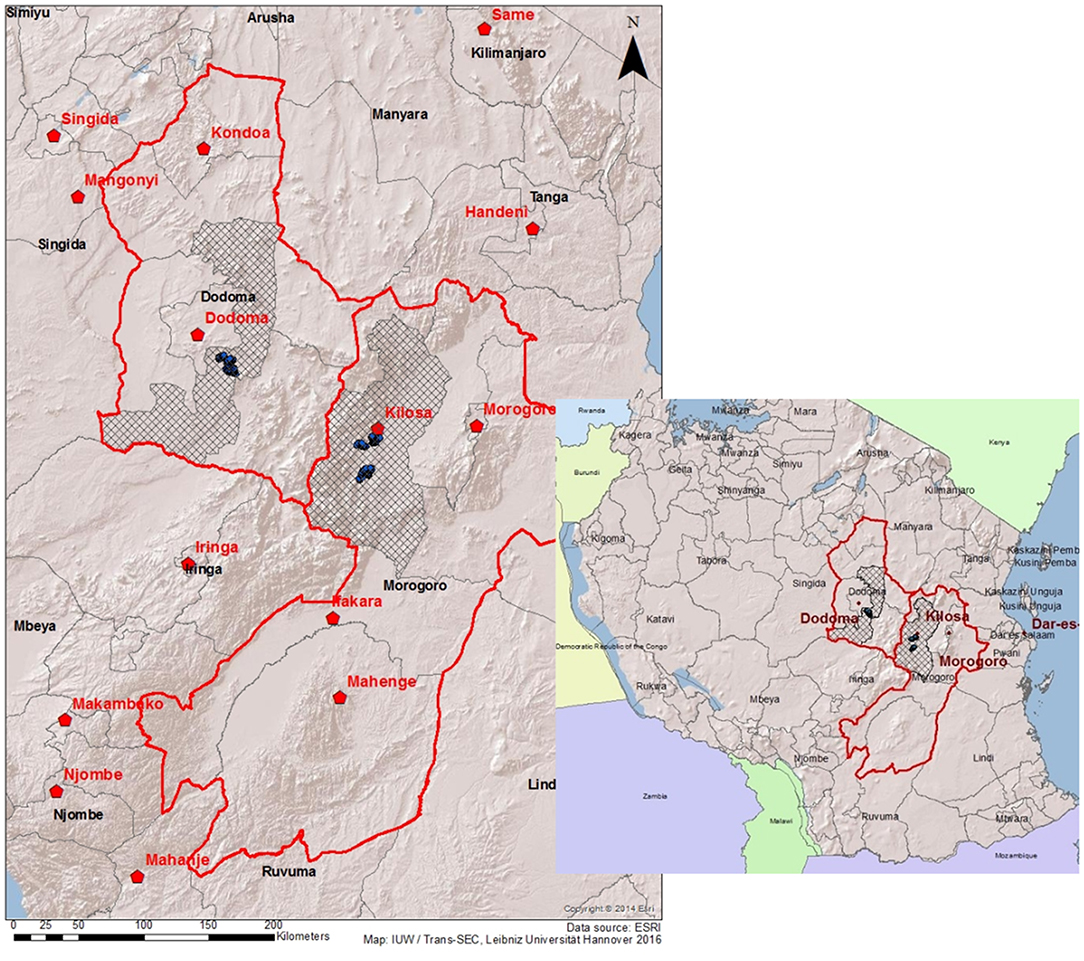
Figure 2. Map of study area—Tanzania. Source: Trans-Sec survey, 2014.
A summary of key characteristics of the study areas is provided in Table 1 while a map of the study sites is presented in Figure 1. Notably, disparities are observed in the two study areas, in particular, relating to agricultural potential and access to major markets. These have important implications in not only production diversity but also dietary diversity. In both Kenya and Tanzania, structured household and village questionnaires were used as key survey instruments. The household-level questionnaire contains detailed sections to capture data on household demographic, social, economic and food security characteristics. The village-level questionnaires were administered to village authorities to acquire important information at village-level such as on infrastructure, economic profiles and other key services.
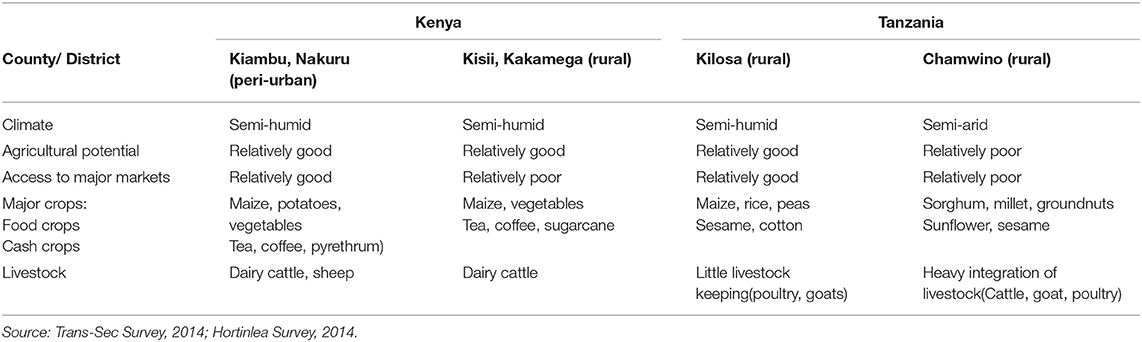
Table 1. Summary of main characteristics of study area.
Conceptual Framework and Methodology
In assessing and comparing the role of farm production diversity on household dietary diversity in Kenya and Tanzania, we conceptualize key relationships as follows (Figure 3). Smallholder choices of livelihood strategies (such as diversity in farm production) and the resultant livelihood outcomes (such as household dietary diversity) are likely to depend largely on livelihood assets (Scoones, 1998; Barrett et al., 2001). These are in terms of natural (e.g., land), physical (e.g., farm equipment or assets), social (e.g., information networks), human (e.g., education and labor) and financial (e.g., access to credit) capitals owned. From the Sustainable Livelihoods Approach (SLA), farm production diversity can be viewed as a livelihood strategy which is influenced by household capitals. For households' livelihood outcomes, we assume that dietary diversity is influenced by farm production diversity as well as the existing household capitals in terms of socio-economic characteristics and market and agro-ecological characteristics. Worth noting, as pointed out in the livelihoods approach, livelihood outcomes also, in return, influence livelihood assets (dash line in Figure 3).
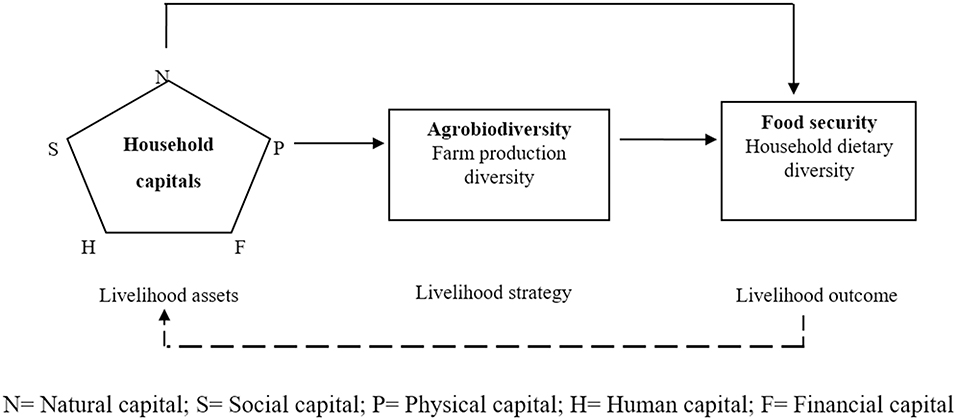
Figure 3. Conceptual framework (Authors' construction based on Scoones, 1998).
Measurement of Farm Production Diversity and Dietary Diversity
Several studies have proposed and used various measures of farm production diversity and dietary diversity. Starting with farm production diversity, different measures have evolved from previous studies that focused on assessing genetic diversity at the farm and on biodiversity (Hawksworth, 1995; Meng et al., 2010). In general, these measures capture species diversity and different nutritional functions of crops and livestock species produced (Last et al., 2014; Berti, 2015). Among the widely used are count indicators which are constructed as simple count variables capturing both crop produced and livestock species kept at the farm. However, these do not capture the different nutritional functions of the crops and livestock under consideration (Berti, 2015). This study therefore uses the number of food groups produced on the farm to ascertain the level of production diversity1. Based on our data, and to aid comparison between Kenya and Tanzania, we construct a diversity score based on 9 food groups. These are cereals; roots, tubers and plantains; pulses, seeds and nuts; fruits; vegetables; fish; meat; eggs; and milk and dairy products. From this production diversity score we are then able to capture the different nutritional functions of crop and livestock produced by smallholder as proposed by Berti (2015). Therefore, a household cultivating rice, groundnuts and in addition keeping chicken will have a production diversity score of 4 as they come from 4 different food groups i.e., cereals; pulses, seeds and nuts; meat; and eggs. Conversely, for a household cultivating rice, millet and maize and also keeping cattle the production diversity score will be 3 i.e., cereals; meat; and milk and dairy products.
Regarding dietary diversity, we use two indicators. The first is the Household Dietary Diversity Score (HDDS). HDDS is a good proxy indicator for diet quality and is documented to correlate well with important nutrition outcomes such as anthropometric status (Swindale and Bilinsky, 2006; Moursi et al., 2008). Following Swindale and Bilinsky (2006), we construct the HDDS from 9 different food groups consumed by a household in the previous normal week. The 9 food groups correspond to the classification used in the farm production diversity indicator above. The HDDS is also calculated for different agricultural seasons in the year based on how many days in a normal week households ate a particular food group in each season i.e., planting, pre-harvest and post-harvest seasons. Despite involving long recall periods, this indicator gives essential insights into the levels of dietary diversity for various agricultural seasons. The second dietary indicator is the Food Variety Score (FVS) which captures the number of different food items consumed by a household in a given reference period (Hatley et al., 1998). We also use the previous normal week as a recall period. Unlike HDDS which captures different food groups, FVS counts all single foods consumed.
Assessing Determinants of Farm Production Diversity
Deriving from the conceptual framework, farm production diversity is influenced by various livelihood assets such as human, natural, social, physical and financial capital. We therefore assess the determinants of farm production diversity using relevant count data models: Poisson and Negative Binomial regression models a regression model specified as:
where PDi represents the farm production diversity for household i. This is a score capturing the number of food groups produced by the household. Xi represents a vector of explanatory variables while δ is a vector of parameters to be estimated and ui is the error term (see the list and description of variables used in the Appendix). As presented in the conceptual framework, variables predicting household farm production diversity constitute human capital (e.g., age, gender, education, and labor), natural capital (e.g., land and rainfall), physical capital (e.g., distance and assets), social capital (e.g., market information), financial capital (e.g., credit access, off-farm and non-farm employment) and other factors such as risk attitude and shocks.
Evaluating the Relationship Between Farm Production Diversity and Dietary Diversity
Household dietary diversity is assumed to be influenced by farm production among other factors. To specifically analyze this relationship for Kenya and Tanzania, we also specify a regression model in which household dietary diversity is determined by farm production diversity and other important control variables (see the list and description of variables used in the Appendix). This is given as follows:
where CDi captures household dietary diversity for each individual household i as measured by the HDDS and FVS. For seasonal dietary diversity, the HDDS indicators for planting, pre-harvest and post-harvest are used. PDi is the farm production diversity, our main determinant of interest. Xi represents a vector of other important independent variables influencing dietary diversity. β and δ are parameters to be estimated, while ui represents the error term.
Apart from farm production diversity, household dietary diversity can be influenced by household socio-economic characteristics such as age and gender of the household head which may determine households' dietary preferences and allocation of household resources toward food consumption (Jones et al., 2014). Also, household ownership of productive assets such as labor and land may play an important role in improving dietary diversity through enhanced agricultural production and farm incomes. Off-farm incomes are also vital in enhancing dietary diversity through increased household food consumption expenditure and access to diverse food items from markets (Jones et al., 2014; Sibhatu et al., 2015). This implies that, market access is an essential element in achieving household dietary diversity. Proximity to markets is thus expected to positively influence dietary diversity as it improves households' access to a diversified food portfolio as well as income generating opportunities.
As noted, both specified relationships above in equations (1) and (2) are estimated with count data models i.e., Poisson and negative binomial regression models owing to the nature of our diversity indicators. We first carry out over-dispersion tests in our dependent variables to ascertain the need for employing a Poisson or negative binomial regression. For equi-dispersion, Poisson regression is used while the negative binomial regression is used in case of over-dispersed count data. Also, potential collinearity among explanatory variables is tested. As the present study rely on cross-section data, it must be pointed out that the results enable us to only assess potential associations between our variables of interest. Therefore, caution should be taken when interpreting the results as they may not necessarily imply causation.
Results and Discussion
Household and Farm Characteristics in Kenya and Tanzania
Descriptive statistics in Table 2 show that notable differences exist in key characteristics at household and farm level. In terms of human capital, results show that household heads in Kenya are, on average, older but with more labor capacity at the household level compared to their counterparts in Tanzania. Moreover, these households have a higher proportion of educated and male-headed households. Regarding natural capital, smallholders in Kenya possess less land but receive substantially higher average annual rainfall. On the contrary, smallholders in Tanzania own about twice the amount of land compared to those in Kenya but receive much less average annual rainfall. For Tanzania, large parts of Chamwino district are sparsely populated and characterized by a “pastoralist/agro-pastoralist” farming system which requires on average large areas of land (Mnenwa and Maliti, 2010). With regards to physical and social capital, while asset holding is relatively the same in both countries, households in Kenya are closer to markets compared to those in Tanzania. However, a smaller proportion has access to market information in Kenya. Concerning financial capital, households in Tanzania are more enterprising with a larger proportion having access to non-farm self-employment compared to those in Kenya. Similarly, off-farm employment is higher in Tanzania than in Kenya suggesting that a greater proportion of household members resort to casual work off their farms. However, households in Kenya have far better access to credit compared to Tanzania. This may be attributed to the peri-urban proximity to key services for the case of Kenya.
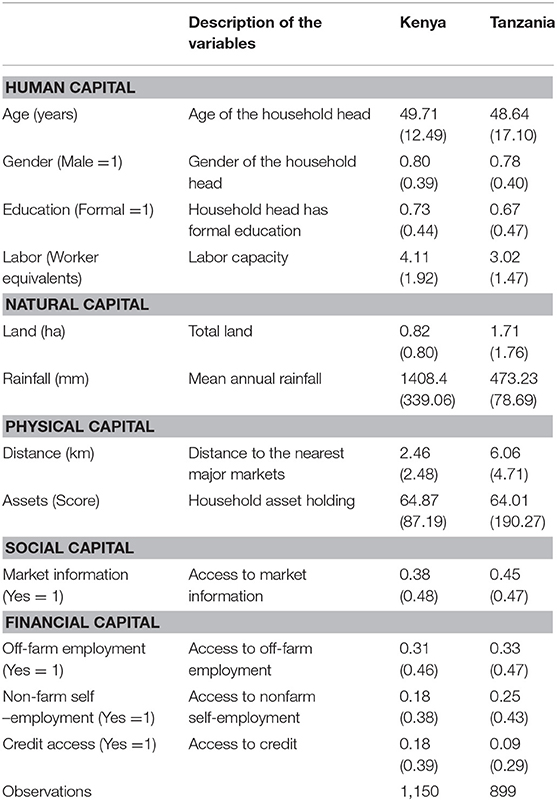
Table 2. Descriptive statistics of key household and farm characteristics in Kenya and Tanzania [Mean(Standard deviation)].
Comparison of Farm Production Diversity and Dietary Diversity
In terms of diversity, results from Table 3 show that, overall, smallholders in Kenya maintain a higher diversity of farm production compared to those in Tanzania. Similarly, household dietary diversity in Kenya, both in terms of HDDS and FVS is higher compared to that of Tanzania. The apparent, contrasting difference between Kenya and Tanzania with regards to both production diversity as well as dietary diversity can be attributed, in part, to existing differences in territorial characteristics in particular climate and agricultural potential. For example, the rural counties of Kisii and Kakamega as well as peri-urban Kiambu and Nakuru counties are all found in a semi-humid climate which particularly supports production of diverse portfolio of crops. As such, these countries have a relatively good agricultural potential. Conversely, the districts in Tanzania are characterized with semi-humid and semi-arid climate, which explains, partially, the observed lower levels of diversity in production and diets when compared to Kenya. However, diversity within the two countries reveals interesting results. In Kenya, farm production diversity is significantly lower for the peri-urban counties of Nakuru and Kiambu as compared to the rural counties of Kisii and Kakamega. Similarly, for the case of Tanzania, Kilosa district (with better agricultural potential and better market access) has significantly lower farm production diversity compared to Chamwino district. However, in both countries dietary diversity is significantly higher for the areas with lower farm production diversity, i.e., Nakuru/Kiambu counties in Kenya and Kilosa district in Tanzania. This underscores the argument that farm production diversity is only one among several factors influencing dietary diversity.
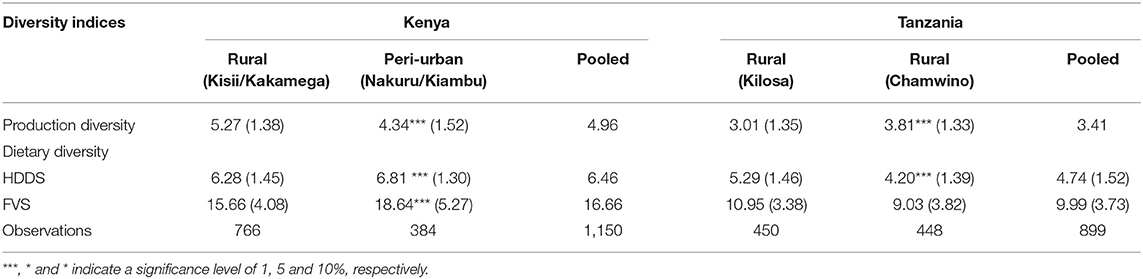
Table 3. Comparison of farm production and dietary diversity in Kenya and Tanzania study areas [Scores: Mean (Standard deviation)].
Determinants of Farm Production Diversity
Table 4 presents the estimation results for determinants of farm production diversity in Kenya and Tanzania. Overall, the results show that farm production diversity is influenced by numerous human, natural, physical, social, financial and other factors. However, similarities and differences exist in how these factors influence production diversity in the two case study countries.
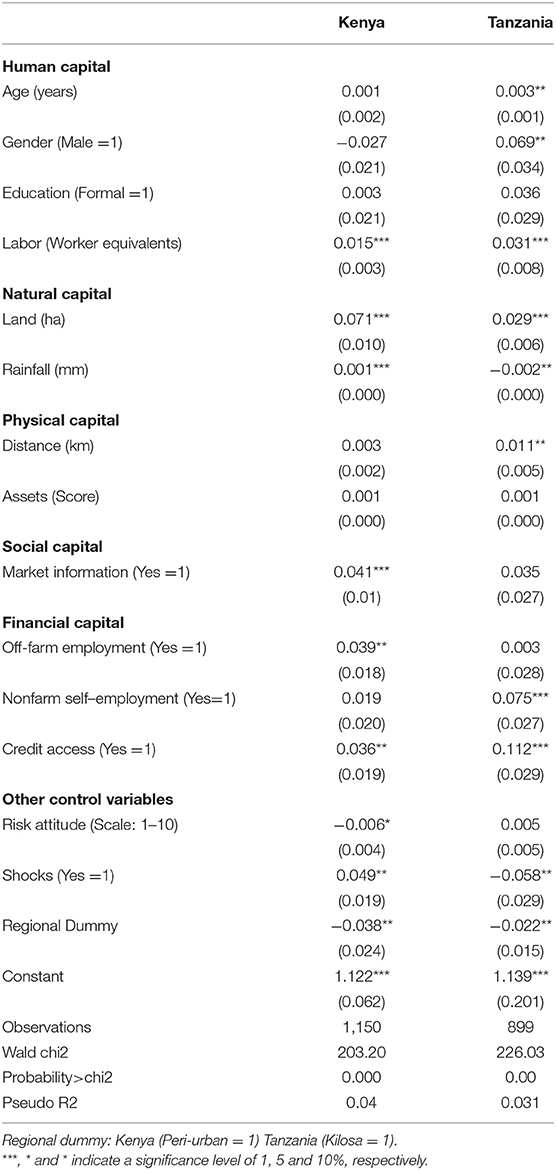
Table 4. Regression results of determinants of production diversity [coefficients (standard errors)].
In both countries, labor, land and credit access have a positive and significant contribution to farm production diversity. These constitute important household endowments which are critical in influencing the number of crops produced and livestock species kept by a household (Benin et al., 2004). The positive and significant effect of labor on farm production diversity indicates that households with more resources in terms of labor capacity are able to meet the increased labor demand required in maintaining higher farm production diversity. Labor capacity is especially important in rural farming systems, which involve labor-intensive cultivation technologies and are likely to maintain higher levels of biodiversity (Smale, 2006). As noted, results also show that land influences farm production diversity positively. Land is an important determinant as it enhances the capacity of smallholders to exploit returns arising from strategic complementarities in their activities such as crop-livestock integration (Barrett et al., 2001). From our data, smallholders in areas with more land (such as Kisii and Kakamega counties in Kenya and Chamwino district in Tanzania) have, on average, higher farm production diversity. These results are in line with the findings of Benin et al. (2004) and Di Falco et al. (2010) in Ethiopia where land plays an important positive role in enhancing crop diversity. With regards to credit access, farm production diversity is partly enhanced by the availability of important inputs for both, crops and livestock (Smale, 2006). These include seeds and fertilizer for crops and medicine and veterinary services for livestock. Access to credit may be particularly necessary for market-oriented smallholders such as those in peri-urban areas in Kenya.
As aforementioned, country-specific differences exist in how various factors influence farm production diversity. In Kenya, rainfall has a positive and significant effect on farm production diversity. The reason for this may be that, given the existing agro-ecological characteristics, availability of rainfall is likely to increase diversity maintained by smallholders, especially in terms of different crop species (Di Falco et al., 2010). However, for Tanzania, increased rainfall is associated with less farm production diversity. This may be explained by the regional effects where farm production is lower in Kilosa district with relatively higher levels of rainfall unlike in the semi-arid Chamwino district in which smallholders maintain higher levels of farm production diversity. Again, Di Falco et al. (2010) argue that, in presence of harsher environmental conditions, smallholders may produce more diverse crops as a risk mitigation strategy in case of crop loss or other shocks.
Distance to the nearest major markets is significantly associated with increased farm production diversity only in Tanzania. This implies that smallholders in distant and less accessible areas tend to maintain higher levels of diversity in their farm production so as to circumvent higher transaction costs involved in acquiring food from markets (Benin et al., 2004); Pellegrini and Tasciotti (2014). Social capital, which is captured by households' access to market information, is significant in influencing farm production positively for the case of Kenya. In the rural and peri-urban areas, most farmers are engaged in the cultivation of horticultural crops and widely sell African Indigenous Vegetables (Khatri Karki, 2018). Access to market information appears to play an important role for this category of smallholders. This role is, however, not significant in Tanzania as markets and market transactions are relatively underdeveloped in most villages constituting the sample, especially in Chamwino district.
In terms of household financial capital, off-farm employment and non-farm self-employment are positively and significantly associated with farm production diversity. While off-farm employment is significant only for Kenya, non-farm self-employment is significant for Tanzania. Both are important sources of income to smallholders and they enable financing of various farm production operations such as inputs purchases. In Kenya, off-farm employment mostly takes the form of construction work or wholesale/retail trade (Khatri Karki, 2018). For Tanzania, information from qualitative interviews revealed that off-farm employment is less remunerative as it involves provision of manual labor to different agricultural work such as weeding or harvesting. However, income from non-farm self-employment (such as from petty trading), provide essential sources of finance to smallholders for investing in agriculture.
With regards to other controls, results show that risk attitude could play a vital role in influencing farm production diversity in Kenya. Specifically, preparedness of a household to take risk has a negative and significant influence on farm production diversity. The reason for this may be that, smallholders who are more willing to take risks have a more specialized farm production portfolio as they aim at increasing efficiency and farm incomes. On the contrary, risk-averse smallholders are likely to maintain a more diverse farm production portfolio so as to reduce production risks (Di Falco and Chavas, 2009; Di Falco et al., 2010). Results further show that agricultural shocks have a significant positive influence on farm production diversity in Kenya, but a negative influence for the case of Tanzania. As argued by Di Falco and Chavas (2009), shocks may compel smallholders to maintain a higher diversity in their production as a risk mitigation strategy. However, shocks may also have a negative influence on farm production diversity, as is the case for Tanzania, when resource poor smallholders decide for a few highly resistant crops and livestock following an occurrence of a shock in the household. For most vulnerable smallholders, severe agricultural shocks may substantially reduce farm production capacity of households, thus negatively affecting farm production diversity. Locational influence is also notable. Households located in rural counties of Kenya and in the semi-arid Chamwino district in Tanzania maintain comparatively higher production diversity than their counterparts. These levels of production diversity can be in part explained by the relatively poor access to major markets in the rural counties in Kenya, and the semi-arid agro-ecology of Chamwino in Tanzania as well as the relative inaccessibility to major markets compared to Kilosa.
Role of Farm Production Diversity on Dietary Diversity
Results from the analysis of the relationship between farm production diversity and dietary diversity are presented in Table 5. Results summarize the influence of farm production diversity, together with other control variables, on consumption or dietary diversity in Kenya and Tanzania. Starting with farm production diversity, results show that it has a significant positive influence on dietary diversity in both countries. This relationship is observed for both indicators of dietary diversity, i.e., HDDS and FVS. An important implication here is that smallholders maintaining a higher diversity in their farm production portfolio (in both crops and livestock) benefit more in terms of diversity of their diets at the household level. This confirms that for smallholder households, agriculture is indispensable in improving diets either through increased consumption from own production or from markets through increased income from sale of agriculture produce (World Bank, 2007; Jones et al., 2014; Sibhatu et al., 2015).
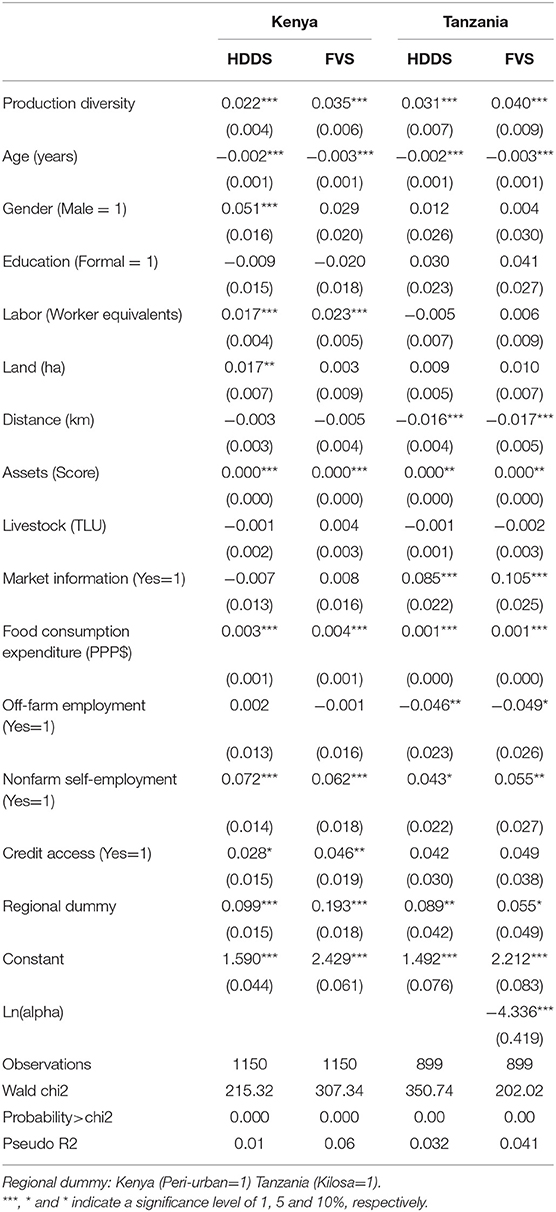
Table 5. Regression results of determinants of food consumption diversity (HDDS and FVS) [coefficients (standard errors)].
Role of Other Important Factors Influencing Dietary Diversity
The relationship between farm production diversity and dietary diversity is complex (Jones et al., 2014). Indeed, dietary diversity is also influenced by other factors beyond farm production diversity. Our results show that household endowments in terms of productive assets (such as land and labor), market related factors (such as distance and market information), access to off-farm and non-farm self-employment and location are important in influencing household dietary diversity. Specifically, land and labor are significantly and positively associated with dietary diversity for Kenya while ownership of assets has a positive influence for both countries. Apart from reflecting household wealth, ownership of assets, especially productive assets such as land and labor, contribute to households' capacity to produce both for home consumption and for sale hence enhancing access to a variety of food items at the household level. More important, smallholders may use their land and labor endowments to grow more varieties of nutrient-dense crops and keep livestock thus improving food self-sufficiency and dietary diversity (Jones et al., 2014; Bahadur et al., 2015; Mbwana et al., 2016).
Market related factors are also important determinants of dietary diversity. Distance to nearest major markets influences dietary diversity negatively for the case of Tanzania. This suggests that, with limited access to markets and other essential services, smallholders are not only constrained in terms of accessing a variety of food items from markets but also lack essential support infrastructure to improve their agricultural production. Dietary diversity is also positively related to access to market information for both countries, Kenya and Tanzania. Similarly, Sibhatu et al. (2015) stress the important role of market access and market transactions in enhancing dietary diversity. The reason is that smallholders rely on markets for generating important income for household food consumption as well as sourcing different food varieties.
Dietary diversity is also significantly influenced by household income. Our results show that food consumption expenditure and access to non-farm self-employment have a positive and significant effect on household dietary diversity for both Kenya and Tanzania. Access to remunerative non-farm self-employment income adds to household incomes and thus raises the households' purchasing power. With increased purchasing power, households may spend on more diverse food and hence improve their dietary diversity. Several studies note the positive role of increased household food consumption expenditure resulting from various income generating activities. For example, Jones et al. (2014) observe that dietary diversity was positively associated with household food expenditure. However, off-farm employment is negatively associated with dietary diversity for the case of Tanzania. As noted earlier, the less remunerative nature of off-farm employment means that it is done by the very poor households and thus its contribution to household dietary diversity is largely marginal.
Location characteristics have also significant influence on household dietary diversity. Being located in peri-urban counties (for Kenya) and those in Kilosa for Tanzania is positively associated with increased dietary diversity. With regards to Kenya, this may reflect the fact that households in peri-urban areas have more opportunities in terms of market access thus being able to sell their produce and also purchase different food items. For Tanzania, Kilosa district has more agricultural potential given its semi-humid agro-ecology and also has better market access thus impacting household dietary diversity positively unlike in Chamwino district which is semi-arid with low market access.
Farm Production Diversity and Seasonal Dietary Diversity
Results on the analysis of the potential of farm production diversity on the seasonal household dietary diversity are presented in Table 6. Overall, the results show that farm production diversity is associated with seasonal dietary diversity in both countries. In Kenya, farm production diversity has a positive and significant influence on dietary diversity during planting and post-harvest seasons. With regards to Tanzania, farm production diversity is consistently positively associated with the indicator of dietary diversity for planting, pre-harvest and post-harvest seasons. This result may be attributed to the existing agro-ecology as well food insecurity coping strategies employed by households. In the semi-arid district of chamiwno, where production diversity is higher than in the semi-humid Kilosa district, households have a tradition of storing harvested crops (mainly Groundnuts, Dried Leafy Vegetables, Sorghum, and Millet) for months after harvest. This is among several widespread coping strategy to address food insecurity that characterizes the villages because of semi-aridity (Mbwana et al., 2016). In addition, households in Chamwino also rely on livestock, especially during months with high levels of food shortages. These results imply that increased farm production diversity may have additional potential benefits of improving household dietary diversity also across different agricultural seasons. As widely noted, most smallholder households' consumption is highly dependent on agricultural seasons. Seasons before harvest (i.e., planting and pre-harvest) are mainly characterized by sporadic food insecurity when compared to post-harvest season (Vaitla et al., 2009). With farm production diversity, smallholders can therefore access various crops at different periods of the year as different crops mature and are harvested at different seasons of the year (Herforth, 2010). This potential may also be applicable to different livestock species.
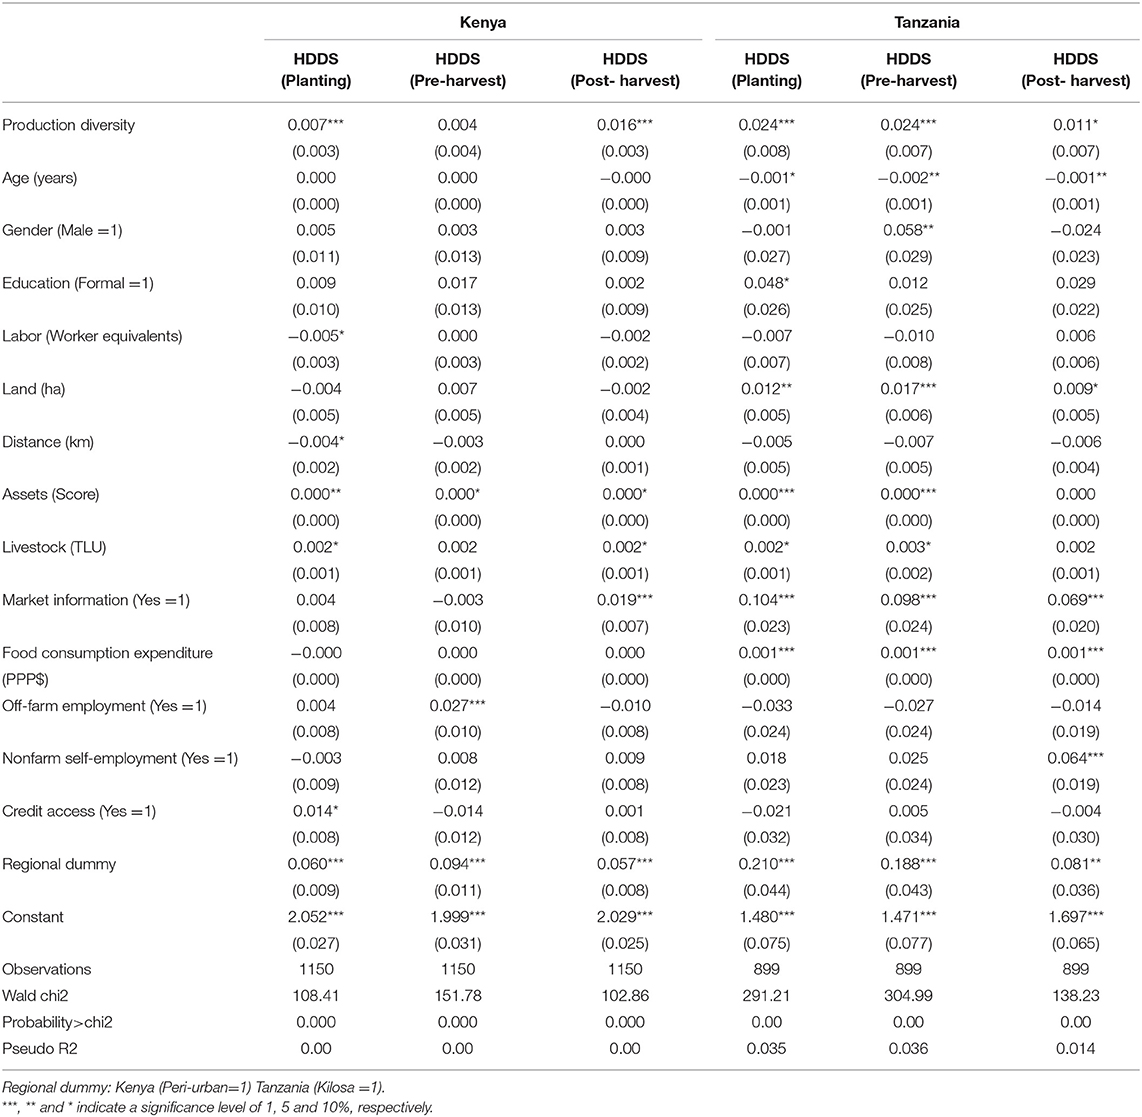
Table 6. Regression results of determinants of seasonal dietary diversity [coefficients (standard errors)].
Conclusions
The present study assessed and compared the nature and determinants of farm production diversity and its influence on household dietary diversity in Kenya and Tanzania.
Comparing the level of farm production diversity in the two countries, results show that smallholders in Kenya have a higher diversity compared to their counterparts in Tanzania. However, in Kenya, smallholders in peri-urban counties that are closer to major markets are far less diverse when compared to those in rural counties. Similarly, in Tanzania, farm production diversity is low in villages with better market access and a higher agricultural potential compared to those with lower market access. Overall, households' endowments in human, natural, physical, social and financial capitals are found to be important factors influencing the level of farm production diversity.
With regards to dietary diversity, overall, households in Kenya have significantly higher diversity in their diets when compared to Tanzania. Nevertheless, results demonstrate a significant and positive association between farm production diversity and the indicators of household dietary diversity for both countries. We also find evidence of a positive role of farm production diversity for seasonal dietary diversity. In addition, apart from farm production diversity, factors such as household productive assets, access to off-farm income opportunities and market access are equally important in enhancing household dietary diversity. In particular, market access seems to play a critical role in enhancing dietary diversity.
In light of the above findings, several implications can be drawn from this study. First, maintaining a higher diversity in farm production can be beneficial for household dietary diversity. This may be applicable to diverse rural and peri-urban contexts with varying market access and agricultural potentials. Second, market related factors are equally important. Proximity to markets offer additional benefits for households: they are able to increase their dietary diversity through increased incomes from agriculture and off-farm opportunities and enhanced access to a diversified portfolio of food items from markets. In terms of policy, therefore, interventions geared toward improving smallholder households' dietary diversity should address both production as well as market-related challenges. Specifically, focus should be on addressing production related challenges especially in rural contexts with less market access. In addition, improvement of market institutions and infrastructure is important for enhancing dietary diversity in diverse contexts such as rural and peri-urban settings.
Data Availability Statement
The datasets generated for this study are available on request to the corresponding author.
Author's Note
The paper is based on a chapter in the PhD thesis of LK (Kissoly, 2016).
Author Contributions
LK, SK, and UG contributed to the conception and design of the study. LK and SK organized the database and performed the statistical analyses. LK wrote a first draft of the manuscript. SK and UG reviewed and substantially contributed to subsequent drafts of the manuscript. All authors contributed to manuscript revision, read and approved the submitted version.
Funding
The authors acknowledge financial support for the research, authorship, and/or publication of this article: The German Federal Ministry of Education and Research (BMBF) and the German Federal Ministry for Economic Cooperation and Development (BMZ) through the project Trans-SEC: 031A249A (www.trans-sec.org). HORTINLEA Project (Horticultural Innovation and Learning for Improved Nutrition and Livelihood in East Africa) funded by the German Federal Ministry of Education and Research (BMBF) and the German Federal Ministry of Economic Cooperation and Development (BMZ), Grant Number: 031A2481.
Conflict of Interest
The authors declare that the research was conducted in the absence of any commercial or financial relationships that could be construed as a potential conflict of interest.
Footnote
1. ^The Simpson's Index and the modified Margalef species richness index would have been alternative indicators but these are able to suitably capture only crop diversity (Di Falco and Chavas, 2009; Last et al., 2014).
References
Bacon, C. M., Sundstrom, W. A., Gómez, M. E., Méndez, E. V., Santos, R., Goldoftas, B., et al. (2014). Explaining the ‘hungry farmer paradox': Smallholders and fair trade cooperatives navigate seasonality and change in Nicaragua's corn and coffee markets. Glob. Environ. Change 25, 133–149. doi: 10.1016/j.gloenvcha.2014.02.005
Bahadur, K. C., Pant, L., Fraser, E., Shrestha, P., Shrestha, D., and Lama, A. (2015). Assessing links between crop diversity and food self-sufficiency in three agroecological regional of Nepal. Reg. Environ. Change 16, 1239–1251. doi: 10.1007/s10113-015-0851-9
Barrett, C., Reardon, R., and Webb, P. (2001). ‘Non-farm income diversification and household livelihood strategies in rural africa: concepts, dynamics, and policy implications'. Food Policy 26, 315–331. doi: 10.1016/S0306-9192(01)00014-8
Benin, S., Smale, M., Pender, J., Gebremedhin, B., and Ehui, S. (2004). The economic determinants of cereal crop diversity on farms in the Ethiopian highlands. Agric. Econ. 31, 197–208. doi: 10.1111/j.1574-0862.2004.tb00257.x
Berti, P. (2015). Relationship between production diversity and dietary diversity depends on how number of foods is counted. Proc. Natl. Acad. Sci. U.S.A. 112:e5656. doi: 10.1073/pnas.1517006112
Burlingame, B., and Dernini, S., (eds.). (2012). Sustainable Diets and Biodiversity: Directions and Solutions for Policy, Research and Action, Food and Agriculture Organization and Biodiversity International. (Rome: Food and Agriculture Organization).
Di Falco, S., Bezabih, M., and Yesuf, M. (2010). Seeds for livelihood: crop biodiversity and food production in Ethiopia. Ecol. Econ. 69, 1695–1702. doi: 10.1016/j.ecolecon.2010.03.024
Di Falco, S., and Chavas, J. P. (2009). On crop biodiversity, risk exposure, and food security in the highlands of Ethiopia. Am. J. Agric. Econ. 91, 599–611. doi: 10.1111/j.1467-8276.2009.01265.x
Ecker, O. (2018). Agricultural transformation and food and nutrition security in Ghana: does farm production diversity (still) matter for household dietary diversity? Food Policy 79, 271–282. doi: 10.1016/j.foodpol.2018.08.002
Environment Statistics (2015). United Republic of Tanzania, Tanzania Mainland. National Bureau of Statistics. (Tanzania: Dar es Salaam).
Fanzo, J., Hunter, D., and Borelli, T. Mattei, F., (eds.). (2013). Diversifying Food and Diets: Using Agricultural Diversity to Improve Nutrition and Health. (London: Routledge).
FAO and ECA (2018). Regional Overview of Food Security and Nutrition. Addressing the Threat From Climate Variability and Extremes for Food Security and Nutrition. Accra. 116pp.
FAO IFAD, UNICEF, WFP and WHO. (2019). The State of Food Security and Nutrition in the World 2019. Safeguarding Against Economic Slowdowns and Downturns. (Rome: FAO).
FAO, IFAD, and WFP. (2014). The State of Food Insecurity in the World 2013. The Multiple Dimensions of Food Security. Rome: FAO.
Grote, U. (2014). Can we improve global food security? a socio-economic and political perspective. Food Secur. 6, 187–200. doi: 10.1007/s12571-013-0321-5
Hatley, A., Torheim, L. E., and Oshaug, A. (1998). Food variety—a good indicator of nutritional adequacy of the diet? a case study from an urban area in Mali, West Africa. Eur. J. Clin. Nutr. 52, 891–898. doi: 10.1038/sj.ejcn.1600662
Hawksworth, D. L. (1995). In: Hawksworth, D.L. (Ed.). Biodiversity Measurement and Estimation. (London: The Royal Society and Chapman and Hall).
Herforth, A. (2010). Promotion of Traditional African Vegetables in Kenya and Tanzania: A Case Study of an Intervention Representing Emerging Imperatives in Global Nutrition. Cornell University, Ithaca, NY.
Herrero, M., Thornton, P. K., Notenbaert, A. M., Wood, S., Msangi, S., Freeman, H. A., et al. (2010). Smart investments in sustainable food production: revisiting mixed crop-livestock systems. Science 327, 822–825. doi: 10.1126/science.1183725
IFAD and UNEP. (2013). Smallholders, Food Security and the Environment. (International Fund for Agricultural Development, Rome, Italy: United Nations Environment Programme. Nairobi, Kenya).
Jones, A. D., Shrinivas, A., and Bezner-Kerr, R. (2014). Farm production diversity is associated with greater household dietary diversity in Malawi: findings from nationally representative data. Food Policy 46, 1–12. doi: 10.1016/j.foodpol.2014.02.001
Khatri Karki, S. (2018). Impact of Different Livelihood Strategies on Welfare of Smallholder Farmers: Case Studies From India Kenya and Tanzania. Hannover: Gottfried Wilhelm Leibniz Universität, Doctoral dissertation, xv, 92 S. Available online at: https://www.repo.uni-hannover.de/handle/123456789/3517
Kissoly, L. D. (2016). Food Security Outcomes of Smallholders' Integration in Traditional Agricultural Value Chains in Tanzania and Kenya. Doctoral dissertation, Hannover: Gottfried Wilhelm Leibniz Universität Hannover. Xiii, 99S. Avilable online at: https://www.repo.uni-hannover.de/handle/123456789/8767?locale-attribute=en
Koppmair, S., Kassie, M., and Qaim, M. (2017). Farm production, market access and dietary diversity in Malawi. Public Health Nutr. 20, 325–335. doi: 10.1017/S1368980016002135
Kumar, N., Harris, J., and Rawat, R. (2015). If they grow it, will they eat and grow? evidence from zambia on agricultural diversity and child undernutrition. J. Dev. Stud. 51, 1060–1077. doi: 10.1080/00220388.2015.1018901
Last, L., Arndorfer, M., Balázs, K., Dennis, P., Dyman, T., Fjellstad, W., et al. (2014). Indicators for the on-farm assessment of crop cultivar and livestock breed diversity: a survey-based participatory approach. Biodivers Coserv. 23, 3051–3017. doi: 10.1007/s10531-014-0763-x
Mbwana, H. A., Kinabo, J., Lambert, C., and Biesalski, H. K. (2016). Determinants of household dietary practices in rural Tanzania: implications for nutrition interventions. Cogent. Food Agric. 2:1224046. doi: 10.1080/23311932.2016.1224046
Meng, E. C. H., Smale, M., Bellon, M., and Grimanelli, D. (2010). “Farmer gene banks and crop breeding: economic analyses of diversity in wheat, maize and rice,” in Definition and Measurement of Crop Diversity for Economic Analysis, ed. M. Smale (New York, NY: Kluwer Academic Publishers, 19–32.
Mnenwa, R., and Maliti, E. (2010). A Comparative Analysis of Poverty Incidence in Farming Systems of Tanzania. Special paper 10/4. REPOA. Dar-es-Salaam.
Moursi, M. M., Arimond, M., Dewey, K. G., Treche, S., Ruel, M. T., and Delpeuch, F. (2008). Dietary diversity is a good predictor of the micronutrient density of the diet of 6-to 23-month-old children in Madagascar. J. Nutr. 138, 2448–2453. doi: 10.3945/jn.108.093971
Ng'endo, M., Bhagwat, S., and Keding, G. B. (2016). Influence of seasonal on-farm diversity on dietary diversity: a case study of smallholder farming households in Western Kenya. Ecol. Food Nutr. 55, 403–427. doi: 10.1080/03670244.2016.1200037
Pellegrini, L., and Tasciotti, L. (2014). Crop diversification, dietary diversity and agricultural income: empirical evidence from eight developing countries. Canad. J. Dev. Stud. 35, 211–227. doi: 10.1080/02255189.2014.898580
Powell, B., Thilsted, S. H., Ickowitz, A., Termote, C., Sunderland, T., and Herforth, A. (2015). Improving diets with wild and cultivated biodiversity from across the landscape. Food Secur. 7, 535–554. doi: 10.1007/s12571-015-0466-5
Scoones, I. (1998) Sustainable Rural Livelihoods: A Framework for Analysis, Working Paper 72, (Brighton: Institute for Development Studies).
Sibhatu, K. T., Krishna, V. V., and Qaim, M. (2015). Production diversity and dietary diversity in smallholder farm households. Proc. Natl. Acad. Sci. U.S.A. 112, 10657–10662. doi: 10.1073/pnas.1510982112
Smale, M. ed. (2006). Valuing Crop Biodiversity: On-Farm Genetic Resources and Economic Change. (Wallingford: CABI). doi: 10.1079/9780851990835.0000
Swindale, A., and Bilinsky, P. (2006). Household Dietary Diversity Score (HDDS) for Measurement of Household Food Access: Indicator Guide (v.2). (Washington, DC: Food and Nutrition Technical Assistance (FANTA) Project, Academy for Educational Development).
Vaitla, B., Devereux, S., and Swan, S. H. (2009). Seasonal hunger: a neglected problem with proven solutions. PLoS Med. 6:e1000101. doi: 10.1371/journal.pmed.1000101
World Bank (2007). World Development Report 2008: Agriculture for Development. (Washington, DC: The World Bank). doi: 10.1596/978-0-8213-6807-7
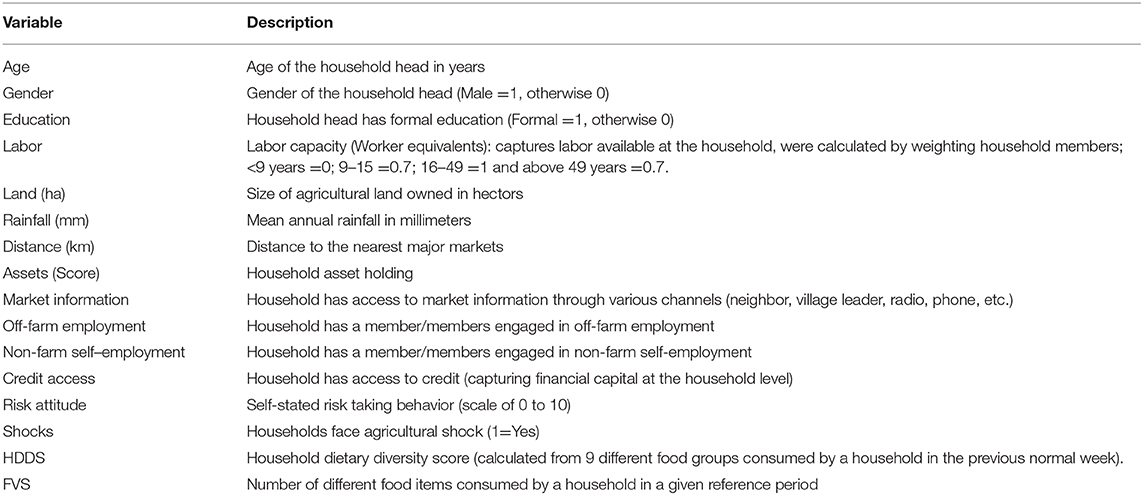
Appendix
Summary of variables used in the study.
Keywords: farm production diversity, dietary diversity, smallholders, rural, peri-urban, Kenya, Tanzania
Citation: Kissoly LD, Karki SK and Grote U (2020) Diversity in Farm Production and Household Diets: Comparing Evidence From Smallholders in Kenya and Tanzania. Front. Sustain. Food Syst. 4:77. doi: 10.3389/fsufs.2020.00077
Received: 06 February 2020; Accepted: 01 May 2020;
Published: 02 June 2020.
Edited by:
Joyce Ludovick Kinabo, Sokoine University of Agriculture, TanzaniaReviewed by:
Aida Turrini, Council for Agricultural and Economics Research (CREA), ItalyYoussef Aboussaleh, Ibn Tofail University, Morocco
Copyright © 2020 Kissoly, Karki and Grote. This is an open-access article distributed under the terms of the Creative Commons Attribution License (CC BY). The use, distribution or reproduction in other forums is permitted, provided the original author(s) and the copyright owner(s) are credited and that the original publication in this journal is cited, in accordance with accepted academic practice. No use, distribution or reproduction is permitted which does not comply with these terms.
*Correspondence: Luitfred Donacian Kissoly, a2lzc29seWx1aXQmI3gwMDA0MDtnbWFpbC5jb20=