
94% of researchers rate our articles as excellent or good
Learn more about the work of our research integrity team to safeguard the quality of each article we publish.
Find out more
ORIGINAL RESEARCH article
Front. Sustain. Food Syst. , 05 June 2020
Sec. Sustainable Food Processing
Volume 4 - 2020 | https://doi.org/10.3389/fsufs.2020.00068
 Emel Yontar1*
 Süleyman Ersöz2
Increasing product demands, environmental aspects, and overpopulation have an impact on the sustainability of a supply chain, especially in the food sector. In a food supply chain from production to consumption, there are many parameters (resources, packaging, waste management, etc.) that need to be taken into account for sustainability. The aim of this study is to determine the parameters affecting sustainable food supply chain management for the food sector and to measure the performance of the parameters along the supply chain. In this study, several performance indices and sub-criteria are defined by reviewing the indices previously discussed in the literature and accounting for expert opinions on the sustainable food supply chain. Customer satisfaction, resource utilization, product safety, innovation, reliability, company information, packaging, and waste management are defined as the parameters, as these are dimensions that should be improved in sustainable food supply chain management. The performance score for each dimension is calculated via Structural Equation Modeling and the Analytic Hierarchy Process. Customer satisfaction is calculated to have the highest performance, with a score of 86.23% in sustainable food supply chain management performance evaluation, followed by the product safety dimension, at 84.65%, while the performance index score of the reliability dimension is 82.97%, that of the packaging dimension is 78.81%, that of the company information dimension is 75.10%, that of resource utilization is 71.41%, and that of the waste management dimension is 67.83%. The sustainable food supply chain performance evaluation for the food sector in Turkey indicates that it has an overall performance of 79.7%. The results of this study include feedbacks on parameters in the food chain from agriculture to consumers.
Internal and external indications (globalization, increasing demand, and market integration) are pushing employees in the food chain system toward more sustainable practices (Hubeau et al., 2017). Many initiatives have already emerged to move the food system toward sustainable development (Coteur et al., 2019). In these initiatives, chain employees can use different kinds of approach; sustainability assessments (Coteur et al., 2019), which are designed to guide the decision-making processes for sustainability, include sustainability in decision-making, structuring of sustainability assessments (Hugé et al., 2013), and applications of sustainability in the food chain and should be studied with a Triple Bottom Line (TBL) (economic, social and environmental) consideration (Arowoshegbe et al., 2016). Therefore, there is a need for studies into sustainable food in order to ensure the effective use of natural resources and to leave a livable world for future generations.
A general review by Li et al. (2014) explored the latest developments in sustainable food supply chain management to explore research areas in this topic. Govindan (2018) conducted a brief literature review on sustainable supply chain management and sustainable supply chains in the food sector to provide current information on how past and current research has been introduced and how it focuses on different theories governing sustainable consumption and production. Smith (2007) presented an article on developing sustainable food supply chains. The article also detailed opportunities to engage consumers and highlight the importance of cooperation between food manufacturers, retailers, NGOs, government, and farmer organizations.
Research on sustainable supply chain management has adopted many different theories and approaches. Ali et al. (2019) developed a model for food supply chain risks associated with food waste to reduce food waste and develop a sustainable framework. They applied the proposed model to food processing companies in Bangladesh to establish a sustainable business policy to minimize food waste. Wang and Yue (2017) proposed a new food safety pre-warning system to analyze safety risks in sustainable food supply chains. The contribution of the proposed system was to improve supply chain quality sustainability by providing safety pre-warning. Allaoui et al. (2018) proposed a two-stage hybrid solution methodology for sustainable agri-food supply chain design. The numerical results provided important organizational, practical, and policy insights into the impact of financial and environmental sustainability on supply chain network design. Rohmer et al. (2019) presented a new application of a network design problem that addresses sustainability issues in the context of the global food system. The findings of this study revealed the importance of evaluating consumption and production decisions in an integrated and global environment.
Moreover, research on sustainable supply chain management has been performed in different fields of the food sector. Fabbrizzi et al. (2014) emphasized the effects of short food supply chains and how they can provide benefits for producers, consumers, and society. Kaipia et al. (2013) focused on the flow of materials and information through the application of a case study on milk, fish, and poultry in the fresh food supply chain. Ting et al. (2014) focused their study on quality in a sustainable food supply chain for the wine industry. Del Borghi et al. (2014) studied the evaluation of environmental sustainability in the food sector through a Life Cycle Assessment with a focus on tomato products in the supply chain. Chen et al. (2014) presented an analytical model to study the managerial and policy issues related to quality control in food supply chain management with a focus on the Chinese dairy industry.
According to these studies, the first step in sustainable food chain supply management (SFSCM) is to learn the working process within the food supply chain. SFSCM includes the use of agricultural products as raw materials, optimum resource utilization during the processing of the product in the production line, packaging, and delivery, and sustainability studies are carried all along the chain. It is important to consider and to evaluate each criterion (resource utilization, packaging, waste management, etc.) in supply chain sustainability. Each of the criteria should be handled to make the chain sustainable economically, environmentally, and socially (Koç, 2015). It is a necessity to use resources effectively in the food sector and to reduce the environmental effects as a result, and so effective resource utilization can be used to evaluate the performance of SFSCM. Supply chain performance can be measured through many criteria (e.g., financial, innovation, quality, and resources criteria), and it consists of many metrics that can be measured. According to Kaplan (1990), “No measures, no improvement” it is essential to measure the right things at the right time in a supply chain and virtual enterprise environment so that timely action can be taken. Good performance measures and metrics will facilitate more open and transparent communication between people, leading to cooperative, supported work and hence improved organizational performance (Gunasekaran and Kobu, 2007). In this performance evaluation, especially in the food sector, supply chain assessment criteria should be determined by considering economic, social, and environmental factors.
The purpose of sustainability in the supply chain is to create environmental, economic, and social value for all stakeholders (located in the producer-consumer line) and to protect and improve value. Chain performance includes many factors. These factors consist of many criteria, and these can be measured by both quantitative and qualitative methods. Developing a system to measure the performance of the supply chain requires the right choice of indicators. In this study, since there are various publications on supply chain management performance evaluation that propose many criteria relevant to the environment, the performance evaluation criteria in SSCM are identified by examination of reverse performance evaluation studies.
Research on supply chain management performance evaluation has been carried out with many different approaches and different evaluation criteria. Firstly, the criteria used by the authors were examined. There are many studies in the literature on the performance evaluation of supply chains. The first such research was conducted by Neely et al. (1995). They analyzed performance measures in the supply chain. They identified the main headings as time, flexibility, cost, and quality and formed sub-criteria for each. At this point, a lot of studies defined supply chain performance criteria as time, flexibility, cost, and quality (Fitzgerald et al., 1991). In addition to these criteria, Kaplan and Norton (1997) developed a supply chain performance measurement model involving financial innovation, customer satisfaction, and internal processes. Beamon (1999) evaluated the performance measures in three parts: output, resource, and flexibility. Pires and Aravechia (2001) and Angerhofer and Angelides (2006), based on the work of Beamon (1999), made resources, output, and flexibility the three main criteria in the evaluation of supply chain performance. In his study, Chan (2003) developed a model for evaluating supply chain performance in which supply chain performance was determined by quantitative and qualitative variables, where the quantitative variables were cost variables and the qualitative variables were quality, flexibility, confidence, visibility, and innovation. Tao (2009) used criteria in four basic categories: level of customer satisfaction, level of logistics, degree of information sharing, and financial status. Gunasekaran et al. (2004) established a framework for measuring performance in the supply chain at strategic, tactical, and operational levels. In addition, they emphasized basic performance measures to highlight suppliers, distribution and delivery performance, customer service, inventory, and logistics costs. Ganga and Carpinetti (2011) and Aydogdu (2011) studied cost, assets, flexibility, responsiveness, and reliability criteria. Kumar et al. (2013) studied the factors of eco-procurement, eco-accounting, eco-logistics design, eco-product design, eco-manufacturing, marketing and communication, economic performance, environmental performance, customer cooperation, human and technological resources, internal environmental management performance, operational performance, stakeholders, and vendor management. Fernandes et al. (2018) investigated the ways of measuring reverse logistics performance. They showed that the most commonly used indicators are financial and economic performance and indicators for customers. Due to a lack of academic research into the performance evaluation and decision variables for reverse logistics, Sangwan (2017) looked at various activities based on the four main activities in reverse logistics, decision variables, and performance indicators.
In order to identify the sustainable performance criteria, the main criteria of sustainable supply chain management performance are also investigated. Bourlakis et al. (2014) evaluated the sustainability performance of a milk chain by using key indicators related to efficiency, flexibility, sensitivity, and product quality. Zailani et al. (2012) carried out a survey study in manufacturing companies and explained the effects of environmental, purchasing, and sustainable packaging factors on environmental, social, economic, and business issues. Kirwan et al. (2017) identified five dimensions of food supply chain performance (economic, social, environmental, health, and ethical) that were being debated across a range of national contexts in four different “spheres” of discourse (public, market, scientific, and policy). In light of these studies, eight main criteria (customer satisfaction, resource utilization, product safety, innovation, reliability, company information, packaging, and waste management) have been studied by considering economic, social, and environmental dimensions.
While addressing the issue of SFSCM, many criteria from resource utilization to waste management, packaging, and supplier collaboration should be taken into consideration. As shown in Figure 1, in this chain, which starts with agriculture and goes to the consumer, taking into account recycling, the important factors for sustainable food supply chain management are sustainable resource utilization (water, energy, etc.), sustainable soil management, sustainable packaging, waste management, sustainability R&D projects, product safety, sustainable consumption, and customer satisfaction. Sustainable food supply chain management emerges by considering each of these factors as economic, social, and environmental (Figure 1).
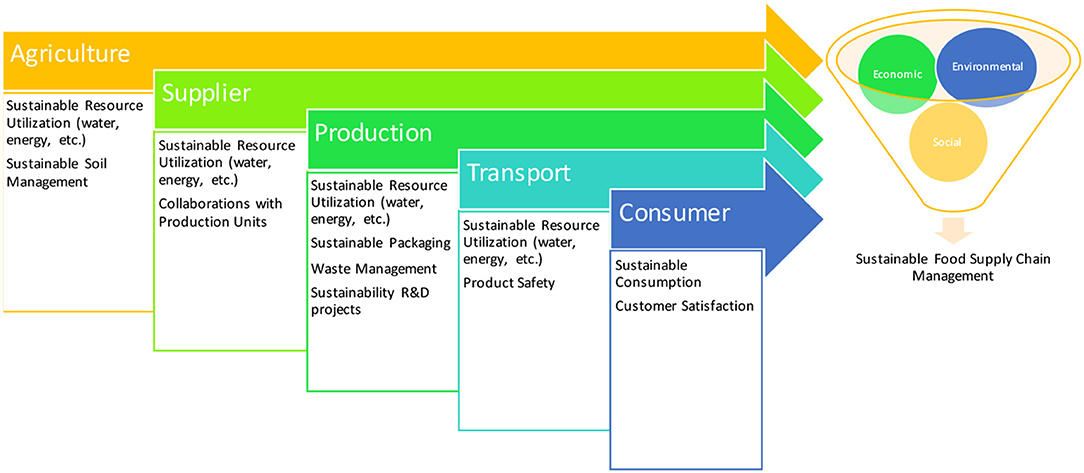
Figure 1. Schematic representation of the criteria in SFSCM.
Solid and water waste are serious threats to the food sector, especially in waste management. The food sector should draw attention to water consumption, as both the agricultural raw material it demands and the amount of water used in the process can be excessive. Food producers should therefore use water, one of the most important natural resources, effectively, and ensure the recycling of waste.
Natural resources and energy are used in many stages, from food production to the preservation of freshness. Furthermore, most of the greenhouse gas emissions of the food sector are related to energy usage. The reduction of fossil fuel usage is important in every area, from the production of the product to its transportation. The efficient use of energy resources such as electricity, coal, and oil and the use of renewable energy are also desirable in the sustainable supply chain.
Food is the area of commerce that uses the most packaging. Food companies can ensure sustainability by minimizing the use of materials and energy in packaging, reducing packaging weights, and recycling. In this regard, food companies should cooperate with packaging manufacturers and support R&D activities. Solid waste consisting of packaging at the consumption stage should not harm the natural world and should not endanger human health (Koç, 2015). At the same time, food companies should cooperate with their suppliers on transport and collaborate with suppliers to create a sustainable chain.
The aim of this paper is to provide an original and general conceptual framework for the evaluation of sustainable food supply chain management. The proposed framework has been applied to the performance evaluation of the food sector in Turkey with consideration given to economic, social, and environmental factors.
The major targets of this study are as follows:
i. To give a perspective on the food sector by studying the parameters (customer satisfaction, resource utilization, safety of products, innovation, reliability, company information, packaging, and waste management) in detail. This is achieved by using a questionnaire form to collect the opinions of food sector employees.
ii. To calculate the performance of parameters (dimensions and criteria) using Structural Equation Modeling (SEM) and to reveal the overall performance with the Analytic Hierarchy Process (AHP).
iii. To interpret the chain line that can be improved by determining the performance score and to enable food sector employees to improve regarding sustainability.
The paper is organized as follows. In section Methodology, it is stated that a methodology related to SEM is used, and the details of the analysis are given. It is aimed at obtaining a final result by creating performance indices along the supply chain. The measures are identified and analyzed separately, and a conceptual model is developed. In section Results, the results of the model, the performance index score of each criterion is calculated with the help of SEM based on the AHP method. Evaluation of SFSCM is also discussed in this section. Section Discussion comprises a discussion and suggestions for further research. Finally, in section Conclusion, the conclusions are presented.
The proposed research methodology is shown in Figure 2 as a conceptual model. This conceptual model is a foreground study to be conducted throughout the study. Following a brief discussion of the Structural Equation Modeling (SEM) method, this section includes identifying the latent variables included in the model and assigning the measurement variables to the latent variables. Then, the main criteria and sub-criteria are determined, and a modeling study is initiated for performance evaluation.
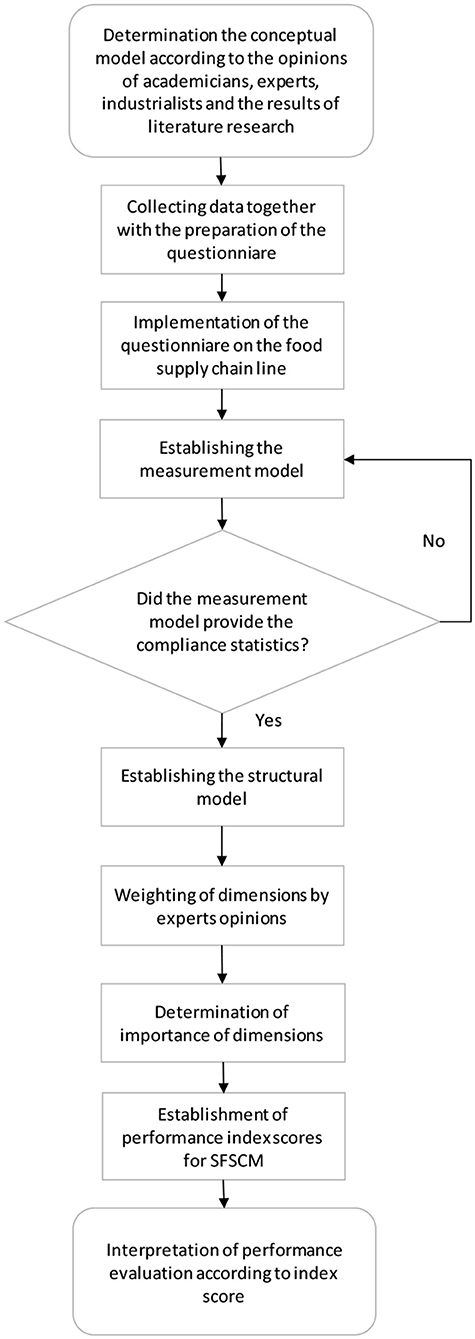
Figure 2. Conceptual model of the proposed research methodology.
Structural Equation Modeling is a statistical analysis method used to test the hypothesis established between the latent variables and measurement variables. Studies in SEM consist of a certain number of latent variables (implicit variables) and measurement variables (observed variables) used in the calculation of these latent variables. SEM is used to test models with causal relationships and correlations between latent and measurement variables (Aksu, 2018). Latent variables cannot be directly observed, and measurements cannot be made directly. Measurable behaviors or actions are used to determine the latent variable. Thus, the measurement of the latent variable is made possible (Byrne, 2010). A measurement variable is a type of variable that can be observed with questionnaire forms and collected data (Aktepe et al., 2015). The schematic representation of the SEM model to be used in our study is shown in Figure 3. The model has one independent and two dependent variables. The measurement variables are defined for each latent variable.
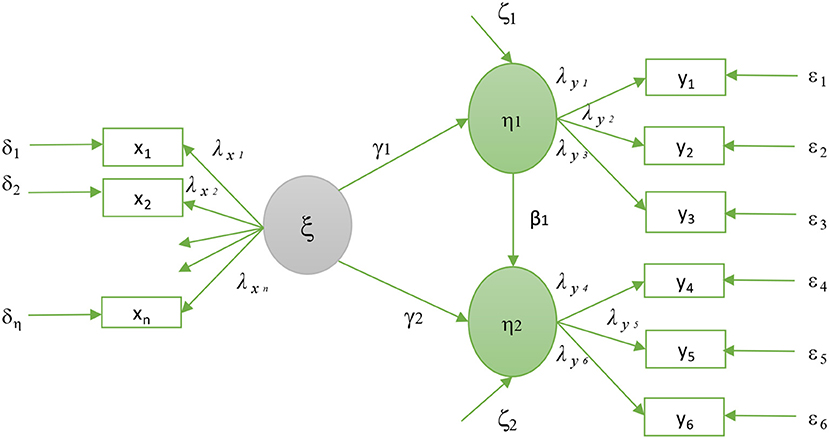
Figure 3. Structural Equation Modeling sample model.
In an SEM model, the following notation is used:
ξ' the independent latent variable vector,
η' the dependent latent variable vector (η1,η2)
γ the regression coefficient vector on the dependent variable (γ1, γ2)
β the effect-level regression coefficient vector between the dependent variables,
ζ the dependent variable error vector (ζ1,ζ2)
x the independent measurement variables,
y the dependent measurement variables,
δ the independent measurement variable prediction error vector,
ε the dependent variable prediction error vector,
λ the factor loading.
The notations in this sample model are used in the following, and their explanations are given. After briefly providing information about SEM, the opinions of academicians, experts, and industrialists and literature research are used to establish which factors will be included in the performance evaluation criteria for sustainable supply chain management in the food sector. Determining these factors is the first step according to the conceptual model. In our study, latent variables are defined as dimensions and measurement variables as sub-criteria.
In line with this model, the performance evaluation criteria used in the literature are taken into consideration, and then face-to-face interviews are conducted with eight experts in the field. Within the framework of economic, social, and environmental issues, which are the main criteria of the SSCM, dimensions (latent variables) and sub-criteria (measurement variables) are determined by considering the food sector. The dimensions (Figure 4) and sub-criteria (Table 1) that may be required for performance evaluation are shown.
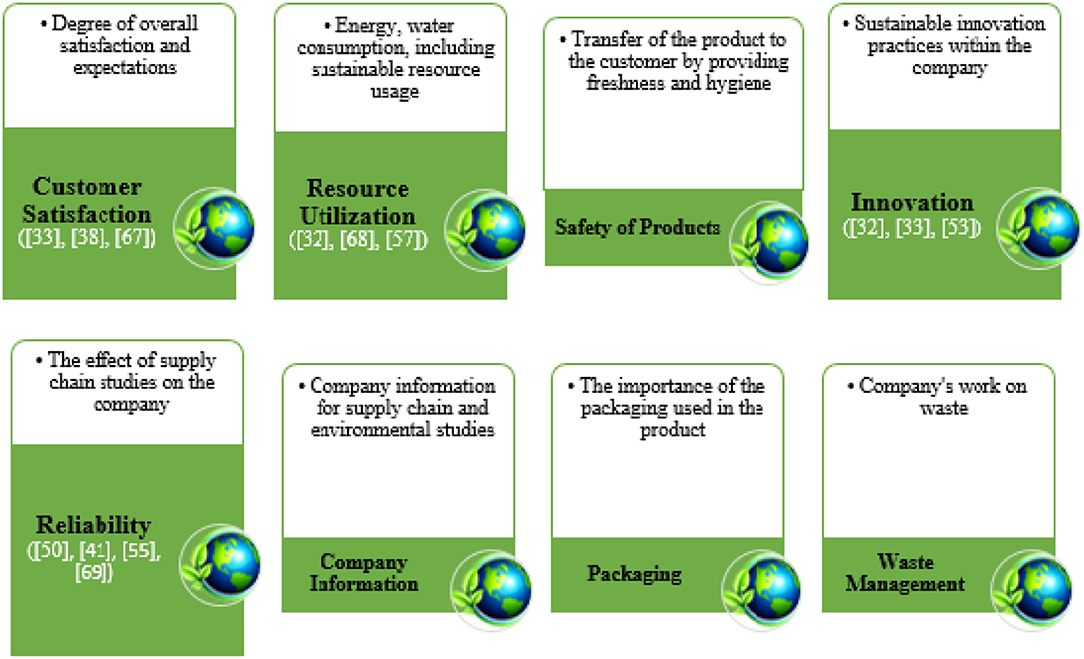
Figure 4. Dimensions of the SFSCM performance indices (latent variables).
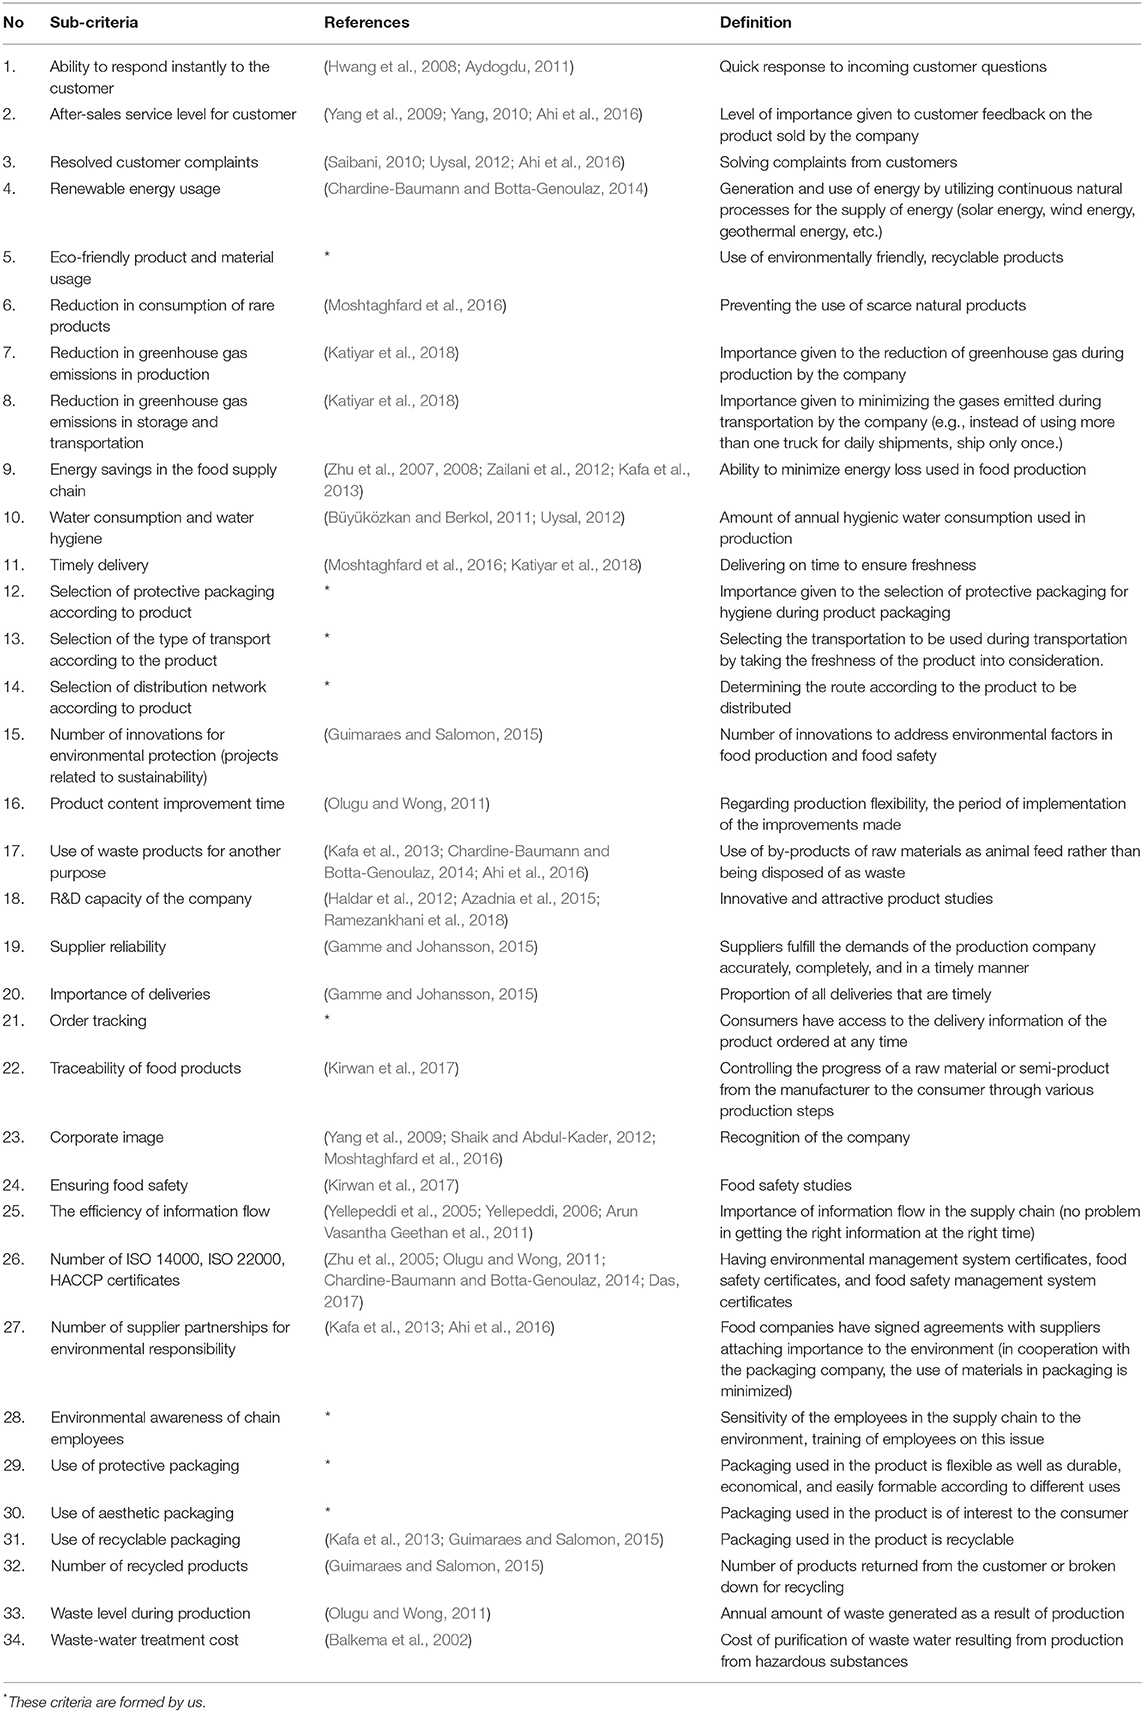
Table 1. Measurement variables required for performance evaluation.
In this section, we detail the preparation of a questionnaire to investigate the dimensions and criteria determined as a result of the interviews. The questionnaire was completed by 388 people who are producers or consumers in the food chain, and their demographic information is given. Data collection was carried out by determining the latent and measurement variables for the sustainable food supply chain. The data collection procedure includes sample selection, questionnaire form, and questionnaire application.
For the sample selection, the current status of the food sector and the number of employees are investigated. While it is important that the views of the staff who work together in food chain logistics in general in Turkey be collected, more specific information may be gained by seeking the opinion of those who work in supply chain management and food studies. According to Turkish Statistical Institute (TSI) data, there are 43,000 businesses in the food sector, including 499 in beverage sector initiatives, so Turkey has a total of 43,500 businesses operating in the food and beverage sector. A total of 492,000 people are employed, with 475.000 in the food sector and 17.000 in the beverage sector (Çokal, 2018). At the same time, a total of 492.500 people are involved in the food sector if one includes the approximately 500 academicians who work in this field. It is then possible to obtain the sample volume by using the formula in Equation (1), as is necessary for such a study.
The definitions in Equation (1) are n = Sample size, N = Main mass size, p = Observation rate of the research unit in the universe, q = Non-observation of the research unit in the universe, z = Z value, and d = Sample error percentage. Equation (1) calculates the sample volume, which is 388 at the 95% confidence interval and d = 5% in our case. A total of 388 questionnaires were distributed after the selection of a consumer-focused sample in the food chain. Dimensions (latent variables) and sub-criteria (measurement variables) were used as the main factors considered in the questionnaire prepared. The five-point Likert scale was used, and the respondents were asked to mark the importance of each element according to strength. Data were collected by means of a questionnaire method, and structural equality was established.
After the application of the questionnaire, the demographic characteristics of the respondents were examined. Table 2 provides information about these demographic characteristics. Of the 388 respondents, 256 (66%) are male and 132 (34%) are female. The average age is 28.5.
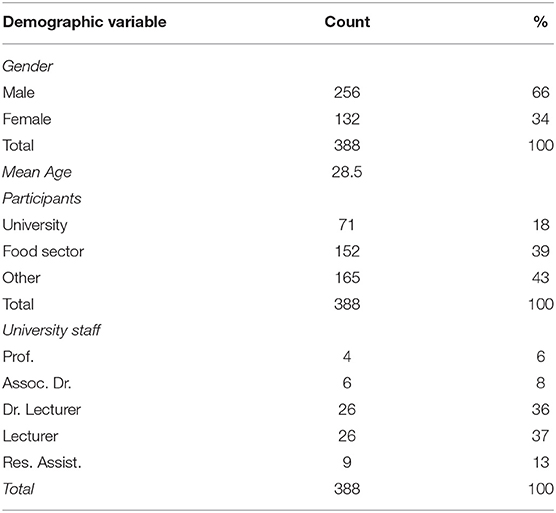
Table 2. Demographic information of respondents.
The most important parameters that direct our study in answering questions are the fields of activity of the individuals. In order to determine the performance criteria in sustainable food supply chain management intended to be evaluated, the priority targets are people working in each area of the food sector (39%). As the food sector is targeted, people were contacted by the face-to-face questionnaire method, email, and questionnaire prepared on the internet. At the 26th International Food and Beverage Trade Fair 2019, which is held in Antalya, the first face-to-face meetings were held with representatives of the leading companies in the food sector. With the help of food distributors outside the fair, various food chain employees were reached. At the same time, the questions of the questionnaire were answered by employees working in the food sector, from market employees working in the retail sector to employees working at fresh vegetable and fruit sales points.
In addition, the opinions of academicians who work in the fields of logistics, supply chain management, and food in university staff, who are experts in their field, were also taken into consideration (18%). For this purpose, questionnaire questions were prepared online and sent by email. A total of 71 academicians studying in the departments of International Trade and Logistics, Industrial Engineering, and Food Engineering contributed to our study. The title distributions of these academicians are given in Table 2. It was also thought that it would be important to look through the eyes of the consumer in this study, so consumers, who are the last link in the food chain, were also asked to fill out the questionnaire (43%).
After the answers had been evaluated, reliability analysis was performed in SPSS software on the data received to determine whether the studies gave consistent results. Reliability means the consistency and uniformity of all expressions in a measurement tool (Özdamar, 1999). The Cronbach's Alpha coefficient is an appropriate means of testing the reliability and consistency the questionnaire questions with Likert-type scales (Kayiş, 2006). Cronbach's Alpha was used to evaluate whether the items included in the study were understood by the respondents. The reliability values of the 34 scales in the questionnaire form were calculated to be as follows.
(i) Cronbach's Alpha: 0.948
(ii) Cronbach's Alpha Based on Standardized Items: 0.949
According to Nunnally (1967, 1978) and Murphy and Davidshofer (1998), a research study shows a high level of reliability when the reliability level is between 0.90 and 0.95. In this result, the indicators reveal the usability of our study.
The Structural Equation Model consists of two parts: the measurement model and the structural model. First of all, measurement variables that will be located below the dimensions, as well as demographic characteristics, are tested with the help of the measurement model. The measurement model was run in LISREL software (Jöreskog and Sörbom, 1993) by applying the SIMPLIS code step by step. It was seen that there were some inconsistencies between the measurement variables upon entering the questionnaire data for the first time into the LISREL software. It was concluded that it is necessary to capture a suitable model with a higher reliability compliance index. In order to do this, some of the measurement variables, which are questionnaire questions, were assigned to different latent variables, and the final measurement model was revealed. The latent variables used in the model and the measurement variables to which they are attached are shown in Table 3.
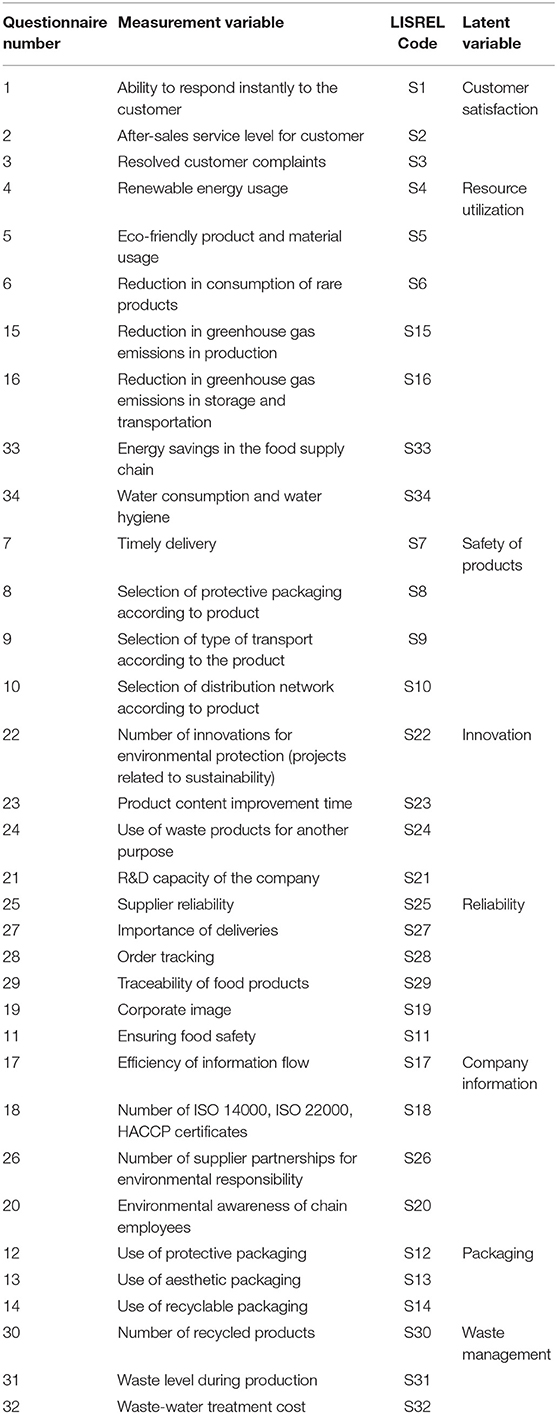
Table 3. Measurement variables and LISREL codes according to latent variables.
In order to explain the relationship between measurement variables and latent variables, Confirmatory Factor Analysis (CFA) was applied in the LISREL program in SEM (Figure 5). The results of the designed CFA model based on the results obtained show the extent of the problem in the compliance model. The fact that the numbers in the arrows from the dimensions of the questions are close to 1.00 indicates that the questions are high in conformity with the dimensions.
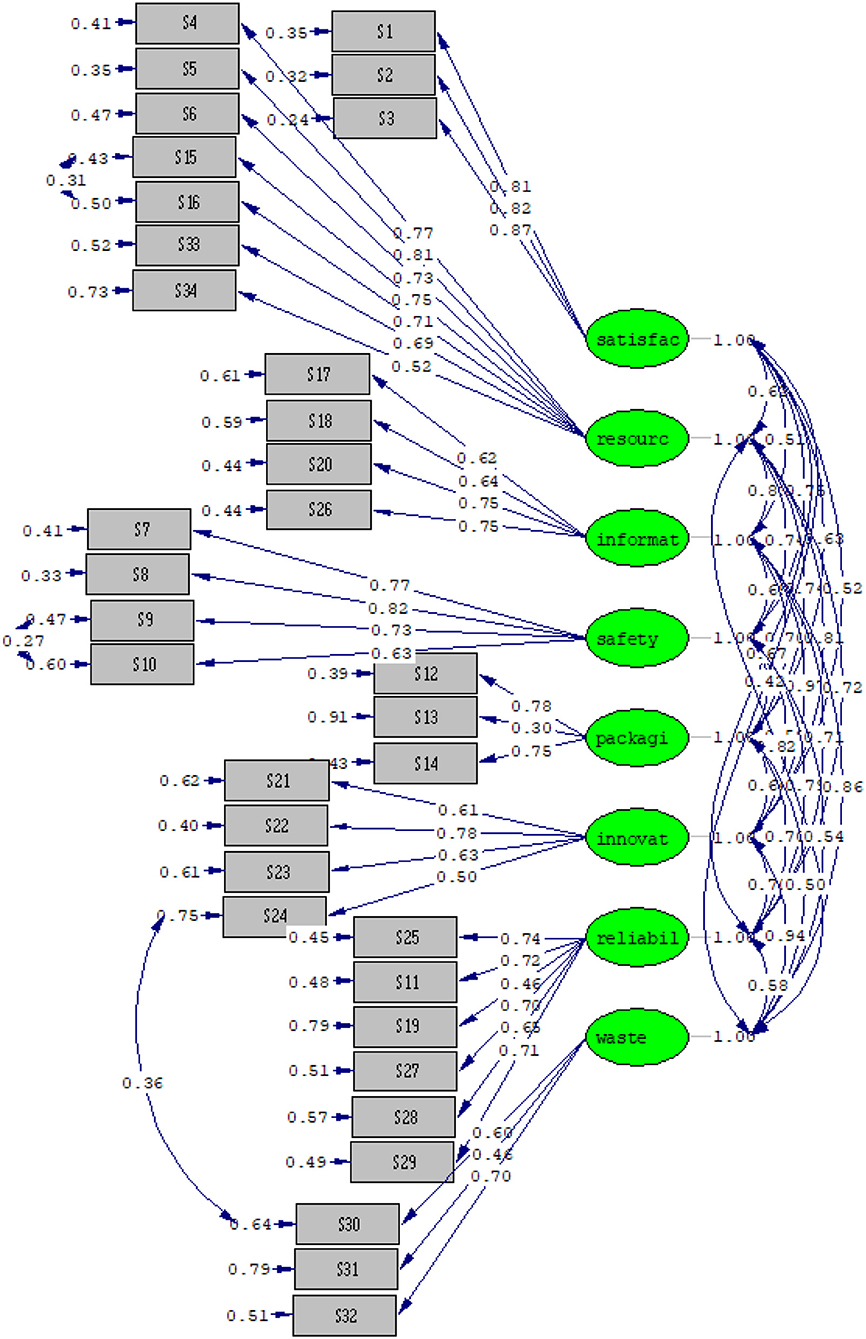
Figure 5. Measurement model (CFA) explaining the relationship between measurement variables and latent variables.
The fit indices of the model determined to be statistically significant according to the CFA model result are given in Table 4. More than 30 indexes have been developed as a goodness of fit index in SEM (McDonald and Marsh, 1990). However, since these indexes do not always give consistent results, there is disagreement on the best fit index (Thompson and Daniel, 1996). For this reason, Jaccard and Wan (1995) stated that at least three indexes should be reported, and Kleine (1998) indicated that at least four indexes should be reported.
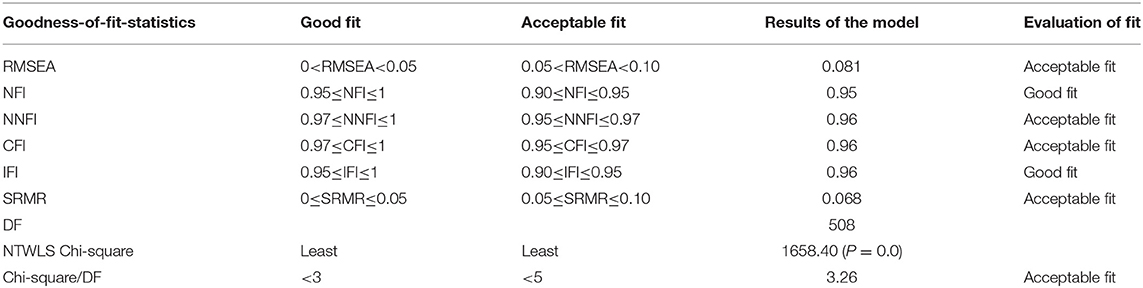
Table 4. Compliance statistics for CFA model result.
According to the results of the compliance statistics, it is seen that a model that has good compatibility was obtained. Determining the latent variables and assigning the measurement variables to the latent variables are handled by the second structural model to be constructed. The structural model, showing the latent variables and measurement variables in the model, is shown in Figure 6.
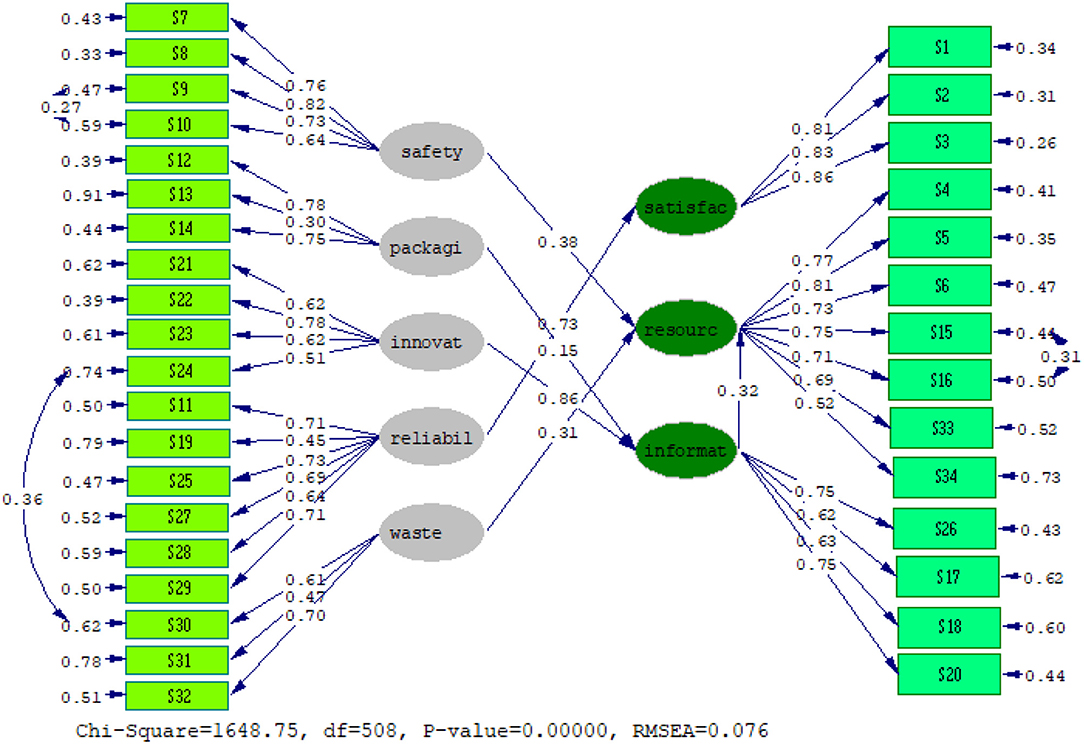
Figure 6. Structural model of the sustainable food supply chain performance index.
In the structural model shown in Figure 6, safety, packaging, innovation, reliability, and waste are independent variables; satisfaction, resources, and information as dependent variables. Dependent variables are variables that are affected by other dimensions, while independent variables are variables that are not affected by other dimensions.
The regression coefficients in the model (Figure 6) indicate the effect of the variables on each other. Standard coefficients are discussed based on the values set by Kline (2011). These values are classified as <0.10 low effect, 0.30 medium effect, and >0.50 high effect, respectively (Kline, 2011). At the same time, the coefficients of determination (R2) are calculated to examine the relationships between latent variables in the model. The coefficient of determination takes a value between 0 and 1, showing a higher explanatory power of the model as it approaches 1.00. The details of these values are given in Table 5.
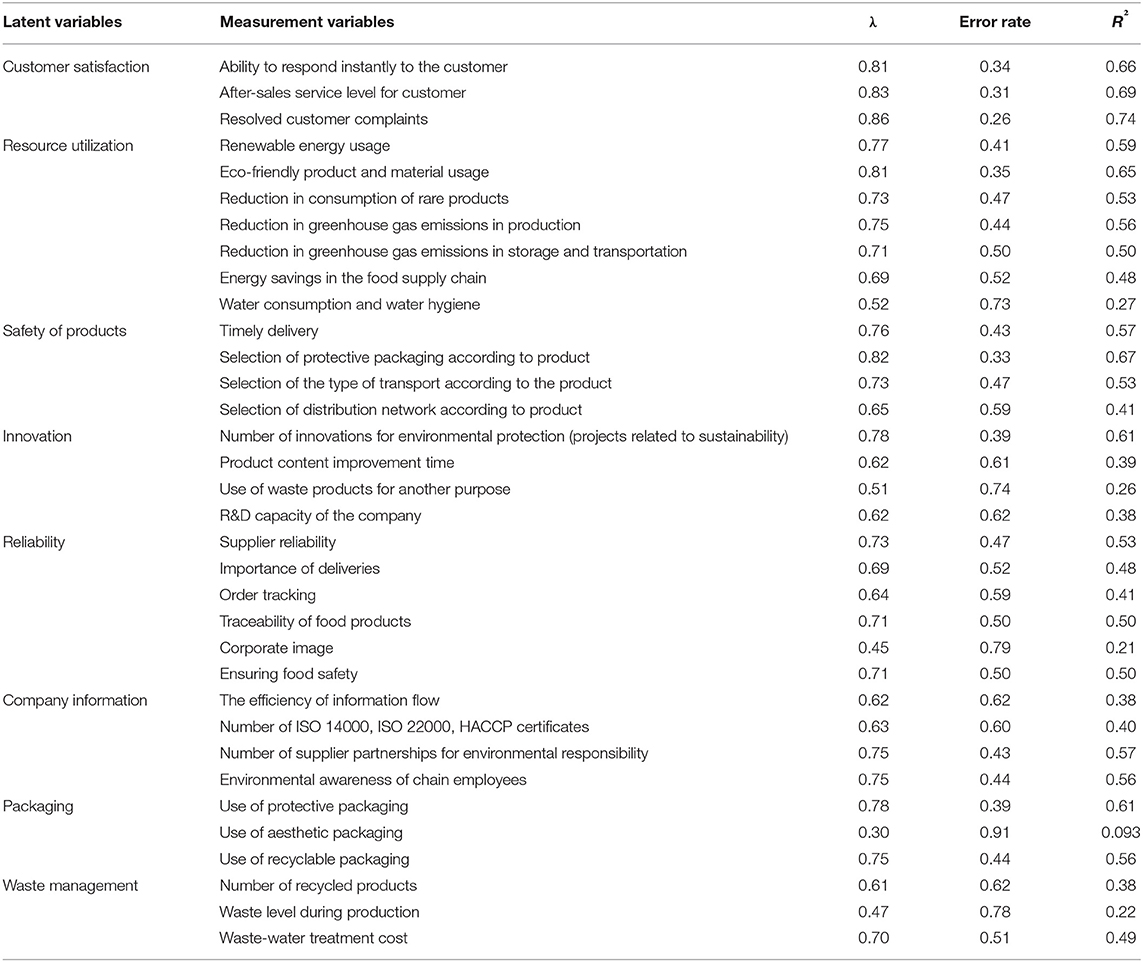
Table 5. Standardized λ, error rate, and R2 values of the structural equation model.
Table 5, where the effects of the model are examined, indicates that the criterion of resolved customer complaints shows the strongest relationship with the customer satisfaction dimension (λ = 0.86). The relationship between them is positive and meaningful. The rate of explaining the latent variable of customer satisfaction by the resolved customer complaints criterion appears to be 74%. The relationship between customer satisfaction and the after-sales service level among the customer criteria for the client is shown to have a coefficient of 0.83, and the relationship between them is significant. It is seen that this criterion explains the latent variable of customer satisfaction at 69%. Again, the relationship between the satisfaction dimension and ability to respond instantly to the customer, which is the last measurement variable, is also quite high (λ = 0.81). The ability to respond to the customer immediately explains the dimension of customer satisfaction at a rate of 61%. In this case, these measurement variables have high (>0.50) effects on the latent variable of customer satisfaction and are important means of evaluating sustainable supply chain performance.
When the resource utilization dimension is taken into consideration, the relationship between eco-friendly product and material usage and the resource utilization latent variable is the largest among the seven sub-criteria. The regression coefficient of this value is 0.81. The rate at each eco-friendly product and material usage describes resource utilization is 65%. In order to increase the company's sustainable supply chain management performance, the use of eco-friendly products and materials plays an important role in resource utilization. Then there is renewable energy usage, which has the second-highest relation with the resource dimension (λ = 0.77). The relationship between them is significant and positive. Renewable energy usage accounts for 59% of resource utilization. Another important criterion is the reduction of greenhouse gas emissions in production. Although there is a 0.75 relationship between this and resource utilization, it seems to explain at a rate of 56%. Another positive and significant relationship between a measurement variable and resource utilization is shown by the importance given to the reduction in consumption of rare products (λ = 0.73). The reduction in greenhouse gas emissions in storage and transportation is measured as having a relation of 0.71 with resource utilization. The criterion of the reduction in consumption of rare products that are found in nature explains resource utilization at a rate of 53%, and this value is 50% for the reduction in greenhouse gas emissions in storage and transportation. Another criterion in the food supply chain, energy saving, has a relation with resource utilization of 0.69, and this relation is 0.52 for water consumption and water hygiene. Energy savings in the food supply chain account for 48% of resource utilization and water consumption and water hygiene, 27%. When the dimension of resource utilization is examined, it is observed that the effects of all of the measurement variables are >0.50.
When the safety of products dimension is taken into consideration, it can be seen that, of the product criteria, there is a highly significant and positive relationship between the measurement variable and the selection of protective packaging according to the product. This affects the safety of products dimension with a coefficient of 0.82. This criterion explains the safety of products dimension at 67%. There is a significant relationship between the safety of products and the criterion of timely delivery (λ = 0.76). This measurement variable clarifies the safety of products dimension at a level of 57%. Another sub-criterion is the selection of the type of transportation according to the product (λ = 0.73). This parameter explains the safety of products dimension at 53%. Selection of distribution network according to product shows a correlation with the safety of products with a regression coefficient of 0.65. When all these criteria are examined, it can be seen that there is a high degree of influence between the safety of products latent variable and the measurement variables that explain this latent variable (>0.50).
When the innovation dimension is considered, it is observed that there is a high level of influence and a significant relationship between the criterion defined as the number of innovations for environmental protection (projects related to sustainability) and the dimension of innovation (λ = 0.78). The explanation rate of innovation by this criterion is 61%. The company measurement variables of product content improvement time and R&D capacity are observed to have the same effect on this dimension (λ = 0.62). The explanation rate of this dimension by product content improvement time is 39% and by the R&D capacity of the company, is 38%. Another criterion is the use of waste products for another purpose. The regression coefficient of the relationship between this measurement dimension and the innovation dimension is 0.51. The rate of disclosure of the latent variable is 26%. In this dimension, the regression coefficients of all measurement variables were higher than 0.50, so they have a significant effect on the performance evaluation.
The dimension of reliability measurement has the strongest relationship with the criterion of supplier reliability (λ = 0.73). The explanation of the reliability dimension by this measurement variable is 53%. The measures of ensuring food safety and the traceability of food products affect the reliability dimension with the same regression coefficient (λ = 0.71) and the same percentage (50%) reliability. There is a significant relationship between the importance of delivery and reliability (λ = 0.69). The credibility of this criterion is 48%. Another criterion, order tracking, shows a λ of 0.64 between the measurement variable and the reliability dimension. This variable explained the dimension at a level of 41%. There is also a significant correlation between the corporate image measurement variable and reliability (λ = 0.45). The rate of explaining the reliability dimension is 21%. The effects of five of the six measurement variables that affect the latent reliability variable are high (>0.50), showing that the relationships between them are significant and positive. Only the corporate image criterion remains at a value of 0.45, which affects the dimension with a medium but not low impact.
It seems that, of the associated measurement variables, the company information dimension has a strong relationship with the same coefficient with the number of supplier partnerships for environmental responsibility and the environmental awareness of chain employees (λ = 0.75). The number of supplier partnerships for environmental responsibility explains 57% of the company information dimension, and this value is 56% for the environmental awareness of chain employees. The number of ISO 14000, ISO 22000, and HACCP certificates variable appears to have a significant relationship with the company information dimension (λ = 0.63). The rate of explanation of this parameter is 40%. There is a significant correlation between the efficiency of information flow and the company information latent variable, with a 0.62 regression coefficient. The rate of explanation of the information dimension seems to be 38%. The degree of influence of the four criterion measurement variables on the company information dimension seems to be high (>0.50).
When the relationships between the packaging dimension and the measurement variables are considered, a significant relationship is found between the criterion of use of protective packaging and the packaging dimension. It is observed that it has a high degree of effect on the latent variable, 0.78. The relationship between them is meaningful. Moreover, the use of protective packaging explains the packaging dimension by 61%. The level of relationship between the use of recyclable packaging and the packaging dimension is also significant and high (λ = 0.75). The rate at which this criterion explains the packaging dimension is 56%. The use of aesthetic packaging has a medium level of effect on the packaging variable (λ = 0.30). It has a 9.3% explanation rate of this dimension, and it is concluded that it shows the lowest effect of the measurements. At this point, it can be seen that the questionnaire data indicate that the use of aesthetic packaging in sustainable supply chain management is of little importance and that the result is correct.
In the waste management dimension, there is a high degree of correlation between the waste-water treatment cost criterion and the waste management dimension (λ = 0.70). The rate of explanation of this criterion on the waste management latent variable is 49%. Another criterion is the number of recycled products, and there is a positive relationship between this measurement variable and the waste management latent variable (λ = 0.61). This parameter has a rate of explanation of the waste management dimension of 38%. There is a medium level of impact of the waste level during production measurement variable on the waste management dimension. This parameter explains the dimension at a rate of 22%. The waste level during production criterion affects the waste management latent variable with a medium level of impact, while the other two criteria have >0.50 impact on waste management with a high level of efficiency.
In addition to the above-detailed relationships, the selection of the type of transport according to the product and the selection of the distribution network according to product (S9-S10) have correlation values of 0.27. The reduction in greenhouse gas emissions in production and reduction in greenhouse gas emissions in storage and transportation (S15-S16) measurement variables have correlation values of 0.31. The correlation between the use of waste products for another purpose and the number of recycled products (S24-S30) has a value of 0.36.
For the measurement variables, the degrees of effect among the latent variables are also shown in Figure 6. In this sense, the variables affected by the model, such as customer satisfaction, resource utilization, and company information dimensions (dependent variables), and the explanations of the safety of products, packaging, innovation, reliability, and waste management dimensions by the variables (independent variables) are as follows;
• The regression coefficient of the reliability dimension, which affects the latent variable of customer satisfaction, is 0.73. The value of R2 is calculated as 0.53. This can be seen under the heading Reduced Form Equations in the LISREL SIMPLIS output. This means that 53% of the change in the customer satisfaction dimension can be explained by the reliability aspect.
• The safety of products dimension, waste management dimension, and company information dimension affect the resource utilization dimension. Safety of products does so at a rate of 0.38, the waste management dimension at a rate of 0.31, and the company information dimension at a rate of 0.32. The value of R2 is calculated to be 0.8 under the heading Reduced Form Equations.
• The packaging dimension affects the company information latent variable; while the packaging dimension affects the company information dimension at a rate of 0.15, the innovation dimension affects it at a rate of 0.86. The value of the company information dimension is calculated to be 0.93 under the heading Reduced Form Equations.
As a result of all these evaluations, it is seen that the model in the study is accepted according to the results obtained from the LISREL software analysis.
In this section, after the completion of the structural model, a performance indices calculation is performed according to the results obtained in the model. The performance indices of each dimension in the model are calculated with the aim of obtaining an overall sustainable supply chain management performance score for the food sector.
According to the results of the structural equation model analysis, the mean and external weights of the measurement variables are used to calculate the index score of a factor. The weight expressed by Equation (2) is used to calculate the index score (Ej) of the mean j latent variable. In this equation, nj, j. the number of measurement variables in the dimension; wji, obtained at the end of the structural equation model solution, where j is the latent variable and i is the external weight of the measurement variable; yji, j. is the average of the measurement variable values in the dimension and k are the maximum value of the scale of the questionnaire used in data collection (Aktepe et al., 2015). Index scores calculated as percentages using the formula in Equation (2) are shown in Figure 7.
In this sense, customer satisfaction is calculated to have the highest performance in sustainable food supply chain management performance evaluation, with a score of 86.23%. The safety of products dimension follows, at 84.65%, while the reliability dimension is found to have a score of 82.97%, and the packaging dimension performance index score is calculated as 78.81%. The company information dimension performance index is 75.10%, and that of resource utilization is 71.41%. The performance index of the waste management dimension is calculated to be 67.83%.
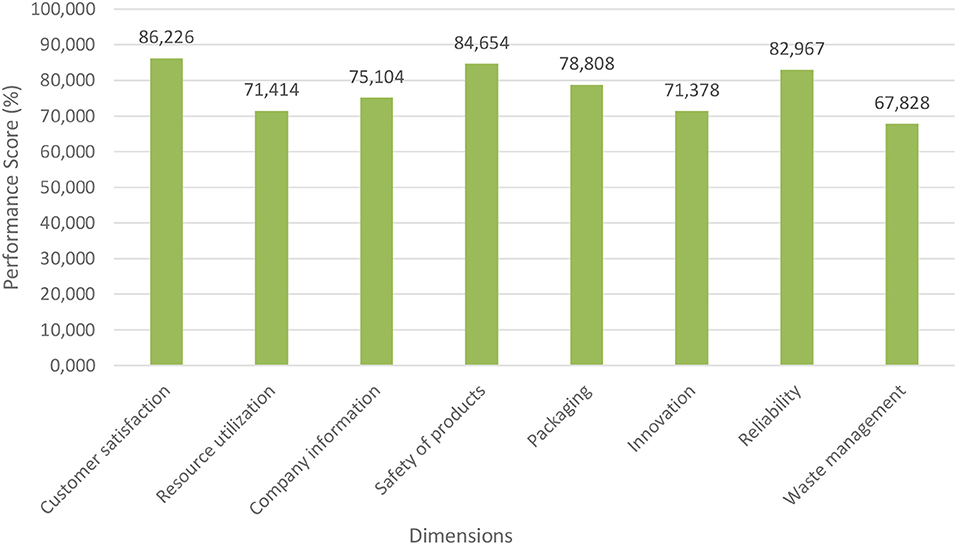
Figure 7. Distribution of performance index scores for SFSCM dimensions.
Each dimension (the measurement variable) is used to find the final performance indices score of sustainable food supply chain management after the calculation of the performance indices, starting from the fact that the individual scores of the dimensions have different weights. This operation is performed by applying the expert opinions AHP method.
The eight dimensions of performance evaluation are the main variables of sustainable food supply chain management. It is a fact that the effect of a certain process on these variables will affect chain employees positively. The AHP method is used to create dual comparison matrices for determining the relative importance of each dimension, because the strength of each dimension will be different. The relative significance scale developed by Saaty (1986) is used in order to be able to measure AHP and to create binary comparison matrices.
The inter-dimensional comparison matrix is an 8 ×8 dimensional square matrix. The matrix components on the diagonal of the matrix take 1.00 because this compares a dimension with itself. The comparison of the dimensions is made according to the values of each according to their importance. For this study, five experts in the fields of International Trade and Logistics and Industrial Engineering were consulted. The SFSCM study was considered, and the importance of the eight dimensions that are effective in performance evaluation was determined. The geometric mean of the results from five different people is obtained for each comparison matrix value, and the final comparison matrix is created (Table 6).
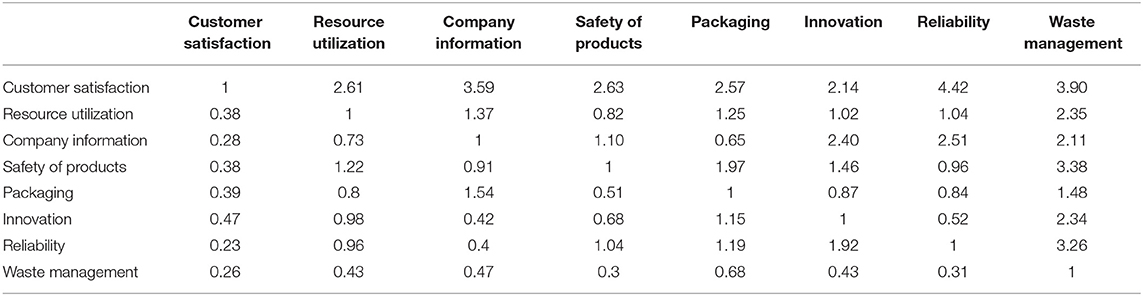
Table 6. Comparison matrix generated by experts.
After the formation of the binary comparison matrix, the importance (priority) of each element is calculated. At this stage, the greatest eigenvector and the eigenvector corresponding to this eigenvalue come into the calculation and normalization. For this purpose, weights for the customer satisfaction, safety of products, reliability, packaging, company information, resource utilization, and waste management dimensions are calculated. Accordingly, the eigenvector value of the customer satisfaction dimension is 0.29, the eigenvector value of the resource utilization dimension is 0.11, the eigenvector value of the company information dimension is 0.13, the eigenvector value of the safety of products dimension is 0.13, the eigenvector value of the packaging dimension is 0.09, the eigenvector value of the innovation dimension is 0.09, the eigenvector value of the reliability dimension is 0.11, and the eigenvector value of the waste management dimension is 0.05. The calculated eigenvector values indicate the importance of each dimension. The index scores of the dimensions are calculated by utilizing the significance level determination matrix of the AHP method.
Another important issue in the AHP method is consistency in the judgment of the decision-makers. The Consistency Ratio (CR) is used to measure whether the decision-maker acts consistently when comparing the criteria. The CR provides a possibility to test the consistency of the priority vector and the exact comparisons between factors.
The calculation of CR is based on a comparison of the number of factors and a coefficient (λ) called the Basic Value. For the calculation of λ, the D column vector is obtained by multiplying the matrix of the W priority vector by the comparison matrix (Table 6; Yetim, 2004). The base value (E) of each evaluation factor is obtained from the portion of the opposing elements of the column vector D and the column vector W (Equation 3). The arithmetic mean of these values gives the basis of comparison (λ) (Equation 4).
After calculating λ, the consistency indicator (CI) is calculated using the formula in Equation (5).
In the last step, CI is divided by the Random Index (RI) to obtain CR (Equation 6).
Here, the Random Index is the average value of randomly generated binary comparison matrices based on the number n. Values for the Random Index as a result of studies 1–15 are shown in Table 7 (Macharis et al., 2004).

Table 7. Random Index (RI) used in the AHP Method.
As a result of this analysis, the CR is calculated to be 0.07. A calculated CR value of <0.10 indicates that the comparisons made by the decision-makers are consistent.
The final SFSCM performance indices score can now be obtained. For this purpose, the index scores of each dimension in Figure 7 are calculated with the help of the eigenvectors. The resulting sustainable food supply chain management performance score is 79.7% (Table 8).
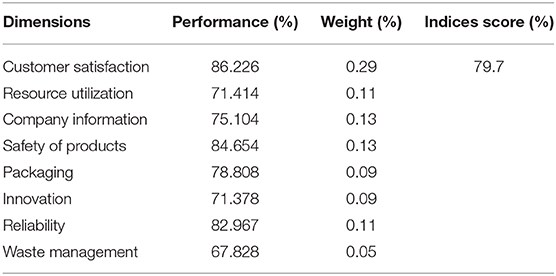
Table 8. Calculated performance indices score of SFSCM.
In this section, the SFSCM performance score calculated in section Results is examined. The measurement variables that concern each of the dimensions of customer satisfaction, resource utilization, safety of products, company information, packaging, innovation, reliability, and waste management as latent variables are shown in Table 3. It is also seen that each of the measurement variables are actually sub-criteria of the performance evaluation criteria. Detailed analysis of the SFSCM performance evaluation study, where the main criteria (dimensions) as latent variables and the sub-criteria as measurement variables, is as follows.
In the customer satisfaction dimension, there are three measurement variables. When the customer satisfaction dimension is sorted by the importance of measurement variables, the resolved customer complaints criteria ranks first. It is understood that resolved customer complaints significantly affect customer satisfaction and that this criterion should be given priority in performance evaluation in the supply chain. The next most important criterion is the after-sales service level for the customer. This shows that increasing the level of service, due to increasing customer satisfaction, can give a better performance score. The last criterion in the customer satisfaction latent variable is the ability to respond instantly to the customer. The customer satisfaction rate will increase and the performance score will increase further with the ability to respond instantly to the customer. Considering the values of these sub-criteria (Table 5), it can be seen that the three measurement variables have similar values. These criteria should not be considered separately in performance evaluation.
In the resource utilization dimension, there are seven measurement variables. When these variables are ranked according to their degree of importance, eco-friendly product and material usage appears to be the criterion that affects the resource utilization dimension most. The use of environmentally friendly products and materials should be increased in order to optimize resource utilization and to improve sustainable food supply chain management performance. Another criterion is the degree of importance given to renewable energy usage. Increasing the use of renewable energy to make use of resources significantly affects performance. The criterion of reduction in greenhouse gas emissions in production is in the third position. Reduction in greenhouse gas emissions in production, by affecting performance in resource use, plays an important role in SFSCM. The next most important criterion is reduction in the consumption of rare products. By reducing the use of products found in nature, resource utilization is enabled, and performance can be increased. Reduction in greenhouse gas emissions in storage and transportation is also an important factor in SFSCM performance evaluation. Finally, while energy savings in the food supply chain, water consumption, and water hygiene in the food supply chain have emerged as measurement variables, they have less effect on performance in this study. Nevertheless, if chain employees pay attention to water consumption and energy savings for resource utilization, sustainable food supply chain management performance will increase.
For the safety of products dimension, there are four different measurement variables. When they are sorted according to their importance, the selection of protective packaging according to the product comes first. In order to protect the products, the protection of the packaging of the products on each line from production to transportation significantly affects the safety of the products. The higher the importance given to protective packaging, the more sustainable food supply chain management performance increases. Another criterion with a different significance level is the realization of timely delivery. Because it can ensure that products do not lose their freshness, timely delivery has a positive effect on the safety dimension of the products. The criterion of selecting the type of transportation according to the product has a third degree of importance. For the safety of products, the type of transportation is important for foods that are separated into hot and cold. The more suitable the type of transportation for the product, the better the food supply chain performance will be, and the performance will increase. The final criterion under this dimension is the selection of the distribution network according to the product. Again, if the distribution network is optimized and adjusted for products to prevent the products from losing their freshness and deteriorating, losses will be reduced, and the supply chain management performance can increase significantly.
In the innovation dimension, there are four different measurement variables. When the measurement variables of the innovation dimension are sorted according to their importance, the number of innovations for environmental protection comes first. Following an increase in the performance score of the innovation dimension for projects related to sustainability, the sustainable supply chain management performance will be increased. Product content improvement time and the R&D capacity of the company appear to be equally important. Reducing the recovery time of the product content can also increase the performance. The greater the company's R&D capacity, the greater the performance from the supply chain. The last criterion under this dimension is the use of waste products for another purpose. If sustainable food supply chain management performance is desired, it is necessary to ensure sustainability by using waste products for other purposes.
In the reliability dimension, there are six different measurement variables. Supplier reliability ranks first when the measurement variables included in the sub-criteria of the reliability dimension are ranked according to their importance. Greater reliability of the supplier should robustly increase the reliability dimension. Subsequent criteria are traceability of food products and ensuring food safety. Both criteria have the same importance. As regards traceability of food products, this service provided to customers can increase reliability. Again, ensuring food safety has a significant impact on reliability; greater safety and performance of food produced to appropriate standards and brought to consumers will increase it. Another important criterion is delivery. The reliability dimension is significantly affected by the company's timely delivery of orders. In addition, with increasing satisfaction with the order follow-up service offered to customers, an increase in the reliability dimension is observed. Finally, it seems that the corporate image measurement variable also significantly affects the reliability dimension. This means that companies with a good corporate image can have more active participation in the reliability of sustainable supply chain management.
In the company information dimension, there are four different measurement variables. Ranked first is the number of supplier partnerships for environmental responsibility criterion, and the environmental awareness of chain employees criterion has the same importance. Within the scope of the supplier agreements made within the company, the size of the company information dimension is positively affected by the increase in consideration of environmental issues. Sustainable supply chain performance also increases. The employees in the company being sensitive to environmental issues also positively affects the company information dimension. Another criterion is the number of ISO 14000, ISO 22000, and HACCP certificates. The supply chain performance of firms with these certifications is significantly better. The final important criterion is the so-called efficiency of information flow, and this is a measurement variable that appears to have an important place in the sustainable food supply chain management of the company information flow.
In the packaging dimension, there are three different measurement variables. When a ranking by size is made of the measurement variables located in the packaging dimension, the most important criterion is the use of protective packaging. SFSCM performance is also significantly affected by increased importance being given to the use of protective packaging by the firm. The next most important criterion is the use of recyclable packaging. This criterion, which is important for sustainability, can be transformed by considering the use of packaging. The use of packaging makes performance increase. The last criterion is the measurement variable included in the criteria as the use of aesthetic packaging. Attention is paid to products using packaging that is aesthetically impressive from the consumer's point of view. By reducing the shelf life of products, sustainability is ensured.
In the waste management dimension, there are three different measurement variables. When the waste management dimension is sorted according to the importance of measurement variables, the waste-water treatment cost ranks first. By reducing the cost of waste water, waste management works become more active, and sustainability performance can be increased. The second criterion is the number of recycled products. In the event that this number increases and results in the recovery of recycled products, this criterion can positively affect the performance of sustainable supply chain management. The final criterion is the waste level during production. With a reduction in the waste level, the performance of the waste management dimension and hence of the sustainable food supply chain seems to increase.
Following the detailed transfer of the sub-criteria related to each main criterion, the changes in the main criteria are as follows. In order to increase customer satisfaction, the reliability of the company should be increased significantly. The variables that need to be taken into consideration in resource usage are waste management, safety of products, and company information. Figure 6 shows that each variable affects resource utilization at approximately the same ratio (0.38, 0.32, and 0.31). If the importance given to waste management increases, resource utilization can be effectively increased, and the SFSCM performance score can be increased. The contribution to the safety of products and the contributions made during the transportation of the resources (protective packaging, transport type, distribution network issues) indicate the importance given to the use of resources. The use of resource-based variables (importance given to environmental certificates, delivery, information flow) in the infrastructure of company information, which is one of the main criteria, can also be optimized. In addition to the interaction of company knowledge with resource usage, the other main criteria affecting company information are innovation and use of packaging. It can be seen in Figure 6 that the novelty dimension has more importance. Innovation studies affecting sustainability within the company are affected positively by R&D projects, and the company studies are defined as company information. With an increase in innovation, it can be observed that sustainable food supply chain performance also increases. Finally, it seems that the use of packaging affects the dimension of the company information at a low rate. However, in the structural model assignment of packaging use, the most appropriate value was found to be with the information dimension. For this reason, attention to the use of packaging (protective, aesthetic, or recyclable packaging) by the firm also works to affect the size of the company information.
In evaluating the performance of SFSCM, all of these elements were considered, and suggestions were made to increase the performance index score. The general theme of this study is to show the factors that positively affect the different dimensions and thus increase the performance score.
The main purpose of the proposed framework is to determine the most important dimensions (parameters) for the food sector and to develop different measurement methods based on these parameters. The first step in the study was a comprehensive review of the literature; not only were studies on the sustainable supply chain considered, but the performance evaluation issues in supply chain management and, conversely, the supply chain were also analyzed. Similar and different criteria were analyzed, and 34 different criteria were brought together for use in performance evaluation. Thus, we contribute criteria that are important from economic, social, and environmental perspectives to the literature. At the same time, it is concluded that sector-specific studies are rare in the literature, so this study addresses this problem for the food sector.
The approach used in performance evaluation was determined by studies of the literature. Supply Chain Operations Reference-based (SCOR) (Alomar and Pasek, 2014) and Balanced Scored Card (BSC) (Shi and Gao, 2016) models are the most widely used approaches in supply chain management performance evaluation studies. In addition, Aydogdu (2011) used the SCOR model and Data Envelopment Analysis to evaluate supply chain performance. Ayçin and Özveri (2015), on the basis of the SCOR model, also created a supply chain performance model that was formed by integrating a fuzzy logic approach. Yavuz and Ersoy (2013) used Artificial Neural Networks to study the retail industry to measure supply chain performance. Özalp (2016) studied the Economic Value Added (EVA) method, which is a value-based measurement method for supply chain performance. Sun et al. (2017) and Huang et al. (2018) used Data Envelopment Analysis models to evaluate supply chain performance.
Applications of approaches to reverse supply chain management are also included in the literature. Hernandez et al. (2009) implemented the Analytical Hierarchy Process (AHP) and Analytical Network Process (ANP) methods to evaluate reverse logistics performance. Guimaraes and Salomon (2015) used ANP in their reverse logistics evaluation model, looking at the footwear industry in Brazil. Shaik and Abdul-Kader (2012) studied a reverse logistics performance measurement system by integrating the AHP method with a Balanced Score Card approach. Moshtaghfard et al. (2016) using the Fuzzy Analytic Hierarchy Process (FAHP) and proposed a performance evaluation model that integrates a Balanced Score Card and Data Envelopment Analysis.
The comprehensive literature review for supply chain management and sustainable supply chain management performance evaluation criteria played a significant role in determining the method in our study. The criteria were determined, and Structural Equation Modeling and the Analytic Hierarchy Process were used to evaluate them. Food supply chains are a priority area of concern, particularly with regard to their sustainability. The issue has been studied by many researchers, but little research has been done on performance evaluation in sustainable supply chain management in the food sector. In this study (in terms of sustainability criteria and the usability of the method), the research has filled a gap. This study will also contribute to further research. Future research should investigate the possibility of integrating different measurement methods.
In addition, in the literature, authors working on the subject have listed sustainability performance measurement dimensions (for example, Zailani et al., 2012; Bourlakis et al., 2014; Kirwan et al., 2017). However, the number of studies for the food sector is very low. For future research, standardized sustainability parameters that cover not only the food sector but all sectors are recommended.
In this study, a final performance score has been calculated for the food sector in Turkey with the help of dimensions and criteria of a sustainable food chain collected from the literature and experts. The first step before the calculation was the structural equation model study and then the application of the AHP method.
Structural Equation Modeling is a statistical analysis method used to test the hypothesized relationships between the latent variables and measurement variables. Studies in SEM consist of a certain number of latent variables (implicit variables) and measurement variables (observed variables) used in the calculation of these latent variables. In our study, latent variables are defined as dimensions and measurement variables as sub-criteria. The performance evaluation criteria used in the literature were taken into consideration, and then face-to-face interviews were conducted with eight experts in the field. Within the framework of economic, social, and environmental issues, which are the main criteria of the SSCM, dimensions (latent variables), and sub-criteria (measurement variables) were determined by considering the food sector.
In order to explain the relationship between measurement variables and latent variables, Confirmatory Factor Analysis (CFA) was applied in the LISREL program in SEM. The fit indices of the model were determined to be statistically significant according to the CFA model. In the structural model, the safety of products, packaging, innovation, reliability, and waste management are independent variables; customer satisfaction, resource utilization, and company information emerged as dependent variables. Dependent variables are variables affected by other dimensions, whereas arguments are variables that are not affected by other dimensions. In other words, the safety of products, packaging, innovation, reliability, and waste management dimensions affect the customer satisfaction, resource utilization, and company information dimensions in SFSCM.
As a result of SEM in LISREL, 34 criteria analyzed in detail in the structural model were evaluated. The findings for the parameters are as follows:
• Resolution of customer complaints is the criterion with the highest regression coefficient for customer satisfaction.
• The highest regression coefficient for resource utilization is eco-friendly product and material usage.
• The highest regression coefficient for the safety of products is the selection of protective packaging according to the product.
• The criterion with the highest regression coefficient for innovation studies is the number of innovations for environmental protection (projects related to sustainability) measurement variable.
• The criterion with the highest regression coefficient for the reliability dimension is supplier reliability.
• The criteria with the highest regression coefficients for the company information are the number of supplier partnerships for environmental responsibility and environmental awareness among the chain employees.
• The highest regression coefficient for the packaging is the use of protective packaging.
• The water-waste treatment cost has the highest regression coefficient for waste management.
The performance indices of each dimension in the model were then calculated with the aim of obtaining an overall sustainable supply chain management performance score for the food sector. Each dimension (measurement variable) was integrated to find the final sustainable food supply chain management performance indices score. After the calculation of the performance indices, the individual scores of the different dimensions were weighted by applying the expert opinions AHP method. The performance scores and importance scores of the dimensions were calculated with a weighted average, and the final chain performance was found to be 79.7% in the food sector of Turkey.
The raw data supporting the conclusions of this article will be made available by the authors, without undue reservation.
Ethical review and approval was not required for the study on human participants in accordance with the local legislation and institutional requirements. The patients/participants provided their written informed consent to participate in this study.
EY was involved in developing methodology, writing, and reviewing the article, while SE contributed in developing methodology and reviewing the article.
The authors declare that the research was conducted in the absence of any commercial or financial relationships that could be construed as a potential conflict of interest.
Ahi, P., Jaber, M. Y., and Searcy, C. (2016). A comprehensive multidimensional framework for assessing the performance of sustainable supply chains. Appl. Math. Model. 40, 10153–10166. doi: 10.1016/j.apm.2016.07.001
Aksu, B. (2018). Firmalarin Eko-Inovasyona Dayali Sürdürülebilir Performanslarinin Incelenmesinde Bir Model Önerisi Ve Analizi. Kocaeli Üniversitesi Fen Bilimleri Enstitüsü Endüstri Mühendisligi Anabilim Dali, Kocaeli: Doktora Tezi.
Aktepe, A., Ersöz, S., and Toklu, B. (2015). A multi-stage customer satisfaction index estimation model integrating structural equation modeling and mathematical programming. J. Intell. Manufact. 30, 2945–2964. doi: 10.1007/s10845-015-1166-x
Ali, S. M., Moktadir, M. A., Kabir, G., Chakma, J., Rumi, M. J. U., and Islam, M. T. (2019). Framework for evaluating risks in food supply chain: Implications in food wastage reduction. J. Clean. Product. 228, 786–800. doi: 10.1016/j.jclepro.2019.04.322
Allaoui, H., Guo, Y., Choudhary, A., and Bloemhof, J. (2018). Sustainable agro-food supply chain design using two-stage hybrid multi-objective decision-making approach. Comput. Operat. Res. 89, 369–384. doi: 10.1016/j.cor.2016.10.012
Alomar, M., and Pasek, Z. J. (2014). “Linking supply chain strategy and processes to performance improvement,” in Procedia 47th Conference on Manufacturing Systems CIRP 17 (Windsor, ON), 628–634. doi: 10.1016/j.procir.2014.01.144
Angerhofer, B. J., and Angelides, M. C. (2006). A model and a performance measurement system for collaborative supply chains. Decision Support Syst. 42, 283–301. doi: 10.1016/j.dss.2004.12.005
Arowoshegbe, A. O., Emmanuel, U., and Gina, A. (2016). Sustainability and triple bottom line: an overview of two interrelated concepts. Igbinedion Univ. J. Account. 2, 88–126.
Arun Vasantha Geethan, K, Jose, S., and Sunil Chandar, C. (2011). Methodology for performance evaluation of reverse supply chain. Int. J. Eng. Technol. 3, 213–224.
Ayçin, E., and Özveri, O. (2015). Bulanik Modelleme ile Tedarik Zinciri Performansinin Degerlendirilmesi ve Imalat Sektöründe Bir Uygulama. J. Econ. Administr. Sci. 17, 51–60. doi: 10.5578/jeas.9711
Aydogdu, F. (2011). Tedarik Zinciri Yönetiminde SCOR Modeli Ve Veri Zarflama Analizi Entegrasyonu (Yüksek Lisans Tezi). Endüstri Mühendisligi, Gazi Üniversitesi, Fen Bilimleri Enstitüsü, Ankara.
Azadnia, A. H., Saman, M. Z. M., and Wong, K. Y. (2015). Sustainable supplier selection and order lot-sizing: an integrated multi-objective decision-making process. Int. J. Product. Res. 53, 383–408. doi: 10.1080/00207543.2014.935827
Balkema, A. J., Preisig, H. A., Otterpohl, R., and Lambert, F. J. (2002). Indicators for the sustainability assessment of wastewater treatment systems. Urban Water 4, 153–161. doi: 10.1016/S1462-0758(02)00014-6
Beamon, B. M. (1999). Measuring supply chain performance. Int. J. Operations Product. Manage. 19, 275–292. doi: 10.1108/01443579910249714
Bourlakis, M., Maglaras, G., Aktas, E., Gallear, D., and Fotopoulos, C. (2014). Firm size and sustainable performance in food supply chains: Insights from Greek SMEs. Int. J. Product. Econ. 152, 112–130. doi: 10.1016/j.ijpe.2013.12.029
Büyüközkan, G., and Berkol, Ç. (2011). Designing a sustainable supply chain using an integrated analytic network process and goal programming approach in quality function deployment. Expert Syst. Appl. 38, 13731–13748. doi: 10.1016/j.eswa.2011.04.171
Chan, F. T. S. (2003). Performance measurement in a supply chain. Int. J. Adv. Manufacturing Technol. 21, 534–548. doi: 10.1007/s001700300063
Chardine-Baumann, E., and Botta-Genoulaz, V. (2014). A framework for sustainable performance assessment of supply chain management practices. Comput. Industr. Eng. 76, 138–147. doi: 10.1016/j.cie.2014.07.029
Chen, C., Zhang, J., and Delaurentis, T. (2014). Quality control in food supply chain management: an analytical model and case study of the adulterated milk incident in China. Int. J. Product. Econ. 152, 188–199. doi: 10.1016/j.ijpe.2013.12.016
Çokal, I. (2018). https://www.myfikirler.org/turkiye-gida-sektoru-ve-hedefleri.html (Erişim Tarihi: 03.05.2019).
Coteur, I., Marchand, F., Debruyne, L., and Lauwers, L. (2019). Structuring the myriad of sustainability assessments in agri-food systems: a case in Flanders. J. Clean. Product. 209, 472–480. doi: 10.1016/j.jclepro.2018.10.066
Das, D. (2017). Development and validation of a scale for measuring Sustainable Supply Chain Management practices and performance. J. Clean. Product. 164, 1344–1362. doi: 10.1016/j.jclepro.2017.07.006
Del Borghi, A., Gallo, M., Strazza, C., and Del Borghi, M. (2014). An evaluation of environmental sustainability in the food industry through Life Cycle Assessment: the case study of tomato products supply chain. J. Clean. Product. 78, 121–130. doi: 10.1016/j.jclepro.2014.04.083
Fabbrizzi, S., Menghini, S., and Marinelli, N. (2014). The short food supply chain: a concrete example of sustainability. A literature review. Riv. di Stud. Sulla Sostenibilita 2, 189–206. doi: 10.3280/RISS2014-002012
Fernandes, S. M., Rodriguez, C. M. T., Bornia, A. C., Trierweiller, A. C., Silva, S. M. D., and Freire, P. D. S. (2018). Systematic literature review on the ways of measuring the of reverse logistics performance. Gestão Produção 25, 175–190. doi: 10.1590/0104-530x3177-16
Fitzgerald, L., Johnston, R., Brignall, S., Silvestro, R., and Voss, C. (1991). Performance measurement in service businesses. Manage. Account. 69, 34–36.
Gamme, N., and Johansson, M. (2015). Measuring supply chain performance through KPI identification and evaluation (Master's thesis). Department of Technology Management and Economics, “Supply Chain Management” and "Quality and Operations Management”, Chalmers University of Technology, Gothenburg, Sweden.
Ganga, G. M. D., and Carpinetti, L. C. R. (2011). A fuzzy logic approach to supply chain performance management. Int. J. Product. Econ. 134, 177–187. doi: 10.1016/j.ijpe.2011.06.011
Govindan, K. (2018). Sustainable consumption and production in the food supply chain: a conceptual framework. Int. J. Product. Econ. 195, 419–431. doi: 10.1016/j.ijpe.2017.03.003
Guimaraes, J. S., and Salomon, V. P. (2015). ANP applied to the evaluation of performance indicators of reverse logistics in footwear industry, information technology and quantitative management. Procedia Comput. Sci. 55, 139–148. doi: 10.1016/j.procs.2015.07.021
Gunasekaran, A., and Kobu, B. (2007). Performance measures and metrics in logistics and supply chain management: a review of recent literature (1995–2004) for research and applications. Int. J. Product. Res. 45, 2819–2840. doi: 10.1080/00207540600806513
Gunasekaran, A., Patel, C., and McGaughey, R. E. (2004). A framework for supply chain performance measurement. Int. J. Product. Econ. 87, 333–347. doi: 10.1016/j.ijpe.2003.08.003
Haldar, A., Ray, A., Banerjee, D., and Ghosh, S. (2012). A hybrid MCDM model for resilient supplier selection. Int. J. Manage. Sci. Eng. Manage. 7, 284–292. doi: 10.1080/17509653.2012.10671234
Hernandez, C. T., Marins, F. A. S., and da Rocha, P. M. (2009). “Using AHP and ANP to evaluate the relation between reverse logistics and corporate performance in Brazilian automotive industry,” in Proceeding of Proceedings of the 10th International Symposium on the Analytic Hierarchy/Network Process Multi-criteria Decision Making Held (Pennsylvania, IL).
Huang, J., Xia, J., Yu, Y., and Zhang, N. (2018). Composite eco-efficiency indicators for China based on data envelopment analysis. Ecol. Indicators 85, 674–697. doi: 10.1016/j.ecolind.2017.10.040
Hubeau, M., Marchand, F., Coteur, I., Mondelaers, K., Debruyne, L., and Van Huylenbroeck, G. (2017). A new agri-food systems sustainability approach to identify shared transformation pathways towards sustainability. Ecol. Econ. 131, 52–63. doi: 10.1016/j.ecolecon.2016.08.019
Hugé, J., Waas, T., Dahdouh-Guebas, F., Koedam, N., and Block, T. (2013). A discourse-analytical perspective on sustainability assessment: interpreting sustainable development in practice. Sustain. Sci. 8, 187–198. doi: 10.1007/s11625-012-0184-2
Hwang, Y. D., Lin, Y. C., and Lyu, J. (2008). The performance evaluation of SCOR sourcing process–the case study of Taiwan's TFT-LCD industry. Int. J. Product. Econ. 115, 411–423. doi: 10.1016/j.ijpe.2007.09.014
Jaccard, J., and Wan, C. K. (1995). Measurement error in the analysis of interaction effects between continuous predictors using multiple regression: multiple indicator and structural equation approaches. Psychol. Bull. 117, 348–357. doi: 10.1037/0033-2909.117.2.348
Jöreskog, K.G., and Sörbom, D. (1993). Lisrel 8: Structural Equation Modeling with the SIMPLIS Command Language. Lincolnwood, IL: Scientific Software International.
Kafa, N., Yasmina, H., and El Mhamedi, A. (2013). Sustainability performance measurement for green supply chain management. IFAC Proc. 46, 71–78. doi: 10.3182/20130911-3-BR-3021.00050
Kaipia, R., Dukovska-Popovska, I., and Loikkanen, L. (2013). Creating sustainable fresh food supply chains through waste reduction. Int. J. Phys. Distr. Logistics Manage. 43, 262–276. doi: 10.1108/IJPDLM-11-2011-0200
Kaplan, R. S. (Ed.). (1990). Measures for Manufacturing Excellence. Boston, MA: Harvard Business School Press.
Kaplan, R. S., and Norton, D. P. (1997). Balanced Scorecard: Translating Strategy into Action, 4th Edn. Boston, MA: Harvard Business School Press.
Katiyar, R., Meena, P. L., Barua, M. K., Tibrewala, R., and Kumar, G. (2018). Impact of sustainability and manufacturing practices on supply chain performance: findings from an emerging economy. Int. J. Product. Econ. 197, 303–316. doi: 10.1016/j.ijpe.2017.12.007
Kayiş, A. (2006). SPSS Uygulamali Çok Degişkenli Istatistik Teknikleri. Ankara, Asil Yayin Dagitim Ltd. Sti.
Kirwan, J., Maye, D., and Brunori, G. (2017). Acknowledging complexity in food supply chains when assessing their performance and sustainability. J. Rural Stud. 52, 21–32. doi: 10.1016/j.jrurstud.2017.03.008
Kleine, R. B. (1998). Software programs for structural equation modeling: AMOS, EQS and LISREL. J. Psycho Educ. Assess. 16, 302–323. doi: 10.1177/073428299801600407
Kline, R. B. (2011). Principles and Practice of Structural Equation Modeling. New York, NY: The Guilford Press.
Koç, G. (2015). Tarimda ve Gidada Sürdürülebilir Tedarik Zinciri: Türkiye Incelemesi. Ege Üniversitesi Iktisadi ve Idari Bilimler Fakültesi, Izmir.
Kumar, S., Chattopadhyaya, S., and Sharma, V. (2013). Developing green supply chain system for Indian enterprises. Int. J. Bus. Excellence 6, 270–292. doi: 10.1504/IJBEX.2013.053610
Li, D., Wang, X., Chan, H. K., and Manzini, R. (2014). Sustainable food supply chain management. Int. J. Prod. Econ. 152, 1–8. doi: 10.1016/j.ijpe.2014.04.003
Macharis, C., Springael, J., De Brucker, K., and Verbeke, A. (2004). PROMETHEE and AHP: the design of operational synergies in multicriteria analysis: strengthening PROMETHEE with ideas of AHP. Eur. J. Operat. Res. 153, 307–317. doi: 10.1016/S0377-2217(03)00153-X
McDonald, R. P., and Marsh, H. W. (1990). Choosing a multivariate model: noncentrality and goodness of fit. Psychol. Bull. 103, 324–411. doi: 10.1037/0033-2909.107.2.247
Moshtaghfard, R., Arbabshirani, B., and Alinaghian, M. (2016). Reverse logistics performance measurement by integrated balanced scorecard and data envelopment analysis (Case Study in Pak Dairy Co.). Int. J. Adv. Manage. Sci. 5, 17–34. doi: 10.14355/ijams.2016.05.002
Murphy, K. R., and Davidshofer, C. O. (1998). Psychological Testing, 4th Edn. New Jersey, NJ: Prentice Hall, 602.
Neely, A., Gregory, M., and Platts, K. (1995). Performance measurement system design: a literature review and research agenda. Int. J. Operations Product. Manage. 15, 80–116. doi: 10.1108/01443579510083622
Olugu, E., and Wong, K. Y. (2011). Fuzzy logic evaluation of reverse logistics performance in the automotive industry. Sci. Res. Essays 6, 1639–1649.
Özalp, Ö. (2016). Tedarik Zinciri Performansinin Ölçümü: Ekonomik Katma Deger Yönteminin Analizi (Yüksek Lisans Tezi). Dokuz Eylül Üniversitesi, Sosyal Bilimler Enstitüsü, Izmir.
Özdamar, K. (1999). “Paket Programlar Ile Istatistiksel Veri Analizi”, in Eskişehir, Kaan Kitabevi, 2. Baski (Eskisehir: Kaan Kitabevi), 584.
Pires, S. R. I., and Aravechia, C. H. M. (2001). “Measuring supply chain performance,” in Anais da XII Annual Conference of POMS (Orlando).
Ramezankhani, M. J., Torabi, S. A., and Vahidi, F. (2018). Supply chain performance measurement and evaluation: a mixed sustainability and resilience approach. Comput. Industr. Eng. 126, 531–548. doi: 10.1016/j.cie.2018.09.054
Rohmer, S. U. K., Gerdessen, J. C., and Claassen, G. D. H. (2019). Sustainable supply chain design in the food system with dietary considerations: a multi-objective analysis. Eur. J. Operational Res. 273, 1149–1164. doi: 10.1016/j.ejor.2018.09.006
Saaty, T. L. (1986). Axiomatic foundation of the analytic hierarchy process. Manage. Sci. 32, 841–855. doi: 10.1287/mnsc.32.7.841
Saibani, N. (2010). Performance measurement for reverse and closed-loop supply chains (Diss). University of Nottingham, Nottingham, United Kingdom.
Sangwan, K. S. (2017). “Key activities, decision variables and performance indicators of reverse logistics,” in The 24th CIRP Conference on Life Cycle Engineering, Procedia CIRP 61, 257–262. doi: 10.1016/j.procir.2016.11.185
Shaik, M., and Abdul-Kader, W. (2012). Performance measurement of reverse logistics enterprise: a comprehensive and integrated approach. Measuring. Bus. Excellence 16, 23–34. doi: 10.1108/13683041211230294
Shi, W., and Gao, T. (2016). Supply chain performance evaluation model based on unascer-tained clustering. Rev. Téc. Ing. Univ. Zulia. 39, 195–201. doi: 10.21311/001.39.6.24
Smith, B. G. (2007). Developing sustainable food supply chains. Philos. Trans. R. Soc. B Biol. Sci. 363, 849–861. doi: 10.1098/rstb.2007.2187
Sun, J., Wang, C., Ji, X., and Wu, J. (2017). Performance evaluation of heterogeneous bank supply chain systems from the perspective of measurement and decomposition. Comp. Industr. Eng. 113, 891–903. doi: 10.1016/j.cie.2017.05.028
Tao, X. (2009). “Performance evaluation of supply chain based on fuzzy matter-element theory,” in Inter-national Conference on Information Management, Innovation Management and Industrial Engineering, 2009, Vol. 1 (Xi'an: IEEE). doi: 10.1109/ICIII.2009.138
Thompson, B., and Daniel, L. G. (1996). Factor analytic evidence for the construct validity of scores: a historical overview and some guidelines. Educ. Psychol. Measure. 56, 197–208. doi: 10.1177/0013164496056002001
Ting, S. L., Tse, Y. K., Ho, G. T. S., Chung, S. H., and Pang, G. (2014). Mining logistics data to assure the quality in a sustainable food supply chain: a case in the red wine industry. Int. J. Product. Econ. 152, 200–209. doi: 10.1016/j.ijpe.2013.12.010
Uysal, F. (2012). An integrated model for sustainable performance measurement in supply chain. Proc. Soc. Behav. Sci. 62, 689–694. doi: 10.1016/j.sbspro.2012.09.117
Wang, J., and Yue, H. (2017). Food safety pre-warning system based on data mining for a sustainable food supply chain. Food Control 73, 223–229. doi: 10.1016/j.foodcont.2016.09.048
Yang, J. (2010). “On the construction and implementation methods for performance measurement of reverse supply chain,” in 7th International Conference on Fuzzy Systems and Knowledge Discovery (FSKD), 2010, Vol. 2 (Yantai: IEEE). doi: 10.1109/FSKD.2010.5569111
Yang, J., Zang, L., and Hao, Z. (2009). “Study on the performance evaluation system of reverse supply chain based on BSC and triangular fuzzy number AHP,” in International Conference on Information Engineering and Computer Science, 2009. ICIECS 2009 (Wuhan: IEEE). doi: 10.1109/ICIECS.2009.5364327
Yavuz, O., and Ersoy, A. (2013). Tedarik Zinciri Performansinin Degerlendirilmesinde Kullanilan Degişkenlerin Yapay Sinir Agi Yöntemiyle Degerlendirilmesi. Ankara: Gazi Üniversitesi Iktisadi ve Idari Bilimler Fakültesi Dergisi, Vol. 15, 209–256.
Yellepeddi, S. (2006). An Analytical Network Process (ANP) Approach for the Development of a Reverse Supply Chain Performance Index in Consumer Electronics Industry. Faculty of the Graduate School of the University of Texas at Arlington in Partial Fulfillment of the Requirements for the Degree of Doctor of Philosophy, the University of Texas at Arlington, Texas, USA.
Yellepeddi, S. S., Rajagopalan, S., and Liles, D. H. (2005). “A balanced scorecard approach for an effective reverse supply chain in electronics industry,” in Proceedings of the Annual Conference of International Journal of Industrial Engineering (Clearwater, FL).
Yetim, S. (2004). Analitik Hiyerarşi Sürecine Ait Bazi Matematiksel Kavramlar. Gazi Üniversitesi Gazi Egitim Fakültesi Dergisi (Ankara), 12, 457–468.
Zailani, S., Jeyaraman, K., Vengadasan, G., and Premkumar, R. (2012). Sustainable supply chain management (SSCM) in Malaysia: a survey. Int. J. Prod. Econ. 140, 330–340. doi: 10.1016/j.ijpe.2012.02.008
Zhu, Q., Sarkis, J., and Geng, Y. (2005). Green supply chain management in china: pressures, practices and performance. Int. J. Operations Product. Manage. 25, 449–468. doi: 10.1108/01443570510593148
Zhu, Q., Sarkis, J., and Lai, K. H. (2007). Green supply chain management: pressures, practices and performance within the Chinese automobile industry. J. Clean. Prod. 15, 1041–1052. doi: 10.1016/j.jclepro.2006.05.021
Keywords: sustainability performance, performance assessment, food supply chain, Structural Equation Modeling, sustainability supply chain
Citation: Yontar E and Ersöz S (2020) Investigation of Food Supply Chain Sustainability Performance for Turkey's Food Sector. Front. Sustain. Food Syst. 4:68. doi: 10.3389/fsufs.2020.00068
Received: 11 April 2020; Accepted: 23 April 2020;
Published: 05 June 2020.
Edited by:
Cristobal N. Aguilar, Universidad Autónoma de Coahuila, MexicoReviewed by:
Cristian Torres-León, Universidad Autónoma de Coahuila, MexicoCopyright © 2020 Yontar and Ersöz. This is an open-access article distributed under the terms of the Creative Commons Attribution License (CC BY). The use, distribution or reproduction in other forums is permitted, provided the original author(s) and the copyright owner(s) are credited and that the original publication in this journal is cited, in accordance with accepted academic practice. No use, distribution or reproduction is permitted which does not comply with these terms.
*Correspondence: Emel Yontar, ZXlvbnRhckB0YXJzdXMuZWR1LnRy
Disclaimer: All claims expressed in this article are solely those of the authors and do not necessarily represent those of their affiliated organizations, or those of the publisher, the editors and the reviewers. Any product that may be evaluated in this article or claim that may be made by its manufacturer is not guaranteed or endorsed by the publisher.
Research integrity at Frontiers
Learn more about the work of our research integrity team to safeguard the quality of each article we publish.