- 1College of Resources and Environment, China Agricultural University, Beijing, China
- 2Institute of Environment and Sustainable Development in Agriculture, Chinese Academy of Agricultural Sciences, Beijing, China
Dairy farming intensification results from the increasing demand for dairy products being met by increasing livestock populations, which places huge pressure on resources and the environment due to poor manure management. In this study, we first quantify the nitrogen (N) flows of two typical dairy manure management systems: “Ganqingfen” system and slurry-based system, based on a substance (N) flow analysis method. Second, the effects of ammonia (NH3) abatement technologies on N recycling efficiency (NRE) and N losses are evaluated for the two systems through a scenario analysis. Furthermore, we explore the mitigation potential of integrated crop and dairy production systems using a scenario analysis of a concatenation of mitigation techniques. The results indicate that the ratio of returned manure N in the “Ganqingfen” and slurry-based manure systems are 32 and 34% of feed N, respectively. N losses from manure management are 56.8–59.5% of total N excretion, of which approximately 50% is emitted as NH3. The scenario analysis indicates that implementation of single or combined NH3 abatement measures can reduce NH3 emissions by 2–56%, whereas nitrous oxide emissions (N2O) can increase depending on the specific measures. Total losses can be reduced from 80.4–83.5 kg N·head−1 to 49.2–55.7 kg N·head−1. Regarding integrated crop and dairy production systems, as the level of scenario optimization improves, resource use (e.g., land use and chemical fertilizer use) and N losses (particularly NH3 emissions) are decreased, while the NRE improves. The results of this study provide insights into the N flow and losses of typical dairy manure management systems in China, as well as effective measures toward the sustainable development of integrated crop and livestock production systems.
Introduction
China's growing population, dietary changes, and increasing urbanization have greatly increased the demand for dairy products, leading to rapid intensification of the domestic dairy industry (Wei, 2016). From 2002 to 2016, dairy herd stock in China increased from 6.79 million to 15.07 million and the number of intensified farms increased 11-fold (Ministry of Agriculture, 2016). Thus, China has rapidly become the third largest country for milk production (Food and Agriculture Organization of the United Nations (FAO), 2016). However, meeting these increasing demands for dairy consumption generates huge pressures on resources and the environment. Typically, dairy farmers are more concerned with the benefits of a growing industry and neglect effective manure management, which leads to low nitrogen recycling efficiency (NRE) and a series of environmental pollution problems (Bai et al., 2016). Research on a regional scale has shown that the average rate of excreted N recycling is only 28.5% in China and is particularly low in Huang Huaihai and other areas with a high density of dairy farms (22%) (Zhao et al., 2009). Although N is emitted in different ways during manure management, ammonia (NH3) is the main pathway (Yang et al., 2016). NH3 is closely related to the formation of aerosols and acid rain and negatively affects human health (Todd et al., 2008; Shen et al., 2011). Milk production contributes 20% to total greenhouse gas emissions from livestock in the world (Zhang et al., 2017). Therefore, it is crucial to mitigate N-derived environmental pollution from the dairy industry while meeting the growing demands for dairy products in China.
Considering the high environmental impact of animal manure management, efforts have been made around the world to mitigate N losses. This has involved research into reducing the content of crude protein in feed (Lee et al., 2012; Hou et al., 2015), acidification and cover during the manure storage period (Kai et al., 2008; Petersen et al., 2012), and methods of manure application to farmland (injection, band spreading, incorporation) (Bhandral et al., 2009). Recently, domestic experts have also begun to research on mitigation measures (Ma et al., 2010; Zhai, 2015). Some studies have shown that partial replacement of chemical fertilizers with organic fertilizers could substantially improve the recycling efficiency of livestock manure, reduce environmental pollution linked to chemical fertilizers and manure, and improve crop yield at the same time (Xia et al., 2017; Zhang et al., 2019). However, the majority of studies have focused on the impacts of single measures on specific parts of the farming system. A systematic study on the European agricultural and animal husbandry system showed that, although single N mitigation measures can reduce emissions from one part of the system, they may increase emissions from other parts of the system (i.e., pollution swapping) (Oenema et al., 2009). Researches on manure management measures from the perspective of integrated agricultural and animal husbandry systems are rare in China, yet analyzing N flow characteristics and mitigation technology impacts from a systematic perspective is crucial for minimizing N pollution and developing effective policies.
Therefore, in this study, we analyze the characteristics of N flows and losses in a typical dairy production system in China through field investigations, literature analysis, and numerical modeling. We then quantify the NH3 mitigation potential under different N removal measures in the dairy manure management chain. In addition, we explore the mitigation potential of coupled crop and dairy production systems through a scenario analysis of a set of combined management measures. Our study provides key insights into the N flows and losses of typical dairy manure management systems in China, and has practical applications for reducing environmental pollution and promoting more sustainable development of agriculture and animal husbandry.
Materials and Methods
Modeling Framework
Two typical dairy manure management systems were chosen as case studies, which were representatives for the North China Plain. The first is the “Ganqingfen” system, which describes the separate collection of liquid and solid waste, and the second is a slurry-based system. The main management measures of the “Ganqingfen” system are as follows: (a) regular feeding formula from survey data (Table S2); (b) a concrete floor in the housing stage, cleaned by a manure scraper twice a day; (c) liquid urine flows into a lagoon and solid feces are collected from feedlots before being placed into open-air storage; (d) a predominantly earthen open lot floor, cleaned twice a week, with the manure placed into open-air storage; (e) liquid/slurry and solid manure are spread onto the surface of surrounding farmland (we assume that no manure is directly discharged). The slurry-based system is a slatted floor in the housing stage; slurry is produced in combination of urine and feces. Slurry is generally removed from the deep pits under housing floors, while solid manure is collected from open lot, and then stored outside without coverage, until the time for application to cropland (Zhu, 2009; Wei, 2016).
We define the system boundaries of N flow in an integrated crop and dairy production system using the combined approaches of literature analysis, farm surveys, and expert opinion (Figure 1). The purchase of feed and fertilizer is the exogenous input item of the system. The yield of crop products, cow products are the output items; N losses in the manure management chain including the feeding, storage, and application stages, and N loss through fertilizer application, are the surplus N. The integrated dairy-crop production system consists of two subsystems: dairy production and crop production. N circulation exists within and between these subsystems. Crop residues return to the field directly, representing circulation within the subsystem, whereas manure returns to the field as N circulation between the subsystems. Losses of N into the atmosphere include the emission of ammonia volatilization (NH3), nitrous oxide (N2O), and nitrogen (N2). Losses of N into water bodies include leaching and runoff.
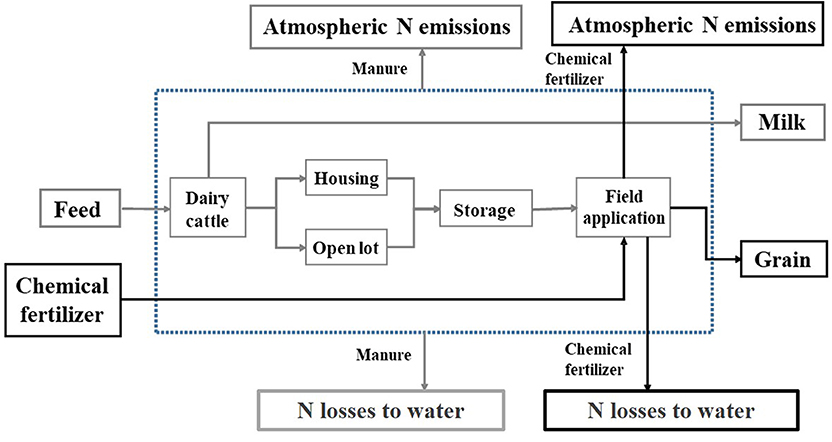
Figure 1. Research boundary of N flow in agriculture and husbandry combined system-dairy cattle as example. (Notes: The dotted line refers to the study boundary of integrated crop and dairy production system. The gray boxes and arrows indicate N flow items of the manure management chain, and the black boxes and arrows indicate the other N flow (not due to cattle production) items of integrated system. Atmospheric N emissions include NH3, N2O, and N2).
Model Calculation and Data Sources
In this study, N inputs, product outputs, and surplus N related to manure and fertilizer management were quantified separately for the dairy manure management chain and the integrated crop and dairy production system using the NUFER (NUtrient flows in Food chains, Environment and Resources use) model (Ma et al., 2010).
Calculations Related to the Dairy Manure Management Chain
The N input items were calculated as follows:
where IaN intake is the amount of N input as feed (kg N·head−1), Iafeed component x are the different components x of the animals rations mentioned in Table S2 (corn to fish meal), Iaanimal number i is the number of cattle per category in terms of calves, rearing cattle, lactating cow, … (heads per category; see Table S1) and IaNfeed content x is the N content of each type of feed (%). Σ is used for summing the feed N intake of the different animal categories and feed components of the ration. All the feedstuffs are assumed to be purchased.
The product output items were calculated as follows:
where Oamilk N is N content of milk (kg N·head−1), Oayield is the milk yield of each lactating cattle each year, Oalactating number is the number of lactating cattle (head), and OaNmilk content is the N content of milk (%).
Surplus N was calculated as follows:
where OaNweightgain is the nitrogen gained as body growth of all cattle in a year (kg N·year−1), Numi is the number of cattle in stage i, LWGi is the gained weight of each cow in stage i which includes calves, young cattle, rearing cattle, dairy cattle, and dry cattle (Table S1), and Fmeat N is the N content of the gained weight (%). OaN loss livestock represents the total losses in the manure management chain in a year (kg N·head−1) and consists of N losses in housing (OaNhousing), open lot (OaNopenlot), storage stage (OaNstorage), and manure application (OaNapplication−s, which only consider N losses on the surface, NH3 and Nrunoff), which were calculated according to the N flows (e.g., “total N excretion share housing and open lot” – “N losses in form of NH3/N2O/N2/N leaching/N runoff from open housing and open lot” = “N in manure going to storage,” “N in manure going to storage share liquid and solid manure” – “N losses in form of NH3/N2O/N2/N leaching/N runoff from storage” = “N in manure going to crop production”) and activity/process-specific emission factors for NH3, N2O, N2, and N leaching and runoff (Table 1). Oamanure N (kg·year−1) is the amount of N output as crop-available manure per year, determined by the mass balance calculation method.
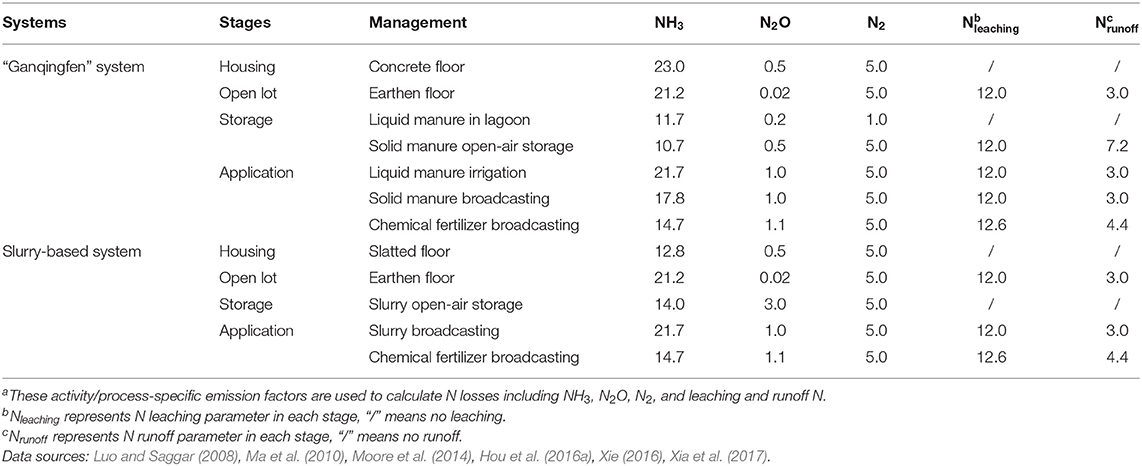
Table 1. Parameters of various pathways of N losses at each manure management stages in reference systems (% of N)a.
Calculations Related to the Integrated Crop and Dairy Production System
The N input items were calculated as follows:
where IaN input is the total N input to the integrated crop and dairy production system, IafertilizerN is the amount of N input as fertilizer per year in the maize-wheat rotation system (kg·ha−1), Iafertilizer is the amount of fertilizer applied each year, and FNcontent is the N content of fertilizer (%).
The product output items were calculated as follows:
where OagrainN is the N output as produced wheat and maize grain (kg·ha−1), Oayield i is yield of wheat and maize per year, and OaNcontent is the N content of wheat and maize grain (%); Σ is summing the N yield of two crops.
Surplus N was calculated as follows:
where Oa Nloss is the total N losses in integrated crop and dairy system per year (kg·year−1), OaN field−manure is N losses after manure applied to the field, including N2O (N2Ofield−manure), N2 (N2 field−manure) and leaching N (leaching Nfield−manure), emission factors are listed in Table 1. OaCF N loss represents the total N losses of chemical fertilizer during crop production per year (kg·ha−1), including losses as gas (Oagas N loss) and due to leaching and runoff to water (Oawater N loss). Oasoil accumulation is the amount of N accumulated in the soil during the crop production process, derived from the mass balance calculation method.
Data Sources
Basic data sources of the modeling system
The manure management chain predominantly includes feeding, housing, manure storage and treatment, and manure field application. Three data sources were employed in this study. First, survey data of dairy farms in North China Plain were used to obtain data (e.g., feed composition, milk yield …) on typical manure management systems and herd structure of typical dairy production systems in the model. Second, statistical data from sources such as the China Animal Husbandry Statistical Yearbook and FAO were used to analyze the scale of dairy cattle breeding in order to select a representative scale for the research. Third, previous literature and existing model parameters were used to quantify the environmental emissions and provided a basis for the scenario analysis and optimization.
Manure management chain data
This study chose dairy farm with 500-head stock as the research object, based on the large proportion of industrial dairy farms (stock>200 heads, 37%, in which 77% are farms with stock>500 heads) in North China Plain (Ministry of Agriculture, 2010). The feed amount and composition (Table S2), herd structure, milk yield (7,610 kg·head−1 annually), dry matter content, crude protein content, and N content of feed and milk were derived from survey data (Wei et al., 2017). As the feed protein content optimized from 15 to 14%, milk yield of lactating cows increased by 3.4% (Zhai, 2009). The average yearly weight gain of cattle in different stages was derived from Ma et al. (2014) and Bai (2015). The distribution coefficient and N content of dairy gained weight was obtained from Liu (2005) and Ma et al. (2010). The time allocation of cows between housing and open lots was 73 and 27%, respectively (Zhu, 2009). The ratio of solid to liquid fraction (7:9) was defined according to the average value in Hou et al. (2016a). The emission factors for the two typical systems in housing and open lot, storage, and manure application stages are listed in Table 1. Some factors were obtained from experimental data and NUFER model data for China (Ma et al., 2010; Xie, 2016; Xia et al., 2017), and any missing data was selected from foreign studies (Luo and Saggar, 2008; Moore et al., 2014; Hou et al., 2016a). The emission mitigation ratio of different technologies was selected preferentially from Chinese studies over foreign studies (Hou et al., 2015; Reis et al., 2015; Xing et al., 2018). Model parameters were selected as much as possible from data in published literature to ensure accuracy.
Integrated crop and dairy production system data
We chose the wheat-maize rotation system in the field application stage as it is the most common crop system in the North China Plain. In the reference system (current situation), the total N input and the proportion of applied organic manure (5% of total N use on average) were derived from the survey data, the manure and chemical fertilizer manually applied to farms and the emission factors (Table 1) were derived from Xia et al. (2017), and the ratio of grain and straw yields and the N contents of each part were derived from the NUFER model (Ma et al., 2010). It was assumed that interactions between the fertilizer and manure would not impact the results. Regarding the optimization measures, the recommended fertilization rate was obtained from Zhang et al. (2009) and the crop yield changes for different manure substitute ratios were derived from Zhang et al. (2019). The specific emission factors of manure and chemical fertilizer are listed in Table 1, in which we assumed that the surrounding farmland was able to use the manure from the modeled dairy farm.
Manure Management Chain Scenarios
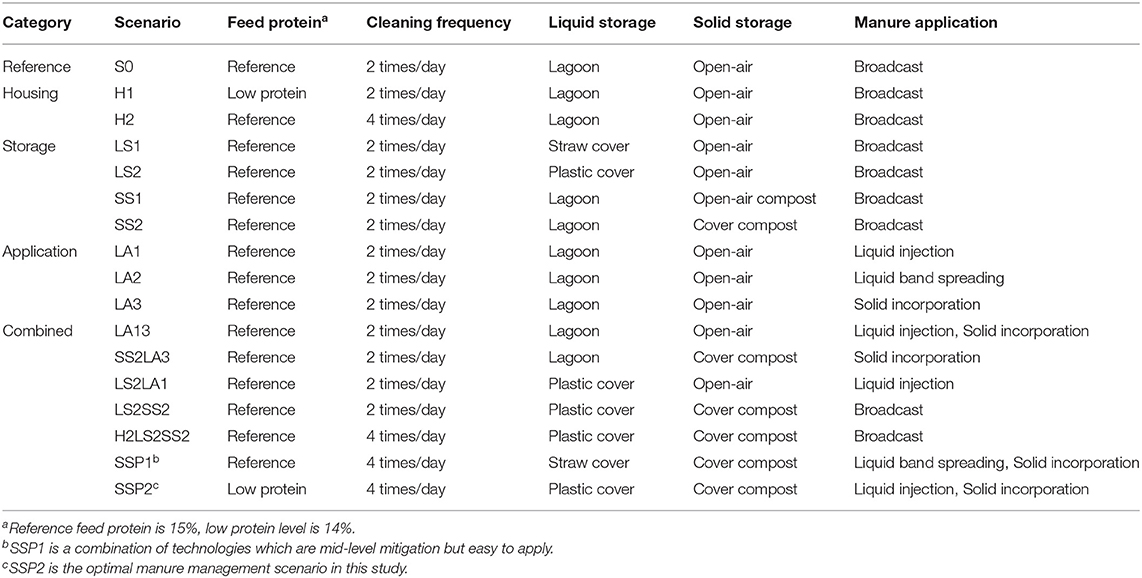
This study applied NH3 mitigation scenarios to the dairy manure management chain based on the difference between single and combined technologies of NH3 abatement in different stages of manure management. The scenarios included technologies applied to the feed (i.e., reducing crude protein in the feed), the housing and open lot (i.e., increasing the cleaning frequency), liquid manure storage (i.e., using straw cover and plastic film), solid manure storage (i.e., using open-air compost and plastic-film compost), and field application stages (i.e., liquid injection and band spreading and solid incorporation). The scenarios were the same for the two typical manure management systems (Table 2).
Integrated Crop and Dairy Production System Scenarios
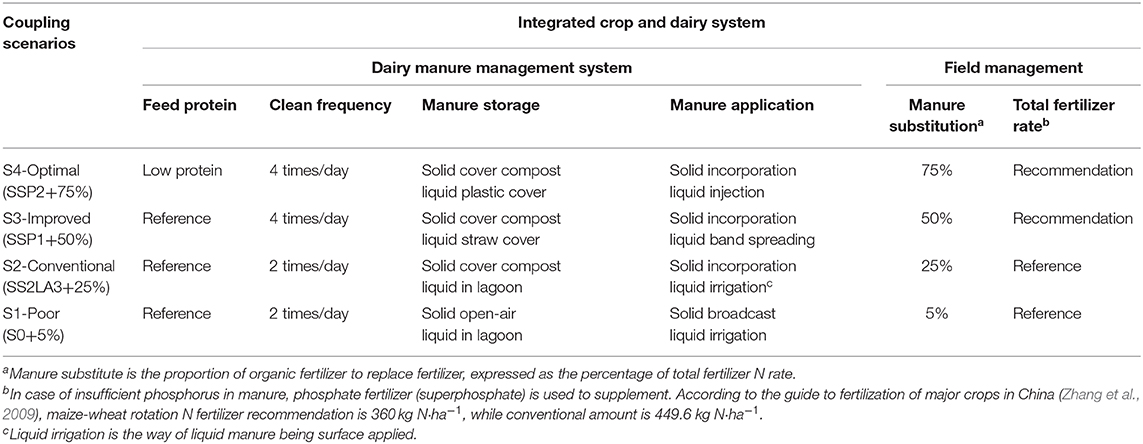
As well as the manure management chain, the proportion of manure used to replace fertilizer in the total fertilizer rate can also influence N recycling in an integrated crop and dairy production system. In order to explore the potential impacts and mechanism of the coupling system on N resources, agricultural, and animal product yields, and environmental emissions under different management levels, this study set four management levels (based on Styles et al., 2018); i.e., S1 is a poor scenario, S2 is the conventional scenario, S3 is an improved scenario, and S4 is the optimal scenario (Table 3).
Definition of Key Assessment Indicators
In this study, a set of indicators was selected to describe the characteristics of N flows in the dairy farming system, and efficiency-related indicators were selected to describe the relationship between N outputs and inputs along the system. The specific indicators were as follows: (1) the feed use efficiency was the percentage of feed N input going to milk N; (2) the feed conversion rate (FCR) was the amount of feed used per unit product (kg feed/kg milk); (3) the manure N-recycling efficiency (NRE) was the percentage of excreted N going to N obtained by grain; (4) the reduction ratios of emissions (NH3 and N2O) were used to compare abatement technologies with the reference system (without mitigation measures); and (5) the emission intensity was expressed as total N loss per lactating cow (kg N head−1).
Results
N Flow Characteristics in Two Typical Dairy Manure Management Chains
At the farm level, dairy feed use efficiency is 15% and the feed conversion rate (FCR) is 1.38 kg feed/kg milk. The percentage of manure N available for crops of the total feed N is 32–34%, with no significant difference between the two typical systems. Total N losses account for 50% of the total feed N input, with housing being the main emission stage (34% of total losses), atmospheric emission being the major path (78% of total N losses), and NH3 accounting for 47–51% of atmospheric emissions (Figure 2).
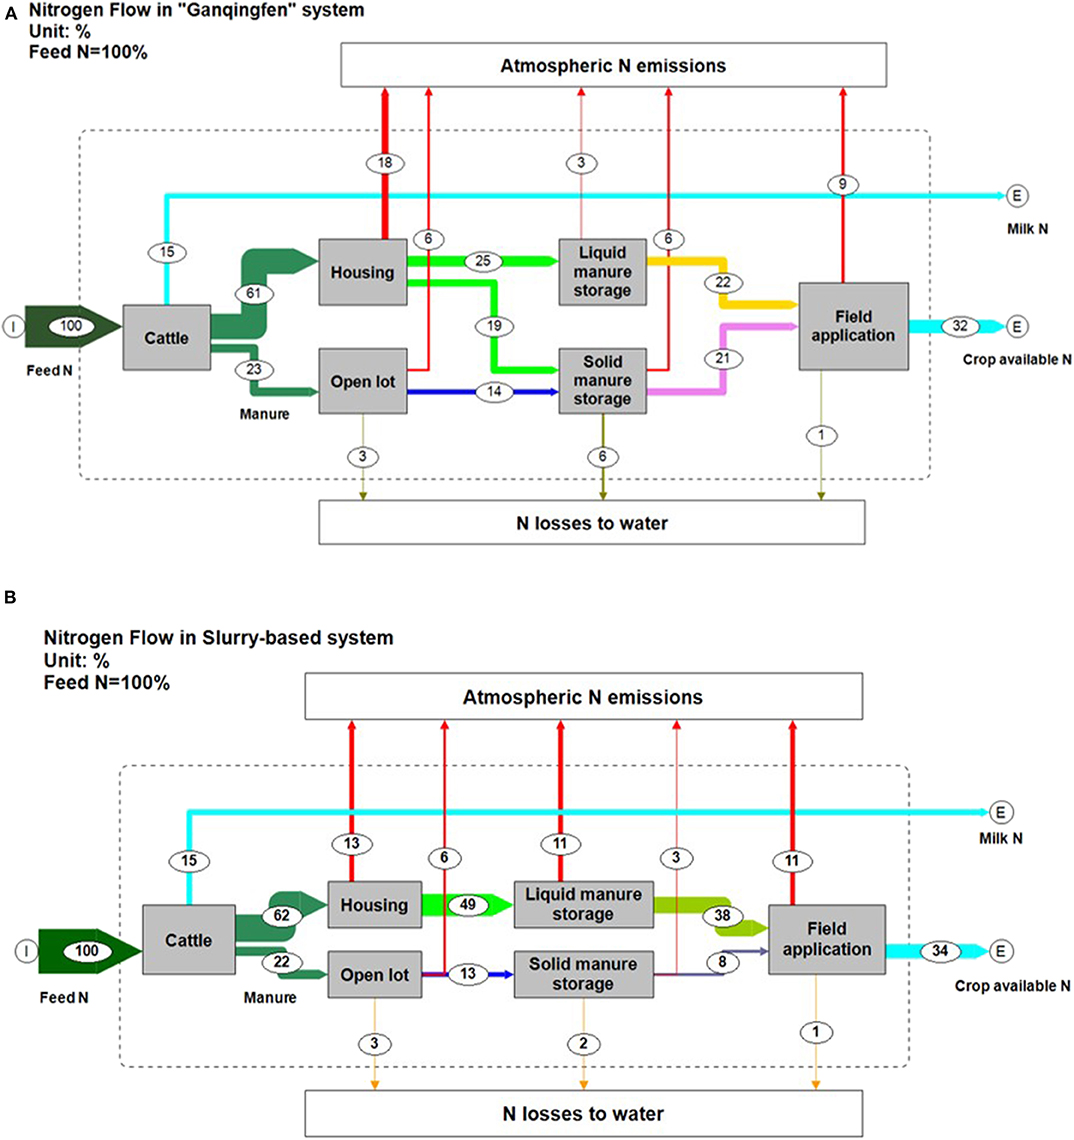
Figure 2. Characteristics of N flow in manure management chain of two typical dairy farms. (A) N flow in “Ganqingfen” system. (B) N flow in slurry-based system.
Ammonia Mitigation Potential in Two Typical Dairy Manure Management Chains
In reference scenario S0, the main stages of NH3 emission in the “Ganqingfen” system are the housing, field application, and open lot stages, accounting for 40.7, 24.1, and 16.8% of total NH3 emissions, respectively. Conversely, in the slurry-based reference system, the main volatilization stages are the field application (30.4%), housing (24.9%), liquid manure storage (24.1%), and open lot (16.8%) stages. Compared to S0, the potential range of NH3 reduction of the “Ganqingfen” manure management chain under the other scenarios is 4–42% (Figure 3A), whereas that of the slurry-based system is 2–56% (Figure 3B), among which combined technologies (SSP2) is the best mitigation measure in both systems. Among the single technology measures, open-air compost (SS1, 17% reduction) has better effect in the “Ganqingfen” system, whereas composting with coverage (SS2, 18.4%) is the best single measure in the slurry-based system.
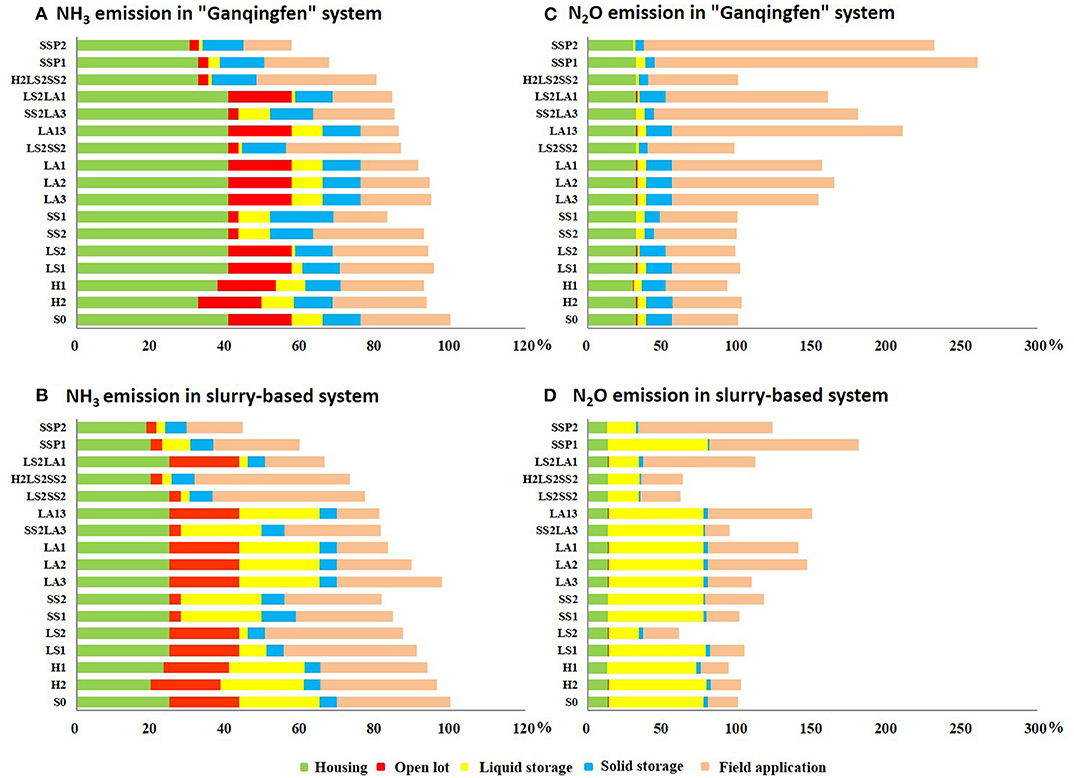
Figure 3. Ammonia and nitrous oxide losses in manure management system under different scenarios. (A) NH3 emission in “Ganqingfen” system. (B) NH3 emission in slurry-based system. (C) N2O emission in “Ganqingfen” system. (D) N2O emission in slurry-based system.
The results show that some mitigation scenarios increase N2O. For example, in the “Ganqingfen” system, increasing the cleaning frequency (H2), using straw cover (LS1), and employing field application technologies (LA1, LA2, LA3) have the potential to increase N2O by 2–64%, and combined technology scenarios have the potential to increase N2O by 0.2–160%, among which SSP1 has the highest potential (Figure 3C). In the slurry-based system, increasing the cleaning frequency (H2), using straw cover (LS1), open-air compost (SS1), cover compost (SS2), and field application technologies (LA1, LA2, LA3), and employing combined technologies all increase N2O emissions (1–81%), among which SSP1 has the highest potential (Figure 3D).
The total N losses vary between different NH3 reduction measures; the total N losses of the “Ganqingfen” reference system are 83.5 kg N·head−1, with the proportions of NH3, N2, N2O, N leaching, and runoff losses accounting for 50%, 1%, 23%, 18%, and 7%, respectively. Single measures could best mitigate N loss to 71.1 kg N·head−1 (SS1), while comprehensive mitigation measures (SSP2) could reduce it to 55.7 kg N·head−1 (Figure 4A). The total N losses of the slurry-based reference system are 80.4 kg N·head−1, with the proportions of NH3, N2, N2O, N leaching, and runoff losses accounting for 48%, 3%, 29%, 15%, and 5%, respectively. Single measures could best mitigate N loss to 71.1 kg N·head−1 (LS2), and comprehensive mitigation measures (SSP2) could reduce total N losses to 49.2 kg N·head−1 (Figure 4B).
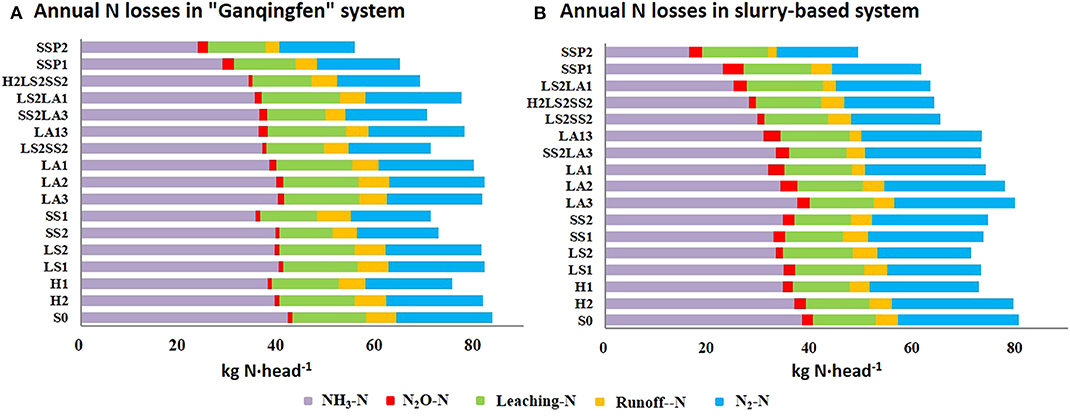
Figure 4. Annual N losses per head cattle in manure management system under different scenarios. (A) N losses in “Ganqingfen” system. (B) N losses in slurry-based system.
Different scenarios affect the utilization efficiency of N in the manure management chain. The NREs of the “Ganqingfen” and slurry-based reference systems are 40.5% and 43.2%, respectively. In the “Ganqingfen” system, the NREs of single technologies range from 40.5 to 52.6%, among which open-air compost (SS1) has higher potential to improve NRE, and the NREs of combined technologies range from 46.5 to 62.8%, among which SSP2 has the best NRE (Figure 5A). In the slurry-based system, the greatest improvement in NRE is 69.8% through SSP2 (Figure 5B).
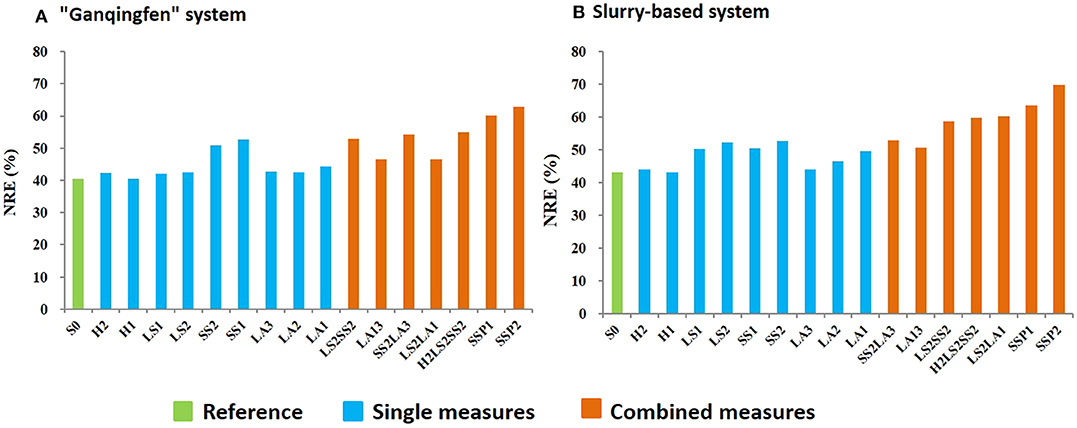
Figure 5. Nitrogen recycling efficiency (NRE) in manure management system. (A) NRE for “Ganqingfen” system. (B) NRE for slurry-based system.
Assessment of Resource Use and Environmental Costs in an Integrated Crop and Dairy Production System
Compared to the S1 (poor scenario), the resource use (land use, fertilizer, feed) and environmental impacts (total N losses) of the integrated crop and dairy production system are significantly reduced with increasing optimization level; i.e., the NRE is significantly improved and grain and milk yields are slightly increased (Figure 6). Compared with S1, when producing 1 kg of fat and protein corrected milk (FPCM, CP = 4%) in the “Ganqingfen” system, comprehensive measures under the optimal scenario (S4) can significantly reduce fertilizer N use by 80–98%, substantially reduce the land required to consume manure from the dairy farm by 75–90%, and optimize other indicators (Table S3). Furthermore, N2O emissions are increased by 59–160% compared to S1, whereas total N losses are reduced by 16–34%. Moreover, optimization of the slurry-based system through a combined crop and animal production system (S4) can significantly reduce resource use (fertilizer N reduced by 82–98%, land use decreased by 77–90%), and mitigate environmental emissions (feed use decreased by 0–3%, NH3 reduced by 14–57%, total N losses reduced by 17–39%) compared to S1. These measures also affect N2O emission by −6 to 81%.
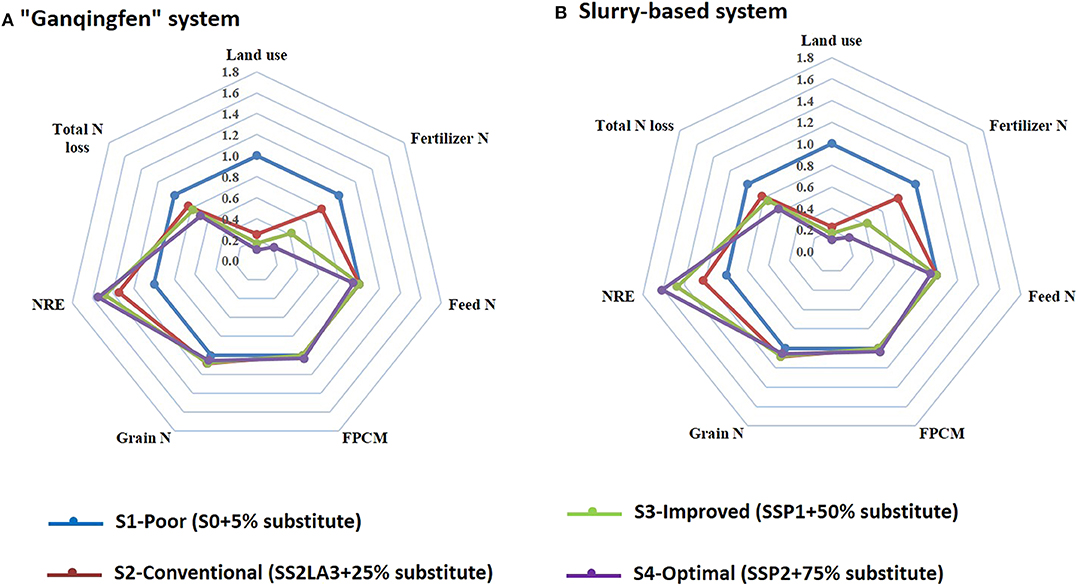
Figure 6. Impacts on resource use, N losses, and use in the manure management chain under different management scenarios. (A) “Ganqingfen” system. (B) Slurry-based system. (Notes: FPCM is fat and protein corrected milk, which fat and protein content is 4 and 3.3% respectively; here we use it as function unit).
Discussion
Nitrogen Flow in the Dairy Manure Management Chain
Dairy production contributes largely to total N losses from the livestock production in China (Bai, 2015), which was mainly affected by the poor management in dairy feeding and manure management. This study shows that the FCR of a typical dairy farm is 1.38 kg feed/kg milk (Table S1), which agrees with the values derived from previous research in China that range from 0.9 kg feed/kg milk (Wei, 2016) to 1.5 kg feed/kg milk (Bai, 2015). However, the FCR of cattle in China was much higher than that in the developed countries, such as European Union-1.0 kg feed/kg milk (Hou et al., 2016b), which indicates a potential of improvement in the feeding strategies during dairy breeding. Nitrogen excretion in the reference systems in this study (124 kg N·head−1·yr−1) was higher than EU-27 (average 111 kg N·head−1·yr−1; Hou et al., 2016b), but lower than national average for lactating cow in China for 2009 (Gao et al., 2013). The reasons for differences observed among studies may be differences in the studied cow categories, feed composition, and also milk yields.
The NRE is 40.5 and 43.2% for “Ganqingfen” and slurry-based reference systems, respectively. However, NRE calculated in this study is 20% higher than that reported by Bai et al. (2016) for 2010, that's because our study is based on a model farm, and we assume that no manure is discharged directly to the environment according to the current policy. For the reference system, about 50% of total N losses are emitted as NH3 (38.2–40.1 kg NH3-N·head−1·yr−1), which is slightly higher than the estimate of 18.36–39.70 kg NH3-N·head−1·yr−1 Gao et al. (2013) for the whole China. This illustrates there is still large room for improvement in manure management in China. Slurry-based systems have better N preserving potential than the “Ganqingfen” system (Figure 2), which is possibly because the NH3 emission factor of slatted floors is lower than that of concrete floors, also less N leaching and runoff during storage of manure from slatted-floor housing.
Ammonia Mitigation Technologies
In this study, 28.4–30.0% of excreted N is transferred to NH3, which is consistent with the value of 30% reported in previous studies in China (Yang et al., 2016) and 25.7% reported in EU-27 (Hou et al., 2017). Ammonia emissions from manure can be affected by the adoption of mitigation measures and also the system structure. NH3 mitigation measures in specific stages of manure management were promoted in some EU countries, but not yet in China. In China, N losses from manure include not only NH3 emissions but also direct discharges, which thus suggests that a large portion of available N is lost into water bodies instead of emissions to air. However, a large difference is observed between different technologies, with the NH3 mitigation potential ranging from 2% to 56%. Compared with combined measures, single technologies have a relatively minor effect on NH3 abatement, ranging from 2% to 18%. Whereas optimization of a single link using a single technology may lead to a trade-off in other links of the chain (Oenema et al., 2009), combined technologies reduce the potential for synergistic effects.
Reducing animal degradable protein in feed would decrease excreta pH and further mitigate NH3 without impacting animal welfare (Zhai, 2009). However, the effects of reducing feed protein in this study differ considerably from that reported in other studies (e.g., Zhai, 2015); this is predominantly because the starting protein value is lower and the optimal scenario only reduces protein by 1%. The mitigation potential of other measures in this study (<10%) is also much lower than some other studies (e.g., Hou et al., 2015). Two reasons are proposed for this difference: (1) the reference systems in this study are based on domestic animal production facilities including open lots; thus, the manure fraction is not as realistic as that in other studies; (2) we chose scenarios that could be simply applied in China, without additional high input and high efficiency measures such as acidification.
NH3 reduction can cause a trade-off effect by increasing N2O emissions (Figures 3C,D). Manure exposed to air leads to NH3 volatilization, whereas measures such as straw cover, solid manure incorporation, and liquid injection mitigate NH3 emissions by reducing the contact area with air and the exposure time. The nitrification of ammonium ions requires sufficient oxygen; therefore, when air contact is not complete, N2O emissions will increase (Wang et al., 2018b). As farm practices are related to the soil characteristics, they may also affect the results (Hou et al., 2015). As shown in Figure 3, the various measures affect N2O by −38 to 160%. Specifically, reducing feed protein (H1) and using plastic covers (LS2) could simultaneously mitigate NH3 and N2O emissions, which can be used to control any negative effects, and farmland measures should be considered in the context of the local farmland environment. Moreover, the service life of the underlying surface of a dairy cattle open lot has a substantial influence on the N2O emission coefficient. The N2O emission factor on floor with longer service life was about 14–550 times the values for the newly built dairy feedlot; that's mainly because N2O emission has significantly positive correlation with soil humidity, and the respiration of soil bacteria in newly built feedlot consumes N2O (Xie, 2016). In addition, N2O emission differs in a day and changes with seasons; specific monitoring time plays a vital role in the results (Lin et al., 2015). These somewhat explain the large difference in N2O emissions from different research fields.
Under the combined optimal measures during all stages (SSP2) of the two typical manure management systems, the total N losses are still high (49.2–55.7 kg N·head−1), accounting for 44–49.7% of total excreted N. However, two factors should be considered here. First, our study mostly focuses on NH3 abatement and does not consider animal performance changes after optimizing the diet; however, a previous study showed that N excreted from dairy cattle could decrease by 3.5% with a 1% reduction in feed protein (Hou et al., 2015). Second, the total excreted N is high because of the choice of feed formula and milk yield, yet we deliberately avoided expensive and highly efficient technologies to keep costs low.
Integrated Management of Crop and Dairy Production Systems
In this study, comprehensive optimization measures can simultaneously optimize resources, yields, and environmental indicators (Figure 6); these results are consistent with a previous study by Wang et al. (2018a). The optimal scenario can reduce NH3 by 44–57% and total N losses by 34–39%, which is consistent with the findings of Hou et al. (2015). Crop yield can be significantly increased by partially substituting chemical fertilizer with manure, relative to chemical fertilizer use only that is common in China' cereal croplands, as well as N utilization efficiency and soil fertility (Xia et al., 2017), and the improved and optimal scenarios in our study both reduce fertilizer use and improve crop yield. Our study indicates that there is large potential for reducing chemical fertilizer use because different proportions of fertilizer and manure application lead to different areas of farmland being able to absorb manure, resulting in significant differences in fertilizer use and total N emissions.
The NRE of the integrated dairy-crop system is increased from 60.4–60.8% (S1) to 70.8–73.6% (S3-improved scenario); the highest NREs are achieved in the improved scenario. The proportion of manure as a fertilizer replacement that achieves the highest crop yield is approximately 50% (Xia et al., 2017), which is employed in the improved scenario (S3). When 75% substitution is employed in the optimal scenario, the manure cannot initially supply enough available N (Zhang et al., 2019). As crops were not considered to be returned to the farms as feed in this study, there is still potential to improve the NRE of agricultural and animal husbandry systems.
Uncertainty
Uncertainty in the model results depends on the model parameters, whose values may affect the results. To determine N excretion, the feces and urine excretion amount from domestic test data is multiplied by its N content; however, this method often results in lower values because the manure has already experienced NH3 volatilization prior to sampling. Nevertheless, this study employs a material flow analysis (MFA), in which the N balance calculation avoids several uncertain factors that could influence the test; however, feed formula and milk production parameters can directly affect the results. This study calculates N flow per dairy cattle using the sum divided by the number of lactating cows; this may lead to slightly overestimate as other studies divided by the number of lactating cow and dry cow. However, this difference may not be significant, since dry cow has a small share in the herd (Table S1). For example, the results of this study are much higher within the range of the dairy cow N excretion values summarized by Liu (2007) (55.4–129 kg N·head−1), which will affect the N total loss, but not the NH3 emission reduction potential and NRE in the manure management chain under different technologies. The selection of atmospheric and water emission parameters can directly affect N losses in different ways; however, these variables are less sensitive to environmental effects and the NRE of integrated crop and dairy production systems because the emission reduction parameters of different technologies are within the scope of previous international studies.
Conclusions
This study investigated N flows in typical dairy farming systems in China, then evaluated the effects of various management measures on N use and losses through a scenario analysis. The results indicated that the current dairy manure management level in China is relatively extensive and N recycling efficiency was low. Housing, storage, and manure application are the main loss stages, and losses from open lots cannot be ignored. NH3 is the largest form of N emission. The adoption of comprehensive abatement technologies can effectively reduce NH3 emissions from the manure management chain and further improve manure N-recycling efficiency. However, some scenarios can produce trade-off effects on N2O emission depending on the specific measures employed. These negative effects can be alleviated by prioritizing specific technologies such as reducing feed crude protein and covering the manure with plastic film. Comprehensive technologies have higher potential to simultaneously optimize the environmental performance, resource use, and products yield of an integrated crop and dairy production system. Future research will focus on the full-scale nutrient recycling of integrated crop and animal systems by incorporating crop recycling for feed and the cost-benefits of different technologies adopted by farmers. The scenarios analysis in this study, as one of the first researches for exploring mitigation measures in China's dairy sector, has implications for providing assistance to policy makers to develop the effective policies toward sustainable dairy farming, and also for helping farmers to identify the proper measures that improve environmental performance without decreasing productivity.
Data Availability Statement
The datasets generated for this study are available on request to the corresponding author.
Author Contributions
QF, XZ, and YH conceived the study and wrote the paper. QF performed the statistical analysis and model simulations. XZ, YM, and SW contributed to data collection and model simulations. All authors contribute to editing the paper.
Funding
This research was supported by the National Key R&D program of China funded by the Ministry of Science and Technology of the People's Republic of China (MOST, grant no. 2016YFE0103100), and National Natural Science Foundation of China (NSFC, grant no. 31772393).
Conflict of Interest
The authors declare that the research was conducted in the absence of any commercial or financial relationships that could be construed as a potential conflict of interest.
Supplementary Material
The Supplementary Material for this article can be found online at: https://www.frontiersin.org/articles/10.3389/fsufs.2020.00044/full#supplementary-material
References
Bai, Z. H. (2015). The resources requirement, nitrogen and phosphorus use and losses in the main livestock production system in China. (Ph.D. thesis), Beijing: China Agriculture University.
Bai, Z. H., Ma, L., Jin, S., Ma, W. Q., Velthof, G. L., Oenema, O., et al. (2016). Nitrogen, phosphorus and potassium flows through the manure management chain in China. Environ. Sci. Technol. 50, 13409–13418. doi: 10.1021/acs.est.6b03348
Bhandral, R., Bittman, S., Kowalenko, G., Buckley, K., Chantigny, M. H., Hunt, D. E., et al. (2009). Enhancing soil infiltration reduces gaseous emissions and improves N uptake from applied dairy slurry. J. Environ. Qual. 38, 1372–1382. doi: 10.2134/jeq2008.0287
Food Agriculture Organization of the United Nations (FAO). (2016). FAOStat: Food and Agriculture Data. Available online at: http://www.fao.org/faostat/en/#data/QL
Gao, Z. L., Ma, W. Q., Zhu, G. D., and Roelcke, M. (2013). Estimating farm-gate ammonia emissions from major animal production systems in China. Atmosp. Environ. 79, 20–28. doi: 10.1016/j.atmosenv.2013.06.025
Hou, Y., Bai, Z. H., Lesschen, J. P., Staritsky, I. G., Sikirica, N., and Ma, L. (2016b). Feed use and nitrogen excretion of livestock in EU-27. Agric. Ecosys. Environ. 218, 232–244. doi: 10.1016/j.agee.2015.11.025
Hou, Y., Velthof, G. L., Lesschen, J. P., Staritsky, I. G., and Oenema, O. (2016a). Nutrient Recovery and emissions of ammonia, nitrous oxide, and methane from animal manure in Europe: effects of manure treatment technologies. Environ Sci Technol. 51, 375–383. doi: 10.1021/acs.est.6b04524
Hou, Y., Velthof, G. L., Lesschen, J. P., Staritsky, I. G., and Oenema, O. (2017). Nutrient recovery and emissions of ammonia, nitrous oxide, and methane from animal manure in Europe: effects of manure treatment technologies. Environ. Sci. Technol. 51, 375–383. doi: 10.1021/acs.est6b04524
Hou, Y., Velthof, G. L., and Oenema, O. (2015). Mitigation of ammonia, nitrous oxide and methane emissions from manure management chains: a meta-analysis and integrated assessment. Glob. Change Biol. 21, 1293–1312. doi: 10.1111/gcb.12767
Kai, P., Pedersen, P., Jensen, J. E., Hansen, M. N., and Sommer, S. G. (2008). A whole-farm assessment of the efficacy of slurry acidification in reducing ammonia emissions. Eur. J. Agron. 28, 148–154. doi: 10.1016/j.eja.2007.06.004
Lee, C., Hristov, A. N., Dell, C. J., Feyereisen, G. W., Kaye, J., and Beegle, D. (2012). Effect of dietary protein concentration on ammonia and greenhouse gas emitting potential of dairy manure. J. Dairy Sci. 95, 1930–1941. doi: 10.3168/jds.2010-4141
Lin, Z., Liao, W. H., Yang, Y. Y., Gao, Z. L., Ma, W. Q., Wang, D. W., et al. (2015). CH4 and N2O emissions from China's beef feedlots with ad libitum and restricted feeding in fall and spring seasons. Envrion. Res. 138, 391–400. doi: 10.1016/j.envres.2015.02.032
Liu, D. (2007). Evaluation of NH3 emission from pig and dairy cow manure in China. (Ph.D. thesis), Hebei, Hebei Agriculture University.
Liu, X. L. (2005). Nitrogen cycling and balance in “Agriculture-Livestock-Nitrition-Environment” system of China. (Ph.D. thesis), Hebei, Hebei Agriculture University.
Luo, J., and Saggar, S. (2008). Nitrous oxide and methane emissions from a dairy farm stand-off pad. Aus. J. Exp. Agric. 48, 179–182. doi: 10.1071/EA07242
Ma, X. Y., Gao, Z. L., Gao, Y. X., Gu, Q. S., Li, J. G., and Ma, W. Q. (2014). Milk production, nitrogen balance and utilization efficiency of lactating cows in dairy operations with different sizes. J. Agric. Univers. Hebei, 3, 88–93. doi: 10.13320/j.cnki.jauh.2014.0070
Ma, L., Ma, W. Q., Velthof, G. L., Wang, F. H., Qin, W., Zhang, F. S., et al. (2010). Modeling nutrient flows in the food chain of China. J. Environ. Qual. 39:1279. doi: 10.2134/jeq2009.0403
Ministry of Agriculture. China animal husbandry yearbook (MOA). (2010). Beijing: China agriculture press.
Moore, K. D., Young, E., Gurell, C., Wojcik, M. D., and Hatfield, J. L. (2014). Ammonia measurements and emissions from a california dairy using point and remote sensors. Transact. Asabe 57, 181–198. doi: 10.13031/trans.57.10079
Oenema, O., Witzke, H. P., Klimont, Z., Lesschen, J. P., and Velthof, G. L. (2009). Integrated assessment of promising measures to decrease nitrogen losses from agriculture in EU-27. Agr Ecosyst. Environ. 133, 280–288. doi: 10.1016/j.agee.2009.04.025
Petersen, S. O., Andersen, A. J., and Eriksen, J. (2012). Effects of cattle slurry acidification on ammonia and methane evolution during storage. J. Environ. Qual. 41:88. doi: 10.2134/jeq2011.0184
Reis, S., Howard, C., and Sutton, M. A. (2015). Costs of Ammonia Abatement and the Climate Co-Benefits. Netherlands: Springer Netherlands press. doi: 10.1007/978-94-017-9722-1
Shen, J., Liu, X., Zhang, Y., Fangmeier, A., Goulding, K., and Zhang, F. (2011). Atmospheric ammonia and particulate ammonium from agricultural sources in the North China Plain. Atmos Environ. 45, 5033–5041. doi: 10.1016/j.atmosenv.2011.02.031
Styles, D., Adams, P., Thelin, G., Vaneeckhaute, C., Withers, P. J. A., and Chadwick, D. (2018). Life cycle assessment of biofertilizer production and use compared with conventional liquid digestate management. Environ. Sci. Technol. 52, 8b−1619b. doi: 10.1021/acs.est.8b01619
Todd, R. W., Cole, N. A., Clark, R. N., Flesch, T. K., Harper, L. A., and Baek, B. H. (2008). Ammonia emissions from a beef cattle feedyard on the southern High Plains. Atmos Environ. 42, 6797–6805. doi: 10.1016/j.atmosenv.2008.05.013
Wang, X., Ledgard, S., Luo, J., Guo, Y., Zhao, Z., Guo, L., et al. (2018a). Environmental impacts and resource use of milk production on the North China Plain, based on life cycle assessment. Sci. Total Environ. 625, 486–495. doi: 10.1016/j.scitotenv.2017.12.259
Wang, Y., Li, X., Yang, J., Tian, Z., Sun, Q., Xue, W., et al. (2018b). Mitigating greenhouse gas and ammonia emissions from beef cattle feedlot production: a system meta-analysis. Environ. Sci. Technol. 52, 11232–11242. doi: 10.1021/acs.est.8b02475
Wei, S. (2016). Nutrient cycling, environment losses and sustainablity assessment of livestock production in peri-urban area of Beijing. (Ph. D. thesis), Beijing, China Agriculture University.
Wei, S., Bai, Z. H., Chadwick, D., Hou, Y., Qin, W., Zhao, Z. Q., et al. (2017). Greenhouse gas and ammonia emissions and mitigation options from livestock production in peri-urban agriculture. J. Clean. Produc. 178, 515–525. doi: 10.1016/j.jclepro.2017.12.257
Xia, L., Lam, S. K., Yan, X., and Chen, D. (2017). How does recycling of livestock manure in agroecosystems affect crop productivity, reactive nitrogen losses, and soil carbon balance? Environ. Sci. Technol. 51:7450. doi: 10.1021/acs.est.6b06470
Xie, Q. (2016). Characteristics and mechanism of gas emissions from feedlot manure. (Ph.D. thesis). Hebei, Hebei Agriculture University.
Xing, F., Jie, C., Yuan, R., Xu, W., Du, Y., Xu, R., et al. (2018). Recoupling industrial dairy feedlots and industrial farmlands mitigates the environmental impacts of milk production in China. Environ. Sci Technol. 52, 7b−4829b. doi: 10.1021/acs.est.7b04829
Yang, Y., Liao, W., Wang, X., Liu, C., Xie, Q., Gao, Z., et al. (2016). Quantification of ammonia emissions from dairy and beef feedlots in the Jing-Jin-Ji district, China. Agr Ecosyst. Environ. 232, 29–37. doi: 10.1016/j.agee.2016.07.016
Zhai, L. B. (2015). Ammonia emission characteristics and mitigation solutions in dairy farming system in specific regions. (Ph.D. thesis). Hebei, Hebei Agriculture University.
Zhai, S. W. (2009). Effect of dietary protein intake on nitrogen output of lactating dairy cows. China Dairy Cattle 8, 1–13. doi: 10.3168/jds.2008-1155
Zhang, X. Y., Fang, Q. C., Zhang, T., Ma, W. Q., Velthof, G. L., Hou, Y., et al. (2019). Benefits and trade-offs of replacing synthetic fertilizers by animal manures in crop production in China: a meta-analysis. Glob Change Biol. 26, 888–900. doi: 10.1111/gcb.14826
Zhang, F. S., Chen, X. P., and Chen, Q. (2009). Guidelines for Fertilization Of Major Crops in China. Beijing: China Agricultural University Press.
Zhang, N. N., Bai, Z. H., Luo, J. F., Ledgard, S., Wu, Z. G., Ma, L. (2017). Science of Total Environment 598, 1095–1105. doi: 10.1016/j.scitotenv.2017.04.165
Keywords: dairy, manure management chain, nitrogen emission, ammonia mitigation, integrated crop-livestock system
Citation: Fang Q, Ma Y, Zhang X, Wei S and Hou Y (2020) Mitigating Nitrogen Emissions From Dairy Farming Systems in China. Front. Sustain. Food Syst. 4:44. doi: 10.3389/fsufs.2020.00044
Received: 08 November 2019; Accepted: 30 March 2020;
Published: 19 May 2020.
Edited by:
Barbara Amon, Leibniz Institute for Agricultural Engineering and Bioeconomy (ATB), GermanyReviewed by:
Harald Menzi, Federal Office for the Environment, SwitzerlandMaria Alejandra Herrero, University of Buenos Aires, Argentina
Copyright © 2020 Fang, Ma, Zhang, Wei and Hou. This is an open-access article distributed under the terms of the Creative Commons Attribution License (CC BY). The use, distribution or reproduction in other forums is permitted, provided the original author(s) and the copyright owner(s) are credited and that the original publication in this journal is cited, in accordance with accepted academic practice. No use, distribution or reproduction is permitted which does not comply with these terms.
*Correspondence: Yong Hou, eW9uZ2hvdUBjYXUuZWR1LmNu; aG91eW9uZzc1MTQzNjRAMTI2LmNvbQ==
†These authors have contributed equally to this work and share first authorship
 Qunchao Fang
 Yifei Ma1†
 Yong Hou