 S. M. Ashekuzzaman1
 Karl Richards1Stephanie Ellis1,2Sean Tyrrel2Emma O'Leary1Bryan Griffiths3
 Karl Ritz2,4
 Owen Fenton1*
- 1Environment Research Centre, Johnstown Castle, Teagasc, The Irish Agriculture and Food Development Authority, Wexford, Ireland
- 2School of Water, Energy and Environment, Cranfield University, Cranfield, United Kingdom
- 3Crop and Soil Systems Research Group, Scotland's Rural College, Edinburgh, United Kingdom
- 4School of Biosciences, The University of Nottingham, Nottingham, United Kingdom
Grassland application of dairy slurry, cattle dung, and biosolids offers an opportunity to recycle valuable nutrients (N, P, and K), which may all introduce pathogens to the soil environment. Herein, a temporal risk assessment of the survival of Escherichia coli (E. coli) up to 40 days in line with the legislated grazing exclusion time points after application was examined across six scenarios: (1) soil and biosolids mixture, (2) biosolids amended soil, (3) dairy slurry application, (4) cattle dung on pasture, (5) comparison of scenario 2, 3, and 4, and (6) maximum legal vs. excess rate of application for scenario 2 and 3. The risk model input parameters were taken or derived from regressions within the literature and an uncertainty analysis (n = 1,000 trials for each scenario) was conducted. Scenario 1 results showed that E. coli survival was higher in the soil/biosolids mixture for higher biosolids portion, resulting in the highest 20 day value of residual E. coli concentration (i.e., C20, log10 CFU g−1 dw) of 1.0 in 100% biosolids or inoculated soil and the lowest C20 of 0.098 in 75/25 soil/biosolids ratio, respectively, in comparison to an average initial value of ~6.4 log10 CFU g−1 dw. The E. coli survival across scenario 2, 3, and 4 showed that the C20 value of biosolids (0.57 log10 CFU g−1 dw) and dairy slurry (0.74 log10 CFU ml−1) was 2.9–3.7 times smaller than that of cattle dung (2.12 log10 CFU g−1 dw). The C20 values of biosolids and dairy slurry associated with legal and excess application rates ranged from 1.14 to 1.71 log10 CFU ha−1, which is a significant reduction from the initial concentration range (12.99 to 14.83 log10 CFU ha−1). The E. coli survival in un-amended soil was linear with a very low decay rate resulting in a higher C20 value than that of biosolids or dairy slurry. The risk assessment and uncertainly analysis showed that the residual concentrations in biosolids/dairy slurry applied soil after 20 days would be 45–57% lower than that of the background soil E. coli concentration. This means the current practice of grazing exclusion times is safe to reduce the risk of E. coli transmission into the soil environment.
Introduction
Globally, provision of a circular economy safeguards against volatile fertilizer prices, global diminishing resources (e.g. synthetic fertilizers, fossil fuel) and an increased demand for food (Heffer and Prud'homme, 2013). In the European Union (EU), the Landfill Directive (EC, 1999) promoted a circular economy by targeting an 85% reduction in the disposal of sewage sludge to landfill by 2014 from 1995 levels. Such an ambitious target was aided by the Sewage Sludge Directive (EEC, 1986), which directed a major proportion of sewage sludge to land (Lucid et al., 2013; Fijalkowski et al., 2017). The standard management practice for dairy slurry and manure on dairy farms is land application without any necessary pathogen treatment. In contrast land application of treated sewage sludge (henceforth called “biosolids”), which typically involves pre-treatment has variable land application uptake across EU member states ranging from 0% (e.g., Belgium—Brussels and Flanders, Switzerland, and Romania) to >50% (e.g., Norway, Ireland, Spain, UK, France) with an average of 39% being reused in agriculture across the EU (Lucid et al., 2013; Healy et al., 2016a; Fijalkowski et al., 2017). By comparison, about 60% of biosolids in the USA, Canada, and Australia are recycled to agriculture (Tozzoli et al., 2016). The EU figures from 2010 suggest an 81.8% increase in sewage sludge production when compared to 5.5 million tons of dry solids (tds) produced in 1992, and this figure is expected to increase up to 13 million tds by 2020 (EC, 2010; Healy et al., 2017). The positives of land application include a source of nitrogen (N), phosphorus (P), potassium (K), other plant nutrients, and an increase in soil organic matter (Sharma et al., 2017). The negatives can be heavy metal bioaccumulation, runoff losses of nutrient, metal, enteric pathogens and emerging contaminants, and bio-transfer of persistent organic pollutants to the food chain (Healy et al., 2016a,b, 2017; Clarke et al., 2017, 2018; Fijalkowski et al., 2017).
In Ireland, 98% of the biosolids (out of 53,543 tds year−1 produced) go to land (Irish Water, 2015; Clarke et al., 2018). The application rate is typically determined by pH, metal and nutrient content of the soil, and the nutrient and metal content of the biosolids as per limits recommended in the “Codes of Good Practice for the Use of Biosolids in Agriculture” (Fehily Timoney Company, 1999). The guideline relates to post-application of biosolids to grassland and restricts the livestock grazing period stating that “cattle should not be turned out onto pasture that has been fertilized with biosolids until 3–6 weeks after the date of application” (Fehily Timoney Company, 1999). There is growing concern on the survival of enteric Escherichia coli (E. coli) in biosolids and associated risk of transferring this fecal indicator organism (FIO) pollutant into the soil environment and subsequently, contamination of crops and nearby water sources, leading to the potential of spread of gastrointestinal disease (Greene et al., 2008; Ellis et al., 2018). The Sewage Sludge Directive 86/287/EC does not specify limits for E. coli counts as a fecal contamination indicator in biosolids, but specifies general land use, harvesting, and grazing limits to provide protection against the risk of infection (Sobrados-Bernardos and Smith, 2012). The revised version of the Sewage Sludge Directive (Working Document 3rd Draft), recommends that the E. coli in the biosolids needs to be less than 1 × 10³ CFU g−1 dry weight (dw) and that the sludge must have limited spores of Clostridium perfringens (< 3 × 10³ g−1 dw) with an absence of Salmonella. spp in 50 g (wet weight, ww) (EEC, 2000; Healy et al., 2017). This revised working document further states that E. coli concentration in biosolids needs to achieve at least a 2 Log10 reduction after conventional treatment. Therefore, it is critical to accurately determine the FIO pollution (herein E. coli) risk associated with land application of biosolids to fully understand the potential for environmental loss and consequently, human/animal transmission.
Survival patterns of biosolids-derived E. coli in the environment are complex, and a lack of a standardized approach to E. coli measurement makes quantifying their impact difficult. For example, Avery et al. (2005) spiked treated and untreated biosolids samples with a known concentration of E. coli O157 to quantify the time taken to achieve a decimal reduction. The pathogen response was variable and ranged from 3 to 22 days, depending on sludge properties. Lang and Smith (2007)investigated indigenous E. coli survival in dewatered, mesophilic anaerobically digested (DMAD) biosolids, and in different soil types post DMAD biosolids application. Again, decimal reduction times proved variable, ranging from 100 days when applied to air-dried sandy loam, to 200 days in air-dried silty clay. When field moist soils were used this time decreased to 20 days, demonstrating the importance of water content in regulating survival behavior. Therefore, in order to quantify E. coli risk in a relevant, site-specific manner, it is necessary to incorporate both soil and biosolids characteristics in risk assessment modeling. This has been done previously by conducting soil, biosolids, and dairy slurry incubation studies where E. coli are often spiked to generate a survival response (Vinten et al., 2004; Lang and Smith, 2007; Moynihan et al., 2013). Pathogen decay rate (or death) is then calculated based on decimal reduction times, or a first-order exponential decay model previously described by Vinten et al. (2004), and has been shown to be highly contingent on soil type and biosolids or slurry combinations. Currently the Safe Sludge Matrix provides a legal framework for grazing animals and harvesting crops following land application of biosolids, and stipulates that a time interval of about 20 days (grazing exclusion period, and harvesting interval for grass and forage) and 10 months (harvesting interval for fruit, salads, vegetables, and horticulture) should be enforced to ensure safe practice, respectively (ADAS, 2001). However, further work is required to determine if these regulations are overly stringent, particularly in light of the comparatively larger pathogen concentrations reported for dairy slurries than biosolids. For example, E. coli concentrations ranged from 3 × 10² to 6 × 10⁴ CFU g−1 in biosolids (Payment et al., 2001) compared to 7.5 × 10⁴ to 2.6 × 10⁸ CFU g−1 in fresh and stored dairy slurry, respectively (Hutchison et al., 2004). Recently, Healy et al. (2017) study pointed out that livestock exclusion times of more than 3 weeks after biosolids application (considering compliant application rates) may be overly strict with respect to the current exclusion criteria recommendation (e.g. 3–6 weeks in Ireland). Therefore, environmental losses of E. coli associated with biosolids application may not be as extensive as previously thought and further comparisons on pathogen risk should form the basis of future research.
The main objective of this study was to assess the risk of E. coli survival as an indication of the risk associated with land spreading biosolids to agricultural soils within the context of legislated grazing exclusion times. Herein, two exclusion time points at 20 and 40 days were considered in line with the exclusion criteria practice in the UK (i.e. Safe Sludge Matrix ~20 days) and Ireland (i.e. Code of Good Practice for the Use of Biosolids in Agriculture ~20–40 days). In particular, the objectives of the present study were to: (1) gather empirical data on E. coli concentration, and pathogen decay rate (k) for dairy slurry, cattle dung, and biosolids, and (2) conduct risk assessment modeling and uncertainty analysis of survival of E. coli at different time periods from application of dairy slurry, cattle dung, and biosolids to grassland up to the cattle exclusion time point (i.e. 20 and 40 days).
Materials and Methods
Empirical Data on E. coli Concentration and Decay Rate
The die-off patterns of E. coli in dairy slurry, cattle dung, and biosolids were analyzed from the published peer-reviewed literature to develop an overview of the E. coli concentration and decay rate (k) as presented in Table 1. In this case, 12 relevant papers were utilized to generate the data under five categories—(1) un-amended soil, (2) E. coli spiked soil, (3) biosolids, (4) dairy slurry, and (5) cattle dung. These studies were deemed relevant based on the availability or possibility of derivation of initial E. coli concentration and k value. The heterogeneous nature of the above five categorized materials and their diverse treatment conditions like moisture level, seasonality, application dose, and condition were also considered to cover the wide range of data set. Data were obtained from tables or log-linear regression equations where available (Himathongkham et al., 1999; Oliver et al., 2006; Lang and Smith, 2007; Martinez et al., 2013; Hodgson et al., 2016; Roberts et al., 2016); otherwise, data were extracted from digitized figures to derive log-linear regression equation by plotting Log10 CFU g−1 dw vs. Time (days) (Avery et al., 2004, 2005; Oliver et al., 2010; Schwarz et al., 2014; Biswas et al., 2018; Ellis et al., 2018). The die-off pattern of pathogens can be described by the first-order kinetics Equation (1), which upon integration gives the linear Equation (2) (Mubiru et al., 2000; Martinez et al., 2013). This natural logarithm based linear Equation (2) was converted to the base 10 logarithm (i.e., Log10) based Equation (3) and compared with a straight line equation (y = mx+c) to get the slope (m) and subsequently, the die-off or decay rate (k) values were obtained using Equation (4) (Table 1). The linear Equation (2) can be transformed to an exponential model (Equation 5) to assess the risk of E. coli content in soil after application of different organic residues like dairy slurry, sewage sludge, and cattle dung (Vinten et al., 2004).
where C is the E. coli concentration per unit of mass or volume and k is the die-off or decay rate.
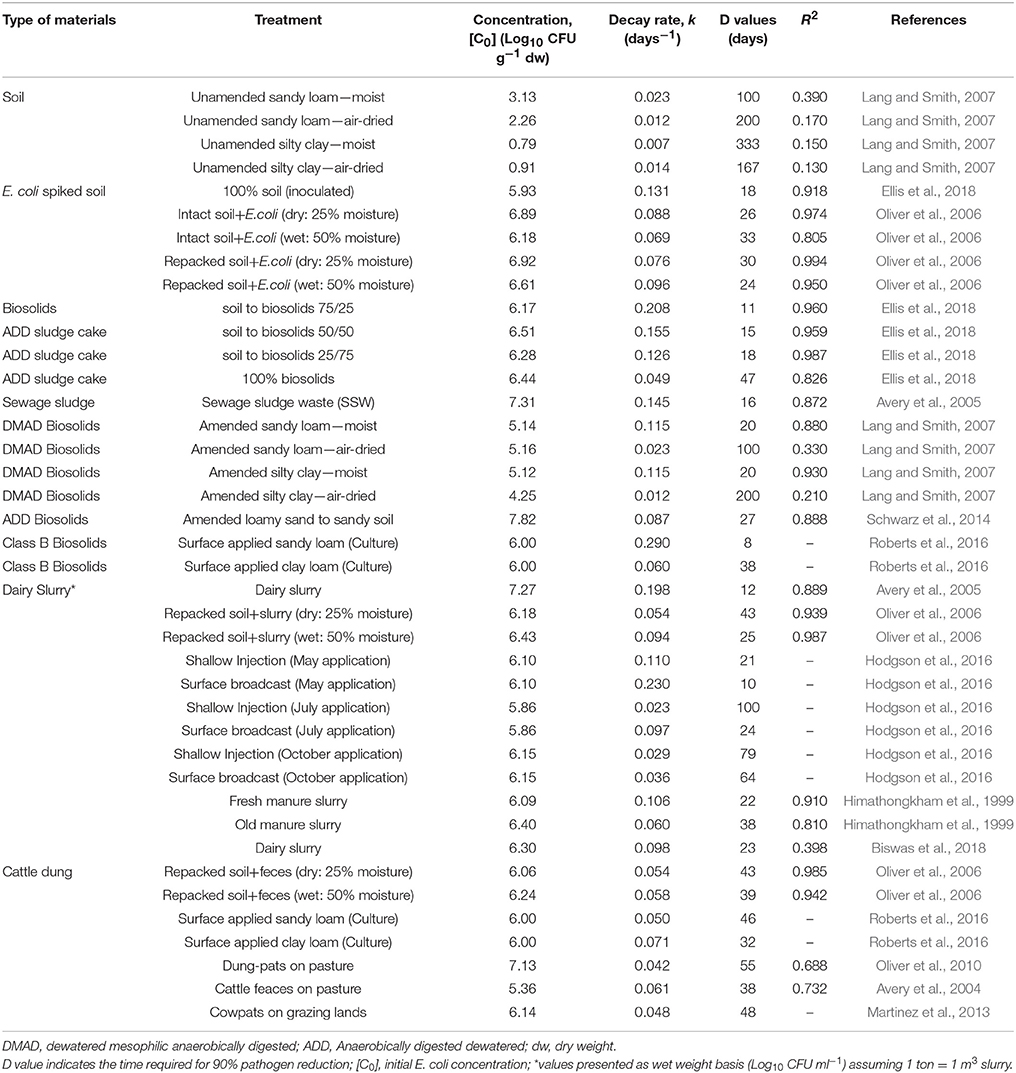
Table 1. Concentration (E. coli, Log10 CFU g−1 dw) and decay rate (k, days−1) for a variety of biosolids, dairy slurry, and cattle dung.
Here, Ct is concentration of E. coli at time t in the soil, Co is the concentration of E. coli at time zero in the soil, t is fixed time period (e.g. grazing period) (days), k is the die-off function of the E. coli (day−1).
Risk Assessment and Uncertainty Analysis
In this study, the exponential Equation (5) was used to quantify the concentrations of E. coli in the soil after any time period to be known following land application of the aforementioned organic materials. Traditionally, the burden of E. coli accumulation in soil from livestock feces or land spreading of dairy slurry is calculated by assuming the exponential decay pattern of E. coli survival over time (Oliver et al., 2009, 2010). A risk assessment of the survival of E. coli up to 40 days after application was examined across six scenarios (Table 2)—(1) soil and biosolids mixture, (2) biosolids amended soil, (3) dairy slurry application, (4) cattle dung on pasture, (5) comparison of scenario 2, 3, and 4, and (6) maximum legal vs. excess rate of application for scenario 2 and 3. The risk model input parameters i.e., initial E. coli concentration (C0) and decay rate (k) were used from the Table 1 as presented in Table 2.
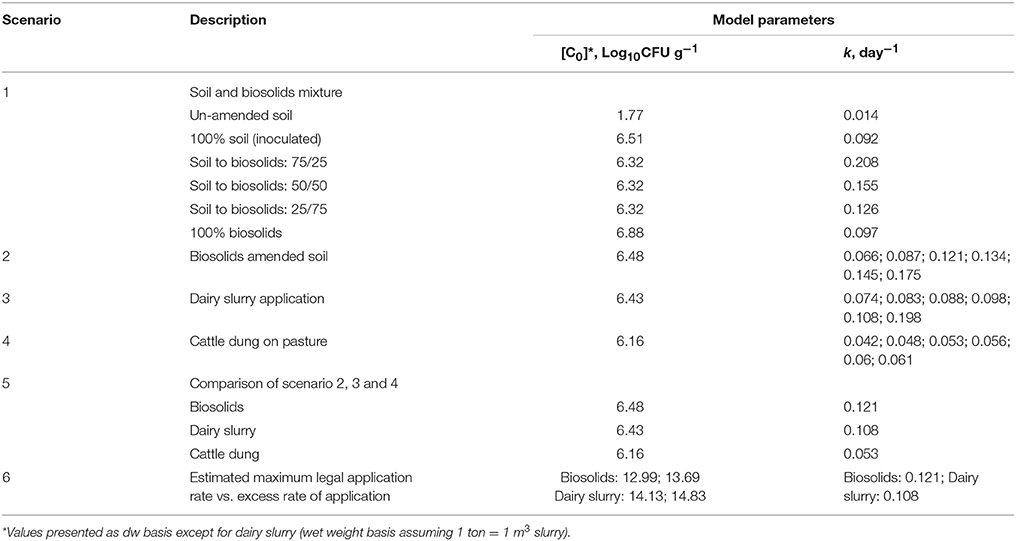
Table 2. Scenario and parameters used for risk assessment modeling and Monte Carlo uncertainty analysis.
In scenario 1, the values of C0 (i.e., concentration of E. coli at day 0) and k were taken as the average for soil to sludge mixture matrix of un-amended soil (Lang and Smith, 2007), 100% soil (E. coli spiked) (Oliver et al., 2006; Ellis et al., 2018), 75% soil to 25% sludge (Ellis et al., 2018), 50% soil to 50% sludge (Ellis et al., 2018), 25% soil to 75% sludge (Ellis et al., 2018), and 100% sludge (Avery et al., 2005; Ellis et al., 2018). In scenario 2, C0 was considered as the average of biosolids associated E. coli from five different studies and the k value was considered individually from the respective study and also, as an average value of those studies (Table 1, 2). Similar to scenario 2, C0 and k values (Table 2) were assigned to scenario 3 and 4 considering five different studies (as mentioned in Table 1) for dairy slurry and cattle dung, respectively. In scenario 5, the average value for C0 and k was assigned as in scenarios 2, 3, with 4 used to provide a comparison among biosolid, dairy slurry and cattle dung treatments. Scenario 6 was considered to assess the risk of E. coli survival under estimated legal and excess application rate of biosolids and dairy slurry in grassland.
The estimation of a legal application rate for biosolids and dairy slurry was based on the required P application rate of 40 kg ha−1 for pasture establishment at a low Morgan's P Index soil (e.g. P Index 2 equivalent to Morgan's P of 3.1–5.0 mg l−1) (Peyton et al., 2016; Teagasc Greenbook, 2016). In general, P is the limiting factor for estimating legal application rate of waste derived organic fertilizers such as biosolids and dairy slurry (Lucid et al., 2013). The legal maximum application rate of biosolids was estimated to be in the range of 3.0 to 5.2 ton ha−1 by Lucid et al. (2013) based on the P Index of the soil, the legal limits of N, P, and metal concentration of the soil, the dry matter content, and the nutrient and metal concentration of the biosolid amendment. The estimated legal application rate of biosolids and dairy slurry is presented in Table 3 and these values are comparable with those of commonly used application rate in previous studies (e.g. Brennan et al., 2012; Lucid et al., 2013).
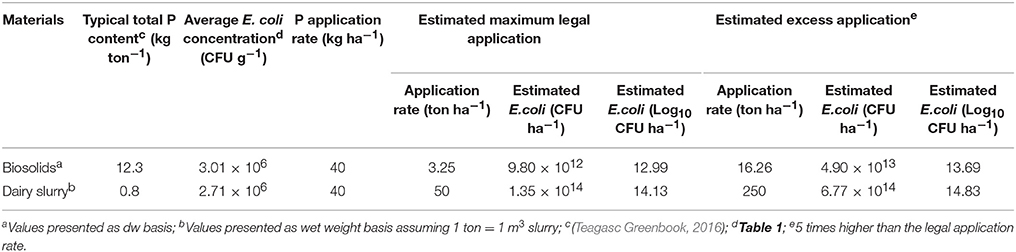
Table 3. Biosolids and dairy slurry landspreading rate for risk assessment model and Monte Carlo uncertainty simulation.
In order to reflect the variability of the model input parameters for a particular soil type, organic material, E. coli concentration (C0) and die-off rate (k) across time, we applied a Monte Carlo simulation (run of 1,000 times per scenario) to compute the probability density distributions for the final concentration in the soil. For the analysis we assumed a uniform distribution of C0, k, and time as in Table 2.
Results and Discussion
E. coli [C0] and k
The empirical data on initial concentration (C0) and k values of E. coli are presented in Table 1. Results show that these parameters vary widely across each type of material ranging from 0.79–3.13 (unamended soil), 5.93–6.92 (inoculated soil), 4.25–7.82 (biosolids), 5.86–7.27 (dairy slurry) and 5.36–7.13 (cattle dung) for C0 (log10 CFU g−1), and 0.007–0.023 (unamended soil), 0.069–0.131 (inoculated soil), 0.012–0.290 (biosolids), 0.023–0.230 (dairy slurry), and 0.042–0.071 (cattle dung) for k (day−1) values, respectively. The treatment nature and condition of each type of material is largely heterogeneous (e.g. soil type, soil to biosolids ratio, sludge type, slurry moisture, slurry age, dung condition) across and within the incorporated reference studies, which can reasonably explain such variability for C0 and k values. However, it was observed that the mean value of both C0 (log10 CFU g−1) and k (day−1) when compared among inoculated soil (C0 = 6.5 ± 0.44, k = 0.092 ± 0.024), biosolids (C0 = 6.0 ± 0.99, k = 0.115 ± 0.079), dairy slurry (C0 = 6.2 ± 0.37, k = 0.095 ± 0.064), and cattle dung (C0 = 6.1 ± 0.52, k = 0.055 ± 0.010) is not statistically different at the 95% significance level as determined by one-way ANOVA [F(3, 32) = 0.665, p = 0.579 for C0 and F(3, 32) = 1.477, p = 0.239 for k). This means the empirical range of the C0 and k values of E. coli for three major organic residue based fertilizers (biosolids, dairy slurry, and cattle dung) as presented in Table 1 are suitable for risk assessment modeling. The wide data set of C0 and k values will provide a variability range for the risk assessment and a prediction of uncertainty through the probability distribution.
E. coli Survival Pattern Across Six Scenarios
In scenario 1, the different combinations of soil and biosolids in the incubation experiment produced different k values and therefore different distributions of E. coli concentrations over time in soil i.e. potential losses in runoff. The E. coli survival pattern in 100% inoculated soil and 100% biosolids is similar, and E.coli concentration reduction of ~5.69 log10 CFU g−1 dw was observed leading to the 20 day concentration (C20) of ~1.0 log10 CFU g−1 dw (see Figure 1A). The survival is the lowest in the soil to biosolids mixture ratio of 75/25 and after 20 days the concentration was 0.098 compared to 0.282 and 0.509 log10 CFU g−1 dw in 50/50 and 25/75 equivalents, respectively. In comparison to the inoculated soil and biosolids or soil/ biosolids mixture, the survival pattern in un-amended soil was linear with a very low decay rate (0.014 day−1) resulting in the highest C20 concentration of 1.34 log10 CFU g−1 dw. After 40 days, the E. coli concentrations (log10 CFU g−1 dw) were: 0.166, 0.0015, 0.0126, 0.0409, 0.1436 for the 100% soil (inoculated), 75/25 soil/biosolids, 50/50 soil/biosolids, 25/75 soil/biosolids ratios, and 100% biosolids, respectively, compared to the C40 value of 1.02 for un-amended soil. These results likely reflect that E. coli populations in un-amended soil are more adaptive than the imported E. coli and can survive as natural soil microflora under favorable soil conditions (e.g. soil texture and structure, pH, moisture, temperature, UV radiation, and nutrient and oxygen availability). For example, E. coli was observed to survive in control soils for more than 9 years, particularly, as becoming naturalized in the low-temperature environments of temperate maritime soils (Brennan et al., 2010a,b).
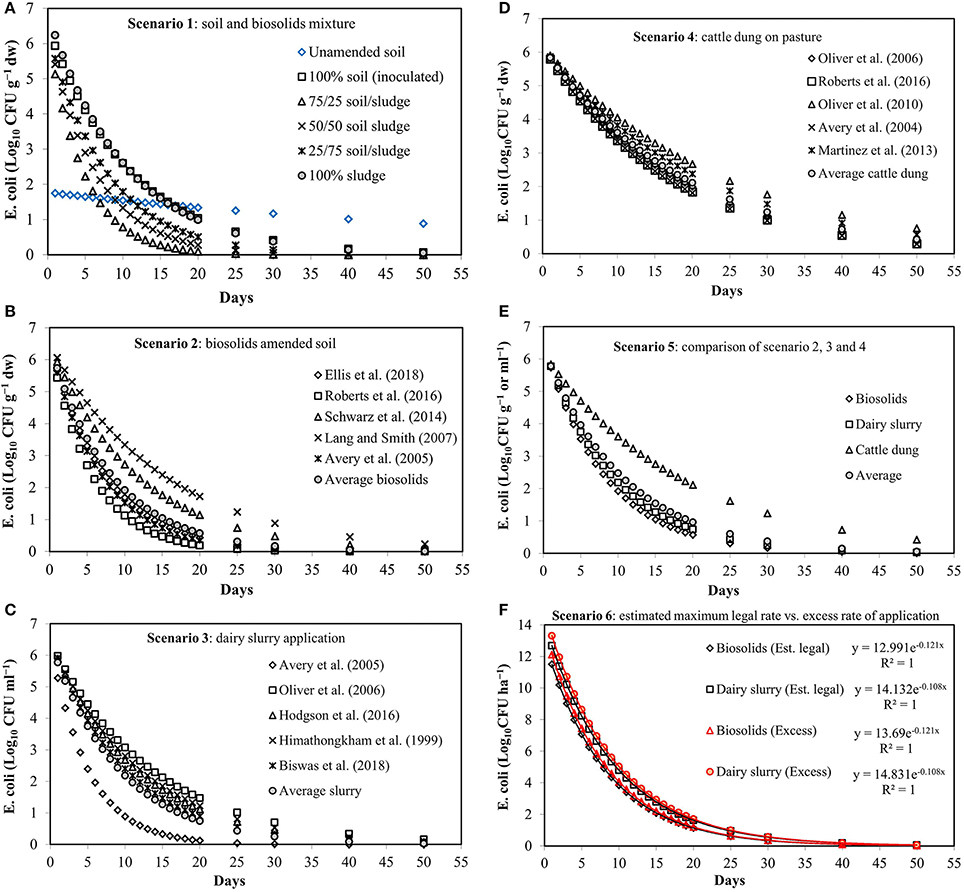
Figure 1. Concentration of E. coli over time based on k values and different scenarios as presented in Table 2. (A) scenario 1, (B) scenario 2, (C) scenario 3, (D) scenario 4, (E) scenario 5, and (F) scenario 6.
In scenario 2, the E. coli survival trend in biosolids amended soil was assessed based on the empirical data (Tables 1, 2) from five reference studies as shown in Figure 1B. The E. coli concentration (log10 CFU g−1 dw) after 20 days was ≤ 0.57 from an initial value of 6.48 for the average biosolids and three study references (Avery et al., 2005; Roberts et al., 2016; Ellis et al., 2018), except for Schwarz et al. (2014) (C20 = 1.14) and Lang and Smith (2007)(C20 = 1.72). The C40 value ranged from 0.006 to 0.46 log10 CFU g−1 dw for all five reference studies.
In scenario 3, E. coli survival pattern in dairy slurry application associated soil was assessed based on the empirical data (Tables 1, 2) from five reference studies as shown in Figure 1C. In this case, the C20, log10 CFU ml−1 concentrations were 0.12, 1.47, 1.12, 1.23, 0.90, and 0.74 compared to the initial value of 6.43 from Himathongkham et al. (1999), Avery et al. (2005), Oliver et al. (2006), Hodgson et al. (2016), and Biswas et al. (2018). The C40 concentration ranged from 0.002 to 0.34 log10 CFU ml−1 for all five reference studies.
In scenario 4, cattle dung associated E. coli survival pattern was assessed based on the input data from five reference studies as shown in Figure 1D. In this scenario, the C20 and C40 concentrations ranged from 1.82 to 2.67 and 0.54 to 1.16 log10 CFU g−1 dw, respectively, compared to the initial value of 6.16 log10 CFU g−1 dw for all five reference studies. A comparison of E. coli survival patterns in biosolids, dairy slurry and cattle dung can be seen from scenario 5 (Figure 1E). In general, the C20 value of biosolids (0.57 log10 CFU g−1 dw) and dairy slurry (0.74 log10 CFU ml−1) was 2.9–3.7 times smaller than that of cattle dung (2.12 log10 CFU g−1 dw). The C40 value was <1.0 log10 CFU per unit mass or volume for any of this material when compared to the same in un-amended soil. However, the results of actual survival patterns in cattle dung studies under natural field conditions differ from studies that use first-order die-off approximations (Van Kessel et al., 2007; Soupir et al., 2008; Muirhead, 2009; Oliver et al., 2010). The reason for such discrepancies could be the potential of E. coli “re-growth” which were not considered when using first-order decay model. Instead a constant decay rate (k) value was used. In reality, E. coli growth and re-growth phases in deposited dung-pats can be highly interactive with environmental conditions such as: temperature, UV radiation, soil type, and rainfall events (Oliver et al., 2010). For example, the E. coli growth magnitude was observed to vary from 0.5 to 1.5 log10 CFU g−1 dw due to different environmental factors (Sinton et al., 2007; Van Kessel et al., 2007; Oliver et al., 2010). This means the estimation of E. coli risk from cattle dung on pasture by single k value based first-order decay model can potentially underestimate the growth potential and provides a conservative indication of fecal indicator organism accumulation over time. The modification of first-order decay equation by incorporating growth factor can improve the model predictability under field conditions. Therefore, the results of the present study represent scenarios without regrowth considerations.
In scenario 6, biosolids and dairy slurry were considered as the most commonly applied organic fertilizer for agricultural landspreading with two estimated application rates (ton ha−1): maximum legal and excess as shown in Table 3. The E. coli survival pattern in this case is presented in Figure 1F. The C20 values of biosolids associated with legal and excess application rates are 1.14 and 1.21 log10 CFU ha−1, respectively, in comparison to 1.63 and 1.71 log10 CFU ha−1, respectively, for dairy slurry associated application. The C40 values in this case were less than ≤ 0.2 log10 CFU ha−1 when compared to C0 (log10 CFU ha−1) values of biosolids (12.99–13.69) and dairy slurry (14.13–14.83), respectively (Figure 1F).
Uncertainty and Probability Distributions of E. coli Concentration
The uncertainty analysis (Figure 2) indicated that soil E. coli concentrations would be at least 3.5 log10 CFU g−1 or ml−1 lower than the C0 range of 6.2 to 6.5 log10 CFU g−1 or ml−1 in about 75.5% of the time (i.e. Ct ≤ 3 log10 CFUg−1 or ml−1) after application of either biosolids or dairy slurry or cattle dung to land (Figure 2B). Considering the variability of C0 and k values due to the material type and study references (scenario 5, Table 2), the predicted E. coli concentration at any time can be estimated from y = 6.1262e−0.079x [similar to exponential Equation (5)] as developed from Monte Carlo simulation of 1,000 trials (Figure 2A). Accordingly, the C20 value can be expected as 1.262 log10 CFU g−1 or which is comparatively lower than that of un-amended soil in this study, pointing toward the remaining E. coli after 20 days of application as being soil indigenous E. coli. The Monte Carlo analysis of biosolids (for scenario 2) provides the predictive exponential equation y = 6.3097e−0.112x with a probability distribution of Ct ≤ 3 log10 CFU g−1 dw for 82% of the time (Figure S1). Similarly, dairy slurry (scenario 3) and cattle dung (scenario 4) based analysis provide regressions of y = 6.459e−0.123x and y = 6.1179e−0.049x, respectively, with a probability distribution of Ct ≤ 3 log10 CFU g−1 of 83 and 61.5% of the time, respectively (Figures S2, S3). The predicted C20 (log10 CFU g−1 or ml−1) values of biosolids and dairy slurry associated E.coli was 0.672 and 0.552, respectively, while the equivalent for cattle dung was 2.296, indicating a higher risk associated with longer survival of E. coli in cattle dung on pasture. For the estimated legal and excess application rate of biosolids or dairy slurry (scenario 6, Figures S4, S5), the predictive exponential equations developed were y = 13.497e−0.113x and y = 14.169e−0.113x, respectively, with a probability distribution of E. coli concentration remaining ≤ 3 log10 CFU ha−1, 63% of the time. While the C20 (log10 CFU ha−1) concentration for scenario 6 ranged from 1.408 to 1.478, the C40 value was almost negligible (0.147–0.154 log10 CFU ha−1).
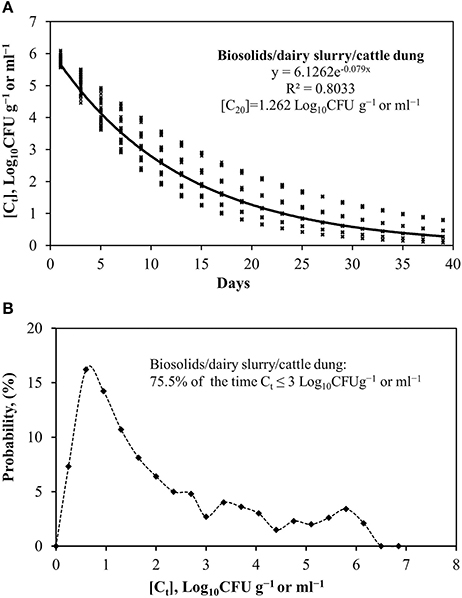
Figure 2. Monte Carlo analysis of (A) soil E. coli concentrations over time and (B) probability distribution of [Ct] after biosolids/dairy slurry/cattle dung application to land.
The outcomes of the uncertainty analyses depended on the distribution of the model variables and the associated parameters of these distributions. In other words, if different distribution parameters had been assumed, different outcomes may have been expected. For the scenarios in this study (Table 2) the distributions of the data are based on a range (maxima and minima) of empirical data collected from the literature (Table 1). In absence of detailed information on the probability density distributions of these variables, we employed the uniform distribution as the most parsimonious distribution.
Conclusions
An empirical database of dairy slurry, cattle dung and biosolids associated E. coli concentration and decay rate (k) was developed to assess the risk of E. coli survival up to a legislated grazing exclusion period. The use of a traditional exponential E. coli decay model and Monte Carlo uncertainty analysis showed that soil E. coli concentrations at 20 days would be at least 3.5 log10 CFU g−1 lower than the initial range of 6.2 to 6.5 log10 CFU g−1 or ml−1 in 75.5% of simulations after application of either biosolids, dairy slurry or cattle dung to land. The predicted C20 value was 1.262 log10 CFU g−1 or ml−1, which is lower than that of un-amended soil in this study, indicating that the majority of E. coli 20 days after application would be mainly indigenous soil E. coli. For the estimated legal and excess application rates of biosolids or dairy slurry, the probability distribution of E. coli concentration remained at ≤ 3 log10 CFU ha−1 63% of the time. The predicted C20 concentration for the estimated legal to excess application rates was 1.408–1.478 log10 CFU ha−1, while the C40 equivalent ranged from 0.147 to 0.154 log10 CFU ha−1. This indicates 40 days as safer than 20 days for a grazing exclusion period. However, considering the decay period of E. coli in un-amended soil, the 20 day exclusion period seems safe to reduce the risk of E. coli transmission into the soil environment and subsequently, negating the risk of contamination of crops and nearby water sources. The finding of this study supports the current practice of grazing exclusion times in the UK and Ireland.
Author Contributions
SMA, OF, and KR contributed to the study conception and design of the study. SMA developed the empirical database, performed risk assessment modeling and uncertainly analysis with the assistance of OF. SMA wrote the manuscript, OF provided feedback and revised where necessary. SE, ST, and BG reviewed the manuscript and provided comments for improvement. Finally, all authors approved the final version of the manuscript.
Conflict of Interest Statement
The authors declare that the research was conducted in the absence of any commercial or financial relationships that could be construed as a potential conflict of interest.
The reviewer CH and handling Editor declared their shared affiliation.
Acknowledgments
This publication has emanated from research funded by the EU FP7 Environment theme–Grant no. 265269 Marketable sludge derivatives from a highly integrated wastewater treatment plant (END-O-SLUDG).
Supplementary Material
The Supplementary Material for this article can be found online at: https://www.frontiersin.org/articles/10.3389/fsufs.2018.00034/full#supplementary-material
References
ADAS (2001). Safe Sludge Matrix - Guidelines for the Application of Sewage Sludge to Agricultural Land. London.
Avery, L. M., Killham, K., and Jones, D. L. (2005). Survival of E. coli O157:H7 in organic wastes destined for land application. J. Appl. Microbiol. 98, 814–822. doi: 10.1111/j.1365-2672.2004.02524.x
Avery, S. M., Moore, A., and Hutchison, M. L. (2004). Fate of Escherichia coli originating from livestock faeces deposited directly onto pasture. Lett. Appl. Microbiol. 38, 355–359. doi: 10.1111/j.1472-765X.2004.01501.x
Biswas, S., Niu, M., Pandey, P., Appuhamy, J. A. D. R. N., Leytem, A. B., Kebreab, E., et al. (2018). Effect of dairy manure storage conditions on the survival of E. coli O157:H7 and Listeria. J. Environ. Qual. 47, 185–189. doi: 10.2134/jeq2017.06.0224
Brennan, F. P., Abram, F., Chinalia, F. A., Richards, K. G., and O'Flaherty, V. (2010a). Characterization of environmentally persistent Escherichia coli isolates leached from an Irish soil. Appl. Environ. Microbiol. 76, 2175–2180. doi: 10.1128/AEM.01944-09
Brennan, F. P., O'Flaherty, V., Kramers, G., Grant, J., and Richards, K. G. (2010b). Long-term persistence and leaching of Escherichia coli in temperate maritime soils. Appl. Environ. Microbiol. 76, 1449–1455. doi: 10.1128/AEM.02335-09
Brennan, R. B., Healy, M. G., Grant, J., Ibrahim, T. G., and Fenton, O. (2012). Incidental phosphorus and nitrogen loss from grassland plots receiving chemically amended dairy cattle slurry. Sci. Tot. Environ. 441, 132–140. doi: 10.1016/j.scitotenv.2012.09.078
Clarke, R., Healy, M. G., Fenton, O., and Cummins, E. (2018). Quantitative risk assessment of antimicrobials in biosolids applied on agricultural land and potential translocation into food. Food Res. Int. 106, 1049–1060. doi: 10.1016/j.foodres.2017.12.072
Clarke, R., Peyton, D., Healy, M. G., Fenton, O., and Cummins, E. (2017). A quantitative microbial risk assessment model for total coliforms and E. coli in surface runoff following application of biosolids to grassland. Environ. Pollut. 224, 739–750. doi: 10.1016/j.envpol.2016.12.025
EC (European Commission) (1999). Council Directive 1999/31/EC of 26 April 1999 on the Landfill of Waste. Available online at: http://eur-lex.europa.eu/legal-content/EN/TXT/PDF/?uri=CELEX:31999L0031&from=EN (Accessed April 27, 2018).
EC (European Commission) (2010). Environmental, Economic and Social Impacts of the Use of Sewage Sludge on Land. Final Report Part I: Overview Report. Available online: http://ec.europa.eu/environment/archives/waste/sludge/pdf/part_i_report.pdf (Accessed April 27, 2018).
EEC (European Economic Community) (1986). Council Directive of 12 June 1986 on the Protection of the Environment, and in Particular of the Soil, When Sewage Sludge is Used in Agriculture (86/278/EEC).
EEC (European Economic Community) (2000). Working Document on Sludge 3rd Draft; DG Environment. European Commission, Brussels. Available online at: www.ewa-online.eu/comments.html?filetl_files/_media/content/documents_pdf/European%20Water%20Policy/Comments/Sewage%20Sludge/EWA_WD_sludge_en.pdf
Ellis, S., Tyrrel, S., O'Leary, E., Richards, K., Griffiths, B., and Ritz, K. (2018). Proportion of sewage sludge to soil influences the survival of salmonella dublin and Escherichia coli. Clean Soil Air Water 46:1800042. doi: 10.1002/clen.201800042
Fehily Timoney Company (1999). Codes of Good Practice for the Use of Biosolids in Agriculture-Guidelines for Farmer. Available online at http://www.housing.gov.ie/sites/default/files/migrated-files/en/Publications/Environment/Water/FileDownLoad%2C17228%2Cen.pdf (Accessed March 14, 2018).
Fijalkowski, K., Rorat, A., Grobelak, A., and Kacprzak, M. J. (2017). The presence of contaminants in sewage sludge – The current situation. J. Environ. Manage. 203, 1126–1136. doi: 10.1016/j.jenvman.2017.05.068
Greene, S. K., Daly, E. R., Talbot, E. A., Demma, L. J., Holzbauer, S., Patel, N. J., et al. (2008). Recurrent multistate outbreak of Salmonella Newport associated with tomatoes from contaminated fields, 2005. Epidemiol. Infect. 136, 157–165. doi: 10.1017/S095026880700859X
Healy, M. G., Fenton, O., Cummins, E., Clarke, R., Peyton, D., Fleming, G., et al. (2017). Health and Water Quality Impacts Arising From Land Spreading of Biosolids. Environmental Protection Agency Research Report No. 200, Ireland.
Healy, M. G., Fenton, O., Forrestal, P. J., Danaher, M., Brennan, R. B., and Morrison, O. (2016a). Metal concentrations in lime stabilised, thermally dried and anaerobically digested sewage sludges. Waste Manage 48, 404–408. doi: 10.1016/j.wasman.2015.11.028
Healy, M. G., Ryan, P. C., Fenton, O., Peyton, D. P., Wall, D., and Morrison, L. (2016b). Bioaccumulation of metals in ryegrass (Lolium perenne L.) following the application of lime stabilised, thermally dried and anaerobically digested sewage sludge. Ecotoxicol. Environ. Safe 130, 303–309. doi: 10.1016/j.ecoenv.2016.04.026
Heffer, P., and Prud'homme, M. (2013). “Fertilizer outlook 2013–2017, ” in Proceedings of the 81st International Fertilizer Industry Association Conference (Chicago, IL: Paper No.: A/13/78), 8. Available online at: http://www.fertilizer.org/
Himathongkham, S., Bahari, S., Riemann, H., and Cliver, D. (1999). Survival of Escherichia coli O157:H7 and Salmonella Typhimurium in cow manure and cow manure slurry. FEMS Microbiol. Lett. 178, 251–257. doi: 10.1111/j.1574-6968.1999.tb08684.x
Hodgson, C. J., Oliver, D. M., Fish, R. D., Bulmer, N. M., Heathwaite, A. L., Winter, M., et al. (2016). Seasonal persistence of faecal indicator organisms in soil following dairy slurry application to land by surface broadcasting and shallow injection. J. Environ. Manage 183, 325–332. doi: 10.1016/j.jenvman.2016.08.047
Hutchison, M. L., Walters, L. D., Avery, S. M., Synge, B. A., and Moore, A. (2004). Levels of zoonotic agents in British livestock manures. Lett. Appl. Microbiol. 39, 207–214. doi: 10.1111/j.1472-765X.2004.01564.x
Irish Water (2015). National Wastewater Sludge Management Plan. Asset strategy. Available online at: https://www.water.ie/projects-plans/our-plans/wastewater-sludge-management/NWSMP-report.pdf (Accessed April, 2018).
Lang, N. L., and Smith, S. R. (2007). Influence of soil type, moisture content and biosolids application on the fate of Escherichia coli in agricultural soil under controlled laboratory conditions. J. Appl. Microbiol. 103, 2122–2131. doi: 10.1111/j.1365-2672.2007.03490.x
Lucid, J. D., Fenton, O., and Healy, M. G. (2013). Estimation of maximum biosolids and meat and bone meal application to a low P index soil and a method to test for nutrient and metal losses. Water Air Soil Pol. 224, 1464–1475. doi: 10.1007/s11270-013-1464-x
Martinez, G., Pachepsky, Y. A., Shelton, D. R., Whelan, G., Zepp, R., Molina, M., et al. (2013). Using the Q10 model to simulate E. coli survival in cowpats on grazing lands. Environ. Int. 54, 1–110. doi: 10.1016/j.envint.2012.12.013
Moynihan, E. L., Richards, K. G., Ritz, K., Tyrrel, S., and Brennan, F. P. (2013). Impact of soil type, biology and temperature on the survival of non-toxigenic Escherichia coli O157. Biol. Environ. 113, 1–16. doi: 10.3318/BIOE.2013.05
Mubiru, D. N., Coyne, M. S., and Grove, J. H. (2000). Mortality of Escherichia coli O157:H7 in two soils with different physical and chemical properties. J. Environ. Qual. 29, 1821–1825. doi: 10.2134/jeq2000.00472425002900060012x
Muirhead, R. W. (2009). Soil and faecal material reservoirs of Escherichia coli in a grazed pasture. NZ. J. Agric. Res. 52, 1–8. doi: 10.1080/00288230909510483
Oliver, D. M., Fish, R. D., Hodgson, C. J., Heathwaite, A. L., Chadwick, D. R., and Winter, M. (2009). A cross-disciplinary toolkit to assess the risk of faecal indicator loss from grassland farm systems to surface waters. Agric. Ecosyst. Environ. 129, 401–412. doi: 10.1016/j.agee.2008.10.019
Oliver, D. M., Haygarth, P. M., Clegg, C. D., and Heathwaite, A. L. (2006). Differential E. coli die-off patterns associated with agricultural matrices. Environ. Sci. Technol. 40, 5710–5716. doi: 10.1021/es0603249
Oliver, D. M., Page, T., Heathwaite, A. L., and Haygarth, P. M. (2010). Re-shaping models of E. coli population dynamics in livestock faeces: Increased bacterial risk to humans? Environ. Int. 36, 1–7. doi: 10.1016/j.envint.2009.08.006
Payment, P., Plante, R., and Cejka, P. (2001). Removal of indicator bacteria, human enteric viruses, Giardia cysts, and Cryptosporidium oocysts at a large wastewater primary treatment facility. Can. J. Microbiol. 47, 188–193. doi: 10.1139/w00-143
Peyton, D. P., Healy, M. G., Fleming, G. T. A., Grant, J., Wall, D., Morrison, L., et al. (2016). Nutrient, metal and microbial loss in surface runoff following treated sludge and dairy cattle slurry application to an Irish grassland soil. Sci. Tot. Environ. 541, 218–229. doi: 10.1016/j.scitotenv.2015.09.053
Roberts, B. N., Bailey, R. H., McLaughlin, M. R., and Brooks, J. P. (2016). Decay rates of zoonotic pathogens and viral surrogates in soils amended with biosolids and manures and comparison of qPCR and culture derived ratesá. Sci. Tot. Environ. 573, 671–679. doi: 10.1016/j.scitotenv.2016.08.088
Schwarz, K. R., Sidhu, J. P., Pritchard, D. L., Li, Y., and Toze, S. (2014). Decay of enteric microorganisms in biosolidsamended soil under wheat (Triticum aestivum) cultivation. Water Res. 59, 185–197. doi: 10.1016/j.watres.2014.03.037
Sharma, B., Sarkar, A., Singh, P., and Singh, R. P. (2017). Agricultural utilization of biosolids: a review on potential effects on soil and plant grown. Waste Manage 64, 117–132. doi: 10.1016/j.wasman.2017.03.002
Sinton, L. W., Braithwaite, R. R., Hall, C. H., and Mackenzie, M. L. (2007). Survival of indicator bacteria in bovine feces on pasture. Appl. Environ. Microbiol. 73, 7917–7925. doi: 10.1128/AEM.01620-07
Sobrados-Bernardos, L., and Smith, J. E. (2012). Controlling pathogens and stabilizing sludge/biosolids: a global perspective of where we are today and where we need to go. Proc. Water Environ. Fed. 2012, 56–70. doi: 10.2175/193864712811693498
Soupir, M. L., Mostaghimi, S., and Lou, J. (2008). Die-off of E. coli and enterococci in dairy cowpats. Trans ASABE 51, 1987–1996. doi: 10.13031/2013.25403
Teagasc Greenbook (2016). “Major and micro nutrient advice for productive agricultural crops,” in Johnstown Castle, eds D. P. Wall and M. Plunkett (Wexford: Teagasc; Environment Research Centre), 81.
Tozzoli, R., Di Bartolo, I., Gigliucci, F., Brambilla, G., Monini, M., Vignolo, E., et al. (2016). Pathogenic Escherichia coli and enteric viruses in biosolids and related top soil improvers in Italy. J. Appl. Microbiol. 122, 239–247. doi: 10.1111/jam.13308
Van Kessel, J. S., Pachepsky, Y. A., Shelton, D. R., and Karns, J. S. (2007). Survival of Escherichia coli in cowpats in pasture and in laboratory conditions. J. Appl. Microbiol. 103, 1122–1127. doi: 10.1111/j.1365-2672.2007.03347.x
Keywords: biosolids, dairy slurry, E. coli, decay, risk assessment, agriculture, soil
Citation: Ashekuzzaman SM, Richards K, Ellis S, Tyrrel S, O'Leary E, Griffiths B, Ritz K and Fenton O (2018) Risk Assessment of E. coli Survival Up to the Grazing Exclusion Period After Dairy Slurry, Cattle Dung, and Biosolids Application to Grassland. Front. Sustain. Food Syst. 2:34. doi: 10.3389/fsufs.2018.00034
Received: 08 May 2018; Accepted: 18 June 2018;
Published: 10 July 2018.
Edited by:
Tom Misselbrook, Rothamsted Research (BBSRC), United KingdomReviewed by:
Chris John Hodgson, Rothamsted Research (BBSRC), United KingdomDavid Oliver, University of Stirling, United Kingdom
Copyright © 2018 Ashekuzzaman, Richards, Ellis, Tyrrel, O'Leary, Griffiths, Ritz and Fenton. This is an open-access article distributed under the terms of the Creative Commons Attribution License (CC BY). The use, distribution or reproduction in other forums is permitted, provided the original author(s) and the copyright owner(s) are credited and that the original publication in this journal is cited, in accordance with accepted academic practice. No use, distribution or reproduction is permitted which does not comply with these terms.
*Correspondence: Owen Fenton, b3dlbi5mZW50b25AdGVhZ2FzYy5pZQ==