- Département de Physique, Université de Montréal, Montréal, QC, Canada
In this paper I examine whether external forcing of the solar dynamo on long timescales can produce detectable signal in the form of long term modulation of the magnetic cycle. This task is motivated in part by some recent proposals (Abreu et al., 2012; Astron. Ap., 548, A88; Stefani et al., 2021; Solar Phys., 296, 88), whereby modulation of the solar activity cycle on centennial and millennial timescales, as recovered from the cosmogenic radioisotope record, is attributed to perturbation of the tachocline driven by planetary orbital motions. Working with a two-dimensional mean-field-like kinematic dynamo model of the Babcock-Leighton variety, I show that such an external forcing signal may be detectable in principle but is likely to be obliterated by other internal sources of fluctuations, in particular stochastic perturbations of the dynamo associated with convective turbulence, unless a very efficient amplification mechanism is at play. I also examine the ability of external tidal forcing to synchronize an otherwise autonomous, internal dynamo operating at a nearby frequency. Synchronization is readily achieved, and turns out to be very robust to the introduction of stochastic noise, but requires very high forcing amplitudes, again highlighting the critical need for a powerful amplification mechanism.
1 Introduction
The Sun’s 11-year magnetic cycle modulates the frequency of all geoeffective solar eruptive phenomena, and is consequently seen as a key element of space weather research. The solar cycle is not quite stationary, as successive cycles shows significant variations in their amplitude and duration (Hathaway, 2015). Much efforts are going into the design of predictive schemes allowing the forecast of the timing and peak amplitude of upcoming activity cycles (Petrovay, 2020). Variations of the solar cycle amplitude on much longer timescales, from centuries to millenia, are also known to take place, and their impact on planetary atmospheres and interplanetary environment define what is now known as space climate. The coincidence of the 1645–1715 Maunder Minimum, a period of strongly suppressed solar activity (Eddy, 1976), with the deepest part of the so-called Little Ice Age well known in climatology, continues to fuel speculations regarding the possible influence of solar activity on Earth’s climate. Investigating such questions on a truly physical basis clearly requires a detailed understanding of the mechanism powering the solar magnetic activity cycle.
The general concensus view of the solar cycle as being driven by a hydromagnetic dynamo operating in the solar interior is now seldom challenged. However the nature of the physical mechanism(s) regulating the cycle’s amplitude and duration, as well as long timescale modulations, is still not understood and the subject of vigorous research and modelling efforts [for a review see Section 7 in Charbonneau (2020)]. Many plausible candidate mechanisms are known, including but not limited to: 1) stochastic forcing associated with turbulent fluid motions pervading the solar convection zone; 2) magnetic backreaction on the turbulent electromotive force (often dubbed α-quenching and η-quenching); 3) magnetic backreaction on large-scale flows taking part in dynamo action, namely differential rotation and meridional circulation, either through the large-scale Lorentz force (sometimes called “Malkus-Proctor” effect) or through magnetically-mediated alterations of the Reynolds stresses powering these flows (Λ-quenching); 4) time delay effects in flux transport dynamos, when the source regions for the poloidal and toroidal magnetic components are spatially segregated. Triggering Grand Minima of activity, such as the Maunder Minimum, may also involve intermittency, namely a deterministicaly- or stochastically-driven switch between two distinct dynamical states of the solar dynamo. The statistics of Grand Minima established on the basis of the cosmogenic radioisotopic record (Usoskin, 2017) points towards a stochastic trigger, although much modelling work is still needed to properly address this issue.
All of these above physical mechanisms are internal to the Sun. The possibility that the amplitude of the solar cycle may be regulated by external physical effects is now seldom considered; yet, and interestingly, history reveals that it largely predates our contemporary dynamo-based Weltanschau.
2 The Planetary Hypothesis
It was a hard one to miss. Already in 1852, Rudolf Wolf (1816–1893) took due note of the close coincidence between the mean duration of the sunspot cycle, which he had just recalculated at 11 year, and the 11.86 year of Jupiter’s orbital period. Indeed, back in the second half of the nineteenth century the notion that the gravitational pull of planets could somehow drive the sunspot cycle formed the basis of what can legitimately be called the first model of the solar cycle (Charbonneau, 2002). Rudolf Wolf himself expended great efforts in trying to fit his sunspot number time series with a combination of harmonic signals at the planetary orbital frequencies. However, the most detailed modeling attempts were made by Balfour Stewart (1828–1887), the driving engine of a team formally led by Warren De La Rue (1815–89), head of the solar photographic monitoring program at Kew Observatory (de La Rue et al., 1872). The favored hypothesis involved the triggering of sunspot appearances by planetary tidal effects, even though the associated tidal height was already suspected to be minuscule. Queried about the possibility by De La Rue, the Utrecht astronomer Martinus Hoek (1834–74) carried out the calculation to arrive at the minute figure of 1 cm for the height of planetary tides at the solar surface. In his reply to De La Rue, he nonetheless remained cautiously open to the possibility of a causal link:
Qu’on se représente des conditions d’équilibre instable, et la moindre force suffit à la rompre et à produire des phénomènes importants […] Les couches extérieures du soleil, rayonnant leur chaleur dans l’espace, doivent par conséquent devenir plus dense. Il suffit que leur densité surpasse celle des couches situées plus près du centre pour avoir l’équilibre instable. Il viendra un moment où elles iront s’engloutir dans l’intérieur du soleil pour être remplacées par des couches moins denses. Il est donc possible que les marées produites par les planètes, quelque insignifiantes qu’elles soient, suffisent à fixer ce moment.1
Picking up on a long ago quip by my colleague Peter Gilman, the notion that minute planetary-related causes could have large solar effects I have dubbed elsewhere “astrological homeopathy.” I will retain here the qualifier “homeopathic” to refer to this idea.
Over the subsequent few decades, none of these early models survived in the face of the accumulating sunspot data. Although an early enthusiastic proponent of the idea, Wolf final’s statement on the topic, published the year of is death in volume IV of his Handbuch der Astronomie, is no longer so enthusiastic:
Zum Schlusse mögen noch die von mir un andern gemachten Versuche erwähnt werde, die Coordinaten der Fleckenkurve durch Formeln darzustellen, oder der Verlauf der Erscheinung durch eine art Rückwirkung der Planeten auf die Sonne zu erklären, obschon dieselben bis jetzt noch nicht zu ganz befriedigenden Resultaten geführt haben.2
Following the discovery of the magnetic nature of sunspot by Georges Ellery Hale and collaborators, the search for the origin of the sunspot cycle turned to the solar interior. This is still the near-concensual position to this day, even though the planetary hypothesis was and is continuing to be rediscovered and reformulated in various guises [for a representative sample see (Jose, 1936; Jose, 1965; Wood, 1972; Fairbridge and Shirley, 1987; Javaraiah and Gokhale, 1995; Zaqarashvili, 1997; Abreu et al., 2012; McCracken et al., 2014; Stefani et al., 2021)]. More often than not the idea tends to be casually dismissed as numerology (at best) or astrology (at worst), when not flatly ignored. Yet some of the more recent variations on the notion of planetary forcing of the solar cycle actually make specific physical proposal regarding the manner in which external forcing could modulate the solar cycle.
The scenario put forth by Abreu et al. (2012) is a good case in point. These authors do not question the dynamo origin of the primary 22-year magnetic cycle, but suggest that long timescale modulations are driven by planetary gravitational torques exerted on an aspherical tachocline. Through a mechanism such as resonant excitation of gravity waves and the associated changes in the local flow shear flows, the subadiabaticity level within the tachocline could be altered, leading to variations in the buoyancy instability threshold of sunspot-forming magnetic flux ropes formed and stored therein (Ferriz-Mas et al., 1994). Their data analysis methodology, and in particular their adopted noise model, has been legitimately (and vigorously) criticized (Cameron and Schüssler, 2013; Poluianov and Usoskin, 2014). However, and as speculative as it may be, their physical proposal is plausible and has the merit of being testable at some level using extant dynamo models. The primary purpose of the present paper is to document the results of such a test.
Even though the foregoing simulations and analyses were motivated by the Abreu et al. proposal, the question adressed in this paper is actually more general: to what extent can low-amplitude, long period forcing of the solar interior—of whatever origin—be amplified to the point of becoming detectable in the magnetic field produced by dynamo action ? As we shall see presently, the answer is far from obvious because, as outlined above, the dynamo mechanism itself can generates its own fluctuations through processes that are entirely internal to the Sun. As the foregoing simulations will demonstrate, disentangling these from signatures of external forcing turns out to be quite challenging, and poses strict constraints of the magnitude of the required external forcing. In particular, forcing amplitudes leaving detectable spectral signatures are well outside the homeopathic regime, even under a generous definition of the latter. This implies that an efficient amplification mechanism must be at play. This key issue is revisited in Section 7, after simulations results have been presented.
3 A Dynamo Model
The solar cycle model used in all experiments described further below is the axisymetric kinematic Babcock-Leighton model described in (Charbonneau et al., 2005), itself a slightly modified, algorithmically distinct, and independent numerical implementation of the dynamo model introduced in (Dikpati and Charbonneau, 1999). This is a spatially-extended two-dimensional dynamo model (radius-latitude), in which the production of the toroidal magnetic component takes place by shearing of the poloidal component by a solar-like differential rotation, and poloidal field production by the surface decay of active regions. The latter process, fundamentally non-axisymmetric, is incorporated into the dynamo equations via a non-local surface source term S in the evolutionary equation for the large-scale poloidal magnetic component. It is meant to capture the contribution to the surface dipole moment associated with the emergence of bipolar magnetic active region exhibiting a systematic mean tilt with respect to the East-West direction, a pattern known as Joy’s Law [see, e.g., McClintock and Norton (2013)]. The net dipole contribution depends critically on this tilt, as well as other characteristics of active regions such as magnetic flux pole separation [see Petrovay et al. (2020) and references therein].
Motivated by thin flux tube simulations of the destabilization and buoyant rise of magnetic flux ropes leading to sunspot emergence (D’Silva and Choudhuri, 1993; Fan et al., 1993; Ferriz-Mas et al., 1994; Caligari et al., 1995), the non-local source term incorporates both a lower and upper operating threshold on the strength of internal toroidal magnetic field component B at the base (radius rc) of the convective envelope:
where the free parameter s0 measures the overall amplitude of the source term, and the functional f (r, θ) has a form such as to concentrate the source term in the subsurface layers. Scaling the axiymmetric dynamo equations in terms of the magnetic diffusion time τ = R2/η, where η is the magnetic diffusivity within the convective envelope, leads to the appearance of two dimensionless numbers measuring the strength of the poloidal and toroidal source:
With differential rotation well-constrained observationally, the value of CΩ is set once a value for η is adopted, leaving CS as the primary free model parameter setting the net dynamo number D = CS × CΩ for the model.
In all simulations that follow we use B1 = 60kG, w1 = 20kG, B2 = 100kG, and w2 = 80kG. The form of the nonlinearity is plotted on Figure 1. The lower operating threshold B1 reflects the fact that toroidal flux ropes with strengths inferior to few tens of kG do not become buoyantly unstable (Ferriz-Mas et al., 1994). The upper threshold models the fact that flux ropes with strength in excess of a hundred kG or so rise too rapidly through the convective envelope to develop the East-West tilt essential for the Babcock-Leighton mechanism. (Fan et al., 1993; D’Silva and Choudhuri, 1993). Babcock-Leighton dynamos thus can only operate in a finite range of internal field strength, and, in particular, are not self-excited, as are the more conventional αΩ dynamo models based on the turbulent α-effect [for more on these various types of models, see Sections 4, 5 in Charbonneau (2020)].
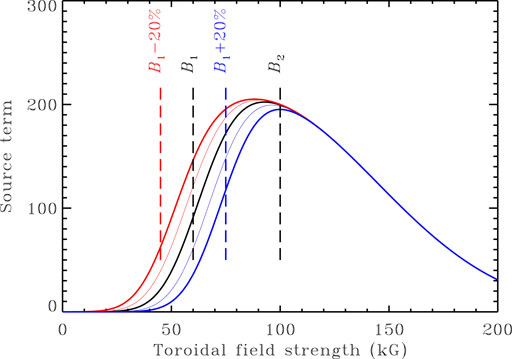
FIGURE 1. The non-local amplitude-limiting nonlinearity in the (Charbonneau et al., 2005) Babcock-Leighton dynamo model. The surface source term is nonlinearly proportional to the toroidal field strength at the core-envelope interface rc, and subjected to both a lower (B1) and upper (B2) operating threshold (see Eq. 1). In the simulations reported upon below, external forcing is mimicked through (multi)periodic modulation of the parameter B1. The thick (thin) blue and red curves illustrate the impact of increasing (blue) or decreasing (red) B1 by ± 20% (± 10%) over its reference value B1 = 60kG.
The model uses a solar-like paramatrization for internal differential rotation, and a quadrupolar meridional flow (one cell per meridional quadrant), poleward at the surface and the equatorial return flow closing at the base of the convection zone [see Figure 1 in Dikpati and Charbonneau (1999)]. Magnetic diffusivity is assumed constant within the convection zone, but decreases sharply upon moving into the underlying radiative core.
This relatively simple dynamo model can be tuned to reproduced many observed solar cycle features, including a decadal activity cycle period for reasonable values of model parameters, the observed phase relationship between internal toroidal field and surface dipole, and equatorward propagation of the deep-seated dynamo-generated magnetic field at low latitudes. Inclusion of stochastic noise leads to a Gnevyshev-Ohl-like pattern, namely a tendency for successive activity cycle amplitudes to alternate between above-average and below-average (Charbonneau et al., 2007). It also reproduces the observed good correlation between surface dipole and amplitude of the subsequent activity cycle (Charbonneau and Barlet, 2011). The model can exhibit intermittency, leading to the trigger of Maunder-minimum-like periods of strongly suppressed activity (Charbonneau et al., 2004). For a 2D kinematic mean-field-like dynamo model at that level of complexity, that is about as good as it gets.
The model parameters are chosen so as to produce a mildly supercritical fixed-amplitude cyclic solution, without multiperiodic or chaotic amplitude modulation: CS = 8, CΩ = 5 × 10⁴, Rm = 840, Δη = 102 [see Charbonneau et al. (2005) for definition of these dimensionless quantities]. This reference solution is mildly supercritical (D/Dcrit = 1.27, where D = CS × CΩ), and has a primary half-cycle period of 1.058 × 10⁻² diffusion times (angular frequency ω = 1187.8rad τ−1), equivalent to 11.01 year for a turbulent diffusivity η = 1.475 × 1011cm2s−1. Dipolar parity is enforced via the equatorial boundary conditions on the magnetic field components.
For every very simulation reported upon below, 500 full magnetic (Hale) cycles (1000 activity cycles) are simulated, spanning 10 diffusion times. A time step Δt/τ = 10–4 is used, so that the primary cycle is temporally well-resolved (214 time steps per magnetic cycle period). A spatial mesh Nr × Nθ = 128 × 96 is used to cover one meridional quadrant, which is sufficient to properly capture the sharp gradients developing immediately below the core-envelope interface, as a result of the rapid variation of the magnetic diffusivity imposed there [see Figure 1 in Dikpati and Charbonneau (1999)].
Unless specified otherwise, magnetic energy integrated over the simulation domain, henceforth detoned Emag, is used as a proxy of magnetic activity. The corresponding time series for the reference dynamo solution is plotted on Figure 2A (black solid line). A second proxy is also defined, namely the surface polar cap radial magnetic field, which we compute by integrating the surface radial component from latitude 80° to the pole and denote by BP. The time series for this proxy is plotted in red on Figure 2A. Note that magnetic energy (black) cycles at twice the frequency of the underlying magnetic cycle, as sampled here by the surface polar cap magnetic field.
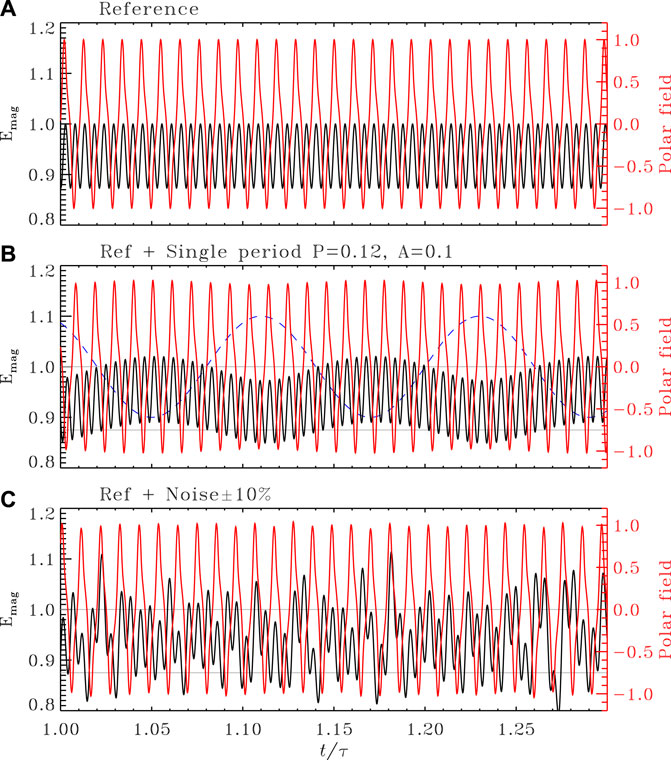
FIGURE 2. Time series segments for magnetic energy integrated over the convection zone (black) and surface polar field (red) for the dynamo model described in Section 3. Time is expressed in units of the magnetic diffusion time τ = R2/η (≃ 1040.7yr for η = 1.475 × 1011cm2s−1). (A) shows the reference solution, (B) is a solution with singly periodic external forcing with parameters P1 = 0.12 and A1 = 0.1 (viz. Figure 4 below). The temporal variation of the forced parameter (B1 in Eq. 1) is plotted as a dashed line. Panel (C) shows a solution with purely stochastic forcing of the dynamo number Cs at the 10% level, with a very short coherence time t/τ ≃ 10–4 (viz. Section 5 and Figure 6 further below). On panels (B,C), the 2 gray horizontal lines indicate the min/max range of the reference solution plotted in panel (A). Note that the plotting range for magnetic energy does not start at zero. On panels (B,C), and for both magnetic energy and polar field, cycle-to-cycle fluctuations at peak time are at the level of a few percent as compared to the mean.
Figure 3 shows power spectra constructed from the full extent of the two time series plotted on Figure 2A, both normalized to their peak value prior to computing the spectra. The lowest frequency peaks correspond to the primary cycle period (for the polar field) and half-cycle period (for magnetic energy). The higher frequencies hamonics simply reflect the fact that the periodic variations are not purely sinusoidal in form. These spectra were computed via a simple Fast Fourier Transform (FFT), which yields an appropriate spectral estimator here given the high (and regular) sampling rate and long duration of the time series.
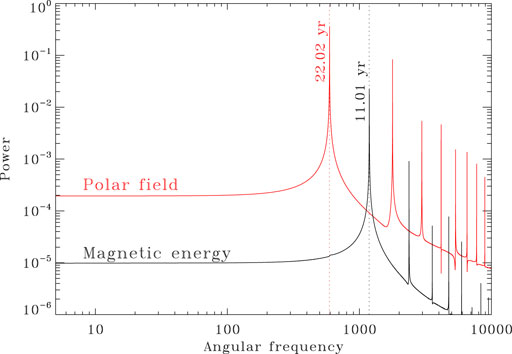
FIGURE 3. Power spectra for the full length time series of magnetic energy Emag (black) and surface poloidal field BP (red) for the reference dynamo solution of Figure 2A. The primary magnetic (Hale) cycle period is reflected in the primary peak for BP while the “activity cycle” at twice the magnetic cycle frequency, corresponds to the primary peak of the Emag spectrum. Higher harmonics also appear in the spectra, reflecting the departure of the modulated response from a pure sinusoidal shape. Note that the spectrum for the polar field (in red) only exhibits odd-numbered higher harmonics because that time series is symmetric about its (zero) mean.
4 External Forcing
The axisymmetric formulation of the dynamo model just described does not allow to direcly input velocity shears induced by non-axisymmetric torques (of whatever origin). Nonetheless, and still inspired by the Abreu et al. proposal, the impact of external forcing on the stability of sunspot-forming toroidal flux ropes is modelled directly through Eq. 1, via the lower threshold parameter B1. A simple multiperiodic harmonic modulation function of the general form is introduced:
where the forcing periods Pi are typically chosen significantly larger than the primary cycle period (10–2 τ), to ensure a good separation of timescales, and the homeopathic hypothesis requires all Ai ≪ 1. The colored curves on Figure 1 show the peak variations of the nonlinearity in the dynamo model associated with a singly-periodic forcing of (non-homeopathic) amplitudes A1 = 0.1 (thin lines) and 0.2 (thick lines). These variations are fairly small, and lead primarily to an horizontal displacement of the lower threshold, in proportion to the adopted value for A1. However, because it acts on a threshold nonlinearity this low-amplitude forcing turns out to have a profound effect on the magnetic cycles produced by the dynamo.
Henceforth the experimental design is straightforward. Starting from the reference, constant amplitude solution of Figure 2A, periodic forcing is turned on and the model integrated until the transient caused by initiation of the forcing has resorbed, which typically requires 0.1 τ. The model is then integrated over a further 10 diffusion times, proxy time series extracted and normalized in terms of the corresponding peak amplitudes measured in the reference solution, and finally power spectra computed again through a simple FFT. These time series are again spectrally well resolved, with at least 40 forcing cycles sampled by the simulations even for the longest forcing periods considered in what follows.
First consider a singly periodic forcing of the reference dynamo solution introduced above (viz. Figures 2A, 3) for a high (non-homeopathic!) forcing amplitude A1 = 0.1 and period p = 0.12 τ. Time series segments of Emag and BP for this solution are plotted on Figure 2B. Even at this high forcing amplitude, the impact on cycle peak amplitudes in these time series is only at the level of a few percents. Although hard to pick up on Figure 2B, the internal workings of the dynamo model lead to a significant time lag between the forcing and overall modulation of our two proxy time series. This is best seen upon constructing a phase space trajectory in the [B1 (tp), Emag (tp)] plane, as shown on Figure 4. Here, times tp corresponding to peaks in the magnetic energy time series are first identified, and the corresponding amplitude plotted versus the value of the forcing function at that same time. Each small black dot on Figure 4 thus corresponds to an “activity maximum”. Successive “loops” along the phase space trajectory do not repeat exactly, because the magnetic cycle and forcing periods are not commensurate. Note again here the small
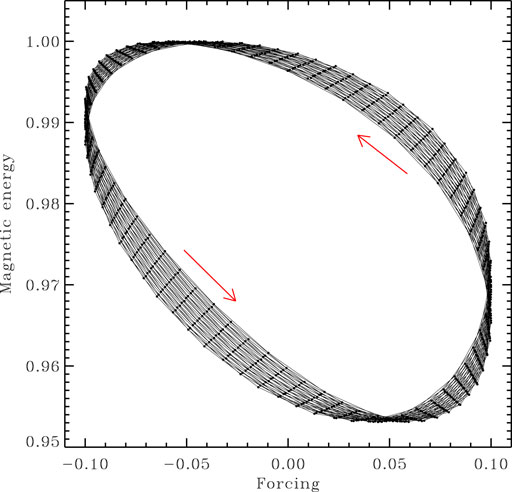
FIGURE 4. Phase space trajectory of a singly-periodically forced dynamo solutions, with forcing parameters P1 = 0.12τ−1, A = 0.1 and φ1 = 0. The trajectory is plotted in the [B1(t), Emag(t)] plane, where both time series are sampled at successives maxima of the magnetic energy time series (solid dots). The trajectory reflects the time delay in the dynamo’s response to periodic forcing (see text).
But how about periodic forcing in the A ≪ 1 regime ? Figure 5 shows four examples of such spectra for solutions subjected to singly periodic forcing of varying forcing periods and much lower amplitudes (P1, going from 0.3 to 0.03 τ, and A1 from 10–3 to 10–2, as indicated). Clear and sharp peaks at the forcing frequencies are visible in all cases.
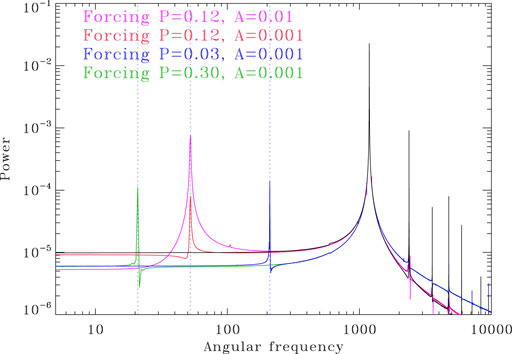
FIGURE 5. Power spectra for a set of dynamo solutions subjected to singly-periodic low amplitude external forcing (color-coded with parameters as labeled). Magnetic energy is used again as a proxy. Here and on all subsequent similar Figures, the black curve shows the spectrum of the reference dynamo solution, taken from Figure 3.
Based on these and other similar simulations for varying forcing amplitudes and periods, one finds (not surprisingly) that the peak power spectral response increases with increasing A. The spectral response also turns out to be largely independent of the forcing period, at least in the range explored here. This remains the case if the polar field strength, rather than magnetic energy, is used as a proxy.
Admittedly it is not immediately clear how small the forcing amplitude A1 has to be to qualify as “homeopathic”; yet, for the long duration and well-sampled time series considered here, even a forcing amplitude of 0.1% yields a clean spectral signature. This is a direct consequence of forcing acting on a sharp threshold in the poloidal source term for the adopted dynamo model. Notwithstanding the logarithmic vertical axis used in plotting the various spectra on Figure 5, one might be tempted to conclude that such sharp spectral features, only a few orders of magnitude below peak power for the primary cycle even at A = 10–3, could perhaps be detectable in long records of solar activity, as provided by cosmogenic radioisotopes for example.
One must however recall that here the reference solutions exhibits a completely steady cycle (viz. Figure 2A), devoid of any longer timescale modulation—of whatever origin—which could perhaps mask the spectral signature associated with external forcing. This possibility is now investigated by adding to the reference solution the most basic source of fluctuation, namely stochastic variations of the dynamo number. This choice is far from arbitrary, as strong stochastic fluctuations are expected in the dynamo source terms, due to the turbulent nature of the convective envelope, where the dynamo operates.
5 Enters Noise
In the context of Babcock-Leighton dynamo model, random fluctuations of the poloidal source term are associated with stochasticity in the physical characteristics of bipolar magnetically active regions emerging at the solar photosphere. One particularly important characteristic is the tilt of the line segment joining the two magnetic poles of the emerging bipolar structure with respect to the E-W direction. The tilt is caused by the action of the Coriolis force on the flow developing along the axis of the buoyantly rising magnetic flux rope, but shows a considerable scatter about the mean due to the perturbing action of convective turbulence on the flux ropes during their rise through the solar convection zone. Observations and modelling indicate that these stochastic effects have an important impact on the dipole moment produced in the course of the cycle [see, e.g., Cameron et al. (2013), Nagy et al. (2017), and references therein). Here these will be modeled simply by introducing a zero-mean additive random contribution to the dynamo number CS controlling the overall magnitude of the poloidal source term:
where r ∈ [0, 1] is a uniform random deviate, reset every two time steps, equivalent here to a coherence time of 2 month, which is 100 times smaller than the primary magnetic cycle period. The amplitude parameter ar sets the magnitude of the random deviation about the mean.
Figure 2C shows the proxy time series obtained with a stochastic forcing amplitude ar = 0.1, with the corresponding power spectrum plotted in red on Figure 6. Power spectra for ar = 0.05 and ar = 0.25 are also shown, in green and blue respectively. The spectral peak associated with the primary dynamo frequency broadens with increasing noise level, but the frequency at spectrum peak itself remains rock steady. However, and even though the stochastic forcing frequency exceeds the primary magnetic cycle frequency by nearly two orders of magnitude, the internal workings of the dynamo nonetheless lead to significant power appearing at frequencies much lower than that of the primary cycle. This low-frequency response has at least two distinct origins within the dynamo model: 1) In general, any magnetic field perturbation tends to relax on a time scale of the order of the linear growth rate for the dynamo number at which the model operates. here this time scale exceeds the magnetic cycle period, because the dynamo is only mildly supercritical; 2) for the dynamo model used here, an additional long timescale response is associated with the long diffusion time characterizing the lower diffusivity, tachocline-like shear layer at the base of the convection zone, a feature common in other types of dynamo models including such a layer. Note how this “broadband” spectral structure appearing at low frequencies, associated exclusively with the internal response of the dynamo model to incoherent noise, spreads well into the frequency range associated with the external forcing considered earlier (cf. Figure 5). Not surprisingly, this “noise level” increases with the amplitude of the stochastic forcing.
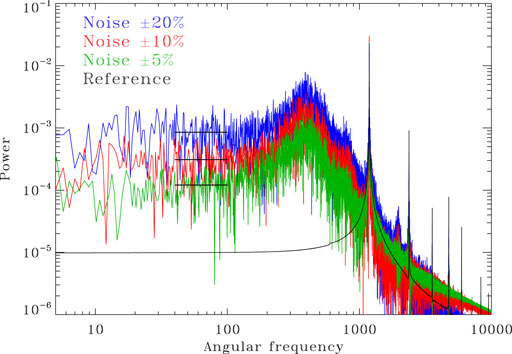
FIGURE 6. Magnetic energy power spectra for a dynamo solution subjected to low amplitude stochastic forcing of amplitude ar = 0.05 (green), ar = 0.1 (red) and ar = 0.25 (blue), with very short coherence time 2 × 10⁻⁴ τ. The equivalent forcing (angular) frequency, ωr = π × 104rad τ−1, is off the horizontal scale to the right. For future reference, the black horizontal line segment indicate the mean “noise” level in the spectra, for the angular frequency range [40, 100]rad τ−1. Note the significant broadband power appearing at frequencies much lower than those of the magnetic cycle, and reaching into the frequency range characterizing the external periodic forcing used for Figure 5.
The next obvious step is to combine short coherence time stochastic forcing as on Figure 6, with long-period periodic forcing, as on Figure 5. The result of such an experiment is shown on Figure 7 for a stochastic forcing amplitude ar = 0.1 and now a triply periodic external forcing given defined as:
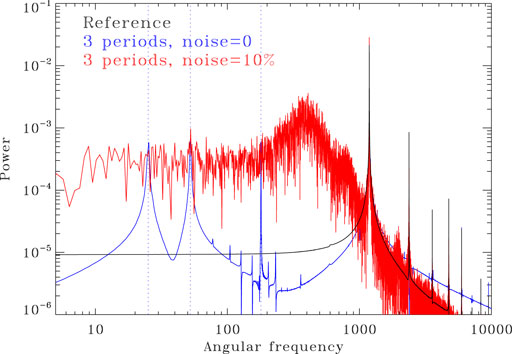
FIGURE 7. Magnetic energy power spectrum for a dynamo solution including the triply periodic forcing given by Eq. 5 and a stochastic noise level of 10% (red). The power spectrum for an equivalent noise-free simulation is plotted in blue, and the three forcing frequencies indicated by dotted lines.
The forcing parameters and noise amplitude in Eq. 5 were deliberately chosen to yield a borderline case, where the spectral signatures of the external multiperiodic forcing are barely detectable. In practice it would be quite challenging to unambiguously disentangle these signatures from other peaks and spectral structures associated with the model’s low-frequency response to stochastic forcing; and ramping up the noise to 25% amplitude would obliterate them altogether.
Because the low frequency response is internal to the dynamo itself, it is similar for incoherent stochastic forcing and coherent external periodic forcing. As long as the forcing frequency is well separated from the magnetic cycle frequency, it is then straightforward to establish the bounds of detectability by simply comparing the peak power associated with external forcing to the mean noise levels in the same frequency range. The results of such an exercise is shown on Figure 8. With a 10% noise level, a 2σ detection requires at least 2% forcing amplitude, while a more stringent 5σ ups the requirement to 5%. These figures go up by a factor of
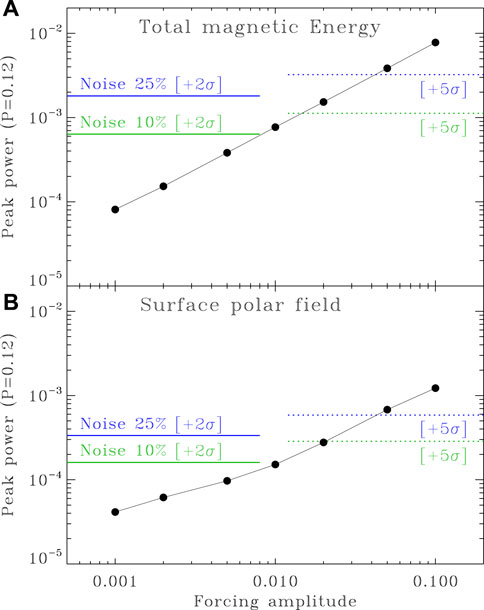
FIGURE 8. The solid dots show variations of peak spectral power at ω = 2π/0.12τ with forcing amplitude, for noise-free dynamo solutions including a single forcing period p = 0.12 τ. The two sets of colored horizontal lines indicate the mean power level plus two (solid) and five (dotted) sigma, in solutions without periodic forcing but with stochastic noise at the 10 and 25% levels, as indicated. These levels are computed over the angular frequency interval ω ∈ [4, 100]rad τ−1, as indicated by the black line segments on Figure 6. The top panel (A) is constructed from spectra of the total magnetic energy time series, while the bottom panel (B) uses the unsigned surface polar field strength time series.
This leads naturally to the question: what is a physically reasonable level of stochastic noise in a dynamo model ? Insofar as the dynamo and noise models used here are concerned, this can be estimated by adjusting ar to reproduce the observed cycle-to-cycle variation in sunspot number or dipole moment. It was noted previously that ar = 0.1 leads to cycle-to-cycle variations only at the 5% level (viz. Figure 2C herein). The simulations discussed in (Charbonneau and Barlet, 2011), using the same dynamo and noise models as here, indicate that solar-like fluctuations require ar ≃ 0.5 (see their Figures 2C, 3E). Extrapolation of Figure 8 then indicates that detectable spectral signatures of long-period external forcing would require A ∼ 0.1 or more, not exactly what one might call homeopathic; but this remains of course a model-dependent and purely empirical result.
At a more physical level, what represents reasonable internal stochastic forcing depends on the dynamo model considered; for classical αΩ kinematic mean-field models, stochasticity likely enters most strongly at the level of the α-effect. Analytical estimates and measurements in numerical simulations suggest fluctuations at a level comparable to the mean (Hoyng, 1993; Ossendrijver et al., 2001; Racine et al., 2011; Simard et al., 2016; Warnecke et al., 2018), i.e., ar = 1 (100% fluctuation) in the notation of Section 5. In models based on the Babcock-Leighton mechanism, such as used in this paper, stochasticity enters via convectively-driven fluctuations of the meridional flow (Miesch et al., 2000; Charbonneau and Dikpati, 2000; Choudhuri and Karak, 2012), and more importantly via the broad statistical distributions of tilt angles characterizing bipolar active regions (McClintock and Norton, 2013; Cameron et al., 2013; Nagy et al., 2017). Indeed surface flux transport simulations indicate that this scatter in tilt dominates the observed variability of the Sun’s surface dipole moment [see, e.g., Muñoz-Jaramillo et al. (2013), Jiang et al. (2014), Petrovay et al. (2020)]. These results are hard to transpose onto the simple noise model used here, but Figure 5 of (Petrovay et al., 2020), taken at face value, would suggest fluctuations approaching 50% of the mean value of the dipole source term.
Moreover, dynamo models of any variety incorporating magnetic backrection on large-scale flows, not considered in all simulations reported upon above, can produce long timescale modulations of the primary cycle with amplitude comparable to that of the primary cycle [e.g., Küker et al. (1999), Moss and Brooke (2000), Bushby (2006), Simard and Charbonneau (2020)]; the same holds of parity modulation (e.g., Sokoloff and Nesme-Ribes (1994), Beer et al. (1998)]. Such nonlinear modulations would further raise and deform the spectral landscape at low frequencies.
All these considerations suggest that if external forcing of the solar dynamo—of any origin—is responsible for the centennial and millennial modulations of the magnetic activity cycle, the required forcing amplitudes should be well beyond the homeopathic regime in order to produce a detectable signature in the presence of other sources of modulation, whether deterministic or stochastic.
6 A Detour: Dynamo Synchronization by External Forcing
An interesting variation on the theme of planetary forcing of the solar dynamo was recently put forth by Stefani et al. (2018); Stefani et al. (2019), Stefani et al. (2021). These authors suggest and provide modelling results showing that external forcing at a frequency close to that of the internally-driven dynamo could lead to a synchronization of this internal dynamo at the external forcing frequency (Stefani et al., 2018). These authors also show that once synchronization is achieved, external forcing act as a clock effectively setting the magnetic cycle period, and ensuring its phase coherence, a long standing challenge to dynamo models of the solar cycle (Dicke, 1978; Hoyng, 1996; Charbonneau and Dikpati, 2000). Stefani et al. (2019) present a series of simulations demonstrating this effect in the context of a 1D kinematic αΩ mean-field dynamo model, but also indicate that, in contrast, robust synchronization of a simple dynamical system formulation of the Babcock-Leighton dynamo [specifically, the model described in Wilmot‐Smith et al. (2006)] could not be achieved.
In flux-transport dynamo models of the Babcock-Leighton variety operating in the advection-dominated regime, the magnetic cycle period is determined primarily by the turnover time of the meridional flow, with weaker dependence on source term amplitude (s0) or envelope magnetic diffusivity (η0). Working with a mean-field-like Babcock-Leighton dynamo model without a lower threshold on poloidal source term but otherwise identical to that introduced in Section 3, Dikpati and Charbonneau (1999) find a scaling of the cycle period with model parameters of the form:
where u0 is the parameter setting the overall speed of the meridional flow. Using the same dynamo model, Charbonneau and Dikpati (2000) go on to show that in the presence of stochastic forcing, this meridional flow acts as a clock maintaining the cycle’s phase coherence. This would suggest that in a kinematic dynamo model with fixed meridional flow, synchronization may be hard to achieve by modulating the amplitude of the dynamo source terms, and may perhaps explain the negative result in Stefani et al. (2018). The dynamo model used here may shed some light on this issue.
Figure 9 shows a series of spectra for dynamo simulations where the forcing period is now 10.62year (vertical dashed line), quite close to the half-period of the magnetic cycle for the reference solution (11.01yr, vertical dotted line). The spectra corresponds to a series of dynamo simulations with increasing forcing amplitudes. The spectra are plotted over a very small angular frequency interval around the internal dynamo frequency for the reference solution, ω = 1187.8rad τ−1. Volume-integrated magnetic energy is again used here as a proxy for cyclic activity.
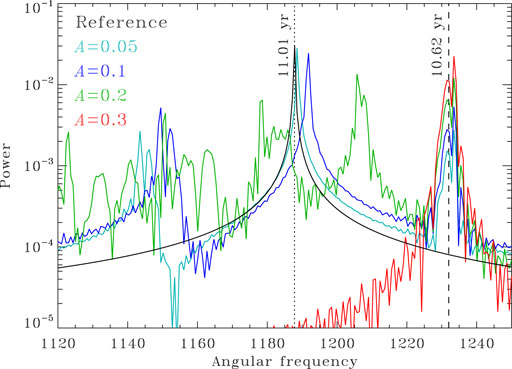
FIGURE 9. Magnetic energy power spectra for dynamo solutions externally forced close to the activity cycle frequency (10.62 versus 11.01 year for the reference dynamo solution). As the amplitude of the forcing increases, power gradually shifts from the primary “internal” period to the forcing period, until the dynamo “synchronizes” on the external forcing. Here this occurs around A = 0.22, with further increase of A leaving the spectrum largely unaffected. Unlike in preceding Figures showing power spectra, here the spectra are displayed over a very narrow frequency interval.
As the forcing amplitude A is increased, the power peak associated with the magnetic (half-) cycle gradually shifts (black → cyan → blue → green) towards the forcing frequency, while a secondary peak appears and grows at that frequency. Here at A = 0.2 (green) the primary peak has shifted almost halfway between the dynamo and forcing frequencies, and the secondary peak is of comparable amplitude. Further (relatively) small increase of A rapidly concentrates all spectral power to the forcing frequency, thus achieving complete synchronization (red). Here this happens between A = 0.2 and 0.22. Further increase of the forcing amplitude leave this part of the spectrum largely unaffected.
Interestingly, and contrary to the low frequency external forcing investigated in the preceding section, here synchronization, once it sets in, is very robust with respect to the introduction of stochastic noise; for the restricted frequency range and linear scale of Figure 9, the A = 0.3 spectrum plotted on Figure 9 is hardly affected by the inclusion of noise at the 25% level (viz. Figure 6). This remains the case if, rather than on the dynamo number, noise is introduced directly on the threshold parameter B1 in Eq. 1, in addition to the external forcing.
Although largely insensitive to noise, synchronization does turn out to be quite sensitive to the degree of separation between the (internal) dynamo frequency and (external) forcing frequency. This is shown on Figure 10, summarizing results for three sets of simulations using increasing forcing amplitudes, and periods P1/τ = 0.004 5 (red), 0.0051 (green) and 0.006 (blue). While a larger frequency separation requires a larger forcing amplitude to achieve synchronization, the latter sets in very abruptly when this critical value of A is reached. One could legitimately speaks of a “synchronization threshold” here.
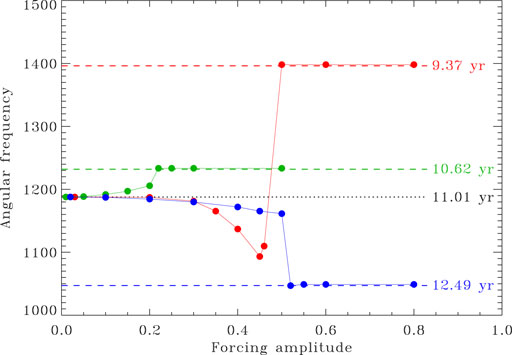
FIGURE 10. Angular frequency associated with peak power in the magnetic energy power spectrum, for sequences of solutions subjected to increasing singly-periodic forcing, for three different forcing periods, as color coded. The horizontal dotted line indicates the angular frequency of the reference solution (magnetic half-cycle period of 11.01 year). Synchronization sets in swiftly past a critical forcing amplitude that increases with growing frequency difference between the cycle and forcing frequencies [see text; and compare to Figure 10 in Stefani et al. (2019)].
It is interesting to compare these results with those presented in Stefani et al. (2019). These authors start with a conventional 1D (latitude only) α-quenched kinematic αΩ mean-field model, and introduce an additive periodic contribution to the otherwise steady mean-field α-effect. As can be deduced from their Figure 10, they also find a behavior qualitatively similar to that described in this section: synchronization sets in abruptly as their forcing amplitude is increased, and larger frequency separation between dynamo and forcing requires larger forcing amplitude to achieve synchronization. Finally, and as with the dynamo model used here, the forcing amplitudes required to achieve synchronisation in the Stefani et al. (2019) model are clearly not in the homeopathic regime.
This good qualitative and semi-quantitative agreement between the present synchronization simulations and those presented in Stefani et al. (2019), using quite distinct dynamo and noise models, suggests that the above characteristics are not highly model-dependent, but represent robust features of external dynamo synchronization.
7 Discussion: How Small is “Homeopathic”?
At this point one can no longer postpone facing the proverbial elephant in the room: what, then, can be considered a physically reasonable amplitude for external forcing ?
It is straightforward to calculate the absolute gravitational and tidal accelerations imparted by Solar System planets on a fluid element in the solar interior, say at the level of the tachocline (r/R⊙≃ 0.7). The two most tidally effective planets, Jupiter and Venus, impart to our fluid element tidal accelerations of the order of a few 10−8cm s−2. Calculating the inertial acceleration associated with the Sun’s motion about the center of mass of the Solar System (barycentric motion) is a bit trickier, and comes out some two orders of magnitude larger, ≃ 5 × 10⁻⁶cm s−2 (Callebaut et al., 2012). These are minuscule accelerations compared to solar gravity at tachocline depth, ≃ 5 × 104cm s−2. However, even on the longest timescales considered here the Sun is in hydrostatic equilibrium, so that the local gravity is already exactly equilibrated by the pressure gradient, and as such its magnitude may be argued to be irrelevant to the issue. Following de Jager and Versteegh (2005), Callebaut et al. (2012), one can instead compared planetary-mediated fluid accelerations to convective acceleration terms in the fluid equations, associated for example with angular momentum transport by convective overshoot into the tachocline. These can be estimated at ≃ 6 × 10⁻⁴cm s−2 (de Jager and Versteegh, 2005), over 4 orders larger than tidal accelerations. At any rate, this (finally) establishes a baseline for what is implied by “homeopathic”.
Based on the results presented in the preceding sections, it is clear that a very strong amplification mechanism is required for planetary gravitational/tidal influences to impact magnetic activity. Some candidates, viable in principle but yet to be physically quantified, have already been put forth. Abreu et al. (2012) suggest that small, changes in the subadiabatic structure of the tachocline, induced by planetary-mediated alterations of shear flows therein, may induce large changes in the rate of active region eruptions. This would occur because of the sensitive dependence of the growth rate of the buoyant instability of magnetic flux ropes on the level of subadiabacity in the tachocline [compare, e.g., Figures 1, 2 in Ferriz-Mas et al. (1994)]. Again even if this provides a suitable amplification mechanism, one would have to consider the impact of convective overshoot as a form of incoherent stochastic noise whose effect on magnetic flux emergence would also become amplified through the same mechanism. There is no free lunch here: any perturbation, of whatever origin, gets amplified. This is true more generally of any forcing scenario that relies on the sensitivity of a nonlinear system operating near a bifurcation point.
Another class of potential amplification mechanisms relies on resonant excitation. This is the gist of the Stefani et al. (2019) proposal, whereby small tidal forcing (m = 2 azimuthal order) can excite a m = 1 helicity oscillations driven by the Tayler instability, which then powers its own dynamo, which then interacts with the primary turbulent dynamo so as to achieve phase-locked synchronization. A less intricate dynamo scenario has been proposed by Albert et al. (2021), with resonance occuring between two distinct operating modes of the same dynamo, as the solution moves back and forth from the attraction basin of one to the other.
8 Concluding Remarks
In this paper paper I have examined to what degree an externally-imposed harmonic forcing operating on timescales much longer than the solar magnetic cycle can leave a detectable signal in time series of magnetic activity proxies, despite the internal “reprocessing” associated with the operation of the dynamo.
The simulation experiments reported upon in this paper were purposefully designed to be as simple as possible, and to best display the impact of external forcing: the said forcing acts directly on a steep threshold nonlinearity in the dynamo source term for the poloidal magnetic component, the background dynamo solution is only midly supercritical so that the magnetic cycle has a constant amplitude and duration, and its equatorial parity is held fixed by model design. The simulations also impose a good frequency separation between external forcing and the internal magnetic cycle, and the activity proxy time series used for spectral analysis are long and well-sampled. This all adds up to a best-case scenario for detecting the spectral signature of weak external periodic or multiperiodic forcing.
In the absence of any other mechanisms modulating the cycle amplitude, the spectral signature of low frequency external forcing is indeed detectable even for small forcing amplitudes (viz. Figure 5). However, even low amplitude internal stochastic forcing of the dynamo effectively drowns the spectral signature of external forcing, at least for reasonable values of stochastic noise and small (A ≤ 0.01) amplitudes of external forcing amplitudes (Figures 7, 8). These results are of course model-dependent, in that they were obtained using a specific dynamo model running in a specific parameter regime, and incorporating equally specific external driver and noise model. Nonetheless, and to the (limited) extent that other parameter regimes and forcing schemes were explored, these conclusions appear robust.
Motivated by numerical experiments reported upon by Stefani et al. (2018), synchronization of the dynamo by external forcing at a frequency close to the dynamo frequency was also explored. Synchronization is readily achieved in the Babcock-Leighton dynamo model used here, which stands in contrast to the negative results of Stefani et al. (2018). These authors used a zero-dimensional dynamical system representation of the Babcock-Leighton dynamo framework, originally developed by Wilmot‐Smith et al. (2006), which then suggests that spatial extension is a feature promoting synchronization, perhaps via the agency of magnetic diffusion. Interestingly, in the two-dimensional kinematic mean-field-like dynamo model used here, synchronization proved very robust to the introduction of stochastic noise in the dynamo poloidal source term. However, and in good agreement with the synchronization study by Stefani et al. (2019) using this time a one-dimensional kinematic mean-field αΩ model, high external forcing amplitudes are required to achieve synchronization, even when the forcing frequency is close to the natural dynamo frequency.
The modelling results presented in this paper, although restricted in scope, indicate that a hypothetical spectral signal of planetary origin, if really present in solar activity data, is likely to be masked by other sources of fluctuations entirely internal to the dynamo mechanism itself, unless a very efficient amplification mechanism is present3 and is largely insensitive to internal sources of perturbations. Potentially viable such mechanisms include planetary-driven tidal perturbation of shear flows within the tachocline altering the buoyant instability threshold of toroidal magnetic magnetic flux tubes stored in the tachocline (Abreu et al., 2012), or excitation of the Tayler instability leading to secondary dynamo action (Stefani et al., 2018; Stefani et al., 2019). More complex related dynamical possibilities include intermittency and stochastic resonance (Albert et al., 2021). Detailed quantitative physical investigations of some of these mechanisms may be possible via numerical simulations, or even laboratory experiments. Section 4 in Stefani et al. (2021) offers an interesting discussion of these possibilities.
From the observational point of view, the one characteristic of planetary forcing that seems most likely to lead to an observable signature is its very long phase coherence; planetary motions are celestial clockwork, and therein lies perhaps the best hope of detecting a statistically significant signature, even in the presence of other internal sources of forcing. The cosmogenic radioisotope record may well be suitable for such an investigation.
There is another potentially interesting observational approach that, to the best of my knowledge, remains to be seriously explored in this context. Past and ongoing surveys of exoplanets have revealed the existence of hundreds of so-called hot Jupiters, gas giant orbiting their host stars at distances smaller than 0.1 Astronomical Units [see, e.g., Schneider et al., 2011)]. Such systems could be ideal testbeds to investigate possible planetary influences on magnetic activity of the host stars. The large planetary masses and short orbital radii would presumably lead to high amplitude forcing, and the short orbital periods should make it (relatively) easy to detect corresponding periodicities in cyclic magnetic activity observations of the host stars; for a hot Jupiter orbiting at 0.1AU, a decade of observations would already sample some 300 orbit.
Having read this far, one might still rightfully ask: why even bother with such “astrological” notions when more conventional and physically well-grounded explanations for long periodicities and quasi-periodicities in solar activity exist already within the accepted framework of hydromagnetic dynamos ? The answer is obviously a matter of opinion, and I shall close by offering a single reason for arguing that the idea is at least worth testing—when formulated in a manner conducive to such tests, of course. One very far-reaching feature of the planetary hypothesis is the aforementioned very long phase coherence of the associated forcing. This implies that it could yield a powerful and potentially precise forecasting scheme for the variations of solar activity on timescales going from multi-decadal and up. As discussed for example in Matthes et al. (2017), the current lack of such predictive models is a primary unknown in quantitatively assessing the possible impacts of solar activity on Earth’s climate on those long timescales. The planetary forcing hypothesis is way out there, but the payoff could be high. Your call.
Data Availability Statement
The raw data supporting the conclusion of this article will be made available by the authors, without undue reservation.
Author Contributions
The author confirms being the sole contributor of this work and has approved it for publication.
Funding
This work was supported through a Discovery Grant from the Natural Sciences and Engineering Research Council of Canada (RGPIN/05278-2018).
Conflict of Interest
The author declares that the research was conducted in the absence of any commercial or financial relationships that could be construed as a potential conflict of interest.
Publisher’s Note
All claims expressed in this article are solely those of the authors and do not necessarily represent those of their affiliated organizations, or those of the publisher, the editors and the reviewers. Any product that may be evaluated in this article, or claim that may be made by its manufacturer, is not guaranteed or endorsed by the publisher.
Acknowledgments
A preliminary version of this work (excluding the synchronization simulations of Section 6) was presented at the Space Climate Symposium 5, held in Oulu (Finland) in June 2013, where it benefited from feedback by José Abreu, Jurg Beer and Ilya Usoskin. Intermittent exchanges on this general topic with Antonio Ferriz-Mas are gratefully acknowledged. Thanks are also due to the referees for useful comments and suggestions.
Footnotes
1Let us imagine an unstable equilibrium, which can be broken by any force and lead to important phenomena […] The Sun’s external layers radiate their heat into space, and in doing so must become denser. Once their density exceeds that of the underlying layers, an unstable equilibrium is created. There will come a time where they will sink in the interior to be replaced by layers less dense. It is therefore possible that planetary tides, however minute, are sufficient to trigger this process [my translation].
2Finally mention must be made of attempts, by myself as well as others, to fit the sunspot time series with a mathematical formula, or to explain its shape through a form of planetary influence on the Sun, even though as yet none of these attempts has yielded truly satisfactory results [my translation].
3And this says nothing of the measurement “noise” and systematic effects associated with the reconstruction of solar activity from measured concentrations of cosmogenic radionuclides, which is a delicate issue in itself; cf., e.g., Cameron and Schüssler (2013) and McCracken et al. (2014).
References
Abreu, J. A., Beer, J., Ferriz-Mas, A., McCracken, K. G., and Steinhilber, F. (2012). Is There a Planetary Influence on Solar Activity? A&A 548, A88. doi:10.1051/0004-6361/201219997
Albert, C., Ferriz-Mas, A., Gaia, F., and Ulzega, S. (2021). Can Stochastic Resonance Explain Recurrence of Grand Minima? ApJL 916, L9. doi:10.3847/2041-8213/ac0fd6
Beer, J., Tobias, S., and Weiss, N. (1998). An Active Sun throughout the Maunder Minimum. Solar Phys. 181, 237–249. doi:10.1023/A:1005026001784
Bushby, P. J. (2006). Zonal Flows and Grand Minima in a Solar Dynamo Model. Monthly Notices R. Astronomical Soc. 371, 772–780. doi:10.1111/j.1365-2966.2006.10706.x
Caligari, P., Moreno-Insertis, F., and Schussler, M. (1995). Emerging Flux Tubes in the Solar Convection Zone. 1: Asymmetry, Tilt, and Emergence Latitude. Astrophysical J. 441, 886. doi:10.1086/175410
Callebaut, D. K., de Jager, C., and Duhau, S. (2012). The Influence of Planetary Attractions on the Solar Tachocline. J. Atmos. Solar-Terrestrial Phys. 80, 73–78. doi:10.1016/j.jastp.2012.03.005
Cameron, R. H., Dasi-Espuig, M., Jiang, J., Işık, E., Schmitt, D., and Schüssler, M. (2013). Limits to Solar Cycle Predictability: Cross-Equatorial Flux Plumes. A&A 557, A141. doi:10.1051/0004-6361/201321981
Cameron, R. H., and Schüssler, M. (2013). No Evidence for Planetary Influence on Solar Activity. A&A 557, A83. doi:10.1051/0004-6361/201321713
Charbonneau, P., and Barlet, G. (2011). The Dynamo Basis of Solar Cycle Precursor Schemes. J. Atmos. Solar-Terrestrial Phys. 73, 198–206. doi:10.1016/j.jastp.2009.12.020
Charbonneau, P., Beaubien, G., and St‐Jean, C. (2007). Fluctuations in Babcock‐Leighton Dynamos. II. Revisiting the Gnevyshev‐Ohl Rule. Astrophysical J. 658, 657–662. doi:10.1086/511177
Charbonneau, P., Blais-Laurier, G., and St-Jean, C. (2004). Intermittency and Phase Persistence in a Babcock-Leighton Model of the Solar Cycle. Astrophysical J. 616, L183–L186. doi:10.1086/426897
Charbonneau, P., and Dikpati, M. (2000). Stochastic Fluctuations in a Babcock‐Leighton Model of the Solar Cycle. Astrophysical J. 543, 1027–1043. doi:10.1086/317142
Charbonneau, P. (2020). Dynamo Models of the Solar Cycle. Living Rev. Sol. Phys. 17, 4. doi:10.1007/s41116-020-00025-6
Charbonneau, P., St‐Jean, C., and Zacharias, P. (2005). Fluctuations in Babcock‐Leighton Dynamos. I. Period Doubling and Transition to Chaos. Astrophysical J. 619, 613–622. doi:10.1086/426385
Charbonneau, P. (2002). The Rise and Fall of the First Solar Cycle Model. J. Hist. Astron. 33, 351–372. doi:10.1177/002182860203300402
Choudhuri, A. R., and Karak, B. B. (2012). Origin of Grand Minima in Sunspot Cycles. Phys. Rev. Lett. 109, 171103. doi:10.1103/PhysRevLett.109.171103
de Jager, C., and Versteegh, G. J. M. (2005). Do Planetary Motions Drive Solar Variability? Sol. Phys. 229, 175–179. doi:10.1007/s11207-005-4086-7
de La Rue, W., Stewart, B., and Loewy, B. (1872). On a Tendency Observed in Sun-Spots to Change Alternately from the One Solar Hemisphere to the Other. Proc. R. Soc. Lond. Ser. 21, 399–402.
Dicke, R. H. (1978). Is There a Chronometer Hidden Deep in the Sun? Nature 276, 676–680. doi:10.1038/276676b0
Dikpati, M., and Charbonneau, P. (1999). A Babcock‐Leighton Flux Transport Dynamo with Solar‐like Differential Rotation. Astrophysical J. 518, 508–520. doi:10.1086/307269
D’Silva, S., and Choudhuri, A. R. (1993). A Theoretical Model for Tilts of Bipolar Magnetic Regions. Astron. Astrophys. 272, 621.
Fairbridge, R. W., and Shirley, J. H. (1987). Prolonged Minima and the 179-YR Cycle of the Solar Inertial Motion. Sol. Phys. 110, 191–210. doi:10.1007/BF00148211
Fan, Y., Fisher, G. H., and Deluca, E. E. (1993). The Origin of Morphological Asymmetries in Bipolar Active Regions. Astrophysical J. 405, 390. doi:10.1086/172370
Ferriz-Mas, A., Schmitt, D., and Schuessler, M. (1994). A Dynamo Effect Due to Instability of Magnetic Flux Tubes. Astron. Astrophys. 289, 949–956.
Hoyng, P. (1993). Helicity Fluctuations in Mean Field Theory: an Explanation for the Variability of the Solar Cycle? Astron. Astrophys. 272, 321.
Hoyng, P. (1996). Is the Solar Cycle Timed by a Clock? Sol. Phys. 169, 253–264. doi:10.1007/BF00190603
Javaraiah, J., and Gokhale, M. H. (1995). Periodicities in the Solar Differential Rotation, Surface Magnetic Field and Planetary Configurations. Sol. Phys. 158, 173–195. doi:10.1007/BF00680841
Jiang, J., Cameron, R. H., and Schüssler, M. (2014). Effects of the Scatter in Sunspot Group Tilt Angles on the Large-Scale Magnetic Field at the Solar Surface. Astrophysical J. 791, 5. doi:10.1088/0004-637X/791/1/5
Küker, M., Arlt, R., and Rüdiger, G. (1999). The Maunder Minimum as Due to Magnetic Lambda -quenching. Astron. Astrophys. 343, 977–982.
Matthes, K., Funke, B., Andersson, M. E., Barnard, L., Beer, J., Charbonneau, P., et al. (2017). Solar Forcing for CMIP6 (v3.2). Geosci. Model. Dev. 10, 2247–2302. doi:10.5194/gmd-10-2247-2017
McClintock, B. H., and Norton, A. A. (2013). Recovering Joy's Law as a Function of Solar Cycle, Hemisphere, and Longitude. Sol. Phys. 287, 215–227. doi:10.1007/s11207-013-0338-0
McCracken, K. G., Beer, J., and Steinhilber, F. (2014). Evidence for Planetary Forcing of the Cosmic Ray Intensity and Solar Activity throughout the Past 9400 Years. Sol. Phys. 289, 3207–3229. doi:10.1007/s11207-014-0510-1
Miesch, M. S., Elliott, J. R., Toomre, J., Clune, T. L., Glatzmaier, G. A., and Gilman, P. A. (2000). Three‐dimensional Spherical Simulations of Solar Convection. I. Differential Rotation and Pattern Evolution Achieved with Laminar and Turbulent States. Astrophysical J. 532, 593–615. doi:10.1086/308555
Moss, D., and Brooke, J. (2000). Towards a Model for the Solar Dynamo. Monthly Notices R. Astronomical Soc. 315, 521–533. doi:10.1046/j.1365-8711.2000.03452.x
Muñoz-Jaramillo, A., Dasi-Espuig, M., Balmaceda, L. A., and DeLuca, E. E. (2013). Solar Cycle Propagation, Memory, and Prediction: Insights from a Century of Magnetic Proxies. Astrophysical J. 767, L25. doi:10.1088/2041-8205/767/2/L25
Nagy, M., Lemerle, A., Labonville, F., Petrovay, K., and Charbonneau, P. (2017). The Effect of “Rogue” Active Regions on the Solar Cycle. Sol. Phys. 292, 167. doi:10.1007/s11207-017-1194-0
Ossendrijver, M., Stix, M., and Brandenburg, A. (2001). Magnetoconvection and Dynamo Coefficients:. A&A 376, 713–726. doi:10.1051/0004-6361:20011041
Petrovay, K., Nagy, M., and Yeates, A. R. (2020). Towards an Algebraic Method of Solar Cycle Prediction. J. Space Weather Space Clim. 10, 50. doi:10.1051/swsc/2020050
Petrovay, K. (2020). Solar Cycle Prediction. Living Rev. Sol. Phys. 17, 2. doi:10.1007/s41116-020-0022-z
Poluianov, S., and Usoskin, I. (2014). Critical Analysis of a Hypothesis of the Planetary Tidal Influence on Solar Activity. Sol. Phys. 289, 2333–2342. doi:10.1007/s11207-014-0475-0
Racine, É., Charbonneau, P., Ghizaru, M., Bouchat, A., and Smolarkiewicz, P. K. (2011). On the Mode of Dynamo Action in a Global Large-Eddy Simulation of Solar Convection. Astrophysical J. 735, 46. doi:10.1088/0004-637X/735/1/46
Schneider, J., Dedieu, C., Le Sidaner, P., Savalle, R., and Zolotukhin, I. (2011). Defining and Cataloging Exoplanets: the exoplanet.Eu Database. A&A 532, A79. doi:10.1051/0004-6361/201116713
Simard, C., Charbonneau, P., and Dubé, C. (2016). Characterisation of the Turbulent Electromotive Force and its Magnetically-Mediated Quenching in a Global EULAG-MHD Simulation of Solar Convection. Adv. Space Res. 58, 1522–1537. doi:10.1016/j.asr.2016.03.041
Simard, C., and Charbonneau, P. (2020). Grand Minima in a Spherical Non-kinematic α2Ω Mean-Field Dynamo Model. J. Space Weather Space Clim. 10, 9. doi:10.1051/swsc/2020006
Sokoloff, D., and Nesme-Ribes, E. (1994). The Maunder Minimum: a Mixed-Parity Dynamo Mode? Astron. Astrophys. 288, 293–298.
Stefani, F., Giesecke, A., Weber, N., and Weier, T. (2018). On the Synchronizability of Tayler-Spruit and Babcock-Leighton Type Dynamos. Sol. Phys. 293, 12. doi:10.1007/s11207-017-1232-y
Stefani, F., Giesecke, A., and Weier, T. (2019). A Model of a Tidally Synchronized Solar Dynamo. Sol. Phys. 294, 60. doi:10.1007/s11207-019-1447-1
Stefani, F., Stepanov, R., and Weier, T. (2021). Shaken and Stirred: When Bond Meets Suess-De Vries and Gnevyshev-Ohl. Sol. Phys. 296, 88. doi:10.1007/s11207-021-01822-4
Usoskin, I. G. (2017). A History of Solar Activity over Millennia. Living Rev. Sol. Phys. 14, 3. doi:10.1007/s41116-017-0006-9
Warnecke, J., Rheinhardt, M., Tuomisto, S., Käpylä, P. J., Käpylä, M. J., and Brandenburg, A. (2018). Turbulent Transport Coefficients in Spherical Wedge Dynamo Simulations of Solar-like Stars. A&A 609, A51. doi:10.1051/0004-6361/201628136
Wilmot‐Smith, A. L., Nandy, D., Hornig, G., and Martens, P. C. H. (2006). A Time Delay Model for Solar and Stellar Dynamos. Astrophysical J. 652, 696–708. doi:10.1086/508013
Wood, K. D. (1972). Physical Sciences: Sunspots and Planets. Nature 240, 91–93. doi:10.1038/240091a0
Keywords: sun, solar cycle, dynamo, grand minima, synchronization
Citation: Charbonneau P (2022) External Forcing of the Solar Dynamo. Front. Astron. Space Sci. 9:853676. doi: 10.3389/fspas.2022.853676
Received: 12 January 2022; Accepted: 23 February 2022;
Published: 14 March 2022.
Edited by:
Fadil Inceoglu, GFZ German Research Centre for Geosciences, GermanyReviewed by:
Robert Harold Cameron, Max Planck Institute for Solar System Research, GermanySoumitra Hazra, University of Massachusetts Lowell, United States
Copyright © 2022 Charbonneau. This is an open-access article distributed under the terms of the Creative Commons Attribution License (CC BY). The use, distribution or reproduction in other forums is permitted, provided the original author(s) and the copyright owner(s) are credited and that the original publication in this journal is cited, in accordance with accepted academic practice. No use, distribution or reproduction is permitted which does not comply with these terms.
*Correspondence: Paul Charbonneau, paul.charbonneau@umontreal.ca
 Paul Charbonneau