 Sarah Mendorf
 Konstantin G. Heimrich
 Hannah M. Mühlhammer1,3
 Tino Prell
 Aline Schönenberg
95% of researchers rate our articles as excellent or good
Learn more about the work of our research integrity team to safeguard the quality of each article we publish.
Find out more
ORIGINAL RESEARCH article
Front. Psychol. , 11 January 2024
Sec. Health Psychology
Volume 14 - 2023 | https://doi.org/10.3389/fpsyg.2023.1301530
Introduction: Previous longitudinal studies identified various factors predicting changes in Quality of Life (QoL) in people with diabetes mellitus (PwDM). However, in these studies, the stability of QoL has not been assessed with respect to individual differences.
Methods: We studied the predictive influence of variables on the development of QoL in PwDM across three waves (2013–2017) from the cross-national panel dataset Survey of Health, Ageing, and Retirement in Europe (SHARE). To determine clinically meaningful changes in QoL, we identified minimal clinically important difference (MCID). Linear regressions and Linear Mixed Models (LMM) were conducted to determine factors associated with changes in QoL.
Results: On average, QoL remained stable across three waves in 2989 PwDM, with a marginal difference only present between the first and last wave. However, when looking at individual trajectories, 19 different longitudinal patterns of QoL were identified across the three time-points, with 38.8% of participants showing stable QoL. Linear regression linked lower QoL to female gender, less education, loneliness, reduced memory function, physical inactivity, reduced health, depression, and mobility limitations. LMM showed that the random effect of ID had the strongest impact on QoL across the three waves, suggesting highly individual QoL patterns.
Conclusion: This study enhances the understanding of the stability of QoL measures, which are often used as primary endpoints in clinical research. We demonstrated that using traditional averaging methods, QoL appears stable on group level. However, our analysis indicated that QoL should be measured on an individual level.
In recent years, the COVID-19 pandemic with its varying policies and circumstances exemplified how quality of life (QoL) can be affected globally and individually by different factors over time (Hansel et al., 2022). For many people, this global stressor caused a reduction in the mental and physical health for a period of time; however, not all people were affected equally. Depending on intrinsic and extrinsic factors, some people maintained a high QoL (Eicher et al., 2021; Malini et al., 2022). These findings raise the question whether QoL can be considered a stable, state-like construct, or whether people are constantly faced with changing circumstances that cause their QoL to oscillate. Notably, QoL is a multi-dimensional and subjective construct that denotes how people view their physical, emotional, and social well-being (Rubin and Peyrot, 1999; Dickerson et al., 2011) and may thus differ for individuals. QoL contributes meaningfully to well-being, and due to its multidimensional approach, people may report high QoL even in the face of physical decline. Still, while QoL exists detached from health, physical health and chronic illnesses are often found to reduce QoL (Samiei Siboni et al., 2019).
One of the most common chronic disorders is Diabetes mellitus (DM), a metabolic disorder characterized by elevated blood sugar levels that affects millions of people worldwide. The disease can lead to a range of complications if not controlled, including neuropathy, visual problems, renal failure, and heart disease (American Diabetes Association, 2013). The diagnosis of DM often requires long-term treatment and changes to lifestyle and dietary habits. These changes can have a significant impact on the quality of life of people with DM (PwDM) (Rubin and Peyrot, 1999). Additionally, for individuals suffering from chronic DM, a comprehensive cure is unattainable (Saleh et al., 2015). A high disease burden due to declining health, worry and medication intake (oral and especially via insulin injections) commonly lead to reduced QoL in PwDM (Yildirim et al., 2023). While clinical measures can offer a helpful assessment of disease management, the primary objective of DM care is to impede deterioration of the patient’s QoL (Saleh et al., 2015). Therefore, identifying the predictors and risk factors impacting QoL is essential, as these can be targeted for preventative measures (Dickerson et al., 2011; Yildirim et al., 2023).
In previous research, several factors that impact the QoL of PwDM have been identified. These include higher age, female gender, higher body mass index (BMI), lower education, more limitations in activities of daily living (ADL), more loneliness, depression and depressive symptoms, higher number of chronic conditions, more mobility restrictions, reduced cognition, widowed or divorced marital status, unemployment or permanent illness at work, less physical activity, reduced general health, and presence of pain (Glasgow et al., 1997; Rubin and Peyrot, 1999; Ij et al., 2012; VanderWeele et al., 2012; Kim and Kim, 2017; Zurita-Cruz et al., 2018; Zakin et al., 2019; Marneras et al., 2020; Al-Matrouk and Al-Sharbati, 2022). Over time, the long-term effects of the disease and its complications can further impact patients’ physical abilities, mobility, social relationships, self-esteem, and mental health (Solli et al., 2010). Disease-specific factors such as stigmatization or the need for insulin injections, as well as complications of the disease progression, may further lead to reduced QoL; resulting in an overall lower QoL of PwDM compared to the general population (Hanestad, 1993; Glasgow et al., 1997; Rubin and Peyrot, 1999; Solli et al., 2010; Ij et al., 2012; VanderWeele et al., 2012; Kim and Kim, 2017; Zurita-Cruz et al., 2018; Zakin et al., 2019; Marneras et al., 2020; Al-Matrouk and Al-Sharbati, 2022; Yildirim et al., 2023). Diabetic neuropathy, for example, has a specific impact on mobility and physical abilities which may lead to difficulty in maintaining social relationships, among other challenges. The condition’s effects on an individual’s movement and coordination are significant. Therefore, its impact must be taken into consideration when developing treatment plans (Solli et al., 2010). Mental wellbeing and self-esteem, alternatively, remains unaffected by glycaemic management and associated complications of DM (Donald et al., 2013). In general, the QoL was significantly affected by ischemic heart disease, stroke, neuropathy, and the fear of hypoglycemia, according to Solli et al. (2010). These complications do not arise at the outset of the illness, only manifesting as the disease advances. Additionally, QoL has emerged as a key objective in healthcare as a result of advancements in patients’ rights movements. Its significance lies in clinical, economic, and political decision-making (Pais-Ribeiro, 2004). This progressive nature of the disease and the accompanying changes in symptomology as well as the aforementioned impact of changes in environmental circumstances, like the COVID-19 pandemic, raise the question of how QoL changes over time in PwDM. Knowing about the temporal development of QoL is crucial in managing the condition and improving overall well-being.
This understanding is especially important as an increasing number of studies utilize QoL as an endpoint in longitudinal analyses. These encompass studies involving PwDM (Schmitz et al., 2013; Wang et al., 2019; Shamshirgaran et al., 2020; Ho et al., 2022; Matlock et al., 2022; Park et al., 2022), as well as other illnesses such as chronic diseases (Le Grande et al., 2006; Dunn et al., 2013; Yoo et al., 2016). It is important to understand the longitudinal trajectories of QoL in PwDM and the factors that impact future QoL. This determines the validity of using QoL as an endpoint in studies (Leidy et al., 1999), because if QoL fluctuates with a high frequency, using it as a one-time endpoint for intervention studies cannot truly uncover the effect of the intervention. Many previous studies addressing report stable QoL for PwDM. For example, a study involving older PwDM discovered that most participants did not experience significant changes of QoL over time. The methods employed in the study consisted of latent class growth analysis and multinomial logistic regression models with the aim of ascertaining the predictors of QoL trajectories. However, this investigation concentrated on the impact of DM on the short-term alterations in the QoL of older adults individuals (Park et al., 2022). It was also discovered in separate studies featuring Taiwanese participants with no age limit that most subjects did not encounter noteworthy QoL modifications over an extended period (Schmitz et al., 2013; Wang et al., 2019) with the use of trajectory modeling (Schmitz et al., 2013; Safita et al., 2016)and multinomial logistic regression (Wang et al., 2019). However, the impact of DM on QoL may also be influenced by cultural variances so that the results cannot be fully transferred to the general population (Safita et al., 2016). Another study looked at older adults PwDM and showed that executive function and negative emotions predicted QoL. Pearson’s correlation coefficient analysis and stepwise multiple linear regression analysis have been conducted. The study’s limitation lies in its inadequate sample size, which precludes confirming the findings amongst various older adults diagnosed with DM and having numerous variables (Ho et al., 2022). Shamshirgaran et al. compared individuals with and without DM and concluded that their QoL increased over time. Age, chronic conditions, vision and sleep problems, body weight, annual income, and years of education were found to be predictive factors for future QoL. The study employed the Generalised Estimating Equation model to achieve its objective. Caution should be taken when considering the generalizability of the results due to the participation rate, dropouts, and loss to follow up (Shamshirgaran et al., 2020). While these results assessed the stability of QoL while controlling for covariates, it is important to note that these studies assessed QoL on group-average instead of considering individual patterns of QoL across time. However, to truly understand the reliability of QoL as an endpoint for clinical trials, it is crucial to separate the average effect from individual influences. This is because, a stable mean or consistent QoL may also imply that different patterns within the cohort cancel each other out.
The aims of this study are therefore to longitudinally depict the patterns of QoL in PwDM and to estimate the effects of variables that vary between individuals as well as variables that vary within individuals.
This study utilized data from the Survey of Health, Ageing and Retirement in Europe (SHARE). This is a large multi-national panel dataset, encompassing over 140,000 subjects aged 50 and above from 20 European nations and Israel. SHARE represents a continual research partnership exploring the influence of health, social, economic, and environmental policies on the lives of middle-aged and older adults individuals throughout Europe. Currently, eight waves of SHARE data have been gathered with both new and repeating participants to enable cross-sectional and longitudinal data analysis of a wide range of variables. Skilled staff in each country collect these variables using a computer-assisted personal interviewing method, occasionally supported by distributing paper-pencil questionnaires. Furthermore, individuals were summoned to designated study centres to undertake a range of health evaluations, including tests for cognitive ability, grip efficacy, walking pace as well as blood sampling (SHARE, n.d.). In the development stage of the sampling process, the Country Team and Field Agency work alongside SHARE Central to craft a tailored sampling design. This involves deciding on a sampling frame and specifying the sampling procedure. Secondly, the sample is drawn by the Country Team / Field Agency (or through a third party, such as an institution hosting a national register) and then processed to produce a gross sample file. In the third stage, SHARE Central ensures the conformity of the gross sample with SHARE standards. In the final step, SHARE Central and CentERdata collate and upload the gross sample data using Sample Control software, which is subsequently merged with the corresponding addresses provided by the Country Team. The detail survey methods, sampling design, and data resources are described in detail in the respective survey materials (Börsch-Supan et al., 2013a,b; Malter and Börsch-Supan, 2013; Börsch-Supan et al., 2015; Malter and Börsch-Supan, 2015; Malter and Börsch-Supan, 2017). Due to probabilistic sampling the participants selected were nationally representative. The survey questions pertained to measures of demographics, socio-relational factors, as well as health-related indices, encompassing functional ability and mental health. Our data for this investigation has been extracted from waves 5 (2013) to 7 (2017) (Börsch-Supan, 2022a,b,c) of the SHARE dataset.
The inclusion criteria were the presence of DM and a complete CASP score without missing data. Due to the careful sampling procedure employed in SHARE and the exploratory nature of our analysis, no further exclusion criteria were specified.
For ease of understanding and replicability, we provide the name of the variables as given in the SHARE dataset in italics and the name of the respective dataset in square brackets in Table 1 (Börsch-Supan, 2022a,b,c).
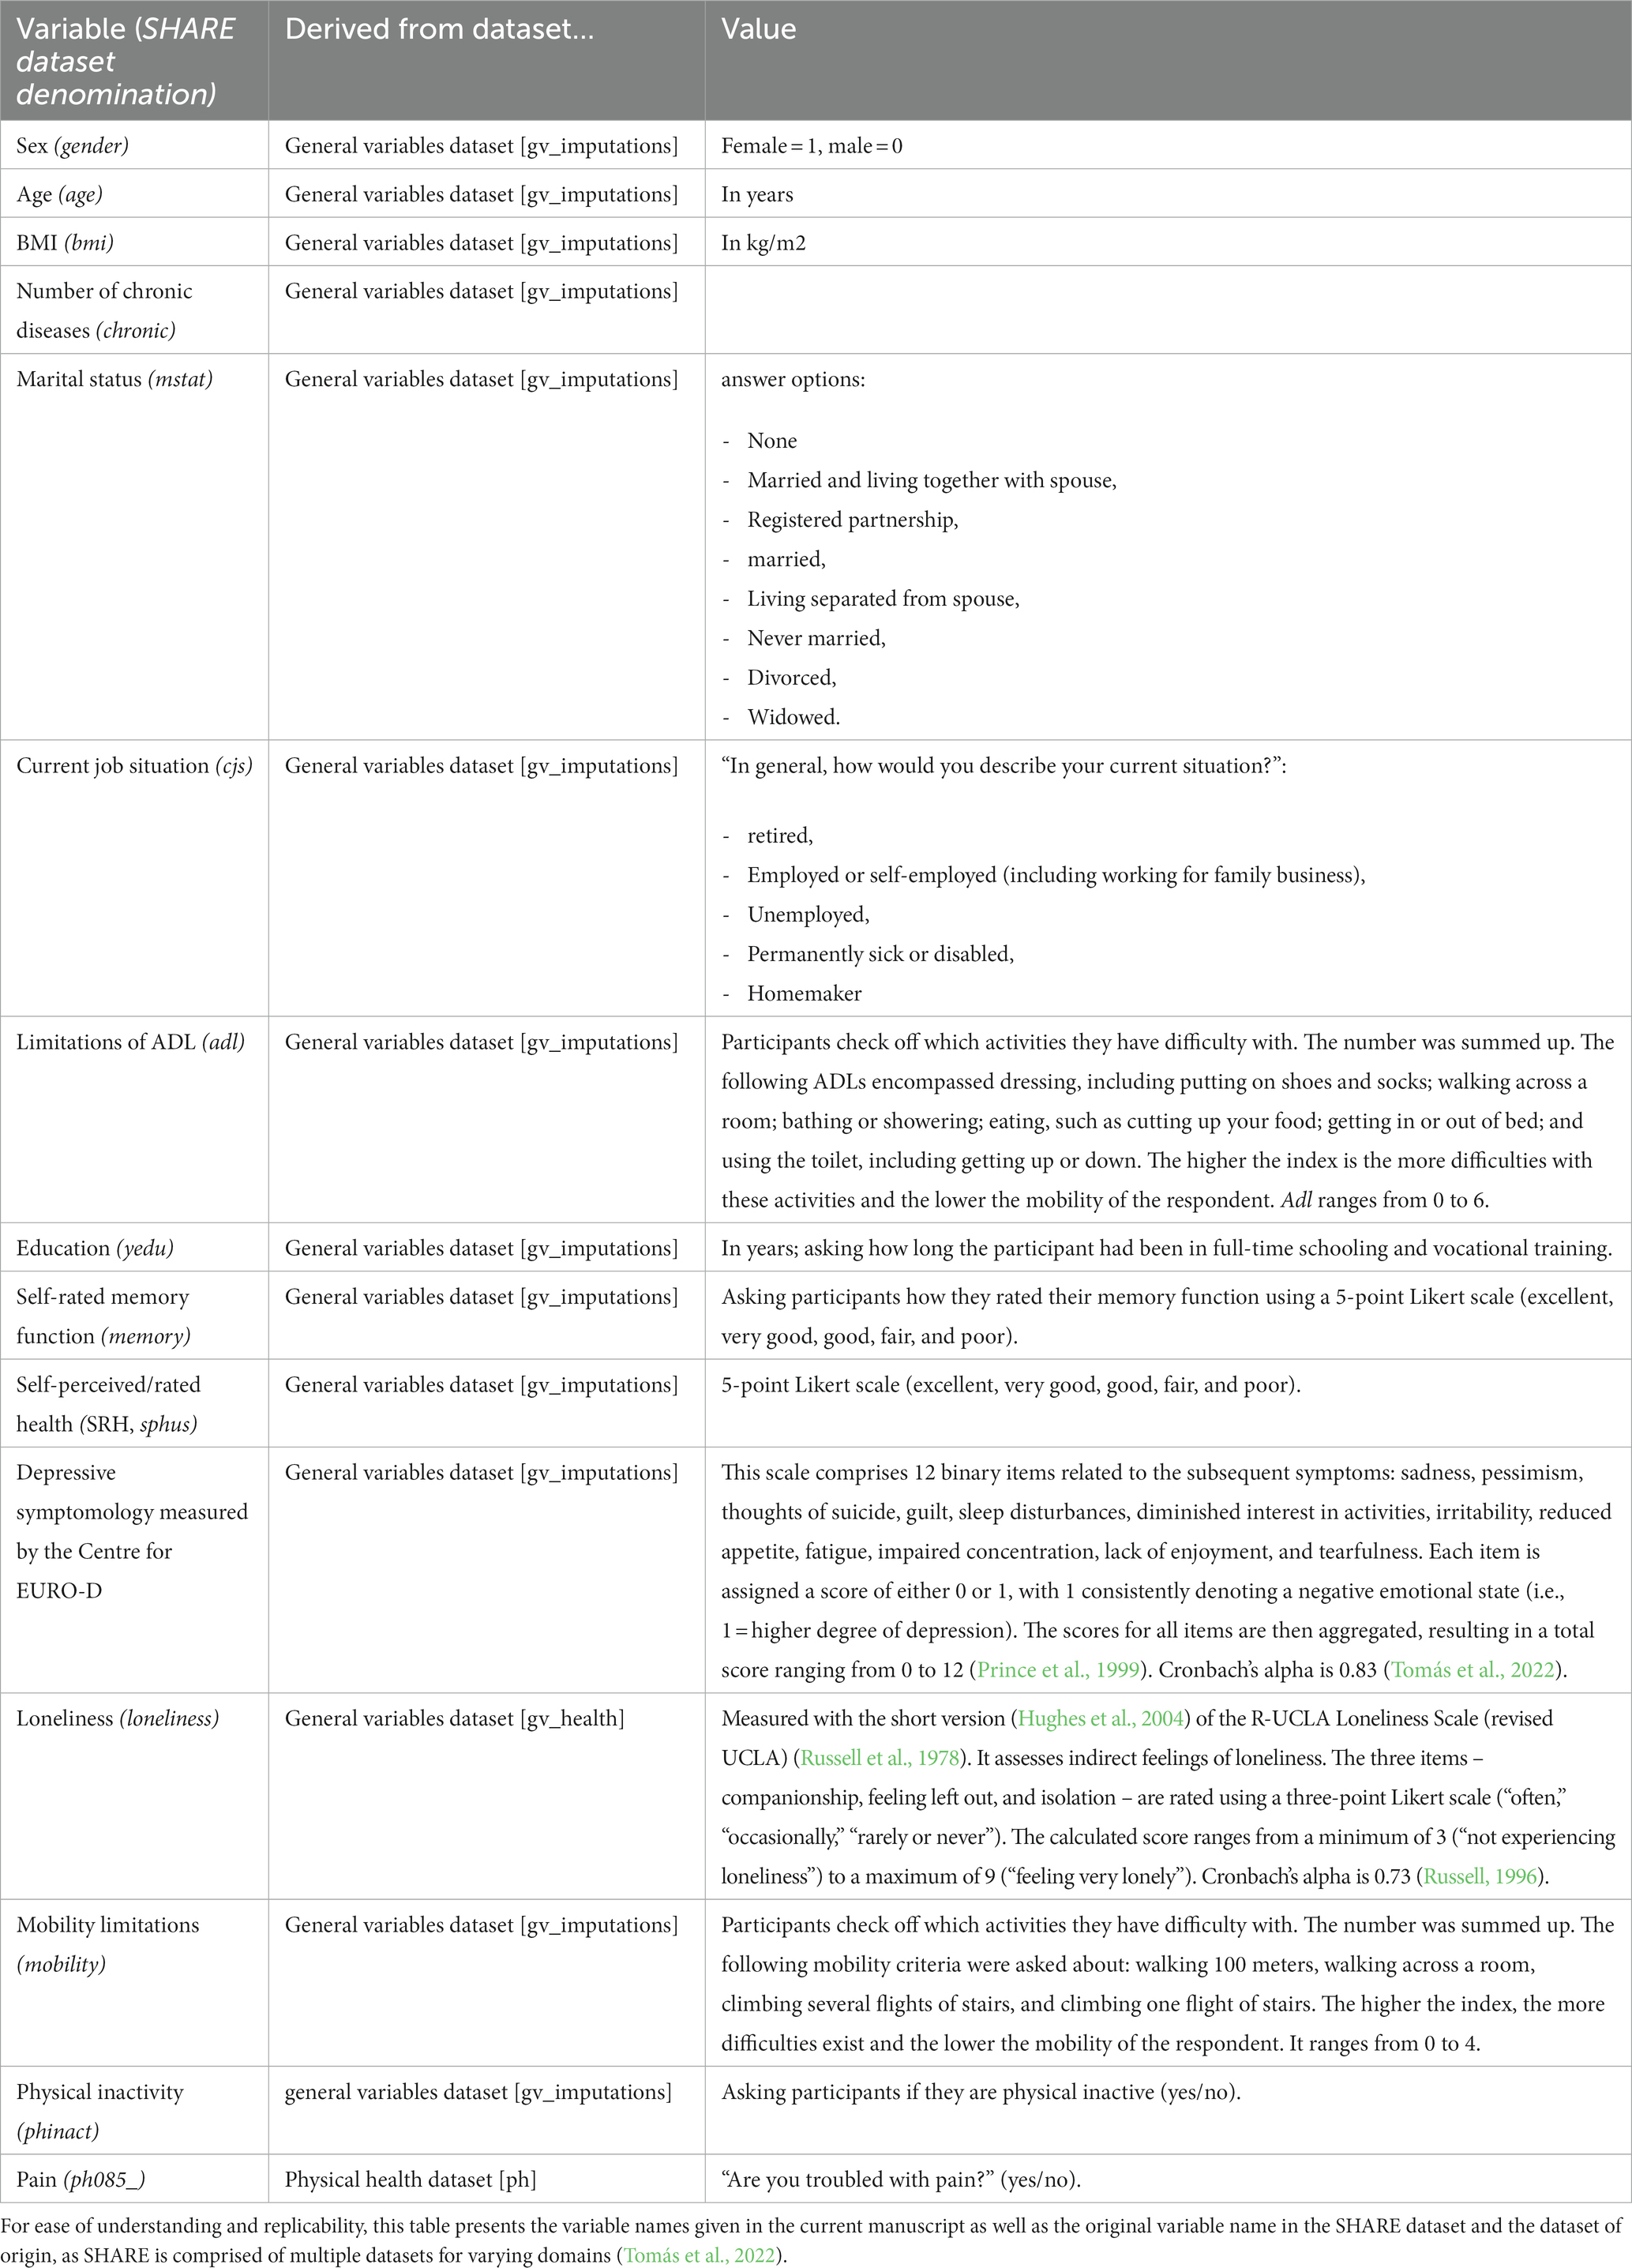
Table 1. Overview of independent variables.
The presence of DM was captured by a yes/no question: “Has a doctor ever told you that you had Diabetes or high blood sugar?” (ph006d5 in physical health dataset [ph]). No distinction was made between type 1 and type 2 DM.
The CASP-12 score (casp in general variables dataset [gv_health]) evaluates the QoL and is determined by four subdimensions: control, autonomy, pleasure, and self-realization. These four subdomains also gave the score its name: CASP: control, autonomy, self-realization, and pleasure. This measure distinguishes itself from health-related measures by placing emphasis on the positive aspects of QoL and by operating independently from health and other external factors that could potentially impact on it (Hyde et al., 2003; Wiggins et al., 2008). One’s capability to shape their environment is known as control, while the accompanying need for self-determination is called autonomy, both of which are essential for full participation within society (Hyde et al., 2003). Self-realization and pleasure domains pertain to the level of fulfilment of human potential and hedonic well-being, respectively (Higgs et al., 2003). As the survey is intended for older adults individuals (Hyde et al., 2003), it highlights crucial elements of the QoL for those with DM, particularly DM Type ll, which is a pervasive condition affecting the older adults populace.
The CASP score is computed by summing up these four subdimensions, resulting in a range of 12 to 48. A high score indicates high QoL (Hyde et al., 2003). The Cronbach’s alpha values for the domain control, autonomy, pleasure, and self-realization are 0.73, 0.33, 0.74, and 0.85, respectively (Borrat-Besson et al., 2015).
In total, 3,985 PwDM had a complete CASP in wave 5, 4,366 participants in wave 6, and 4,643 in wave 7. Across all waves, 2,989 PwDM with a complete CASP were identified. These participants were included in the longitudinal analyses presented in our manuscript.
Due to the complex nature of the dataset, the extracted variables are presented in detail in Table 1.
All analyses were conducted using IBM SPSS statistics (Version 29) and R (Version 4.1.1). The included parameters were not normally distributed, as assessed by the Shapiro–Wilk-Test. For this reason, metric values are given as median with interquartile range (IQR). Nominal and ordinal values are given as numbers and percentages. Missing data were treated according to the pairwise deletion process. All statistical tests were applied two-sided at a significance level of 0.05.
To understand the nature of our dataset and interpret the results of the longitudinal analyses, we first describe the variables of interest for each wave. Then, we used Friedman test for ordinal und metric variables and Cochrane’s Q for nominal variables with post hoc analysis adjusted by Bonferroni correction to detect changes in the variables of interest between the three waves. Of note, as the Friedman test is based on ranks and not the actual (median) values, considerable changes can be discovered despite the medians seeming to be identical (Friedman, 1937).
A general linear model for each wave (stepwise backward) for the CASP score was calculated to identify variables that influence QoL in PwDM cross-sectionally. According to a Durbin Watson Test of >1.5 and < 2, autocorrelation was not an issue in the model. Evidence for multicolinearity did not emerge for Variance inflation factor values between 1 and 2 in all regressions of the respective waves.
As the CASP score can encompass up to 48 points, we aimed to control for random fluctuations in QoL scores across time points. Therefore, as a first step, we aimed to determine when a change in the CASP score across waves could be considered a meaningful/impactful change. Utilizing any change, starting with a single point, is not feasible due to measurement errors and memory bias. Instead, we chose the minimal clinically important difference (MCID) as the clinically significant difference, taking into consideration the standard deviation (SD) of CASP scores.
We calculated this using the distribution method: MCID = 0.5 * SD (Norman et al., 2003, 2004).
In our case, the formula was:
The MCID was 3.18; therefore, we considered CASP-12 differences between waves of ≥4 to be clinically significant. Thus, based on the MCID, we divided the participants into 2 main groups: stable QoL across all three waves, and unstable/changing QoL across the waves. Stable QoL indicates that participants’ CASP scored did not differ more than 3 points between the waves, unstable QoL means that the CASP score did differ ≥4 points between at least two waves.
The MCID has been defined as the smallest score difference in the relevant score that patients perceive as advantageous and that would demand a change in the patient’s treatment while ensuring there are no severe side effects or exorbitant costs (Jaeschke et al., 1989). Osoba et al. (1998) highlight the significance of identifying clinically meaningful differences, since even minor numerical disparities in mean health-related QoL scores may yield statistically significant results with generous sample sizes, but statistical significance is not interchangeable with clinical significance. One advantage of distribution-based methods is their ability to account for changes beyond a certain level of random variation (Crosby et al., 2003). Distribution-based methods are specific to the sample used. For instance, statistical analysis alone can extract MCID scores from a study with a large sample size and wide distribution, even if no actual change has occurred (Wright et al., 2012). However, distribution-based methods have a weakness in that there are few established benchmarks for determining clinically significant improvements. More significantly, distribution-based methods are inadequate in addressing the question of a patient’s perspective of clinically important change, which varies distinctly from statistical significance (Crosby et al., 2003; Copay et al., 2007).
Having determined at which point a change in the CASP score reflects a meaningful change in QoL, we first calculated the differences between the CASP sum scores for Wave 5 – Wave 6, Wave 6 – Wave 7 and Wave 5 – Wave 7 for every participant. To descriptively assess the different patterns in QoL, differences ≥ ±4 were denoted as ±1 (depicting a clinically relevant increase or decrease between the respective waves), while differences below 4 were coded as 0. We then assessed the number of distinct patterns of increase, decrease and stability for the longitudinal subsample and provide graphic illustrations of those patterns.
Finally, to determine which variables drive this change in QoL, a linear mixed model (LMM) was employed to examine the relationship between CASP scores and (1) only the waves as fixed intercept, and (2) when adding the covariates waves, age, limitations of ADL, number of chronic illnesses, education level, depressive symptoms, SRH, loneliness, job status, marital status, memory, mobility limitations, pain, and physical inactivity as fixed effects predictors. ID was used as random effect predictor. Random intercepts for participants were specified to account for the repeated measures nature of the data. Model fit was assessed using Akaike’s information Criterion (AIC), and the significance of the fixed effects was determined based on p-values. Additionally, we calculate the Intraclass Correlation Coefficient (ICC) using the formula:
The sociodemographic information on the included participants is given in Table 2. Among the waves, the proportion of women ranged between 50.9 and 51.7%. The median CASP score across waves was 37 (IQR 32–41), suggesting – across the entire cohort – a stable QoL over time. Education in years (p = 0.215), gender (p = 1.000), memory function (p = 0.819), and pain (p = 0.154) showed no significant change between waves (Table 2). The median age incrementally increased by 2 years from wave to wave according to the time course of the waves. Furthermore, the percentage of married PwDM decreased while widowhood became more prominent. On average, the BMI decreased significantly between waves 5–6 and 6–7, while ADL limitations increased between waves 5–7. Of note, CASP scores decreased significantly between waves 5–7, but not between waves 5–6. In contrast, R-UCLA, EURO, and the proportion of retired PwDM significant increased both from waves 5–7 and from waves 6–7. Correspondingly, the percentage of PwDM in employment, unemployment or long-term sickness decreased. Furthermore, there was a decline in verbal fluency, as well as a decrease in the percentage of participants reporting improved SRH and physical activity between waves 5/7 and waves 6/7. In contrast, there was an increase in reduced SRH and physical inactivity during the same period. The number of chronic illnesses and mobility limitations increased considerably between all waves (Table 2).
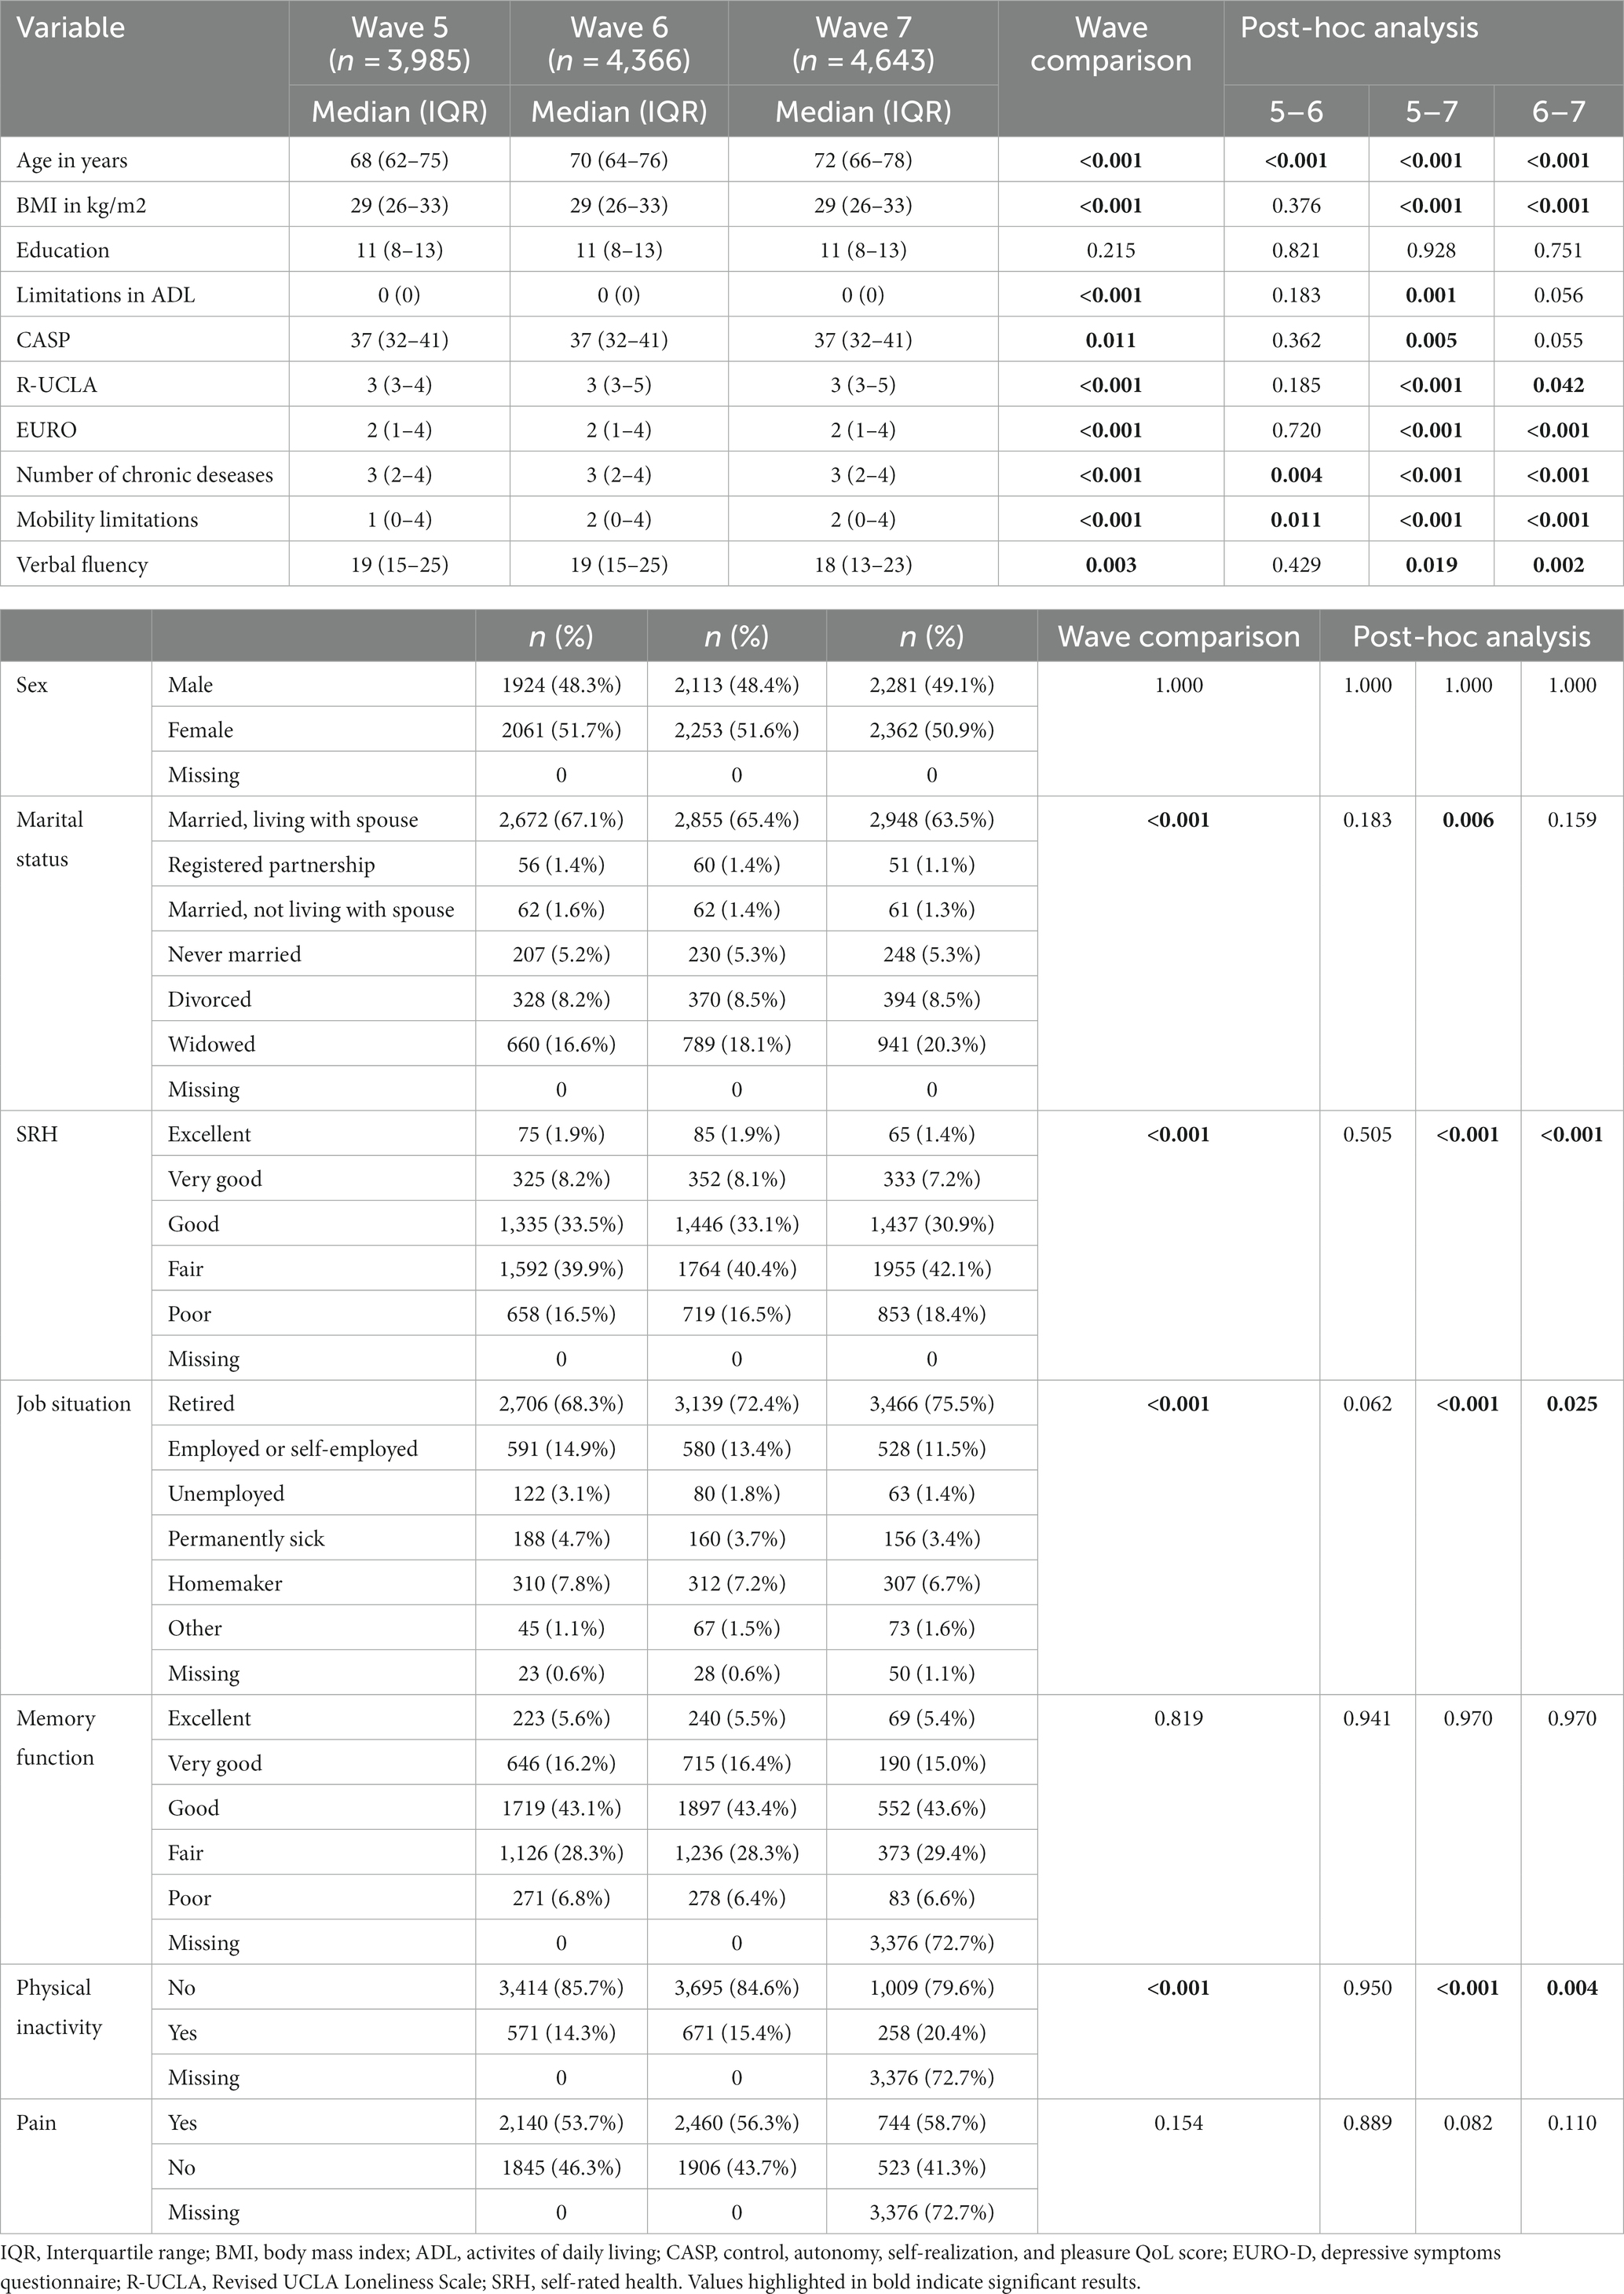
Table 2. Demographic characteristics and comparison between the waves for PwDM.
In the linear regression, we identified a set of variables to be associated with lower QoL across all three waves. These include female gender, less years of education, loneliness, reduced memory function, physical inactivity, reduced SRH, depressive symptomology, and more mobility limitations. Pain and a higher number of chronic diseases were additionally associated with poorer QoL in PwDM only in wave 6 (Supplementary Table S1).
Having confirmed the link between QoL and several variables cross-sectionally, we next aimed to assess their longitudinal influence on QoL. For this purpose, we selected a sub-sample of 2,989 PwDM who completed the CASP in all three waves. Sociodemographic information on this sub-group is given in Supplementary Table S2. We used a MCID of ≥4 points as a relevant difference in CASP score between waves. Overall, 61.2% (n = 2,148) showed a relevant change in QoL across all 3 waves (unstable QoL). When analyzing possible structures behind these CASP changes, 19 patterns emerged (Figure 1). These patterns depict changes (increase or decrease) between wave 5–6, waves 6–7 as well as waves 5–7 that exceed the identified MCID. Overall, the patterns indicate a varying trajectory of QoL across three time-points, with the most common patterns being a stable CASP score (pattern 18, N = 841), a decrease from wave 5 to 7 but stable QoL between 6 and 7 (pattern 7, N = 257), an increase between wave 5 and 7 but no change between 6 and 7 (pattern 5, N = 250), and a decrease between wave 5 and 7 but no change between 5 and 6 (pattern 3, N = 245). Using group comparison, we identified that those with unstable QoL had significantly less education, more ADL limitations, more loneliness, and depressive symptoms, more chronic conditions, more mobility limitations, lower SRH, reduced memory function, increased physical inactivity, and other job situations. However, the effect sizes were very small (Supplementary Table S2).
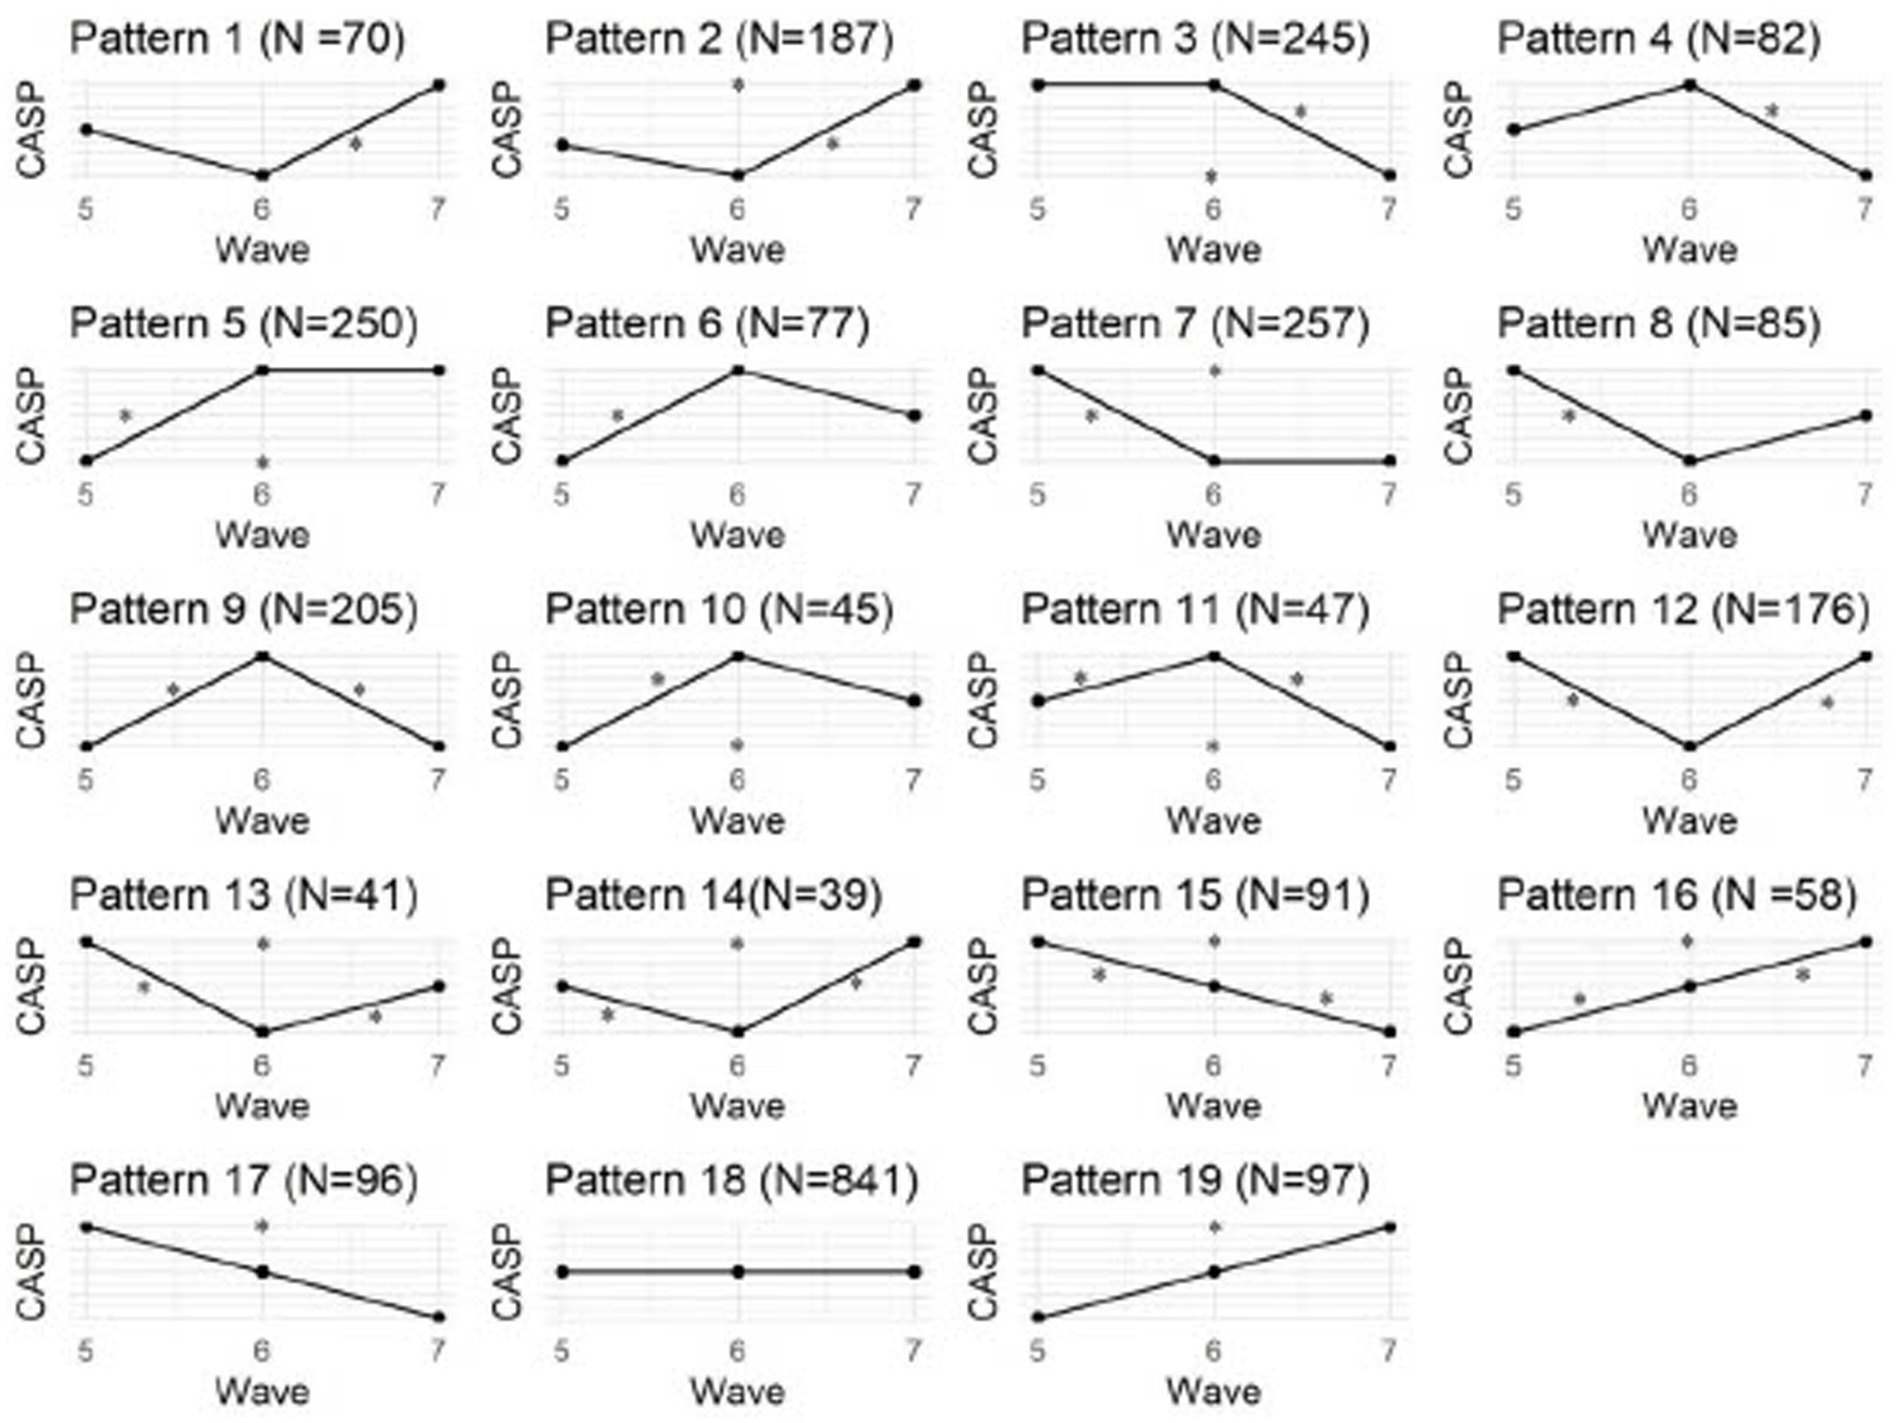
Figure 1. CASP pattern. * indicate differences of points in the CASP between waves, N indicates the number of participants showing the respective pattern.
To fully understand what drives the differences in CASP cores across waves, we used LMMs. Initially, we aimed to differentiate between group effects and individual effects, as the different patterns suggest a highly heterogenous trajectory of QoL across the three waves. Thus, we performed initial simple model (Table 3) containing the respective CASP score of each wave as the dependent variable as well as wave as a fixed and ID as a random effect. An ANOVA showed that the null-hypothesis that the CASP does not change between waves has to be rejected, F (2, 5,978) = 6.197, p = 0.002), meaning that the CASP varies between waves. As already indicated in the descriptive results, this effect is mainly driven by the difference between W5 and W7 (p = 0.002). When looking at the results in the form of a simple regression model using model slope and intercept,
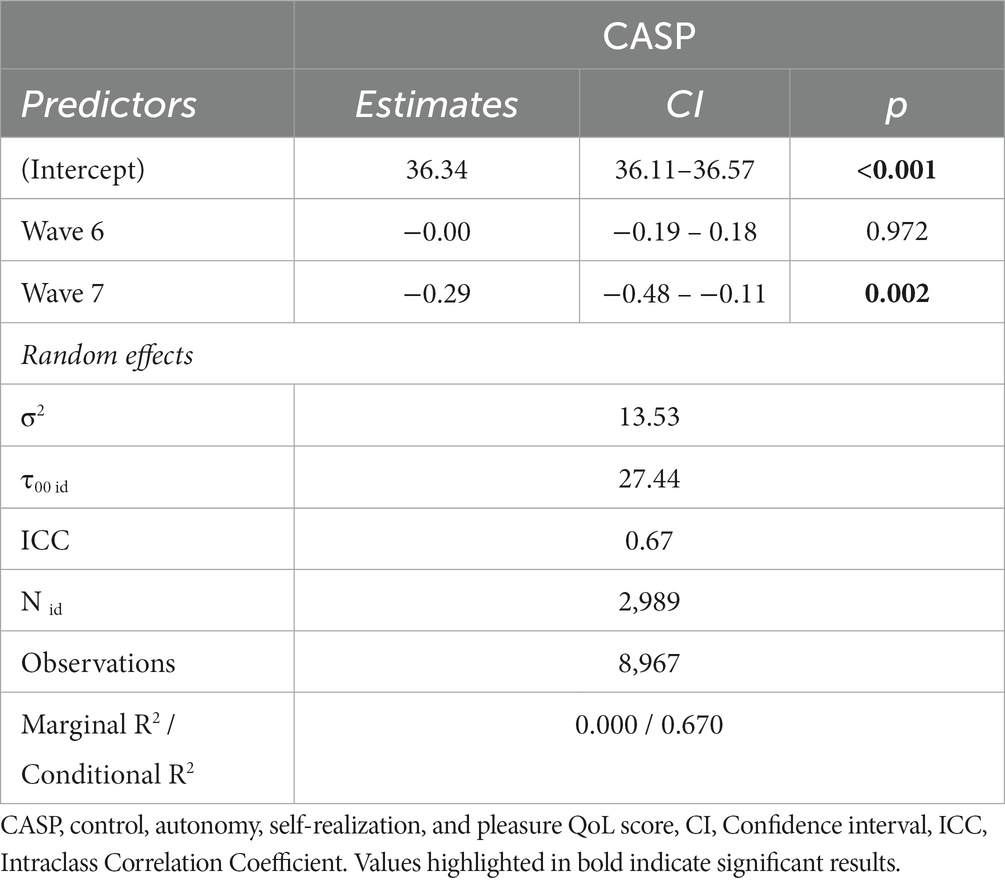
Table 3. Simple LMM with Wave and ID.
The results imply that on average, QoL reduces by 0.003 points between wave 5 and wave 6, and by 0.292 points from wave 5 to wave 7. In line with the descriptive results in Table 2, this also suggests that, on group level, the QoL remains relatively constant.
However, the random effect also showed a strong effect of ID on the CASP. Looking at the explained variance indicates a variance of 24.47 for the random effect of ID with only 37.997 residual variance. We calculate the ICC revealing high intra-personal clustering with an ICC of 0.67, meaning that 67% of the model variance can be explained by the ID alone.
Figure 2 shows the estimated random effects (intercept) for each ID and their confidence interval estimate. Intervals that do not include zero are in bold. In this case, such IDs are relatively higher or lower starting out compared to a “typical” ID. These results show the high range of random effects, again indicating that on an individual level, CASP scores vary between the waves.
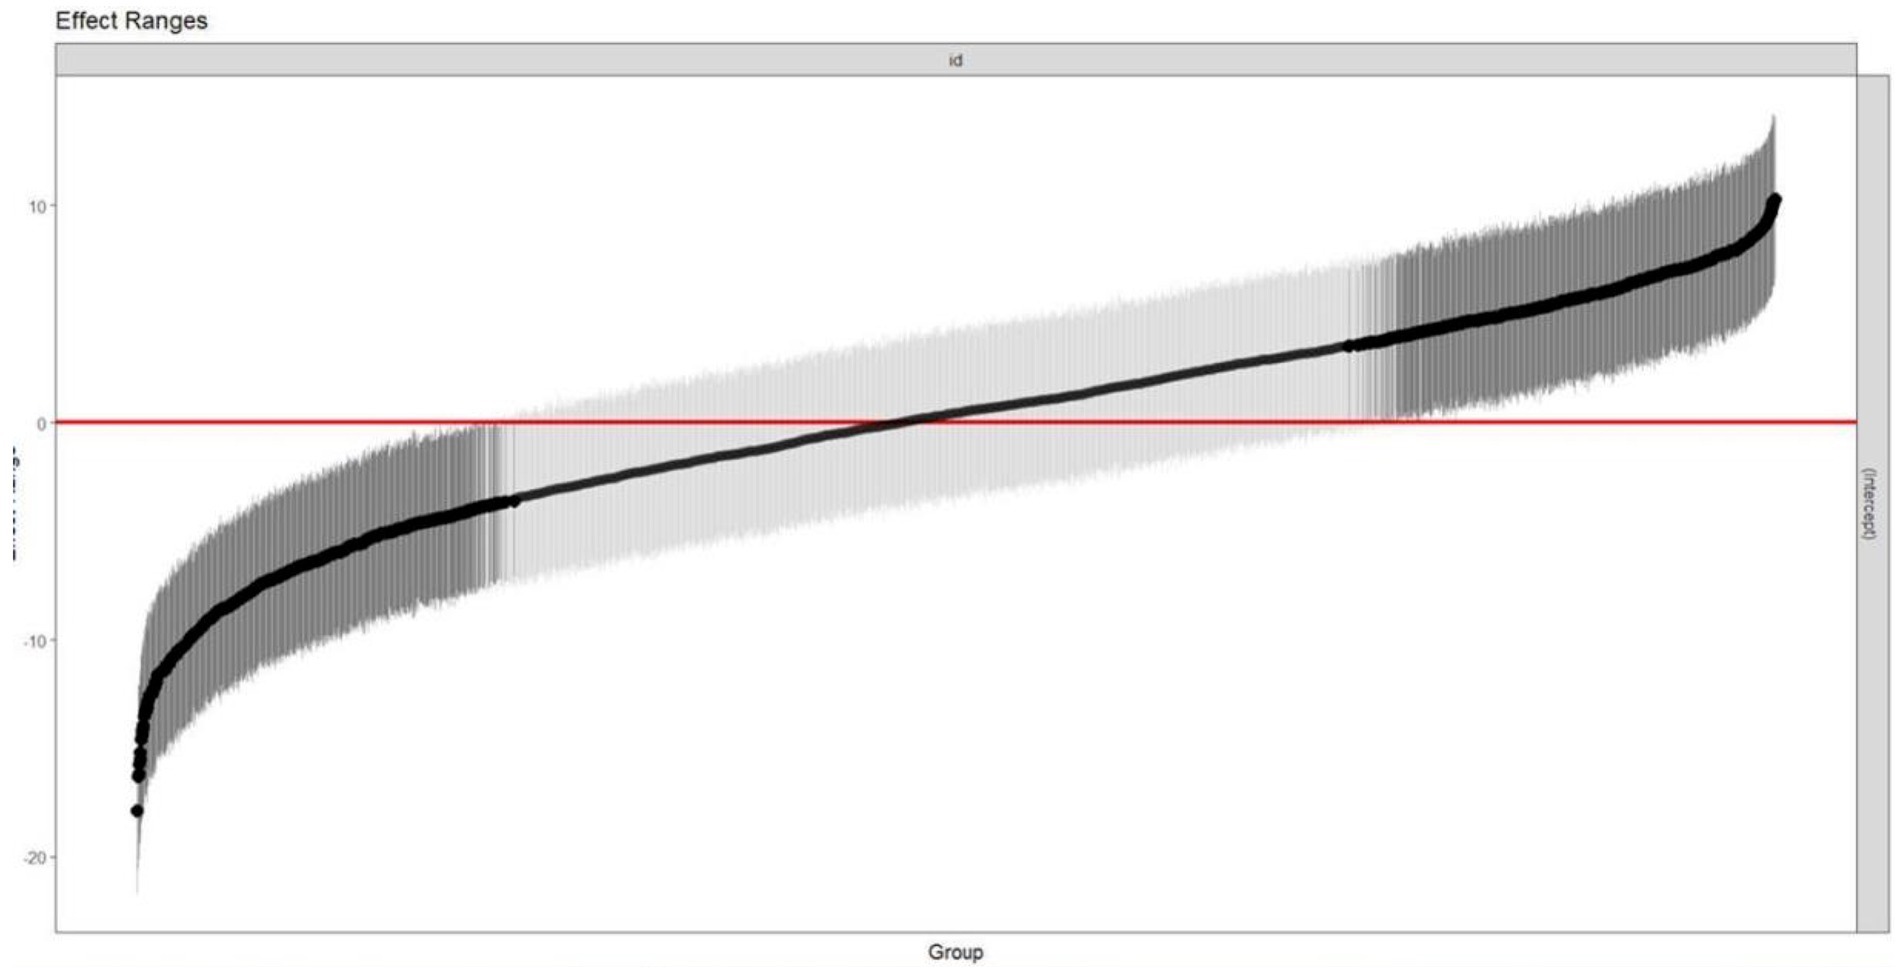
Figure 2. Plot of the estimated random effects for each ID and their Confidence Intervels.
To ultimately differentiate between the influence of ID and the covariates previously identified, we calculated a second linear mixed model with CASP as dependent variable and several covariates as fixed effects (Table 4). Model comparison using ANOVA revealed a better fit for the model containing covariates vs. the initial simple model (p < 0.001), indicating that the added covariates contribute to understanding the changes in CASP. When looking at the covariates, a significant negative effect on QoL can be found for depressive symptoms (EURO-D), education, number of chronic illnesses, SRH, loneliness, cognition, mobility, physical inactivity, and female gender. However, the random effect of ID still showed an ICC of 0.463, and conditional R2 was higher than marginal R2, indicating a strong influence of ID on the CASP scores. Marginal R2 depicts the variance explained by fixed factors only, whereas conditional R2 takes into consideration the variance explained by fixed and random effects.
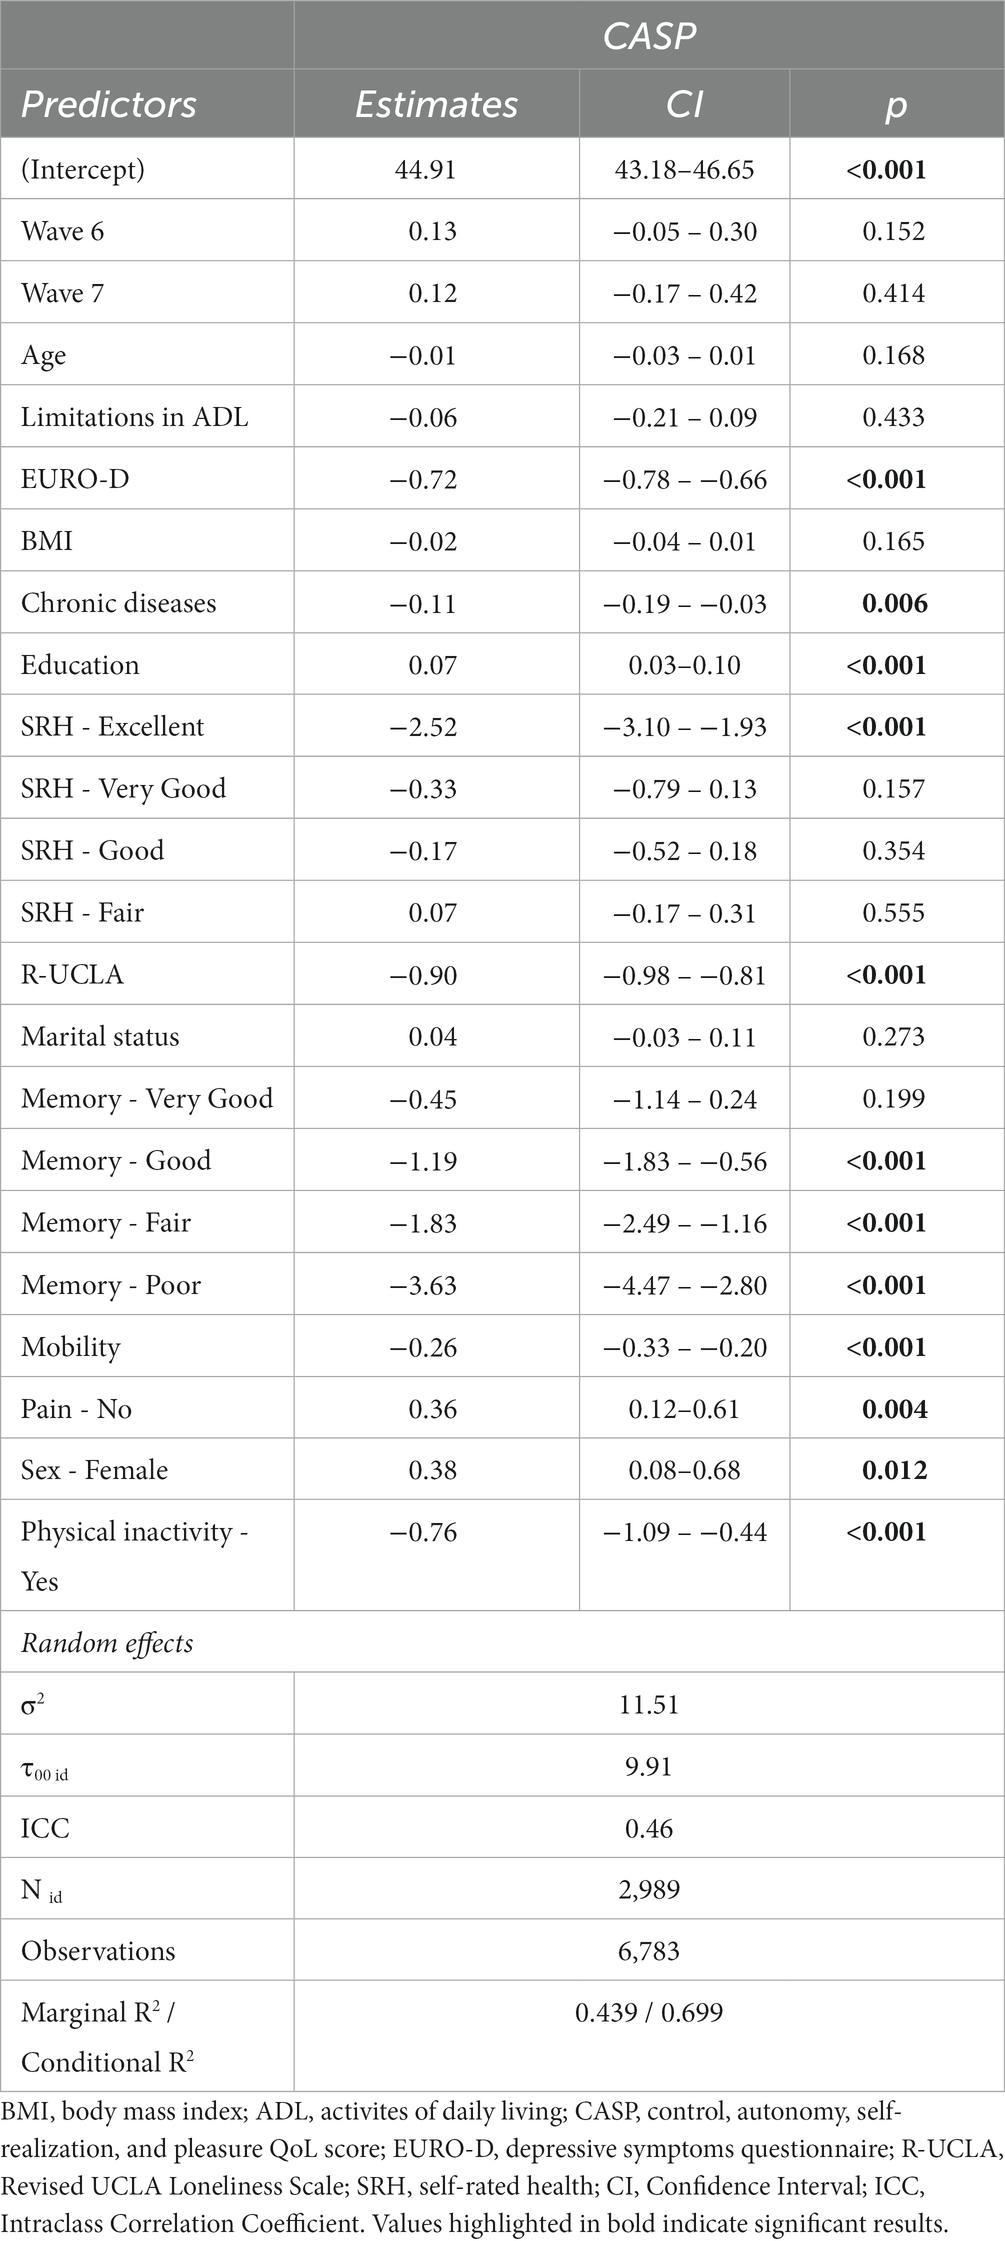
Table 4. LMM with covariates.
When researching QoL as an endpoint, it is crucial to appreciate PwDM’s QoL progression over time, as well as the factors influencing it. Our findings demonstrate a relatively constant QoL for PwDM when measured in the aggregated way using traditional group comparison or regression methods. This was also confirmed in other studies, which showed that PwDM had a relatively stable QoL (Schmitz et al., 2013; Wang et al., 2019; Park et al., 2022). However, when looking at the present patterns of QoL changes, stable QoL based on a MCID of 4 was only found in 38.8% PwDM. Our results of the LMMs and the different patterns presented in Figure 2 suggest that this is likely a result of individual developments balancing each other out when considered on group level. This means that the QoL increase in some and the decrease in others cancel each other out, leading to a deceiving stability of QoL on group level. However, there is considerable variability at the individual level, suggesting that individuals’ QoL is more influenced by their own circumstances than by other medical, social, and psychological factors. This indicates that in line with the idea that QoL describes the personal interpretation of various mental, health-related and social life circumstances (Samiei Siboni et al., 2019), QoL in PwDM is highly individual. This has also been demonstrated in older adults individuals irrespective of their pre-existing medical conditions (Bowen et al., 2015; Howard and Hoffman, 2018; Băjenaru et al., 2022). This is attributed to differing socio-demographic characteristics, needs, and perceptions towards health, resulting in non-uniform profiles (Balog et al., 2020). In general, there is notable variation in the individual health and QoL (Howard and Hoffman, 2018).
In addition to individual influences, we did identify common factors that explain variability in QoL. The connection between chronic conditions and QoL for PwDM is in line with previous research, given that the physical health status, including complications like diabetic retinopathy, neuropathy, and nephropathy, can reduce QoL (Bowen et al., 2015; Matlock et al., 2022). SRH, which has been found to contribute to QoL (Ferrans et al., 2005), was also identified as a significant forecaster of QoL in this analysis, which is in line with previous studies in which older PwDM who reported better health also had higher QoL than their counterparts (Schmitz et al., 2013; Shiu et al., 2014; Speight et al., 2020). Park et al. (2022) found that PwDM who have higher levels of education, physical activity, and are male were more likely to be classified in the stable or increasing QoL groups which is also reflected in our results. Other studies have also demonstrated the predictive influence of pain, executive function-related memory (Ho et al., 2022), and education (Shamshirgaran et al., 2020). Additionally, individuals with other chronic illnesses also demonstrate a relationship between depression and QoL (Le Grande et al., 2006; Yoo et al., 2016). In General, depression or depression-related symptoms are commonly associated with QoL (Malhi and Mann, 2018). The results emphasize the complex interplay between physical, psychological, and social variables among PwDM and other illnesses that constitute QoL as a personal interpretation of different life domains (Samiei Siboni et al., 2019). Including these health-related and psychosocial variables in our analysis is important, as this allows for an estimation of the life domains that contribute to variations in QoL on the one hand, and to compare the influence of individual fluctuations to common changes during chronic illness. Likewise, these results show that our study population is comparable to previous populations on the general level. Still, the comparison of the marginal to the conditional R2 representing fixed and random effects indicates that the contribution of the covariates is comparably low when considering the individual.
The factors that consistently had a negative impact on QoL, based on cross-sectional analysis, were female gender, lower levels of education, loneliness, reduced memory function, physical inactivity, poorer SRH, depressive symptoms, and greater mobility limitations. It is worth noting that these factors have been reported in previous studies (Verbrugge, 1982; Hibbard and Pope, 1983; Verbrugge, 1985; Green, 1990; Kandrack et al., 1991; Sharpe et al., 1991; Jacobson et al., 1994; Glasgow et al., 1997; Jacobson et al., 1997; Black, 1999; Rubin and Peyrot, 1999; Pouwer et al., 2005; Hermanns et al., 2006; Ij et al., 2012; VanderWeele et al., 2012; Kim and Kim, 2017; Zurita-Cruz et al., 2018; Zakin et al., 2019; Marneras et al., 2020; Al-Matrouk and Al-Sharbati, 2022). Additionally, education level was related to QoL, with survey participants who reported higher education and income scoring higher across all sub-scales of the SF-20 (Glasgow et al., 1997).Again, the results emphasize the complex interplay between physical, psychological, and social variables when assessing QoL among individuals with DM.
Of note, it must be kept in mind that all these variables were assessed using generic questionnaires, thus it is plausible that each individual interprets a certain questionnaire item differently based on their experiences and association while having a similar score. Overall, our results suggest that while there are common underlying stressors, such as the COVID-19 pandemic or other health-related and psychosocial circumstances that may lead to a systematic change in QoL for a larger group of people, individual life circumstances appear to be the primary drivers of instable QoL.
To understand the trajectories of QoL across time, previous research also aimed to identify distinct patterns. In contrast to our results, previous studies identified a maximum of five patterns by utilizing various methodological approaches and grouping trajectories based on group-level distributions such as growth mixture models or latent class growth analysis (Le Grande et al., 2006; Dunn et al., 2013; Schmitz et al., 2013; Yoo et al., 2016; Park et al., 2022). Based on the MCID to detect a clinically relevant change, our study presents descriptive findings of 19 patterns concerning changes in QoL to illustrate the extensive variety of QoL trajectories within our sample. Of note, the number of patterns is dependent on the number of time-points assessed, in our case three rather than only comparing the initial and final assessments. This is especially crucial as researchers may not be aware of the specific phase of the trajectory when assessing QoL. This relates to the frequency at which a certain variable is assessed in longitudinal data collection (Scholz, 2019) (see for example (Chevance et al., 2021) for an assessment of walking behavior across time). In relation to the original question of the manuscript, whether QoL can be considered a stable construct, the question remains how frequently QoL varies; because when using QoL as a single end-point for clinical trials one can never know at which point of the QoL oscillation the measurement takes place. Previous research has employed a classification approach driven by a model, retrospectively attempting to classify trajectories that were discovered, such as high-falling, high-stable, medium-stable, low-rising QoL (Park et al., 2022), or consistently good, steadily worsened, steadily improved, consistently bad (Yoo et al., 2016). Nevertheless, this methodology fails to represent all potential QoL patterns, which is primarily what we were interested in investigating to unveil the intricacy of individual patterns. We have solely investigated patterns through mathematical analysis to avoid concealing individual influential factors by grouping them into broader categories. Moreover, we used the MCID instead of any change to assess significant QoL modifications instead of relying solely on the provided QoL scores. It is noteworthy that despite latent growth models allowing for distinct trajectories among individuals, previous studies did not report these individual differences. However, our analysis indicates that individual factors play a significant role in determining patterns of QoL.
Generally, our approach indicates that future research should take into account the individual differences in QoL measured across time to truly assess well-being and effectiveness of interventions. In addition to these idiosyncratic factors, common underlying medical, social, and psychological factors have an impact on the trajectories of QoL and should therefore be targeted in interventions.
One limitation of this study is the absence of differentiation between type 1 and type 2 DM. These two types of DM can have distinct characteristics and influences on QoL. Nevertheless, the majority of the literature examined has not shown significant variation in connection to diabetes type (Rodríguez-Almagro et al., 2018), This indicates that other factors, such as age and treatment regimen, may be more consequential determinants of QoL (Rubin and Peyrot, 1999). The data is drawn from individuals living within a community, which suggests that the sample is relatively healthy. Thus, making conclusive statements about individuals with significant health issues, such as geriatric patients, would be difficult. These analyses act as an initial indicator of the significance of individual QoL outcomes, and further testing should be conducted on different groups of PwPD.
Likewise, despite many advantages such as large sample sizes and standardized data collection procedures, the use of a multi-national panel-dataset may also introduce a certain bias towards the inclusion of comparably healthy participants. Still, SHARE counteracted this risk by utilizing purposive sampling to include a representative sample. Additionally, the use of computer-assisted interviewing helped guide participants through the questionnaires to reduce missing data; still it cannot be ruled out that missing data is more common in participants with worse mental and physical health. Due to the large sample size and the risk of introducing more bias (Jakobsen et al., 2017), we refrained from imputation-based methods, meaning that missing data were excluded from analysis.
Several variables in the analysis rely on self-reports, such as QoL, depressive symptoms, SRH and ADL, which implies that the responses provided cannot be objectified. Self-reported data poses issues, including the tendency for individuals to provide socially desirable responses and the risk of sampling bias (Devaux and Sassi, 2015). However, the utilization of self-report measures is necessary to understand a subjective construct such as QoL, which cannot be assessed objectively, and studies suggest that self-reports contain valuable data (Prince et al., 1999; Lenderink et al., 2012). Additionally, all self-report measures employed in data collection are both validated and commonly utilised. In addition, SHARE adopted a standardized, computer-assisted personal interviewing data collection procedure to alleviate social desirability response bias.
Additionally, the question remains of how to calculate a meaningful cut-off at which a change in QoL scores can be considered clinically relevant. We opted against simply using any change in the QOL score, as this would yield far too complex patterns that are difficult to interpret, since it is not feasible a change of 1 point in a questionnaire with up to 48 points truly represents a meaningful change in QoL. We thus used the MCID, which is based on the distribution of QoL scores in the studied population; however, other methods may be feasible as well that should be tested with respect to individual differences. Of note, for ease of interpretability, we did not differentiate between scores once they had exceeded the cut-off of 4 points for the MCID; in future studies, it might be beneficial to additionally assess the difference between smaller and very large changes in QoL, although these remain to be defined as well. In future studies, to understand in-depth at which point patients perceive a subjectively meaningful change in their QoL, analyses could be supplemented with detailed qualitative data.
DM is an illness that is commonly present in older age, therefore the use of the CASP to assess the stability of QoL already considers the specific characteristics of QoL in age. Still, to truly understand QoL in PwDM in particular, it may be beneficial to repeat the analyses with disease-specific questionnaires to incorporate DM-related features.
This study enhances understanding of the QoL for PwDM over a specific time frame. The QoL of PwDM shows significant stability over time on group level when assessed using traditional techniques like group comparison or regression models. However, our analysis has shown that individual factors have the highest predictive value of QoL over time. Though the effect of physical, psychological, and social factors on QoL is present, it is relatively less significant. While we did find group-level differences for mental and physical health, these were of small effect sizes, again highlighting the individual nature of QoL stability. Our results suggest that like for QoL, the characteristics of these variables may be highly subjective and interact idiosyncratically for different persons. Additional research is required to investigate the influence of individual factors in comparison to the previously dominant predictors of QoL. Healthcare professionals should take into account individual traits when creating interventions and support strategies for PwDM to improve their overall health and boost their capacity to manage their condition. Enhanced research is required to examine the long-term impacts of precise interventions and to broaden understanding in various demographics and cultural settings.
Publicly available datasets were analyzed in this study. This data can be found at: http://www.share-project.org.
The studies involving humans were approved by continuous ethics review by responsible ethics committees (University of Mannheim and Max Planck Society, Germany), as well as national ethics committees in participating countries as part of the SHARE data collection. The studies were conducted in accordance with the local legislation and institutional requirements. The participants provided their written informed consent to participate in this study.
SM: Formal analysis, Methodology, Writing – original draft. KH: Writing – review & editing. HM: Writing – review & editing. TP: Conceptualization, Methodology, Writing – review & editing. AS: Conceptualization, Formal analysis, Methodology, Writing – review & editing.
The author(s) declare financial support was received for the research, authorship, and/or publication of this article. SM, TP, and HM received funding from a Bundesministerium für Bildung und Forschung (BMBF, Federal Ministry of Education and Research) grant (01GY1804). KH received funding from the Deutsche Forschungsgemeinschaft (DFG, German Research Foundation) as part of the Clinician Scientist-Program OrganAge, funding number 413668513. TP received funding from a Bundesministerium für Bildung und Forschung (BMBF, Federal Ministry of Education and Research) grant (01GY2301). The SHARE data collection has been funded by the European Commission, DG RTD through FP5 (QLK6-CT-2001-00360), FP6 (SHARE-I3: RII-CT-2006-062193, COMPARE: CIT5-CT-2005-028857, SHARELIFE: CIT4-CT-2006-028812), FP7 (SHARE-PREP: GA N°211909, SHARE-LEAP: GA N°227822, SHARE M4: GA N°261982, DASISH: GA N°283646) and Horizon 2020 (SHARE-DEV3: GA N°676536, SHARE-COHESION: GA N°870628, SERISS: GA N°654221, SSHOC: GA N°823782, SHARE-COVID19: GA N°101015924) and by DG Employment, Social Affairs & Inclusion through VS 2015/0195, VS 2016/0135, VS 2018/0285, VS 2019/0332, and VS 2020/0313. Additional funding from the German Ministry of Education and Research, the Max Planck Society for the Advancement of Science, the U.S. National Institute on Aging (U01_AG09740-13S2, P01_AG005842, P01_AG08291, P30_AG12815, R21_AG025169, Y1-AG-4553-01, IAG_BSR06-11, OGHA_04-064, HHSN271201300071C, RAG052527A) and from various national funding sources is gratefully acknowledged (see www.share-project.org). We acknowledge support by the German Research Foundation Projekt-Nr. 512648189 and the Open Access Publication Fund of the Thueringer Universitaets- und Landesbibliothek Jena.
This paper uses data from SHARE Waves 5, 6, and 7 (10.6103/SHARE.w5.800, 10.6103/SHARE.w6.800, 10.6103/SHARE.w7.800), see Börsch-Supan et al. (2013a,b) for methodological details.
The authors declare that the research was conducted in the absence of any commercial or financial relationships that could be construed as a potential conflict of interest.
All claims expressed in this article are solely those of the authors and do not necessarily represent those of their affiliated organizations, or those of the publisher, the editors and the reviewers. Any product that may be evaluated in this article, or claim that may be made by its manufacturer, is not guaranteed or endorsed by the publisher.
The Supplementary material for this article can be found online at: https://www.frontiersin.org/articles/10.3389/fpsyg.2023.1301530/full#supplementary-material
Al-Matrouk, J., and Al-Sharbati, M. (2022). Quality of life of adult patients with type 2 diabetes mellitus in Kuwait: a cross-sectional study. Med. Princ. Pract. 31, 238–245. doi: 10.1159/000521686
American Diabetes Association (2013). Diagnosis and classification of diabetes mellitus. Diabetes Care 36, S67–S74. doi: 10.2337/dc13-S067
Băjenaru, L., Balog, A., Dobre, C., Drăghici, R., and Prada, G. I. (2022). Latent profile analysis for quality of life in older patients. BMC Geriatr. 22:848. doi: 10.1186/s12877-022-03518-1
Balog, A., Bajenaru, L., Cristescu, I., and Herghelegiu, A. (2020). Needs and Preferences of Elderly Patients Regarding Ambient Assisted Living Systems: a Latent Profile Analysis. The 8th IEEE International Conference on E-Health and Bioengineering - EHB 2020 ; Iasi, Romania: Grigore T. Popa University of Medicine and Pharmacy.
Black, S. A. (1999). Increased health burden associated with comorbid depression in older diabetic Mexican Americans. Results from the Hispanic established population for the epidemiologic study of the elderly survey. Diabetes Care 22, 56–64. doi: 10.2337/diacare.22.1.56
Borrat-Besson, C., Ryser, V., and Goncalves, J. (2015). “An evaluation of the CASP-12 scale used in the survey of health” in Ageing and retirement in Europe (SHARE) to measure quality of life among people aged 50+. FORS working papers (Lausanne: FORS)
Börsch-Supan, A. (2022a). Survey of health, ageing and retirement in Europe (SHARE) wave 5. Release version: 8.0.0. SHARE-ERIC Data set. doi: 10.6103/SHARE.w5.800
Börsch-Supan, A. (2022b). Survey of health, ageing and retirement in Europe (SHARE) wave 6. Release version: 8.0.0. SHARE-ERIC Data set. doi: 10.6103/SHARE.w6.800
Börsch-Supan, A. (2022c). Survey of health, ageing and retirement in Europe (SHARE) wave 7. Release version: 8.0.0. SHARE-ERIC data set. doi: 10.6103/SHARE.w7.800
Börsch-Supan, A., Brandt, M., Hunkler, C., Kneip, T., Korbmacher, J., Malter, F., et al. (2013a). Data resource profile: the survey of health, ageing and retirement in Europe (SHARE). Int. J. Epidemiol. 42, 992–1001. doi: 10.1093/ije/dyt088
Börsch-Supan, A., Brandt, M., Litwin, H., and Weber, G. (2013b). Active ageing and solidarity between generations in Europe. Munich, Germany: Max-Planck-Institute for Social Law and Social Policy.
Börsch-Supan, A., Kneip, T., Litwin, M., Myck, G., and Weber, G. (2015). Ageing in Europe - supporting policies for an inclusive society. Berlin, München, Boston: De Gruyter.
Bowen, P. G., Clay, O. J., Lee, L. T., Vice, J., Ovalle, F., and Crowe, M. (2015). Associations of social support and self-efficacy with quality of life in older adults with diabetes. J. Gerontol. Nurs. 41, 21–29. doi: 10.3928/00989134-20151008-44
Chevance, G., Baretta, D., Heino, M., Perski, O., Olthof, M., Klasnja, P., et al. (2021). Characterizing and predicting person-specific, day-to-day, fluctuations in walking behavior. PLoS One 16:e0251659. doi: 10.1371/journal.pone.0251659
Copay, A. G., Subach, B. R., Glassman, S. D., Polly, D. W. Jr., and Schuler, T. C. (2007). Understanding the minimum clinically important difference: a review of concepts and methods. Spine J. 7, 541–546. doi: 10.1016/j.spinee.2007.01.008
Crosby, R. D., Kolotkin, R. L., and Williams, G. R. (2003). Defining clinically meaningful change in health-related quality of life. J. Clin. Epidemiol. 56, 395–407. doi: 10.1016/S0895-4356(03)00044-1
Devaux, M., and Sassi, F. (2015). Social disparities in hazardous alcohol use: self-report bias may lead to incorrect estimates. Eur. J. Pub. Health 26, 129–134. doi: 10.1093/eurpub/ckv190
Dickerson, F., Wohlheiter, K., Medoff, D., Fang, L., Kreyenbuhl, J., Goldberg, R., et al. (2011). Predictors of quality of life in type 2 diabetes patients with schizophrenia, major mood disorder, and without mental illness. Qual. Life Res. 20, 1419–1425. doi: 10.1007/s11136-011-9888-5
Donald, M., Dower, J., Coll, J. R., Baker, P., Mukandi, B., and Doi, S. A. (2013). Mental health issues decrease diabetes-specific quality of life independent of glycaemic control and complications: findings from Australia's living with diabetes cohort study. Health Qual. Life Outcomes 11:170. doi: 10.1186/1477-7525-11-170
Dunn, J., Ng, S. K., Breitbart, W., Aitken, J., Youl, P., Baade, P. D., et al. (2013). Health-related quality of life and life satisfaction in colorectal cancer survivors: trajectories of adjustment. Health Qual. Life Outcomes 11:46. doi: 10.1186/1477-7525-11-46
Eicher, S., Pryss, R., Baumeister, H., Hövener, C., Knoll, N., and Cohrdes, C. (2021). Quality of life during the COVID-19 pandemic – results of the CORONA HEALTH app study. J. Health Monit. 6, 2–21. doi: 10.25646/8867
Ferrans, C. E., Zerwic, J. J., Wilbur, J. E., and Larson, J. L. (2005). Conceptual model of health-related quality of life. J. Nurs. Scholarsh. 37, 336–342. doi: 10.1111/j.1547-5069.2005.00058.x
Friedman, M. (1937). The use of ranks to avoid the assumption of normality implicit in the analysis of variance. J. Am. Stat. Assoc. 32, 675–701. doi: 10.1080/01621459.1937.10503522
Glasgow, R. E., Ruggiero, L., Eakin, E. G., Dryfoos, J., and Chobanian, L. (1997). Quality of life and associated characteristics in a large national sample of adults with diabetes. Diabetes Care 20, 562–567. doi: 10.2337/diacare.20.4.562
Green, K. E. (1990). Common illnesses and self-care. J. Community Health 15, 329–338. doi: 10.1007/BF01325140
Hanestad, B. R. (1993). Self-reported quality of life and the effect of different clinical and demographic characteristics in people with type 1 diabetes. Diabetes Res. Clin. Pract. 19, 139–149. doi: 10.1016/0168-8227(93)90107-G
Hansel, T. C., Saltzman, L. Y., Melton, P. A., Clark, T. L., and Bordnick, P. S. (2022). COVID-19 behavioral health and quality of life. Sci. Rep. 12:961. doi: 10.1038/s41598-022-05042-z
Hermanns, N., Kulzer, B., Krichbaum, M., Kubiak, T., and Haak, T. (2006). How to screen for depression and emotional problems in patients with diabetes: comparison of screening characteristics of depression questionnaires, measurement of diabetes-specific emotional problems and standard clinical assessment. Diabetologia 49, 469–477. doi: 10.1007/s00125-005-0094-2
Hibbard, J. H., and Pope, C. R. (1983). Gender roles, illness orientation and use of medical services. Soc. Sci. Med. 17, 129–137. doi: 10.1016/0277-9536(83)90246-0
Higgs, P., Hyde, M., Wiggins, R., and Blane, D. (2003). Researching quality of life in early old age: the importance of the sociological dimension. Soc. Policy Adm. 37, 239–252. doi: 10.1111/1467-9515.00336
Ho, H. T., Lin, S. I., Guo, N. W., Yang, Y. C., Lin, M. H., and Wang, C. S. (2022). Executive function predict the quality of life and negative emotion in older adults with diabetes: a longitudinal study. Prim. Care Diabetes 16, 537–542. doi: 10.1016/j.pcd.2022.05.002
Howard, M. C., and Hoffman, M. E. (2018). Variable-centered, person-centered, and person-specific approaches: where theory meets the method. Organ. Res. Methods 21, 846–876. doi: 10.1177/1094428117744021
Hughes, M. E., Waite, L. J., Hawkley, L. C., and Cacioppo, J. T. (2004). A short scale for measuring loneliness in large surveys: results from two population-based studies. Res. Aging 26, 655–672. doi: 10.1177/0164027504268574
Hyde, M., Wiggins, R. D., Higgs, P., and Blane, D. B. (2003). A measure of quality of life in early old age: the theory, development and properties of a needs satisfaction model (CASP-19). Aging Ment. Health 7, 186–194. doi: 10.1080/1360786031000101157
Ij, T., Schaper, N. C., Melai, T., Meijer, K., Willems, P. J., and Savelberg, H. H. (2012). Lower extremity muscle strength is reduced in people with type 2 diabetes, with and without polyneuropathy, and is associated with impaired mobility and reduced quality of life. Diabetes Res. Clin. Pract. 95, 345–351. doi: 10.1016/j.diabres.2011.10.026
Jacobson, A. M., de Groot, M., and Samson, J. A. (1994). The evaluation of two measures of quality of life in patients with type I and type II diabetes. Diabetes Care 17, 267–274. doi: 10.2337/diacare.17.4.267
Jacobson, A. M., de Groot, M., and Samson, J. A. (1997). The effects of psychiatric disorders and symptoms on quality of life in patients with type I and type II diabetes mellitus. Qual. Life Res. 6, 11–20. doi: 10.1023/A:1026487509852
Jaeschke, R., Singer, J., and Guyatt, G. H. (1989). Measurement of health status: ascertaining the minimal clinically important difference. Control. Clin. Trials 10, 407–415. doi: 10.1016/0197-2456(89)90005-6
Jakobsen, J. C., Gluud, C., Wetterslev, J., and Winkel, P. (2017). When and how should multiple imputation be used for handling missing data in randomised clinical trials – a practical guide with flowcharts. BMC Med. Res. Methodol. 17:162. doi: 10.1186/s12874-017-0442-1
Kandrack, M. A., Grant, K. R., and Segall, A. (1991). Gender differences in health related behaviour: some unanswered questions. Soc. Sci. Med. 32, 579–590. doi: 10.1016/0277-9536(91)90293-L
Kim, H., and Kim, K. (2017). Health-related quality-of-life and diabetes self-care activity in elderly patients with diabetes in Korea. J. Community Health 42, 998–1007. doi: 10.1007/s10900-017-0347-2
Le Grande, M. R., Elliott, P. C., Murphy, B. M., Worcester, M. U. C., Higgins, R. O., Ernest, C. S., et al. (2006). Health related quality of life trajectories and predictors following coronary artery bypass surgery. Health Qual. Life Outcomes 4:49. doi: 10.1186/1477-7525-4-49
Leidy, N. K., Revicki, D. A., and Genesté, B. (1999). Recommendations for evaluating the validity of quality of life claims for labeling and promotion. Value Health 2, 113–127. doi: 10.1046/j.1524-4733.1999.02210.x
Lenderink, A. F., Zoer, I., van der Molen, H. F., Spreeuwers, D., Frings-Dresen, M. H., and van Dijk, F. J. (2012). Review on the validity of self-report to assess work-related diseases. Int. Arch. Occup. Environ. Health 85, 229–251. doi: 10.1007/s00420-011-0662-3
Malhi, G. S., and Mann, J. J. (2018). Depression. Lancet 392, 2299–2312. doi: 10.1016/S0140-6736(18)31948-2
Malini, H., Zhahara, S., Lenggogeni, D. P., and Putri, Z. M. (2022). Self-care and quality of LIFE people with type 2 diabetes during the COVID-19: cross-sectional study. J. Diabetes Metab. Disord. 21, 785–790. doi: 10.1007/s40200-022-01055-7
Malter, F., and Börsch-Supan, A. (2013). SHARE wave 4: Innovations & Methodology. Munich: MEA, Max Planck Institute for Social Law and Social Policy.
Malter, F., and Börsch-Supan, A. (2015). SHARE wave 5: Innovations & Methodology. Munich: MEA, Max Planck Institute for Social Law and Social Policy.
Malter, F., and Börsch-Supan, A. (2017). SHARE wave 6: Panel innovations and collecting dried blood spots. Munich Center for the Economics of Aging.
Marneras, C., Messinis, L., Ntoskou, A., Nasios, G., Martzoukou, M., and Papathanasopoulos, P. (2020). Quality of life in type 2 diabetes mellitus patients with neuropsychological deficits. Adv. Exp. Med. Biol. 1196, 41–61. doi: 10.1007/978-3-030-32637-1_5
Matlock, K. A., Broadley, M., Hendrieckx, C., Clowes, M., Sutton, A., Heller, S. R., et al. (2022). Changes in quality of life following hypoglycaemia in adults with type 2 diabetes: a systematic review of longitudinal studies. Diabet. Med. 39:e14706. doi: 10.1111/dme.14706
Norman, G. R., Sloan, J. A., and Wyrwich, K. W. (2003). Interpretation of changes in health-related quality of life: the remarkable universality of half a standard deviation. Med. Care 41, 582–592. doi: 10.1097/01.MLR.0000062554.74615.4C
Norman, G. R., Sloan, J. A., and Wyrwich, K. W. (2004). The truly remarkable universality of half a standard deviation: confirmation through another look. Expert Rev. Pharmacoecon. Outcomes Res. 4, 581–585. doi: 10.1586/14737167.4.5.581
Osoba, D., Rodrigues, G., Myles, J., Zee, B., and Pater, J. (1998). Interpreting the significance of changes in health-related quality-of-life scores. J. Clin. Oncol. 16, 139–144. doi: 10.1200/JCO.1998.16.1.139
Pais-Ribeiro, J. L. (2004). Quality of life is a primary end-point in clinical settings. Clin. Nutr. 23, 121–130. doi: 10.1016/S0261-5614(03)00109-2
Park, S., Park, C. G., and Lee, T. (2022). Health-related quality of life trajectories among older adults with diabetes mellitus: a group-based modeling approach. J. Nurs. Res. 30:e199. doi: 10.1097/jnr.0000000000000480
Pouwer, F., Skinner, T. C., Pibernik-Okanovic, M., Beekman, A. T., Cradock, S., Szabo, S., et al. (2005). Serious diabetes-specific emotional problems and depression in a Croatian-Dutch-English survey from the European depression in diabetes [EDID] research consortium. Diabetes Res. Clin. Pract. 70, 166–173. doi: 10.1016/j.diabres.2005.03.031
Prince, M. J., Reischies, F., Beekman, A. T., Fuhrer, R., Jonker, C., Kivela, S. L., et al. (1999). Development of the EURO–D scale – a European Union initiative to compare symptoms of depression in 14 European centres. Br. J. Psychiatry 174, 330–338. doi: 10.1192/bjp.174.4.330
Rodríguez-Almagro, J., García-Manzanares, Á., Lucendo, A. J., and Hernández-Martínez, A. (2018). Health-related quality of life in diabetes mellitus and its social, demographic and clinical determinants: a nationwide cross-sectional survey. J. Clin. Nurs. 27, 4212–4223. doi: 10.1111/jocn.14624
Rubin, R. R., and Peyrot, M. (1999). Quality of life and diabetes. Diabetes Metab. Res. Rev. 15, 205–218. doi: 10.1002/(SICI)1520-7560(199905/06)15:3<205::AID-DMRR29>3.0.CO;2-O
Russell, D. W. (1996). UCLA loneliness scale (version 3): reliability, validity, and factor structure. J. Pers. Assess. 66, 20–40. doi: 10.1207/s15327752jpa6601_2
Russell, D., Peplau, L. A., and Ferguson, M. L. (1978). Developing a measure of loneliness. J. Pers. Assess. 42, 290–294. doi: 10.1207/s15327752jpa4203_11
Safita, N., Islam, S. M. S., Chow, C. K., Niessen, L., Lechner, A., Holle, R., et al. (2016). The impact of type 2 diabetes on health related quality of life in Bangladesh: results from a matched study comparing treated cases with non-diabetic controls. Health Qual. Life Outcomes 14, 1–9. doi: 10.1186/s12955-016-0530-7
Saleh, F., Ara, F., Mumu, S. J., and Hafez, M. A. (2015). Assessment of health-related quality of life of Bangladeshi patients with type 2 diabetes using the EQ-5D: a cross-sectional study. BMC. Res. Notes 8, 1–8. doi: 10.1186/s13104-015-1453-9
Samiei Siboni, F., Alimoradi, Z., Atashi, V., Alipour, M., and Khatooni, M. (2019). Quality of life in different chronic diseases and its related factors. Int. J. Prev. Med. 10:65. doi: 10.4103/ijpvm.IJPVM_429_17
Schmitz, N., Gariépy, G., Smith, K. J., Malla, A., Boyer, R., Strychar, I., et al. (2013). Trajectories of self-rated health in people with diabetes: associations with functioning in a prospective community sample. PLoS One 8:e83088. doi: 10.1371/journal.pone.0083088
Scholz, U. (2019). It's time to think about time in Health Psychology. Appl. Psychol. Health Well Being 11, 173–186. doi: 10.1111/aphw.12156
Shamshirgaran, S. M., Stephens, C., Alpass, F., and Aminisani, N. (2020). Longitudinal assessment of the health-related quality of life among older people with diabetes: results of a nationwide study in New Zealand. BMC Endocr. Disord. 20:32. doi: 10.1186/s12902-020-0519-4
SHARE. (n.d.) SHARE’s Global Scientific Impact Available at: https://share-eric.eu/impact/scientific-impact-of-share
Sharpe, P. A., Clark, N. M., and Janz, N. K. (1991). Differences in the impact and management of heart disease between older women and men. Women Health 17, 25–43. doi: 10.1300/J013v17n02_02
Shiu, A. T. Y., Choi, K. C., Lee, D. T. F., Yu, D. S. F., and Man, N. W. (2014). Application of a health-related quality of life conceptual model in community-dwelling older Chinese people with diabetes to understand the relationships among clinical and psychological outcomes. J. Diabetes Investig. 5, 677–686. doi: 10.1111/jdi.12198
Solli, O., Stavem, K., and Kristiansen, I. S. (2010). Health-related quality of life in diabetes: the associations of complications with EQ-5D scores. Health Qual. Life Outcomes 8:18. doi: 10.1186/1477-7525-8-18
Speight, J., Holmes-Truscott, E., Hendrieckx, C., Skovlund, S., and Cooke, D. (2020). Assessing the impact of diabetes on quality of life: what have the past 25 years taught us? Diabet. Med. 37, 483–492. doi: 10.1111/dme.14196
Tomás, J. M., Torres, Z., Oliver, A., Enrique, S., and Fernández, I. (2022). Psychometric properties of the EURO-D scale of depressive symptomatology: evidence from SHARE wave 8. J. Affect. Disord. 313, 49–55. doi: 10.1016/j.jad.2022.06.079
VanderWeele, T. J., Hawkley, L. C., and Cacioppo, J. T. (2012). On the reciprocal association between loneliness and subjective well-being. Am. J. Epidemiol. 176, 777–784. doi: 10.1093/aje/kws173
Verbrugge, L. M. (1985). Gender and health: an update on hypotheses and evidence. J. Health Soc. Behav. 26, 156–182. doi: 10.2307/2136750
Wang, R. H., Lin, K. C., Hsu, H. C., Lee, Y. J., and Shin, S. J. (2019). Determinants for quality of life trajectory patterns in patients with type 2 diabetes. Qual. Life Res. 28, 481–490. doi: 10.1007/s11136-018-2013-2
Wiggins, R. D., Netuveli, G., Hyde, M., Higgs, P., and Blane, D. (2008). The evaluation of a self-enumerated scale of quality of life (CASP-19) in the context of research on ageing: a combination of exploratory and confirmatory approaches. Soc. Indic. Res. 89, 61–77. doi: 10.1007/s11205-007-9220-5
Wright, A., Hannon, J., Hegedus, E. J., and Kavchak, A. E. (2012). Clinimetrics corner: a closer look at the minimal clinically important difference (MCID). J. Manual Manip. Ther. 20, 160–166. doi: 10.1179/2042618612Y.0000000001
Yildirim, G., Rashidi, M., Karaman, F., Genç, A., Jafarov, G. Ü., Kiskaç, N., et al. (2023). The relationship between diabetes burden and health-related quality of life in elderly people with diabetes. Prim. Care Diabetes. 17, 595–599. doi: 10.1016/j.pcd.2023.08.007
Yoo, J. Y., Kim, Y. S., Kim, S. S., Lee, H. K., Park, C. G., Oh, E. G., et al. (2016). Factors affecting the trajectory of health-related quality of life in COPD patients. Int. J. Tuberc. Lung Dis. 20, 738–746. doi: 10.5588/ijtld.15.0504
Zakin, E., Abrams, R., and Simpson, D. M. (2019). Diabetic neuropathy. Semin. Neurol. 39, 560–569. doi: 10.1055/s-0039-1688978
Zurita-Cruz, J. N., Manuel-Apolinar, L., Arellano-Flores, M. L., Gutierrez-Gonzalez, A., Najera-Ahumada, A. G., and Cisneros-González, N. (2018). Health and quality of life outcomes impairment of quality of life in type 2 diabetes mellitus: a cross-sectional study. Health Qual. Life Outcomes 16:94. doi: 10.1186/s12955-018-0906-y
Keywords: quality of life, diabetes mellitus, longitudinal, older adults, SHARE
Citation: Mendorf S, Heimrich KG, Mühlhammer HM, Prell T and Schönenberg A (2024) Trajectories of quality of life in people with diabetes mellitus: results from the survey of health, ageing and retirement in Europe. Front. Psychol. 14:1301530. doi: 10.3389/fpsyg.2023.1301530
Edited by:
Yi Nam Suen, The University of Hong Kong, Hong Kong SAR, ChinaReviewed by:
Marco Guicciardi, University of Cagliari, ItalyCopyright © 2024 Mendorf, Heimrich, Mühlhammer, Prell and Schönenberg. This is an open-access article distributed under the terms of the Creative Commons Attribution License (CC BY). The use, distribution or reproduction in other forums is permitted, provided the original author(s) and the copyright owner(s) are credited and that the original publication in this journal is cited, in accordance with accepted academic practice. No use, distribution or reproduction is permitted which does not comply with these terms.
*Correspondence: Sarah Mendorf, c2FyYWgubWVuZG9yZkBtZWQudW5pLWplbmEuZGU=
†These authors have contributed equally to this work and share last authorship
Disclaimer: All claims expressed in this article are solely those of the authors and do not necessarily represent those of their affiliated organizations, or those of the publisher, the editors and the reviewers. Any product that may be evaluated in this article or claim that may be made by its manufacturer is not guaranteed or endorsed by the publisher.
Research integrity at Frontiers
Learn more about the work of our research integrity team to safeguard the quality of each article we publish.