
94% of researchers rate our articles as excellent or good
Learn more about the work of our research integrity team to safeguard the quality of each article we publish.
Find out more
ORIGINAL RESEARCH article
Front. Nutr. , 11 July 2024
Sec. Nutrition and Metabolism
Volume 11 - 2024 | https://doi.org/10.3389/fnut.2024.1380777
This article is part of the Research Topic Nutritional Management of Childhood Obesity and Related Diseases View all 7 articles
 Suvarna Patil1*
 Omkar Dervankar2Pallavi Hardikar-Bhat2
 Charudatta Joglekar2Rohit Bhat2Netaji Patil3Arvind Yadav4
Background: We investigated the associations of micronutrients and lipids with prediabetes, glycemic parameters, and glycemic indices among the adolescent girls of the DERVAN (aDolescent and prEconception health peRspectiVe of Adult Non-communicable diseases) cohort study from rural India.
Methods: We recruited 1,520 adolescent girls aged 16–18 years. We measured glycemic parameters (glucose, insulin and HbA1C), lipids (total cholesterol, high-density lipoprotein [HDL], low-density lipoprotein [LDL], and triglycerides), and micronutrients (vitamin B12, folate, and vitamin D). Prediabetes was defined using American Diabetes Association criteria (fasting glucose ≥100 mg/dL or HbA1C ≥5.7%). Glycemic indices (insulin resistance, insulin sensitivity, and β cell function) were calculated using the homeostasis model. Associations of prediabetes, glycemic parameters and glycemic indices with micronutrients and lipids were analyzed by multiple logistic regressions.
Results: The median age and Body Mass Index (BMI) were 16.6 years and 17.6 kg/m2, respectively. Overall, 58% of girls had a low BMI. Median vitamin B12, folate, and vitamin D concentrations were 249.0 pg/mL, 6.1 ng/mL, and 14.2 ng/mL, respectively. The deficiencies observed were 32.1% for vitamin B12, 11.8% for folate, and 33.0% for vitamin D. Median total cholesterol, LDL, HDL, and triglyceride concentrations were 148.0 mg/dL, 81.5 mg/dL, 50.8 mg/dL, and 61.5 mg/dL, respectively. Elevated total cholesterol, LDL, and triglycerides were observed in 4.8, 4.0, and 3.8%, respectively, while low HDL was observed in 12.8%. Prediabetes was observed in 39.7% of the girls. Among lipids, total cholesterol and LDL were higher in girls with prediabetes (p < 0.01 for both). In a multivariate model containing cholesterol and vitamin B12/folate/vitamin D, prediabetes was associated with high cholesterol. Prediabetes was also associated with high LDL, independent of folate and vitamin D. Poor insulin secretion was high in those with low vitamin B12. Elevated insulin resistance was associated with low HDL. The likelihood of high insulin sensitivity was reduced in those with high triglycerides. The likelihood of poor β cell function was high in those with high LDL. Statistical interactions between micronutrients and lipids for prediabetes and glycemic outcomes were not significant.
Conclusion: There was a substantial deficiency of micronutrients and an absence of dyslipidemia. Our results indicate the need for lipid and micronutrient-based interventions in adolescence to improve glycemic outcomes. Maintaining adequate storage of not only micronutrients but also lipids in adolescent girls is likely to reduce diabetes risk in adulthood.
Non-communicable diseases (NCDs) like diabetes and hypertension are on the rise in India (1). At the same time, the burden of cardiovascular diseases (CVD) is also increasing (2). An unhealthy diet, sedentary lifestyle, and substance abuse (smoking, tobacco chewing, and alcohol consumption) have been identified as major contributing factors. The rise in NCDs is very evident in urban India. Over the last few years, many rural communities have also started witnessing a rise, not only in CVD and coronary heart disease (CHD) (3, 4) but also in NCDs (5, 6). South Asians develop CHD earlier than white Caucasians (7). Lipid abnormalities have been identified as major risk factors for CVD as well as CHD (8, 9). The INTERHEART study (10) identified elevated levels of total cholesterol (CHOL) and low-density lipoprotein cholesterol (LDL) as risk factors for CHD in South Asians. Studies from India have shown increased CHOL levels not only in urban subjects but also in rural subjects (4, 11). According to the Developmental Origins of Health and Disease (DOHaD) hypothesis, seeds of CHD, CVD, and NCDs are sown in early life, covering the intrauterine period as well as early childhood and adolescence (12–14). There are reports from Europe and China on early life undernutrition leading to dyslipidemia (15–17) as well as diabetes (18, 19) in adult life. Though dyslipidemia has been interconnected to the pathophysiology of CVD, it is also a modifiable dominant risk factor if detected early in life (20). Dyslipidemia is uncommon in adolescence, but if it exists then it is expected to intensify the risk of CVD in adulthood (21). Lipid levels in adolescence are known to strongly correlate with those in later life (22, 23). High levels of LDL and low levels of high-density lipoprotein cholesterol (HDL) in adolescence are precursors for atherosclerosis in adulthood (24). There are very few studies regarding undernutrition and dyslipidemia in Indian adolescents (25–27). Between the years 2016–18, the Indian government carried out a Comprehensive National Nutrition Survey (CNNS) of adolescents aged 10–19 years, covering the entire nation with a sample size of >35,000 (28). It found increased lipid burden (21) as well as prediabetes (29). Over the last decade, the role of undernutrition in the development of diabetes has also been under investigation (30–33). Also, there are many reports investigating the role of micronutrients, which are biomarkers of nutrition, in the development of NCDs, especially diabetes (34–36).
BKL Walawalkar Hospital was established in the year 1996 in the village of DERVAN situated in the coastal region of Konkan in the western Indian state of Maharashtra. Since its inception, women’s health has been a prime area of interest. The hospital runs various holistic programs encompassing newborns, children, adolescent girls, newly married girls, and pregnant women. Comprehensive health education is provided, and various investigations are carried out. Counseling, holistic education, and medical treatment, if needed, are provided free of charge. Various hospital- and community-based cross-sectional, as well as observational, studies have demonstrated the presence of undernutrition across the entire life cycle (37–39). In addition, this region has also observed a rising prevalence of NCDs (diabetes and hypertension) (40). We have also demonstrated a high incidence of gestational diabetes among undernourished women in our region (41). This suggests an intergenerational link between an undernourished mother and her offspring.
The DERVAN cohort, a prospective longitudinal study of adolescent girls from the region, was set up in 2019 (42). Its objective was to test the hypothesis that poor physical growth and poor nutrition in adolescent girls increase the risk of NCDs, in particular the risk of diabetes in adulthood and in their offspring. Adolescent girls (16–18 years of age) were recruited between June 2019 and February 2023. The study is expected to continue for the next 20 years with an annual follow-up of adolescent girls.
Our recent report on this cohort showed a high prevalence of prediabetes (PD) among adolescent girls (43). Prediabetes precedes type 2 diabetes (T2D) and is marked by glucose levels above normal but below the diabetic threshold.
Baseline measurements of micronutrients, which are biomarkers of nutrition, as well as those of lipids, provided us the opportunity to investigate the role any of them may have in the development of PD in adolescence and diabetes in later life.
The detailed protocol of the study is already reported (42). In short, 16–18-year-old adolescent girls born in Konkan, staying with parents with no history of any major illness (e.g., heart, kidney, liver disease, cancer, and psychiatric disorders), as well as with no history of mental, intellectual, or physical disability, were recruited. We recruited 1,520 girls at baseline. They were brought to the institute in groups of 5–7. They had an overnight stay at the hostel to ensure their fasting status. The detailed protocol for blood collection has already been reported (44).
Anthropometric measurements of height, weight, waist circumference, and hip circumference were made using a standardized protocol. Body fat was measured using a bioimpedance analyzer (MC-780, TANITA Corporation, Japan).
A fasting blood sample was drawn from adolescent girls and further processed to measure micronutrients, lipids, and glycemic parameters. Blood samples were centrifuged (4°C, 3,000 rpm, 15 min) within 1 h of collection and stored at −80°C for further investigations.
Blood glucose was measured on the ERBA 200, Trans Asia, Mumbai, India. The intra- and inter-batch coefficients of variation (CVs) were < 5%. HbA1c was measured using high performance liquid chromatography (Bio-Rad D10; Bio-Rad Laboratories, Hercules, CA, USA) calibrated against the National Glycosylated Standardization Program with a CV of 2.8%. Fasting insulin was measured on an Abbott Architect i1000SR with a CV of 2.0%. Vitamin B12 (VitB12), folate, and vitamin D (VitD) were measured on the Abbott Architect i1000SR. The intra- and inter-batch CVs were 7.1% for VitB12, 7.7% for folate, and 5.3% for VitD. Total cholesterol, HDL, and triglycerides (TG) were measured on Trans Asia ERBA 200. The intra- and inter-batch CVs were 3.7% for CHOL, 5.2% for HDL, and 4.0% for TG.
Stunting and underweight (low Body Mass Index, BMI) were defined using World Health Organization (WHO) criteria (45) and thinness using International Obesity Task Force (IOTF) criteria (46), respectively. The Friedewald formula was used to calculate LDL (47). Prediabetes was defined using American Diabetic Association (ADA) criteria, i.e., fasting glucose ≥100 mg/dL or HbA1C ≥5.7% (48). Glycemic indices of insulin resistance (HOMa-IR), insulin sensitivity (HOMA-S) and beta cell function (HOMA-β) were estimated using the homeostasis model (49).
Elevated CHOL, LDL, and TG concentrations were defined as ≥ 200 mg/dL, ≥ 130 mg/dL, and ≥ 130 mg/dL, respectively, and low HDL was defined as < 40 mg/dL (28). Deficiency of vitB12 and folate was defined as <203 pg/mL and < 4.0 ng/mL (50), respectively. Deficiency of VitD was defined as <12 ng/mL (28).
Data has been represented by median and 25th–75th quartiles as well as by mean and standard deviation for continuous variables and by percentages for categorical variables. All the micronutrients (VitB12, folate, and VitD), lipids (CHOL, HDL, LDL, and TG), and all the glycemic variables (fasting glucose, fasting insulin, HOMA-IR, HOMA-S, and HOMA-β) were tested for normality. Except for fasting glucose, all the variables were skewed and appropriately transformed for normality. The transformation function to normalize was a natural logarithm for CHOL, HDL, TG, VitB12, HOMA-IR, and HOMA-S. The cube root function was used to normalize LDL and VitD. Folate and fasting insulin were normalized using hyperbolic arcsin functions. HOMA-β was normalized by subtracting the reciprocal of its square root from 1. Prediabetes, fasting insulin, and glycemic indices (HOMA-IR, HOMA-S, and HOMA-β) were treated as glycemic outcomes. Exposures refer to micronutrients (VitB12, VitD, and folate) and lipids (CHOL, LDL, HDL, and TG). Univariate associations between continuous glycemic outcomes and continuous exposures, as well as those between various continuous exposures (micronutrients and lipids), are shown by partial correlation. Comparison of exposures between normoglycemic and prediabetic girls was done by the analysis of variance for continuous and normally distributed exposures, by Mann–Whitney test for those not normally distributed and by chi-square test for those categorical. Prediabetes was a categorical outcome. Other categorical outcomes were defined using the presence of individuals in risk quartiles for each outcome. The risk quartiles for outcomes were the 1st quartile for fasting insulin and HOMA-β representing a group with poor insulin secretion and poor β cell function, respectively, and the 4th quartile for HOMA-IR and HOMA-S representing the most insulin resistant and most insulin-sensitive groups, respectively. We also categorized the exposures (micronutrients as well as lipids) by creating the quartiles of each exposure. The 4th quartile was used as a reference for VitB12, folate, and VitD, which represent high vitamin concentrations. Except for HDL, the 1st quartile was used as a reference for lipids (CHOL, LDL, and TG), representing low lipid levels. For HDL, the 4th quartile was used as a reference, indicating high or better HDL. Univariate as well as multivariate associations of the categorical outcomes with the categorical exposures were analyzed using logistic regression. Odds ratios (ORs) relative to the reference quartile for each exposure and 95% confidence intervals (CIs) for the outcomes were calculated. We also tested the interaction of various micronutrient and lipid exposures for various outcomes by including relevant product terms as appropriate. BMI representing the anthropometric markers of undernutrition and age of adolescent girls, was divided into quartiles and used as covariates. In the case of BMI, the 4th quartile was further divided into two groups: non-obese and overweight/obese, thus creating five groups. The overweight/obese group was treated as the reference. We also carried out the analysis for prediabetes using micronutrients and lipids as scale variables. Two-tailed significance was calculated at a 5% level. Analysis was performed using Statistical Package for the Social Sciences (SPSS) 25.0 and STATA 11.0 (STATA, College Station, TX, USA).
The study was approved by the Institute Ethics Committee of BKL Walawalkar Rural Medical College and Hospital. The committee is registered with the Department of Health Research (DHR), Government of India, with registration number EC/NEW/INST/2023/MH/0361. Appropriate written informed consent was obtained from those who were 18 years old at the time of the recruitment. For those below 18 years of age, written informed consent was obtained from the parents of the adolescent girl, and written informed ascent was obtained from the adolescent girl.
We recruited 1,520 adolescent girls in the cohort. Body composition measurements were done on 1,400 girls. Of this, five girls were diagnosed with diabetes. Out of the remaining normoglycemic (n = 1,395) cases, lipid and micronutrient measurements were available on 1,387 girls. Our final sample number for the data analysis is 1,387.
Anthropometry, body composition, micronutrients, lipids, and glycemia (Table 1).
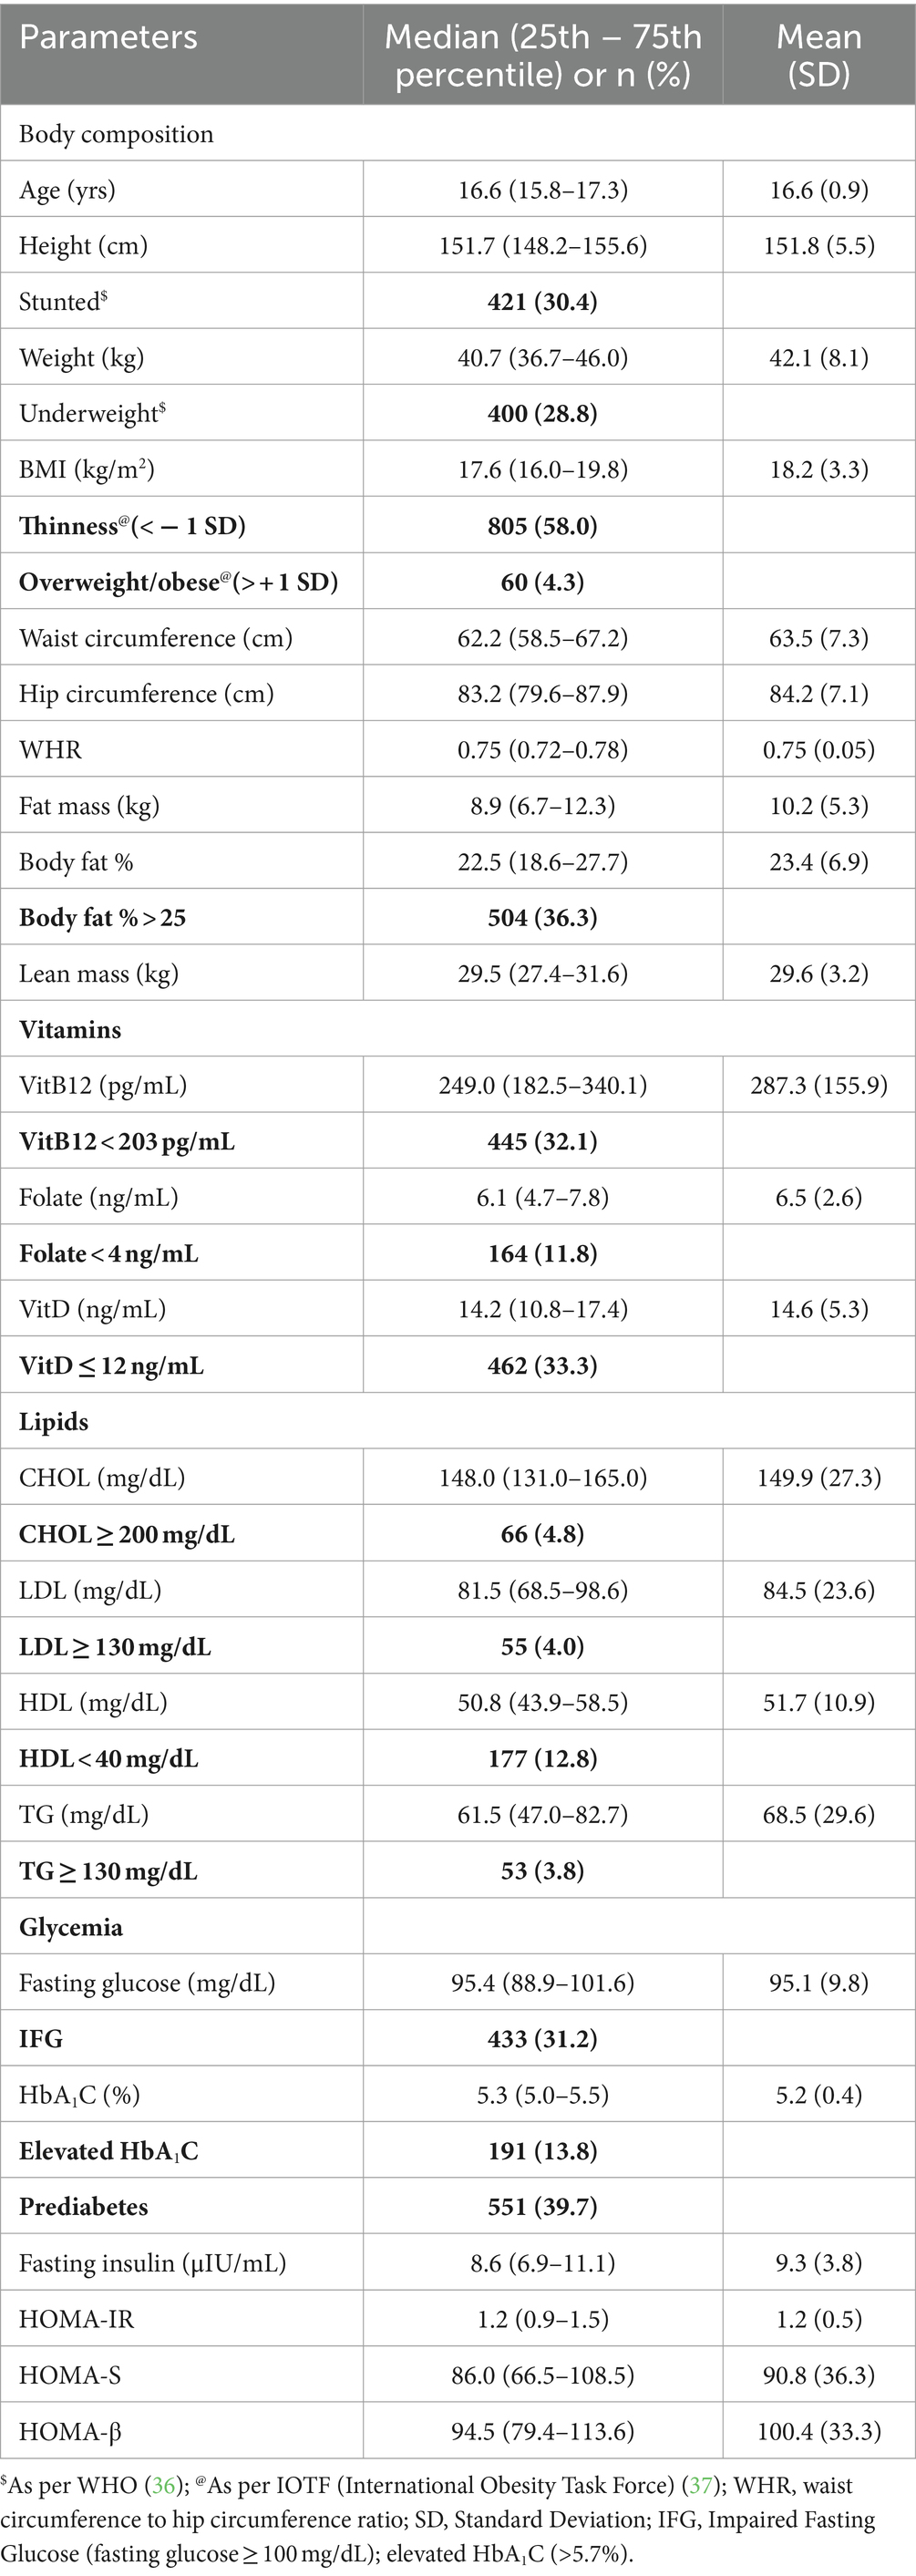
Table 1. Anthropometry, body composition, micronutrients, lipids, and glycemia in adolescent girls (n = 1,387).
The median age of the subjects was 16.6 years. Median height, weight, BMI, waist circumference, hip circumference, and waist circumference to hip circumference ratio were 151.7 cm, 40.7 kg, 17.6 kg/m2, 62.2 cm, 83.2 cm, and 0.75, respectively. Using the WHO standard, 30.4% of girls were found to be stunted, and 28.8% were underweight. Using the IOTF standard, 58% were thin. Median body fat% was 22.5 and 36.3% girls had body fat% > 25. Median concentrations of VitB12, folate, and VitD were 249.0 pg/mL, 6.1 ng/mL, and 14.2 ng/mL, respectively. Deficiencies of VitB12, folate, and VitD were observed in 32.1, 11.8, and 33.3%, respectively. Median levels of CHOL, LDL, HDL, and TG were 148.0 mg/dL, 81.5 mg/dL, 50.8 mg/dL, and 61.5 mg/dL, respectively. Elevated levels were observed in 4.8% of CHOL, 4.0% of LDL, and 3.8% of TG. Low HDL was observed in 12.8%. Median concentrations of fasting glucose and fasting insulin were 95.4 mg/dL and 8.6 μIU/ml, respectively. Median values for glycemic indices were 1.2, 86.0, and 94.5 for HOMA-IR, HOMA-S, and HOMA-β, respectively. Prediabetes was observed in 39.7% of girls.
Micronutrients, lipids, and prediabetes (Table 2).
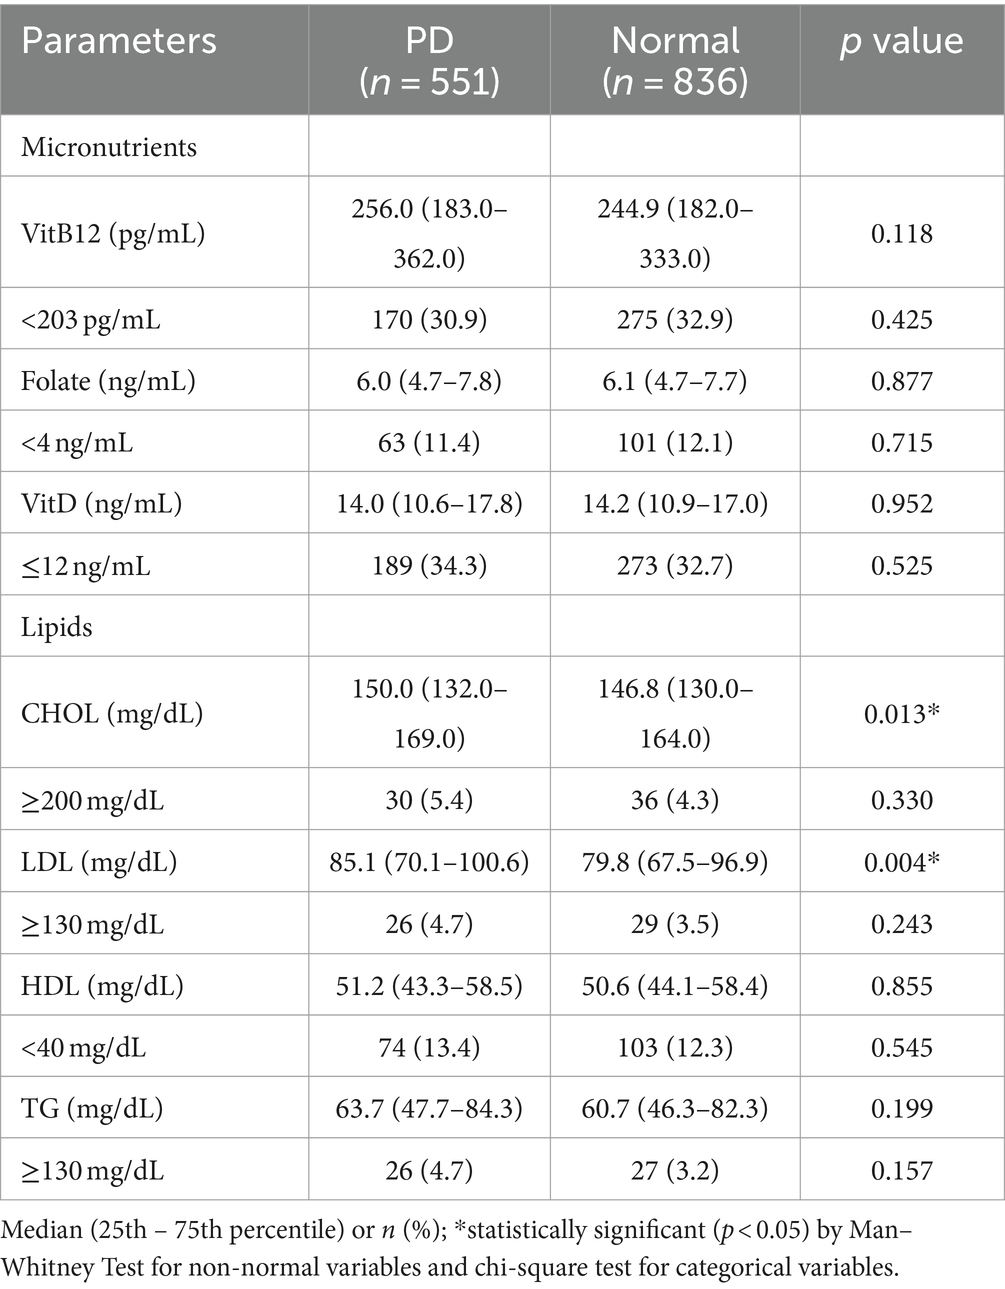
Table 2. Micronutrients and lipids between girls with PD and normoglycemia (n = 1,387).
We compared micronutrient concentrations and lipids between prediabetic and normoglycemic girls. Among lipids, CHOL and LDL were higher in girls with PD (p < 0.01) for CHOL and (p < 0.001) for LDL.
Univariate and continuous associations of micronutrients and lipids with glycemic outcomes and BMI (Supplementary Table 1).
Folate was inversely associated with fasting insulin, HOMA-IR (p < 0.05 for both), and HOMA-β (p < 0.001). Total cholesterol and LDL were positively associated with fasting glucose (p < 0.05 for both). Total cholesterol, LDL, and TG were positively associated with fasting insulin and HOMA-IR and inversely with HOMA-S (p < 0.01 for all). HDL was inversely associated with fasting insulin and HOMA-IR and positively with HOMA-S (p < 0.001) for all. Triglyceride was positively associated with HOMA-β and HDL was inversely associated (p < 0.001 for both). All three micronutrients and HDL were inversely associated with BMI, and CHOL, LDL and TG were positively associated.
Univariate and continuous associations between micronutrients and lipids (Supplementary Table 2).
Vitamin B12 was positively associated with CHOL, LDL, and HDL but inversely with TG (p < 0.001 for all). Folate was inversely associated with LDL (p < 0.001) and positively with HDL (p < 0.05). Vitamin D was inversely associated with both CHOL and LDL (p < 0.01 for both).
Univariate analysis of micronutrients, lipids, BMI, and age as predictors of glycemic outcomes (Table 3).
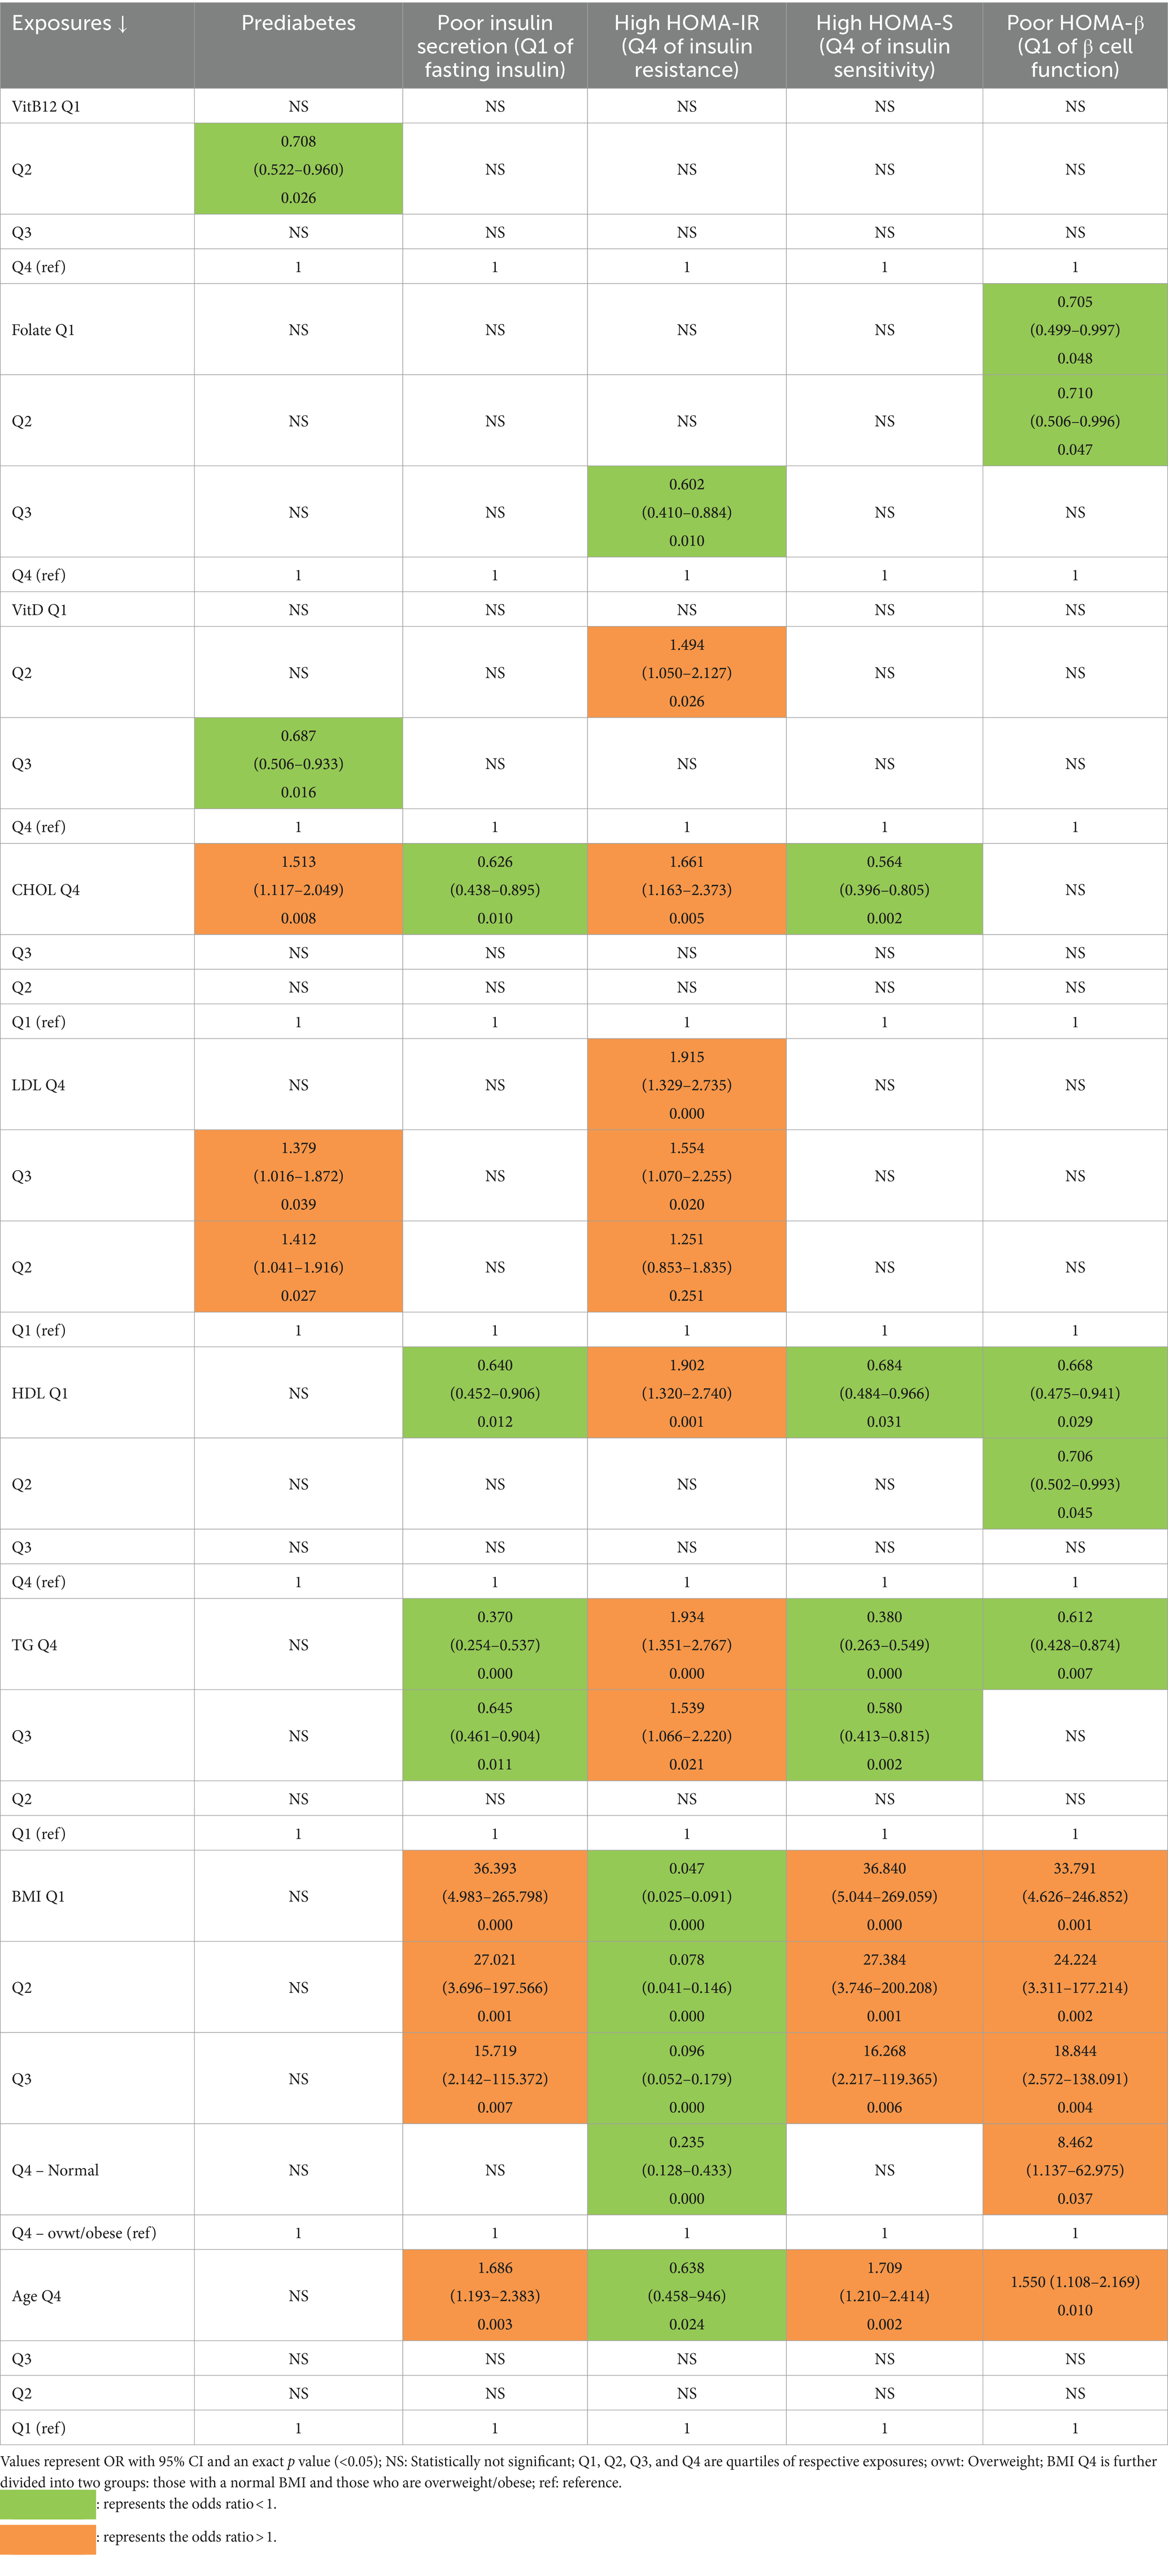
Table 3. Association of PD and other glycemic outcomes with micronutrients, lipids, BMI, and age (univariate logistic regressions).
We carried out univariate logistic regressions using quartiles of each micronutrient and each lipid parameter, as well as 5 groups of increasing BMI and quartiles of age with PD and risk quartiles of fasting insulin and glycemic indices as outcomes.
Prediabetes: The OR for the 2nd quartile of VitB12 and the 3rd quartile of VitD were significantly reduced (<1) to the upper quartile, representing relatively high levels of respective vitamins. Among lipids, PD was predicted by high CHOL (4th quartile) and high LDL (2nd and 3rd quartiles) to the 1st quartile, representing low levels of respective lipids. There was no association of PD with HDL and TG.
Poor insulin secretion (1st quartile of fasting insulin): Having poor insulin secretion was associated inversely with high CHOL (4th quartile), low HDL (1st quartile), and high TG (3rd and 4th quartiles), with the 1st quartile representing low levels of CHOL, TG, and the 4th quartile representing high HDL. The OR for poor insulin secretion increased with decreasing BMI. Those who were the oldest (4th quartile) had a higher likelihood of poor insulin secretion than those who were the youngest.
Most insulin resistant (4th quartile of HOMA-IR): Among micronutrients, being most insulin resistant was inversely associated with folate (3rd quartile) and directly with VitD (2nd quartile). Among lipids, being most insulin resistant was associated with high CHOL (4th quartile), high LDL (2nd, 3rd, and 4th quartiles) low HDL (1st quartile), and high TG (3rd and 4th quartiles). The OR for being most insulin resistant decreased with decreasing BMI. Those who were oldest (4th quartile) had less likelihood of having most insulin resistance than those who were younger.
Most insulin sensitive (4th Quartile of HOMA-S): Protective associations were observed for high CHOL (4th quartile), low HDL (1st quartile), and high TG (3rd and 4th quartiles). The decreasing BMI increased the OR for being highly insulin sensitive. Those who were the oldest (4th quartile) had a high likelihood of being most insulin sensitive.
Poor β cell function (1st Quartile of HOMA-β): Poor β cell function was associated protectively with low folate (2nd and 1st quartile), low HDL (2nd and 1st quartile), and high TG (4th quartile). The OR for poor β cell function increased with decreasing BMI. Those who were the oldest (4th quartile) had a high likelihood of poor β cell function.
Multivariate analysis of micronutrients and lipids as predictors of glycemic outcomes.
We ran logistic regression models for each glycaemic outcome, containing a single micronutrient (VitB12/folate/VitD) and a single lipid (CHOL/LDL/HDL/TG) as independent variables and BMI and age as covariates. Thus, for each of the 3 micronutrients, 4 lipids, and 5 glycaemic outcomes, we ran 4 models for each of the 5 glycaemic outcomes. We also included relevant micronutrient and lipid interaction terms in the analysis.
Vitamin B12 and lipids as predictors of PD (Table 4).
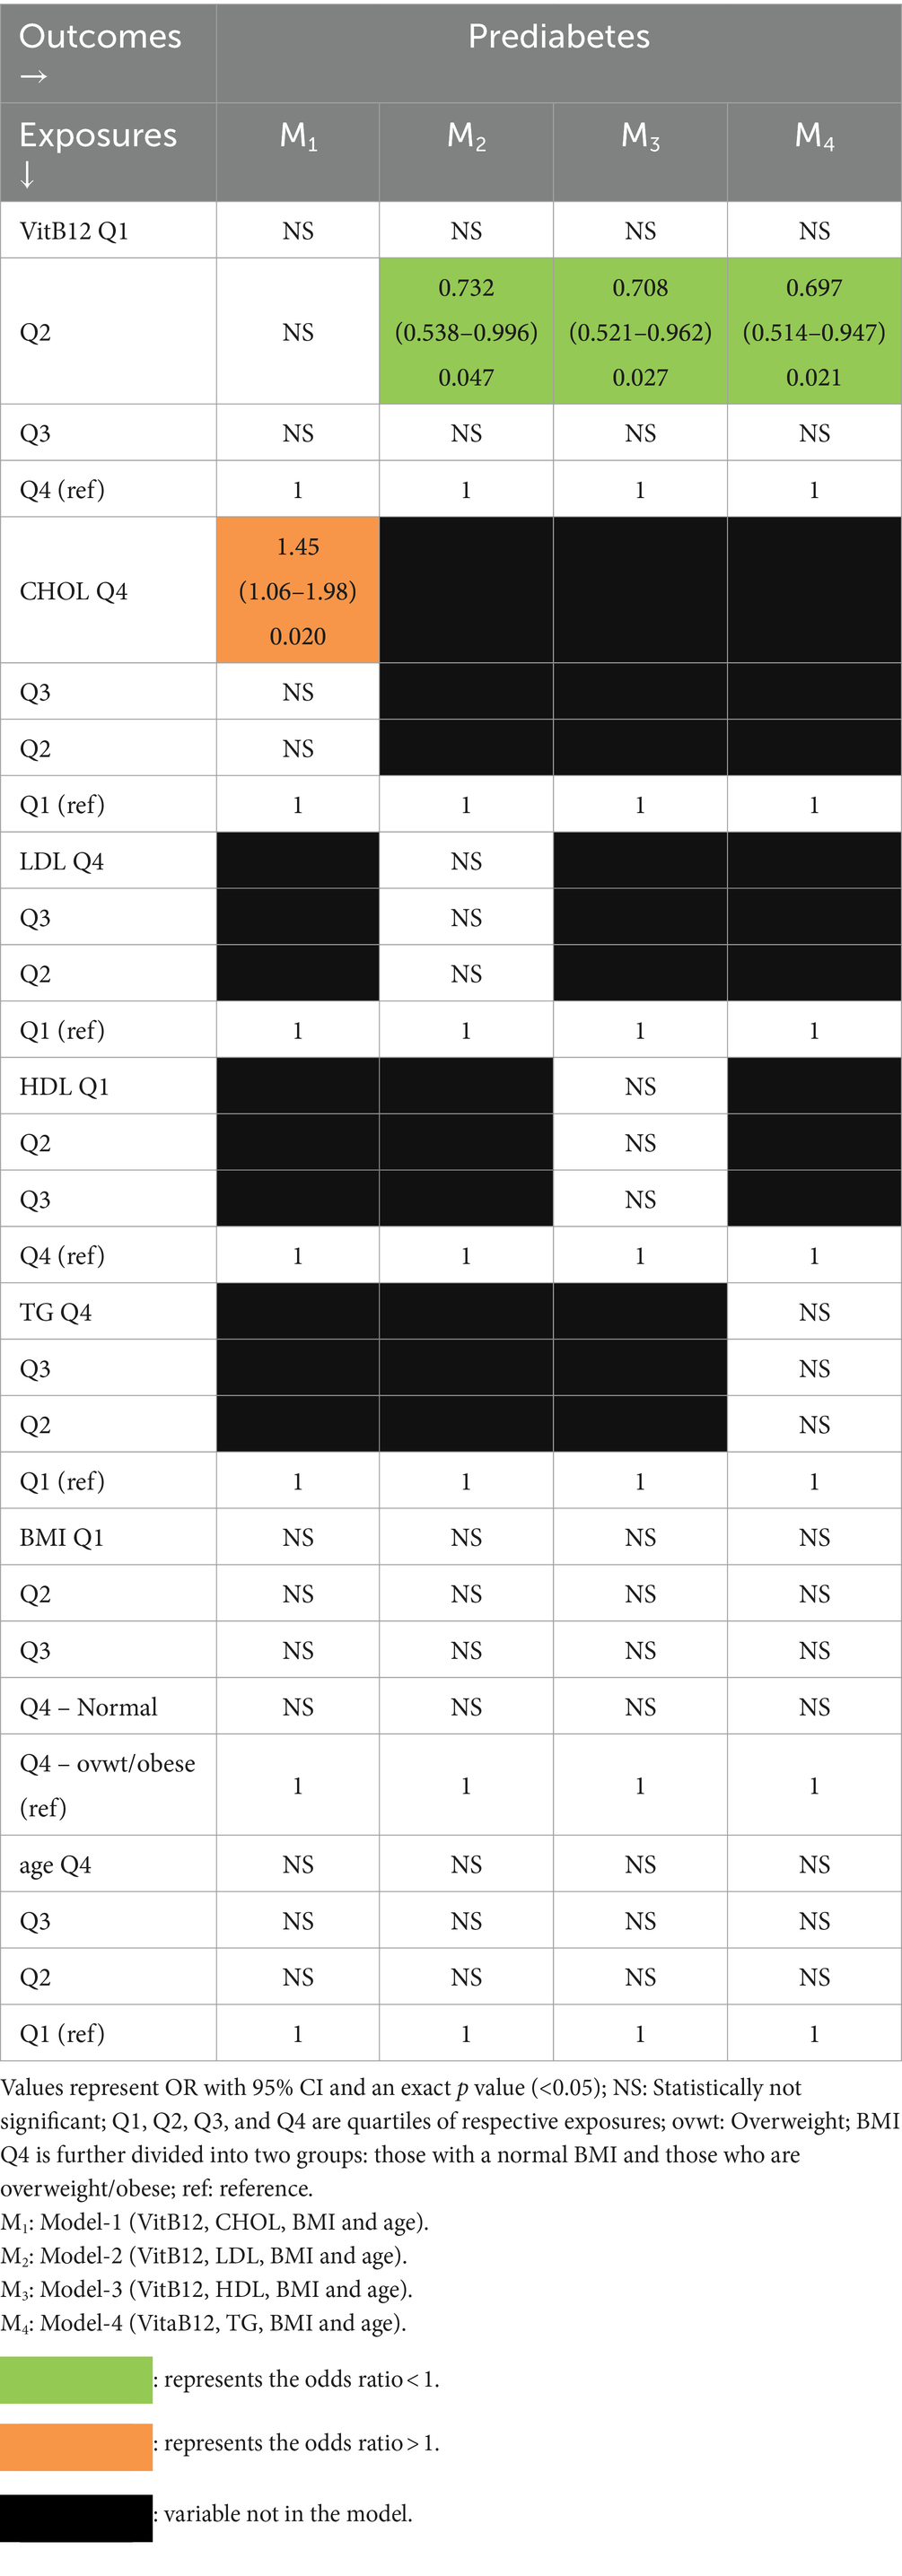
Table 4. Multivariate association of PD with vitamin B12 and lipids with BMI and age as covariates (logistic regression).
In Model-M1 containing CHOL, PD was independently associated only with relatively high CHOL (4th quartile). In the remaining 3 models (M2, M3, and M4) containing each of the remaining lipids, PD was associated with only VitB12 (2nd quartile) and that too with protective effects (ORs < 1).
Folate and lipids as predictors of PD (Table 5).
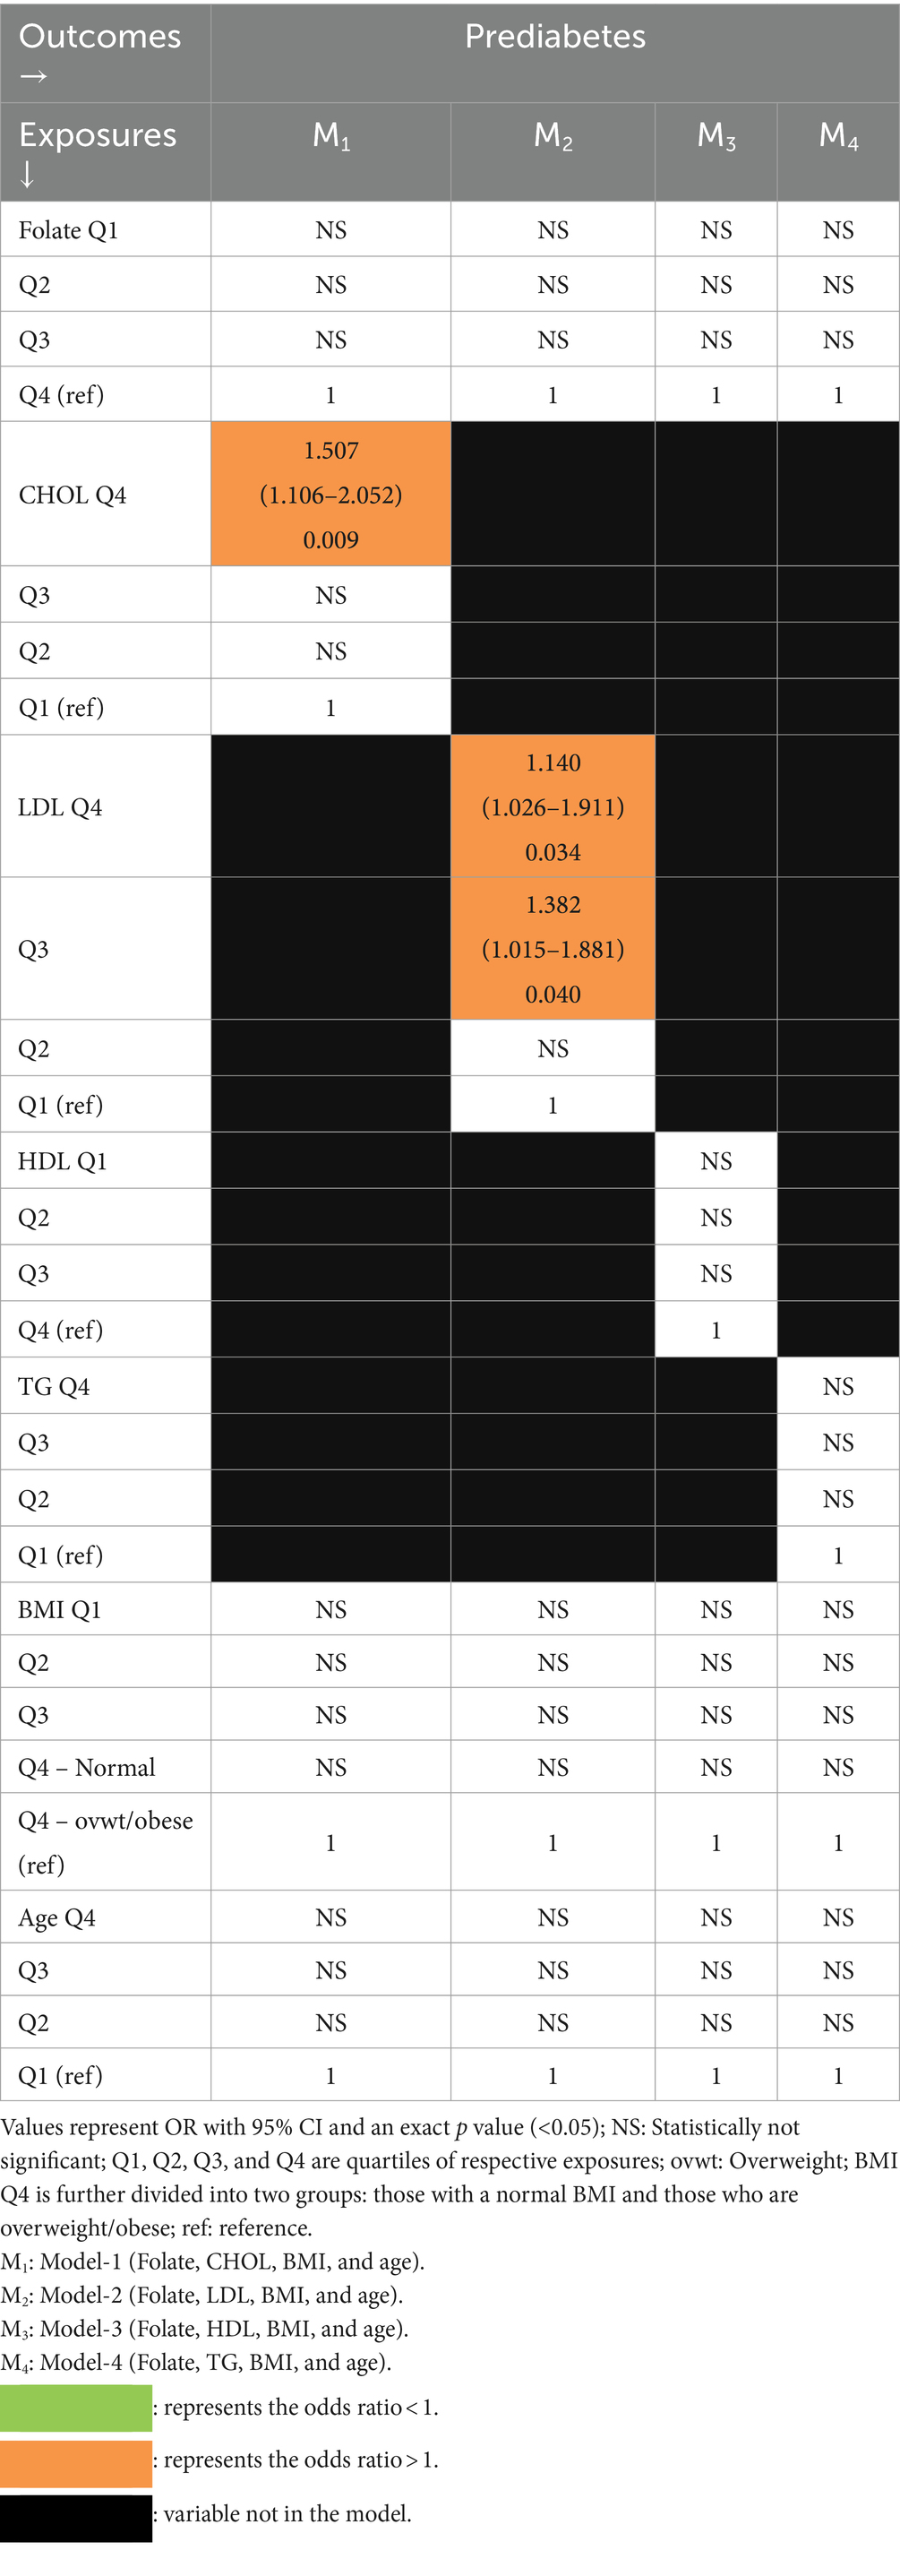
Table 5. Multivariate association of PD with folate and lipids with BMI and age as covariates (logistic regression).
In Model-1 containing CHOL, PD was independently associated only with relatively high cholesterol (4th quartile). In the remaining models, there was an independent association of PD only with relatively high LDL (3rd and 4th quartiles) in Model-2.
Vitamin D and lipids as predictors of PD (Table 6).
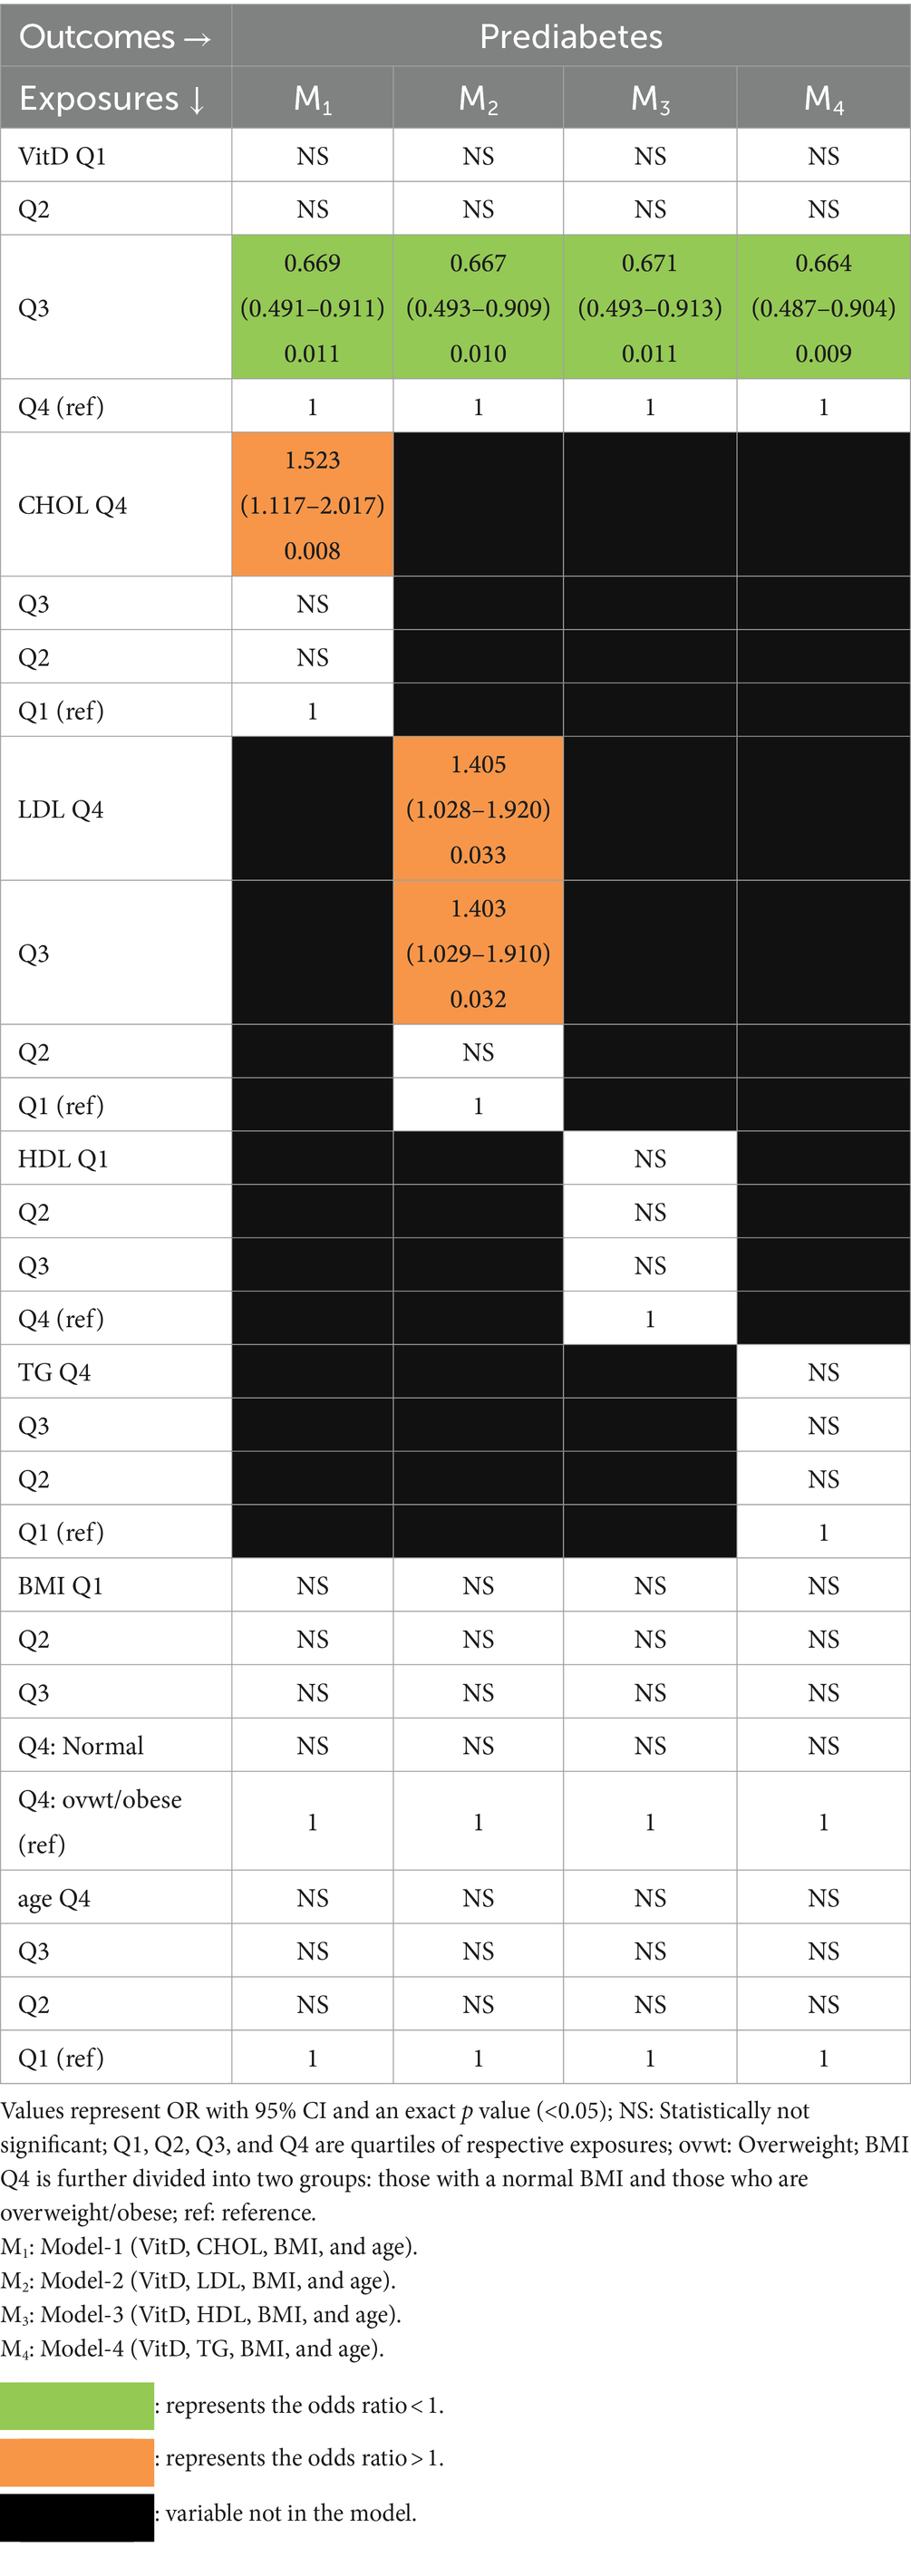
Table 6. Multivariate association of PD with vitamin D and lipids with BMI and age as covariates (logistic regression).
In all 4 models, PD was independently associated with VitD (3rd quartile) and protective OR. PD was also independently associated with high cholesterol (4th quartile) in Model-1 and with high LDL (3rd and 4th quartiles) in Model-2.
We repeated the analysis described in Tables 4–6 for the remaining glycemic outcomes, i.e., poor insulin secretion, being most insulin resistant, being most insulin sensitive, and having poor β cell function. We have summarized these in Supplementary Tables 3–5 containing vitamin B12, folate, and vitamin D, respectively.
Vitamin B12 and lipids as predictors of poor insulin secretion (Supplementary Table 3).
Having poor insulin secretion was independently associated with poor VitB12 status (1st quartile) in all 4 models. The ORs were significant and >1 in all. Additionally, in Model-4 containing TG, there was also an independent association with elevated TG (4th quartile), but the effect was protective as OR was significant and <1.
Folate and lipids as predictors of poor insulin secretion (Supplementary Table 4).
Only in Model-4 containing TG was there an independent association with elevated TG (4th quartile), but the effect was protective as OR was significant and <1.
Vitamin D and lipids as predictors of poor insulin secretion (Supplementary Table 5).
Only in Model-4 containing TG was there an independent association with elevated TG (4th quartile), but the effect was protective as OR was significant and <1.
Vitamin B12 and lipids as predictors of being most insulin resistant (Supplementary Table 3).
The only association observed was in Model-3 with low HDL (1st quartile), and the OR was significant and >1.
Folate and lipids as predictors of being most insulin resistant (Supplementary Table 4).
There was a protective effect of low folate (3rd quartile) in all 4 models, as ORs were significant and <1. Additionally, there was a positive effect of low HDL (1st quartile) in Model-3.
Vitamin D and lipids as predictors of being most insulin resistant (Supplementary Table 5).
The only significant positive effect observed was that of low HDL (1st quartile) in Model-3.
Vitamin B12 and lipids as predictors of being most insulin sensitive (Supplementary Table 3).
Only in Model-4, a significant but protective effect of high TG (4th quartile) was observed.
Folate and lipids as predictors of being most insulin sensitive (Supplementary Table 4).
The protective effect of high CHOL (4th quartile) in Model-1 was observed. A significant but protective effect of high TG (4th quartile) was also observed in Model-4.
Vitamin D and lipids as predictors of being most insulin sensitive (Supplementary Table 5).
The protective effect of high CHOL (4th quartile) and high TG (4th quartile) was observed in Model-1 and Model-4, respectively.
Vitamin B12 and lipids as predictors of poor β cell function (Supplementary Table 3).
There was a positive effect of high LDL (4th quartile) in Model-2 and a protective effect of low HDL (2nd quartile) in Model-3.
Folate and lipids as predictors of poor β cell function (Supplementary Table 4).
Folate (2nd quartile) had a protective effect on poor β cell function in all models. There was a positive effect of high LDL (4th quartile) in Model-2 and a protective effect of low HDL (2nd quartile) in Model-3.
Vitamin D and lipids as predictors of poor β cell in Model-3 function (Supplementary Table 5).
The likelihood of poor β cell function was not associated with any of the lipids.
Interactions of micronutrients and lipids with prediabetes, poor insulin secretion, and glycemic indices.
None of the interactions between each micronutrient and each lipid were found to be statistically significant for PD and other glycemic outcomes.
We also carried out multivariate logistic regression of PD, including independent variables such as lipids and micronutrients as scale variables (Supplementary Tables 6–8) without using quartiles. The results were very similar. Prediabetes was associated with CHOL and LDL.
We have reported micronutrients (VitB12, folate, and VitD) and lipid levels (CHOL, LDL, HDL, and TG) in 16–18 year-old adolescent girls of the DERVAN cohort. Among micronutrients, more than 1/3rd of girls were deficient in VitB12 and VitD. This was very similar to those reported in a national survey of adolescents (28). Folate deficiency was very low. Elevated CHOL, LDL, and TG were observed in <5%, but low HDL was observed in 12.8%. This was despite household chores and walking long distances to school (51). The prevalence of PD was close to 40%. Abnormality in lipids using the conventional cutoffs was itself very low. Prediabetes was not associated with micronutrient deficiencies when we used conventional cutoffs. Unlike other reports from India (21), the proportion of lipid abnormalities between prediabetics and normal was similar and very low. Cutoffs for micronutrient deficiencies are also facing challenges in Indian settings (52). Hence, we decided to use a quartile approach for both sets of exposures to test the associations of glycemic outcomes with micronutrients as well as lipid exposures. Other than PD, there are no specific cutoffs for insulin and various glycemic indices; hence, we also categorized all the outcomes other than PD as belonging to either the lowest or highest quartiles.
In the multivariate analysis using a quartile approach, relatively low VitB12 and VitD status were protective against PD. Among lipids, the likelihood of PD was high in those with relatively high CHOL, and it was much stronger in those with relatively high LDL. The likelihood of poor insulin secretion increased in those with relatively low VitB12, while it decreased in those with relatively high TG. Relatively low folate status was protective against high insulin resistance, while a high likelihood of insulin resistance was observed in those with relatively low HDL. Those with relatively high TG were less likely to have high insulin sensitivity, and those with relatively high LDL and low HDL were more likely to have poor β cell function. It is noteworthy that despite the very low prevalence of those with abnormal CHOL and LDL, there was still a graded association of PD with those having relatively high CHOL and LDL, independent of all three micronutrients.
Interactions between micronutrients and lipids have been reported for PD in another report from India on school-going young children of 5–9 years of age (53). It found significant interaction probabilities for PD among those with VitB12 deficiency with high CHOL, Sufficient VitD with high CHOL, and high VitD with high LDL. We used the odds ratio approach and found high likelihood of PD among those with relatively high CHOL, and relatively low VitD with high CHOL. The interesting thing in our data was the absence of statistical interactions between micronutrients and lipids for various glycemic outcomes. Beyond PD, the measurement of insulin and glycemic indices provided the opportunity to explore their associations with micronutrients and lipids. We could not find any reports that investigated such associations and interactions.
There are few studies reporting data on micronutrients, lipids, prediabetes, and diabetes in adolescent populations. A study from Italy (54) found an association between poor vitamin B12 and high insulin resistance. A study from Saudi Arabia (55) found a significant association of vitamin D deficiency with T2D. The prevalence of overweight/obesity in these studies was 34 and 68%, respectively. The proportion of those overweight/obese in our study was miniscule (only 4.3%). Both studies have measured lipids, but none of them have reported the associations of diabetes or prediabetes with micronutrients and lipids together. Unlike our study, these studies have measured only a single micronutrient.
The prevalence of various lipid abnormalities that contribute to dyslipidemia was very low in our cohort. Lipids in non-pregnant adult populations always receive much attention due to their known associations with CVD as well as NCDs, but they are also known to play an important role as fuels in pregnancy (56). Our cohort consists of adolescent girls. Lipid levels in adolescence are known to track with those in later life (22, 23). Thus, our girls are likely to begin the pregnancy with inadequate levels of fuel/lipids. In 1980, Freinkel introduced the concept of ‘Fuel-mediated teratogenesis,’ (56) where the mixture of maternal nutrients/fuels (glucose and lipids) affects not only fetal growth but also the risk of future obesity and diabetes. Maternal lipids (CHOL and TG) are essential for fetal development (57, 58) and their low levels during pregnancy have been associated with delayed prenatal growth (59, 60). Low birthweight and stunting continue to be high in our region (61, 62). Studies from the US (63) and Europe (64–66) have shown associations between maternal lipids in pregnancy and birth weight. A study among undernourished rural pregnant Indian women has also shown a strong association between maternal glucose and lipids and fetal growth (67). The high prevalence of PD in our cohort (43) has already put our girls at risk of developing gestational diabetes. Thus, our adolescent girls are likely to enter pregnancy with risks of hyperglycemia, micronutrient deficiencies, and poor fuel storage. Prediabetes in our girls is driven by poor insulin secretion and poor β cell function. Based on our findings, improving vitB12, maintaining adequate TG, and reducing LDL in adolescence may help improve insulin secretion as well as β-cell function, leading to a reduction in PD. This indicates the need for lipid and micronutrient-based interventions in adolescents to improve glycemic outcomes. Maintaining adequate storage of micronutrients as well as fuels preconceptionally could reduce NCD risks. However, caution is warranted, as excess lipids may contribute to future obesity and diabetes-related insulin resistance.
The strengths of our study are the large sample size and measurements of detailed glycemic parameters beyond glucose. We measured micronutrients as well as lipids in a region known for widespread undernutrition across the life course. The prevalence of overweight/obesity in our sample was extremely low. There are some limitations, too. Our cohort consists only of girls. We did not measure other vitamins, like B2 and B6.
There are many lipid-based nutrient supplementation (LNS) studies in young malnourished children (68–70), but LNS studies among undernourished women with a life-course approach spanning from adolescence to pregnancy and adulthood are needed to assess their impact on diabetes risks in individuals as well as in the next generation.
To summarize, our report on adolescent girls has attempted to shed some light on the possible role of not only micronutrients but also lipids in undernourished adolescent girls on the development of NCDs in adulthood as well as in the next generation.
In short, we have shown the existence of micronutrient deficiencies and poor lipid stores among rural Indian adolescent girls. We have also demonstrated their link to prediabetes. A link between micronutrient undernutrition in early life and diabetes in adulthood is well studied. Lipids play an important role as fuel in pregnancy. The persistence of poor lipid stores in adolescent girls, together with prediabetes, is likely to result in poor birth outcomes, like low birth weight. Lipid-based supplementation in adolescence together, with micronutrients, may offer a window of opportunity to reduce the subsequent risks of poor birth outcomes and diabetes in later life.
The datasets presented in this article are not readily available because the datasets generated are available from the corresponding author on reasonable request with necessary permissions from Institutional Ethics Committee and Government of India HMSC. Requests to access the datasets should be directed to SP, ZHIuc3V2cm5hbnBhdGlsQGdtYWlsLmNvbQ==. Institutional Ethics Committee and Government.
The studies involving humans were approved by Institute Ethics Committee of BKL Walawalkar Rural Medical College and Hospital. Registration number is (EC/NEW/INST/2023/MH/0361). The studies were conducted in accordance with the local legislation and institutional requirements. Written informed consent for participation in this study was provided by the participants’ legal guardians/next of kin.
SP: Conceptualization, Funding acquisition, Supervision, Writing – original draft, Project administration, Writing – review & editing. OD: Data curation, Formal analysis, Software, Writing – original draft. PH-B: Conceptualization, Investigation, Methodology, Validation, Visualization, Writing – original draft. CJ: Conceptualization, Formal analysis, Methodology, Visualization, Writing – original draft, Writing – review & editing. RB: Validation, Writing – review & editing. NP: Funding acquisition, Resources, Writing – review & editing. AY: Project administration, Investigation, Methodology, Writing – review & editing.
The author(s) declare that financial support was received for the research, authorship, and/or publication of this article. This study was funded by the Rajiv Gandhi Science and Technology Commission, Government of Maharashtra, India. The funding reference is available at this link: https://rgstc.maharashtra.gov.in/sanctioned-projects.
We thank the adolescent girls for their participation. We also thank the parents of the adolescent girls for giving us consent to enroll their adolescent children. We also thank Mr. Tushar Humbare for his immense help in drafting the tables.
The authors declare that the research was conducted in the absence of any commercial or financial relationships that could be construed as a potential conflict of interest.
All claims expressed in this article are solely those of the authors and do not necessarily represent those of their affiliated organizations, or those of the publisher, the editors and the reviewers. Any product that may be evaluated in this article, or claim that may be made by its manufacturer, is not guaranteed or endorsed by the publisher.
The Supplementary material for this article can be found online at: https://www.frontiersin.org/articles/10.3389/fnut.2024.1380777/full#supplementary-material
1. Rashmi, R, and Mohanty, SK. Examining chronic disease onset across varying age groups of Indian adults using competing risk analysis. Sci Rep. (2023) 13:5848. doi: 10.1038/s41598-023-32861-5
2. India State-Level Disease Burden Initiative CVD Collaborators. The changing patterns of cardiovascular diseases and their risk factors in the states of India: the global burden of disease study 1990-2016. Lancet Glob Health. (2018) 6:e1339–51. doi: 10.1016/S2214-109X(18)30407-8
3. Yusuf, S, Rangarajan, S, Teo, K, Islam, S, Li, W, Liu, L, et al. PURE investigators. Cardiovascular risk and events in 17 low-, middle-, and high-income countries. N Engl J Med. (2014) 371:818–27. doi: 10.1056/NEJMoa1311890
4. Joshi, SR, Anjana, RM, Deepa, M, Pradeepa, R, Bhansali, A, Dhandania, VK, et al. Prevalence of dyslipidemia in urban and rural India: the ICMR-INDIAB study. PLoS One. (2014) 9:e96808. doi: 10.1371/journal.pone.0096808
5. Swaminathan, K, Veerasekar, G, Kuppusamy, S, Sundaresan, M, Velmurugan, G, and Palaniswami, NG. Noncommunicable disease in rural India: are we seriously underestimating the risk? The Nallampatti noncommunicable disease study. Indian J Endocrinol Metab. (2017) 21:90. doi: 10.4103/2230-8210.196001
6. Rai, RK, Barik, A, Mazumdar, S, Chatterjee, K, Kalkonde, YV, Mathur, P, et al. Non-communicable diseases are the leading cause of mortality in rural Birbhum, West Bengal, India: a sex-stratified analysis of verbal autopsies from a prospective cohort, 2012-2017. BMJ Open. (2020) 10:e036578. doi: 10.1136/bmjopen-2019-036578
7. Reddy, KS, and Yusuf, S. Emerging epidemic of cardiovascular disease in developing countries. Circulation. (1998) 97:596–601. doi: 10.1161/01.cir.97.6.596
8. Al-Zahrani, J, Shubair, MM, Al-Ghamdi, S, Alrasheed, AA, Alduraywish, AA, Alreshidi, FS, et al. The prevalence of hypercholesterolemia and associated risk factors in Al-Kharj population, Saudi Arabia: a cross-sectional survey. BMC Cardiovasc Disord. (2021) 21:22. doi: 10.1186/s12872-020-01825-2
9. Castelli, WP, Anderson, K, Wilson, PW, and Levy, D. Lipids and risk of coronary heart disease. The Framingham study. Ann Epidemiol. (1992) 2:23–8. doi: 10.1016/1047-2797(92)90033-m
10. Karthikeyan, G, Teo, KK, Islam, S, McQueen, MJ, Pais, P, Wang, X, et al. Lipid profile, plasma apolipoproteins, and risk of a first myocardial infarction among Asians: an analysis from the INTERHEART study. J Am Coll Cardiol. (2009) 53:244–53. doi: 10.1016/j.jacc.2008.09.041
11. Gupta, R, Rao, RS, Misra, A, and Sharma, SK. Recent trends in epidemiology of dyslipidemias in India. Indian Heart J. (2017) 69:382–92. doi: 10.1016/j.ihj.2017.02.020
12. Barker, DJ, Gluckman, PD, Godfrey, KM, Harding, JE, Owens, JA, and Robinson, JS. Fetal nutrition and cardiovascular disease in adult life. Lancet. (1993) 341:938–41. doi: 10.1016/0140-6736(93)91224-a
13. Eriksson, JG, Forsén, T, Tuomilehto, J, Osmond, C, and Barker, DJ. Early growth and coronary heart disease in later life: longitudinal study. BMJ. (2001) 322:949–53. doi: 10.1136/bmj.322.7292.949
14. Amadou, C, Heude, B, de Lauzon-Guillain, B, Lioret, S, Descarpentrie, A, Ribet, C, et al. Early origins of metabolic and overall health in young adults: an outcome-wide analysis in a general cohort population. Diabetes Metab. (2023) 49:101414. doi: 10.1016/j.diabet.2022.101414
15. Keinan-Boker, L, Shasha-Lavsky, H, Eilat-Zanani, S, Edri-Shur, A, and Shasha, SM. Chronic health conditions in Jewish holocaust survivors born during world war II. Isr Med Assoc J. (2015) 17:206–12.
16. Head, RF, Gilthorpe, MS, and Ellison, GT. Cholesterol levels in later life amongst UK Channel islanders exposed to the 1940-45 German occupation as children, adolescents and young adults. Nutr Health. (2009) 20:91–105. doi: 10.1177/026010600902000202
17. Xin, X, Wang, W, Xu, H, Li, Z, and Zhang, D. Exposure to Chinese famine in early life and the risk of dyslipidemia in adulthood. Eur J Nutr. (2019) 58:391–8. doi: 10.1007/s00394-017-1603-z
18. Kaleta, M, Leutner, M, Thurner, S, Kautzky, A, Endel, G, Kiss, N, et al. Diabetes incidence in Austria: the role of famines on diabetes and related NCDs. Heliyon. (2023) 9:e17570. doi: 10.1016/j.heliyon.2023.e17570
19. Li, J, Zou, X, Zhong, F, Yang, Q, Manson, JE, Papandonatos, GD, et al. Prenatal exposure to famine and the development of diabetes later in life: an age-period-cohort analysis of the China health and nutrition survey (CHNS) from 1997 to 2015. Eur J Nutr. (2023) 62:941–50. doi: 10.1007/s00394-022-03049-w
20. Mangili, L. High prevalence of dyslipidemia in children and adolescents: opportunity for prevention. Arq Bras Cardiol. (2020) 114:57–8. doi: 10.36660/abc.20190761
21. Kirti, K, and Singh, SK. Quantifying the burden of lipid anomalies among adolescents in India. BMC Cardiovasc Disord. (2022) 22:385. doi: 10.1186/s12872-022-02819-y
22. Nicklas, TA, von Duvillard, SP, and Berenson, GS. Tracking of serum lipids and lipoproteins from childhood to dyslipidemia in adults: the Bogalusa heart study. Int J Sports Med. (2002) 23 Suppl 1:S39–43. doi: 10.1055/s-2002-28460
23. Webber, LS, Srinivasan, SR, Wattigney, WA, and Berenson, GS. Tracking of serum lipids and lipoproteins from childhood to adulthood. The Bogalusa heart study. Am J Epidemiol. (1991) 133:884–99. doi: 10.1093/oxfordjournals.aje.a115968
24. Koskinen, J, Juonala, M, Dwyer, T, Venn, A, Thomson, R, Bazzano, L, et al. Impact of lipid measurements in youth in addition to conventional clinic-based risk factors on predicting preclinical atherosclerosis in adulthood: international childhood cardiovascular cohort consortium. Circulation. (2018) 137:1246–55. doi: 10.1161/CIRCULATIONAHA.117.029726
25. Verma, GK, Yadav, YS, Yadav, RK, Sharma, IK, Bharat, K, and Yadav, KK. Study of lipid profile levels in malnourished and healthy children: a case control study. Pediatr Rev Int J Pediatr Res. (2018) 5:156–61. doi: 10.17511/ijpr.2018.i04.01
26. Bhalavi, V, Deshmukh, PR, Goswami, K, and Garg, N. Prevalence and correlates of metabolic syndrome in the adolescents of rural Wardha. Indian J Commun Med. (2015) 40:43. doi: 10.4103/0970-0218.149270
27. Deo, MG, Pawar, PV, Kanetkar, SR, and Kakade, SV. Multicentric study on prevalence and risk factors for hypertension and diabetes in tribal communities in Western and Northern Maharashtra. J Postgrad Med. (2018) 64:23–34. doi: 10.4103/jpgm.JPGM_245_17
28. Ministry of Health and Family Welfare (MoHFW), Government of India, UNICEF and Population Council. Comprehensive National Nutrition Survey (CNNS) National Report. New Delhi: Ministry of health and family welfare (2019).
29. Kushwaha, S, Srivastava, R, Bhadada, SK, and Khanna, P. Prevalence of pre-diabetes and diabetes among school-age children and adolescents of India: a brief report. Diabetes Res Clin Pract. (2023) 202:110738. doi: 10.1016/j.diabres.2023.110738
30. Alemu, S, Dessie, A, Seid, E, Bard, E, Lee, PT, Trimble, ER, et al. Insulin-requiring diabetes in rural Ethiopia: should we reopen the case for malnutrition-related diabetes? Diabetologia. (2009) 52:1842–5. doi: 10.1007/s00125-009-1433-5
31. Kibirige, D, Sekitoleko, I, Lumu, W, Jones, AG, Hattersley, AT, Smeeth, L, et al. Understanding the pathogenesis of lean non-autoimmune diabetes in an African population with newly diagnosed diabetes. Diabetologia. (2022) 65:675–83. doi: 10.1007/s00125-021-05644-8
32. Maiti, S, Sinha, NK, Khan, MM, Das, PK, and Chattopadhyay, JC. Diabetes in rural individuals of different nutritional status and the alarming situation demands focus more on its under-nutrition association. Arch Physiol Biochem. (2015) 121:26–31. doi: 10.3109/13813455.2014.959973
33. Lontchi-Yimagou, E, Dasgupta, R, Anoop, S, Kehlenbrink, S, Koppaka, S, Goyal, A, et al. An atypical form of diabetes among individuals with low BMI. Diabetes Care. (2022) 45:1428–37. doi: 10.2337/dc21-1957
34. Ashok, T, Puttam, H, Tarnate, VCA, Jhaveri, S, Avanthika, C, Trejo Treviño, AG, et al. Role of vitamin B12 and folate in metabolic syndrome. Cureus. (2021) 13:e18521. doi: 10.7759/cureus.18521
35. Adaikalakoteswari, A, Jayashri, R, Sukumar, N, Venkataraman, H, Pradeepa, R, Gokulakrishnan, K, et al. Vitamin B12 deficiency is associated with adverse lipid profile in Europeans and Indians with type 2 diabetes. Cardiovasc Diabetol. (2014) 13:129. doi: 10.1186/s12933-014-0129-4
36. Raghuvanshi, DS, Chakole, S, and Kumar, M. Relationship between vitamins and diabetes. Cureus. (2023) 15:e36815. doi: 10.7759/cureus.36815
37. Pevekar, KS, Patil, SN, and Chavan, AJ. Psychosocial study of adolescent girls from rural Konkan region (Maharashtra). Int J Res Med Sci. (2015) 3:2745–50. doi: 10.18203/2320-6012.ijrms20150825
38. Patil, SN, Wasnik, VR, and Wadke, R. Health problems amongst adolescent girls in rural areas of Ratnagiri district of Maharashtra, India. J Clin Diagn Res. (2009) 3:1784–90.
39. Patil, S, Joglekar, C, Desai, M, Yadav, A, Sonawane, S, Chavan, R, et al. Nutritional status and psychological impairment in rural adolescent girls: pilot data from “KONKAN” region of Western India. Front Public Health. (2018) 6:160. doi: 10.3389/fpubh.2018.00160
40. Kshirsagar, MV, and Ashturkar, MD. Prevalence of lifestyle diseases in Maharashtra: a comparison between NFHS-5 and NFHS-4 surveys. J Family Med Prim Care. (2022) 11:2474–8. doi: 10.4103/jfmpc.jfmpc_1944_21
41. Patil, S, Patil, N, Santpur, U, Bhat, P, Jadhav, D, Dervankar, O, et al. Gestational diabetes in undernourished women of KONKAN region of state of Maharashtra, India (BKLWHANC-1). J Diab Res Ther. (2021) 7:1–5. doi: 10.16966/2380-5544.15
42. Patil, S, Patil, N, Joglekar, C, Yadav, A, Nilawar, A, Banavali, U, et al. aDolescent and prEconception health peRspectiVe of adult non-communicable diseases (DERVAN): protocol for rural prospective adolescent girls cohort study in Ratnagiri district of Konkan region of India (DERVAN-1). BMJ Open. (2020) 10:e035926. doi: 10.1136/bmjopen-2019-035926
43. Patil, S, Patil, N, Hardikar-Bhat, P, Dervankar, O, Joglekar, C, Bhat, R, et al. Prediabetes in rural adolescent girls from DERVAN cohort: data from the KONKAN region of the state of Maharashtra, India (DERVAN-4). Front Public Health. (2023) 11:1181401. doi: 10.3389/fpubh.2023.1181401
44. Patil, SN, Patil, N, Bhat, P, Nandoskar, A, Bhat, R, Yadav, A, et al. Laboratory protocol and development of biorepository for epidemiological, rural DERVAN cohort study in KONKAN region of India (DERVAN-2). Indian J Public Health Res Dev. (2024) In press
45. WHO. Child growth standards. Available at: http://www.who.int/childgrowth/standards/en/ (Accessed February 12, 2023).
46. Cole, TJ, and Lobstein, T. Extended international (IOTF) body mass index cut-offs for thinness, overweight and obesity. Pediatr Obes. (2012) 7:284–94. doi: 10.1111/j.2047-6310.2012.00064.x
47. Friedewald, WT, Levy, RI, and Fredrickson, DS. Estimation of the concentration of low-density lipoprotein cholesterol in plasma, without use of the preparative ultracentrifuge. Clin Chem. (1972) 18:499–502. doi: 10.1093/clinchem/18.6.499
48. ElSayed, NA, Aleppo, G, Aroda, VR, Bannuru, RR, Brown, FM, Bruemmer, D, et al. 4. Comprehensive medical evaluation and assessment of comorbidities: standards of Care in Diabetes-2023. Diabetes Care. (2023) 46:S49–s67.2. doi: 10.2337/dc23-S004
49. iHOMA2. Available at: https://www.phc.ox.ac.uk/research/technology-outputs/ihoma2 (Accessed September 24, 2023).
50. de Benoist, B. Conclusions of a WHO technical consultation on folate and vitamin B12 deficiencies. Food Nutr Bull. (2008) 29:S238–44. doi: 10.1177/15648265080292S129
51. Banavli, U, Patil, SN, Chavan, R, Sonawane, S, Joglekar, C, Fall, C, et al. What shapes adolescents’ diet and physical activity habits in rural Konkan, India? Adolescents’ and caregivers’ perspectives. Public Health Nutr. (2020) 24:5177–86. doi: 10.1017/S1368980020001731
52. Sachdev, HS, Ghosh, S, Gupta, A, Thomas, T, and Kurpad, AV. Locally validated biomarker cutoffs should inform micronutrient deficiency burdens. Lancet Glob Health. (2023) 11:e338. doi: 10.1016/S2214-109X(23)00003-7
53. Kushwaha, S, Srivastava, R, Bhadada, SK, Khan, N, Mondal, A, and Khanna, P. Interaction between micronutrients and lipid profile in prediabetes and diabetes among school-aged children (5-9 y) in India. Nutrition. (2023) 115:112172. doi: 10.1016/j.nut.2023.112172
54. Aureli, A, Recupero, R, Mariani, M, Manco, M, Carlomagno, F, Bocchini, S, et al. Low levels of serum total vitamin B12 are associated with worse metabolic phenotype in a large population of children, adolescents and young adults, from underweight to severe obesity. Int J Mol Sci. (2023) 24:16588. doi: 10.3390/ijms242316588
55. Al-Daghri, NM, Al-Saleh, Y, Aljohani, N, Alokail, M, Al-Attas, O, Alnaami, AM, et al. Vitamin D deficiency and cardiometabolic risks: a juxtaposition of arab adolescents and adults. PLoS One. (2015) 10:e0131315. doi: 10.1371/journal.pone.0131315
56. Freinkel, N. Banting lecture 1980. Of pregnancy and progeny. Diabetes. (1980) 29:1023–35. doi: 10.2337/diab.29.12.1023
57. Herrera, E. Lipid metabolism in pregnancy and its consequences in the fetus and newborn. Endocrine. (2002) 19:43–56. doi: 10.1385/ENDO:19:1:43
58. Woollett, LA. Maternal cholesterol in fetal development: transport of cholesterol from the maternal to the fetal circulation. Am J Clin Nutr. (2005) 82:1155–61. doi: 10.1093/ajcn/82.6.1155
59. Wadsack, C, Tabano, S, Maier, A, Hiden, U, Alvino, G, Cozzi, V, et al. Intrauterine growth restriction is associated with alterations in placental lipoprotein receptors and maternal lipoprotein composition. Am J Physiol Endocrinol Metab. (2007) 292:E476–84. doi: 10.1152/ajpendo.00547.2005
60. Edison, RJ, Berg, K, Remaley, A, Kelley, R, Rotimi, C, and Stevenson, RE. Muenke M adverse birth outcome among mothers with low serum cholesterol. Pediatrics. (2007) 120:723–33. doi: 10.1542/peds.2006-1939
61. Patil, S, Joglekar, C, Chavan, R, Sonawane, S, Modak, A, and Pendse, A. Trends in malnutrition indicators from birth to adolescence in rural KONKAN region of Western India. Int J Nutr Sci. (2020) 5:1041.
62. Patil, S, Dombale, V, Joglekar, C, Patil, N, Joshi, K, Warpe, B, et al. Is small placenta a risk for low birth weight in KONKAN? (data from a coastal region in the state of Maharashtra, India). J Dev Orig Health Dis. (2020) 12:652–9. doi: 10.1017/S2040174420000574
63. Di Cianni, G, Miccoli, R, Volpe, L, Lencioni, C, Ghio, A, Giovannitti, MG, et al. Maternal triglyceride levels and newborn weight in pregnant women with normal glucose tolerance. Diabet Med. (2005) 22:21–5. doi: 10.1111/j.1464-5491.2004.01336.x
64. Schaefer-Graf, UM, Graf, K, Kulbacka, I, Kjos, SL, Dudenhausen, J, Vetter, K, et al. Maternal lipids as strong determinants of fetal environment and growth in pregnancies with gestational diabetes mellitus. Diabetes Care. (2008) 31:1858–63. doi: 10.2337/dc08-0039
65. Vrijkotte, TG, Algera, SJ, Brouwer, IA, van Eijsden, M, and Twickler, MB. Maternal triglyceride levels during early pregnancy are associated with birth weight and postnatal growth. J Pediatr. (2011) 159:736–742.e1. doi: 10.1016/j.jpeds.2011.05.001
66. Misra, VK, Trudeau, S, and Perni, U. Maternal serum lipids during pregnancy and infant birth weight: the influence of prepregnancy BMI. Obesity. (2011) 19:1476–81. doi: 10.1038/oby.2011.43
67. Kulkarni, SR, Kumaran, K, Rao, SR, Chougule, SD, Deokar, TM, Bhalerao, AJ, et al. Maternal lipids are as important as glucose for fetal growth: findings from the Pune maternal nutrition study. Diabetes Care. (2013) 36:2706–13. doi: 10.2337/dc12-2445
68. Bentil, HJ, Adu-Afarwuah, S, Prado, EL, Arnold, CD, Hastings, PD, Guyer, AE, et al. Sustained effects of small-quantity lipid-based nutrient supplements provided during the first 1000 days on child growth at 9-11 y in a randomized controlled trial in Ghana. Am J Clin Nutr. (2024) 119:425–32. doi: 10.1016/j.ajcnut.2023.10.033
69. Mutumba, R, Pesu, H, Mbabazi, J, Greibe, E, Nexo, E, Olsen, MF, et al. Effect of lipid-based nutrient supplements on micronutrient status and hemoglobin among children with stunting: secondary analysis of a randomized controlled trial in Uganda. Am J Clin Nutr. (2024) 119:829–37. doi: 10.1016/j.ajcnut.2024.01.018
Keywords: micronutrients, lipids, prediabetes, undernutrition, India, adolescents, rural
Citation: Patil S, Dervankar O, Hardikar-Bhat P, Joglekar C, Bhat R, Patil N and Yadav A (2024) Associations of micronutrients and lipids with prediabetes and glycemic parameters in adolescent girls of the rural DERVAN cohort (DERVAN-9). Front. Nutr. 11:1380777. doi: 10.3389/fnut.2024.1380777
Edited by:
Omar A. Obeid, American University of Beirut, LebanonReviewed by:
N. K. Mungreiphy, Amity University, IndiaCopyright © 2024 Patil, Dervankar, Hardikar-Bhat, Joglekar, Bhat, Patil and Yadav. This is an open-access article distributed under the terms of the Creative Commons Attribution License (CC BY). The use, distribution or reproduction in other forums is permitted, provided the original author(s) and the copyright owner(s) are credited and that the original publication in this journal is cited, in accordance with accepted academic practice. No use, distribution or reproduction is permitted which does not comply with these terms.
*Correspondence: Suvarna Patil, ZHIuc3V2YXJuYW5wYXRpbEBnbWFpbC5jb20=
Disclaimer: All claims expressed in this article are solely those of the authors and do not necessarily represent those of their affiliated organizations, or those of the publisher, the editors and the reviewers. Any product that may be evaluated in this article or claim that may be made by its manufacturer is not guaranteed or endorsed by the publisher.
Research integrity at Frontiers
Learn more about the work of our research integrity team to safeguard the quality of each article we publish.