 Miyoung Yoo
 Hyun Jeong Lee
 Kwang-Won Lee
 Dongwon Seo
94% of researchers rate our articles as excellent or good
Learn more about the work of our research integrity team to safeguard the quality of each article we publish.
Find out more
ORIGINAL RESEARCH article
Front. Nutr., 08 January 2024
Sec. Food Chemistry
Volume 10 - 2023 | https://doi.org/10.3389/fnut.2023.1320550
Background: Trans fatty acids (TFAs) are unsaturated fatty acids, with vaccenic acid (VA) and elaidic acid (EA) being the major constituents. While VA has been associated with beneficial effects on health and anti-cancer properties, EA is found in hardened vegetable oils and is linked to an increased risk of cardiovascular diseases. Therefore, this study aimed to develop a novel method for the quantitative measurement of VA and EA, aiming to accurately analyze individual TFA and apply it for the assessment of products containing TFAs.
Methods: The ratio of VA to EA (V/E ratio) was evaluated using a silver ion cartridge (SIC) solid phase extraction method removing cis-fatty acids (cis-FAs). Additionally, comparative analysis of the V/E ratio was conducted by the two methods (SIC treatment and untreated) using comprehensive two-dimensional gas chromatography combined with time-of-flight mass spectrometry (GC × GC-TOFMS).
Results: The removal efficiency of cis-FAs was greater than 97.8%. However, the total TFA contents were not so different from SIC treatment. Moreover, this approach not only allowed for a more precise determination of the V/E ratio but also revealed a significant distinction between natural trans fatty acids (N-TFAs) and hydrogenated trans fatty acids (H-TFAs).
Conclusion: Therefore, the SIC coupled to the GC × GC-TOFMS presented in this study could be applied to discriminate N-TFA and H-TFA contents in dairy and fatty foods.
Trans fatty acids (TFAs) represent a category of unsaturated fatty acids characterized by at least one double bond in a trans configuration (1). These TFAs encompass various fatty acids, including vaccenic acid (11 t-C18:1, VA), elaidic acid (9 t-C18:1, EA), and other substances. Both VA and EA are recognized as major fatty acids in C18:1 TFAs. (2–4). Despite their similar chemical structures, the position of the carbon–carbon double bond plays role in determining their impact on human health (5, 6). EA, prevalent in partially hydrogenated vegetable oils, is linked to an elevated risk of cardiovascular disease, displaying a negative correlation with plasma HDL-cholesterol levels and a positive correlation with plasma LDL-cholesterol levels (7–9). Conversely, studies suggest that VA may have beneficial health effects, including potential anti-cancer effects properties (10–13). In hydrogenated trans fatty acids (H-TFAs), EA serves as a a primary source, forming a diverse range of TFAs mixtures (14). Natural trans fatty acids (N-TFAs) found in the human diet, particularly in animal fat sources like butter and cheese, predominantly consist of VA, which constituting over 60% of total TFAs (14).
Previous studies (14) have examined the levels of VA and EA in foods, proposing the ratio of VA to EA as a distinguishing factor between N-TFAs and H-TFAs. However, accurate estimation of this ratio requires the separation of trans- and cis-FAs. The presence of a cis bond induces a bend or flexion in the fatty acid chain, while a trans bond results in a structure resembling that of a saturated fatty acid due to the straightening of the chain (15). Clear separation, identification and quantification of TFAs pose challenges due to overlapping isomers of trans- and cis-FAs (16–18).
Capillary zone electrophoresis (CE) emerges as a method capable of identifying EA and VA with minimal organic solvents and reagents, without requiring specific columns (19). However, the presence of matrix components, especially proteins, in the sample can lead to decreased separation efficiency due to their adsorption on the hydrophilic surface of the silica capillary (20, 21). Recent students (18, 22) propose the use of silver ions anchored onto a strong cation exchange for solid phase extraction (SPE) to remove isomers of cis-FAs from commonly consumed foods. Kramer et al. (17) analyzed eighty-seven fatty acids in milk samples using a silver ion cartridge (SIC) SPE method. They recommended gas chromatography combined with electron ionization mass spectrometry (GC/EI-MS), comprehensive two-dimensional gas chromatography (GC × GC) combined with a flame ionization detector (FID), and silver ion high performance liquid chromatography interfaced with atmospheric pressure photoionization mass spectrometry (HPLC/APPI-MS) for accurate determination of individual TFAs.
While HPLC/MS detection proved to be a rapid and reproducible method for nine C18:1 fatty acid methyl ester isomers, time-of-flight mass spectrometry (TOFMS) offered advantages in resolution and sensitivity without sacrificing full mass spectra information (23). Additionally, GC × GC experiments allowed for versatile separation of complex mixtures in a single run, demonstrating reproducibility in retention time in both dimensions (24).
However, to the best of our knowledge, there is currently no method for identifying EA and VA in various foods using the combination of GC × GC and TOFMS after SIC pretreatment, considering the advantages of different analytical techniques. Therefore, the combination of GC × GC and TOFMS could be suggested as one of the most efficient analytical methods for the isolation and identification of individual TFA. In this study, our primary objective was to investigate an extraction method for removing cis-fatty acids, enabling a more precise analysis of individual TFAs. Furthermore, we aimed to separate and quantify EA and VA to assess the distribution of TFA isomers in various trans-fat-containing foods, including margarine, butter, cheese, and milk.
Individual reference fatty acid methyl ester (FAME) standards, including of trans-9-elaidic methyl ester (9 t-C18:1, EA) and trans-11-vaccenic methyl ester (11 t-C18:1, VA) were purchased from Nu-Chek Prep Inc. (Elysian, MN, USA). All solvents and reagents utilized in this study were of analytical grade. A 14% boron-trifluoride methanol solution (BF3), sodium hydroxide, and sodium chloride were obtained from Sigma-Aldrich (St. Louis, MO, USA). Additionally, chloroform, normal hexane (HPLC grade, 95%), and methanol were purchased from J. T. Baker (Philipsburg, NJ, USA).
Representative TFA-containing food samples commonly found in the general market were selected for analysis, chosen specifically for their high TFA content (25). A total 30 samples, including margarine, butter, cheese, and ice cream, were obtained from a local grocery store in South Korea. Among these, there are 3 samples of margarine, 3 of butter, 7 of cheese, and 17 of ice cream comprising various product types.
Fat from these samples was extracted using a mixture of chloroform and methanol (2:1, v/v) and subsequently evaporated to dryness (26, 27). In the extraction process, 20 mg of fat was placed into a vial with 2 mL of 0.5 M methanolic sodium hydroxide and capped. The vial was then heated at 100°C for 5 min, followed by cooling at 25°C. Subsequently, 2 mL of BF3 reagent was added, and the mixture was heated at 100°C for an additional 5 min. To this, 2 mL of isooctane and saturated sodium chloride solution were added, followed by vortexing for 1 min. The isooctane layer was transferred to a separate vial.
To eliminate cis-FAs from the test solutions, 1 mL of the test solution in isooctane was loaded onto the preconditioned SIC (6 mL, Supelco, Bellefonte, USA) after pre-conditioning with 4 mL acetone and 4 mL of n-hexane. For SIC elution, solutions were eluted with hexane and acetone ratios of 99:1, 94:4, and 90:10. Four mL of n-hexane/acetone (96:4) was used and collected in a 12 mL vial. The solution in the vial was then evaporated to dryness using nitrogen gas. The residues in the vial were dissolved with 2 mL of isooctane for subsequent GC × GC-TOFMS analysis.
The GC-FID was operated with an Agilent 6,890 N GC (Agilent Technologies, Santa Clara, CA, USA) equipped with a flame ionization detector (FID). The injector temperature was set at 230°C, the detector temperature was 250°C, and the column oven temperature was increased from 120°C to 230°C at a rate of 5°C per min. A SP-2560 column (100 m × 0.25 mm i.d., 0.25 μm film thickness, Supelco, CA, USA) was utilized, and helium served as the carrier gas with a flow rate maintained at 1.5 mL/min.
For GC × GC-FID, a LECO Corporation Pegasus 4D instrument with an Agilent 6,890 N GC was employed. The GC × GC analysis involved a primary column SP-2560 (100 m × 0.25 mm i.d., 0.25 μm film thickness, Supelco, CA, USA) and a secondary column RTX-5 (1.5 m × 0.18 mm i.d., 0.18 μm film thickness, Restek, Bellefonte, PA, USA). The main oven temperature was initially held at 45°C for 4 min, increased to 175°C at a rate of 13°C/min and held for 27 min. Subsequently, it was raised to 215°C at a rate of 4°C/min and held for 10 min. The secondary oven was set 20°C higher than the main oven temperature. The modulator temperature offset was 40°C, the second dimension separation time was 5 s, the cool time between stages was 1.5 s and the hot pulse time was 1.0 s.
For GC × GC-TOFMS, the operating conditions mirrored those of GC × GC-FID. GC × GC-TOFMS was run at an acquisition rate of 100 spectra/s. The transfer line and the ion source temperature were at 220°C. The electron energy was 70 eV, and mass spectra were collected in the m/z range of 35–500. Spectra were identified using the NIST Mass Spectral Search Program through Chroma TOF-GC software for PEGASUS 4D of LECO Corp.
The GC × GC-TOFMS method underwent validation for parameters including linearity, sensitivity, and precision. Linearity of the calibration curves was examined for each EA and VA standard at varing concentrations within the range of 1–100 μg/mL, with all evaluations conducted in triplicate. Limits of detection (LOD) and limits of quantification (LOQ) for EA and VA standards were experimentally determined through serial dilutions until signal-to-noise ratios of 3 and 10 were reached, respectively.
Precision was assessed by multiple injections of several standard curve levels (ranging from 1–100 μg/mL) intra-day for repeatability and inter-day for intermediate precision. Repeatability represents the variability of independent results obtained by analyzing the sample six times, was measured by calculating the relative standard deviation (RSD) values for all the collected data. To evaluate the accuracy of the analytical method, recovery tests were conducted.
The experiment was conducted in triplicate, and the results are expressed as the mean ± standard deviation. Statistical analysis was performed using the SPSS 13.0 software for Window (LEAD TOOLS, LEAD Technologies, Inc., 2004).
Table 1 shows the distribution of fatty acids eluted by SIC with different ratios of acetone in hexane (H:A), as analyzed using GC-FID. Total methylated lipids were applied to the SIC, and the H:A ratio was increased to 99:1, 96:4 and 90:10, respectively, with elution carried out using 4 mL volumes of mixed solvent. In the untreated SIC, C18:0, C18:1-trans, and C18:1-cis were found to be 15.7 g/100 g, 17.3 g/100 g, and 26.5 g/100 g, respectively. Upon SIC treatment, C18:0 and C18:1-cis were eluted in fractions 1 and 3, while in fraction 2, 16.9 g/100 g of C18:1-trans was eluted with 97.7% recovery. Consequently, it was determined that the H:A 96:4 solution was the most suitable solution for separating individual TFAs.
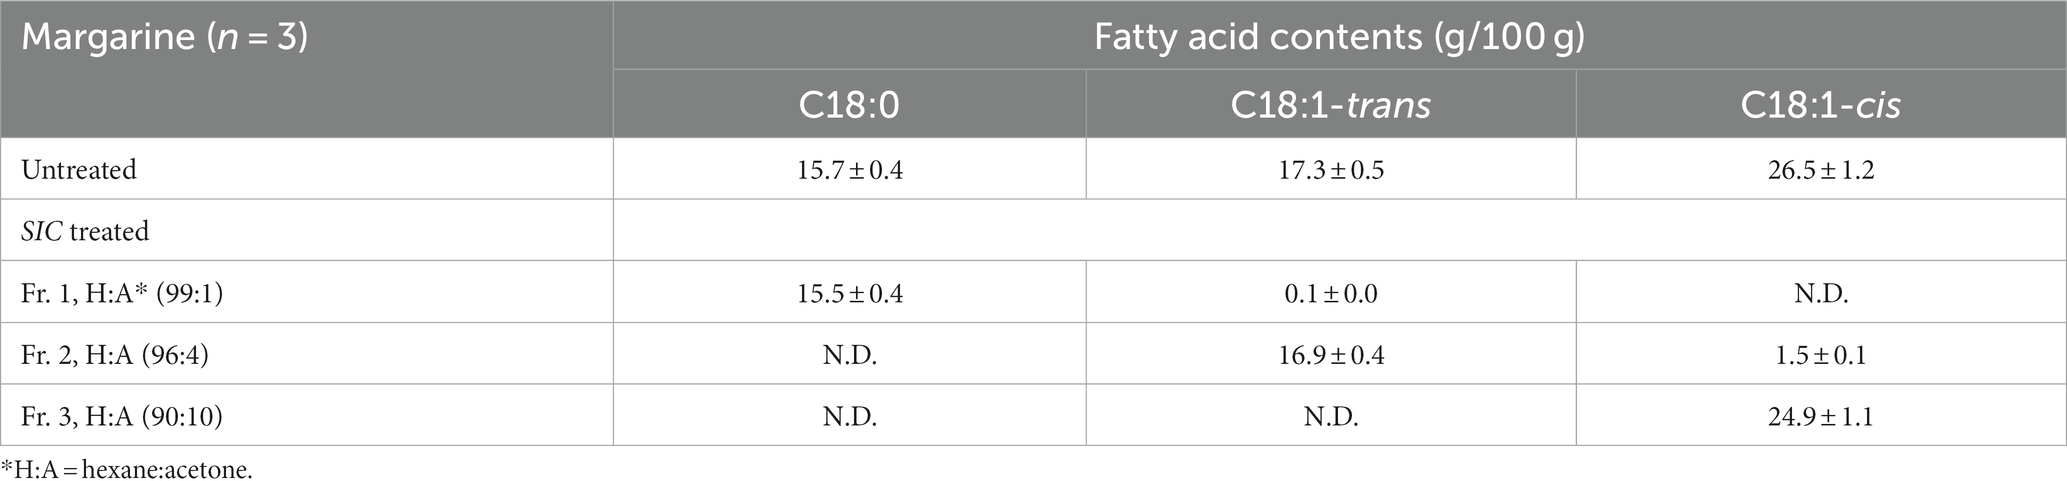
Table 1. Fatty acid fractionation of margarine using a silver ion cartridge (SIC) solid phase extraction method.
The effectiveness of cis-fat removal through SIC treatment was verified through GC-FID and GC × GC-FID chromatogram (Figure 1). Except for C18:1 TFA, SIC treatment demonstrated efficient removal of other fatty acids, such as C18:0, C18:1-cis and C18:2.
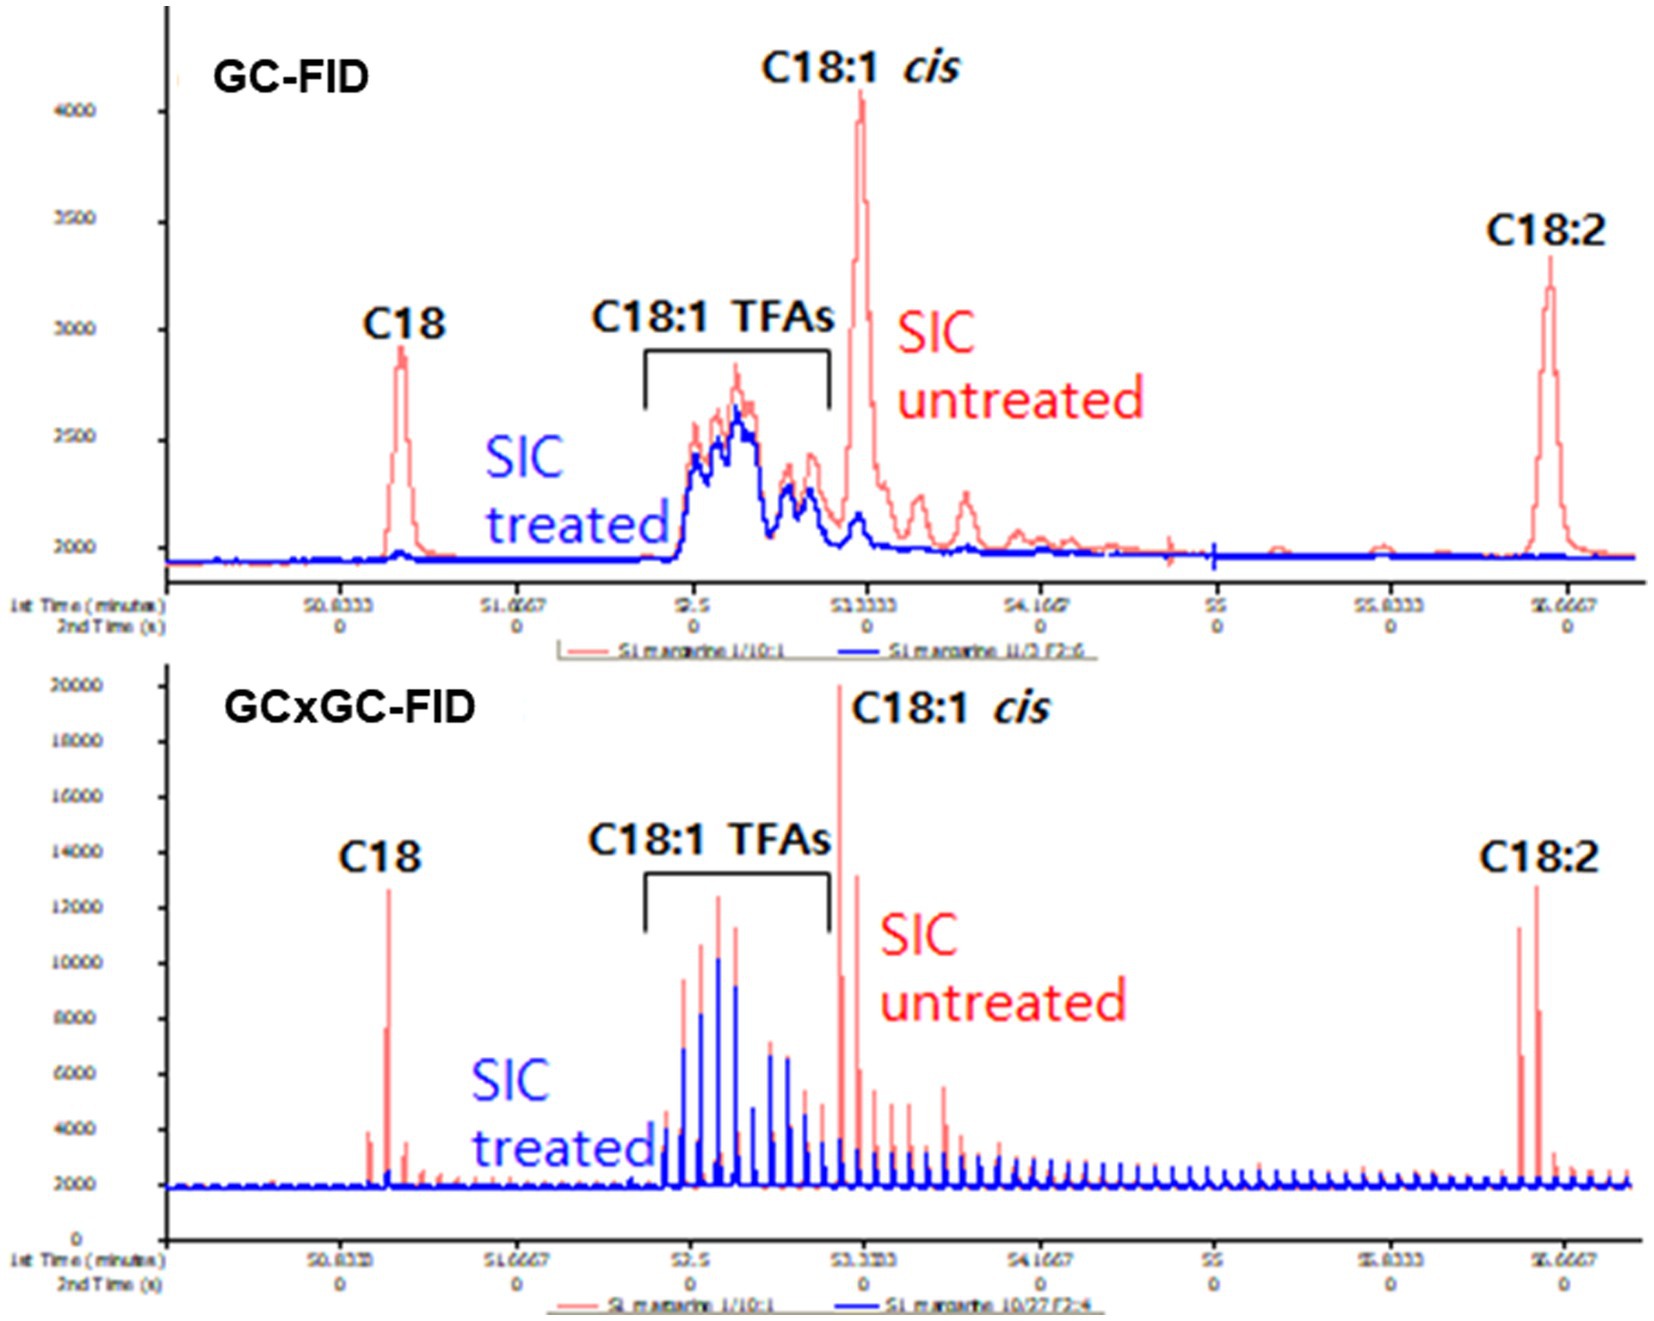
Figure 1. The effect of SIC treatment for removing cis-FA by GC-FID and GC × GC-FID.
Despite advancements in capillary column resolution, the development of a single column for separating individual TFA isomers remains elusive. A recent breakthrough involves a two-dimension technique that utilizes GC coupled with a modulator (GC × GC) to physically separate the elution of the first column, enabling the analysis of each fraction in the secondary column. Ongoing research is actively exploring ways to effectively separate and analyze isomers with different double bond positions using GC × GC (14, 24, 28). Using these GC × GC techniques, TFA isomeric peaks, which were indistinguishable in the GC-FID chromatogram (Figure 1A), were successfully resolved into individual TFA isomers in the GC × GC-FID representation (Figure 1B).
When TFAs were analyzed using GC × GC-TOFMS, they were separated into individual isomers to the greatest extent than GC × GC-FID analysis (Figure 1). Cis-FAs were eluted after the TFAs group in chromatograms (A and C in Figure 2), and clear elimination of them was observed (B and D in Figure 2).
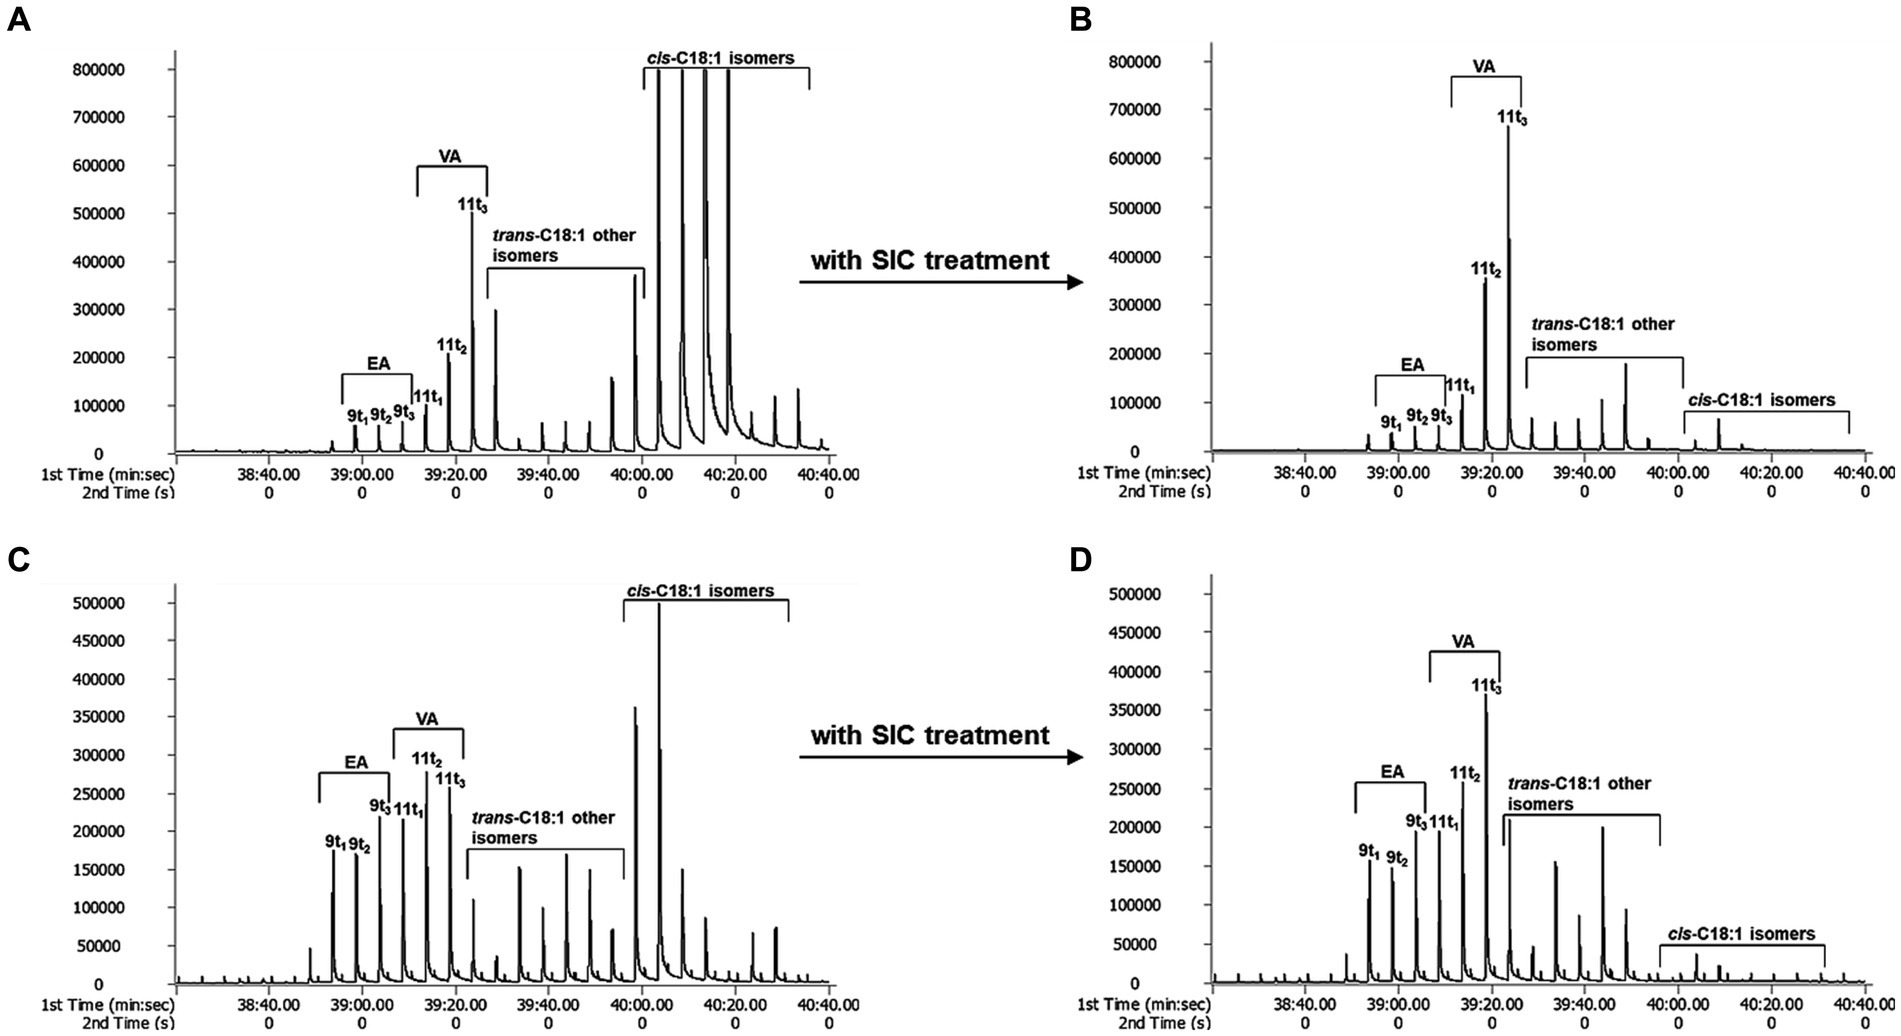
Figure 2. The effect of SIC treatment by GC × GC-TOFMS. (A): butter, (B): butter with SIC treatment, (C): margarine, and (D): margarine with SIC treatment.
The effective separation of individual TFA by TOFMS is attributed to the sufficiently high mass resolution. This allows for the separation of peaks even if the masses are the same, dramatically improving the identification of specific molecular fragments and reducing cross-sensitivity. Additionally, it can diminish background noise generated by disturbance ion signals or compensate for co-elution of non-target species in GC × GC (23). In conclusion, GC × GC-TOFMS offers advantages in resolution and sensitivity without sacrificing the overall mass spectral information of EA and VA. Through the analysis of EA and VA standards with GC × GC-TOFMS, EA was separated into peaks 9 t1, 9 t2 and 9 t3, and VA into 11 t1, 11 t2, and 11 t3 using a modulator (Figure 3). The 9 t2 and 11 t2 are primary peaks for EA and VA. 9 t1, and 9 t3 are subpeaks for EA, and 11 t1 and 11 t3 are subpeaks for VA, respectively. As depicted in A and C in Figure 2, the analysis of butter and margarine samples revealed that C18:1 TFAs comprised EA and VA. However, the properties of other isomers, excluding EA and VA, have not been precisely confirmed, necessitating further research.
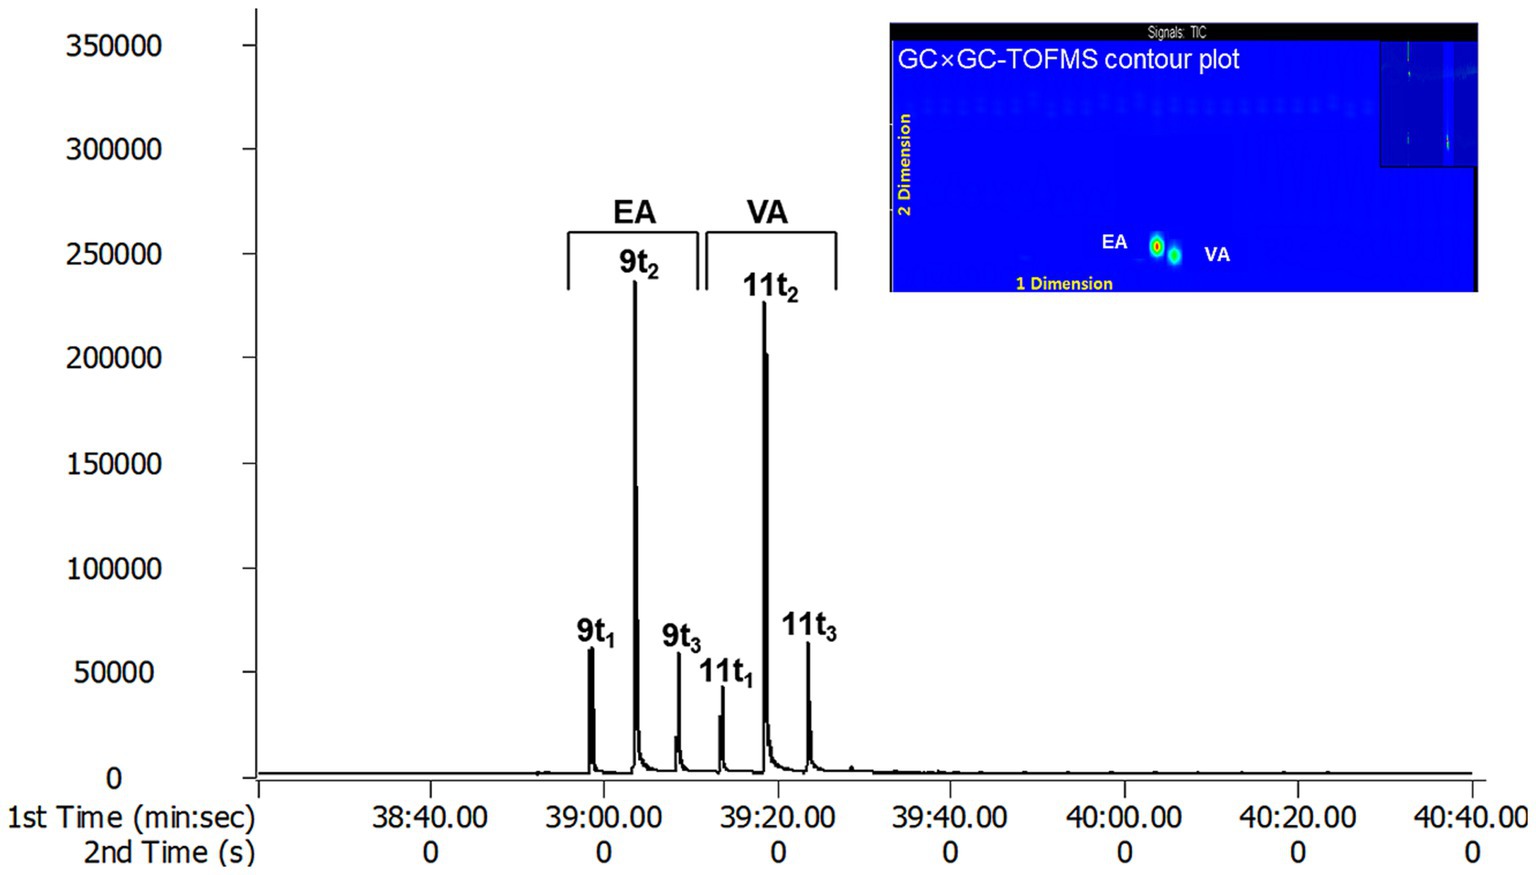
Figure 3. The standard chromatogram and contour plot of EA and VA by GC × GC-TOFMS.
Analytical validation holds principal importance, establishing scientific evidence that an analytical procedure produces reliable results (29). Analytical methods, crucial for ensuring product quality characteristics, gains validity through a proper validation process. This involves a formal, systematic, and well-documented assessment of the analytical method’s capability to provide accurate, reliable, and reproducible results.
To validate the proposed GCxGC-TOFMS method, various parameters, including linearity, LOD, LOQ, precision, and recovery, were considered and evaluated. Linearity and range standards were serially diluted to obtain five concentration levels. The correlation coefficients of the regression lines of each TFA standard were 0.9997 for EA and 0.9993 for VA. Method sensitivity was assessed by the LOD and LOQ, with EA LOD and LOQ at 2.20 and 4.38 μg/mL, respectively, and VA LOD and LOQ at 6.66 and 13.27 μg/mL, respectively (Table 2).
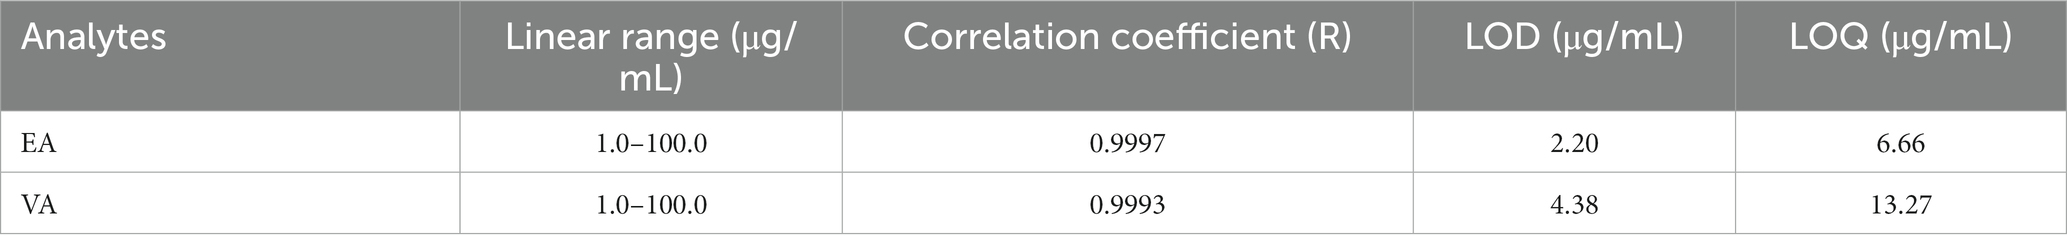
Table 2. Linearity, limits of detection (LOD), and limits of quantification (LOQ) of elaidic acid (EA) and vaccenic acid (VA).
Method precision was evaluated by repeatability and reproducibility. The intra- and inter-day precision were assessed using EA and VA results in the four samples, revealing RSD values for intra-day precision ranging from 1.8 to 8.9%, and inter-day precision ranging from 3.9 to 8.1%. The validation data demonstrated precision below 20% for all the tested samples, indicating excellent method performance across the entire calibration range (30). To analyze recovery rates, EA and VA were spiked into margarine, butter, cheese, and ice cream. The recovery rate of EA ranged from 91.1 to 98.4%, while VA ranged from 91.5 to 102.6%. Detailed results are summarized in Table 3.
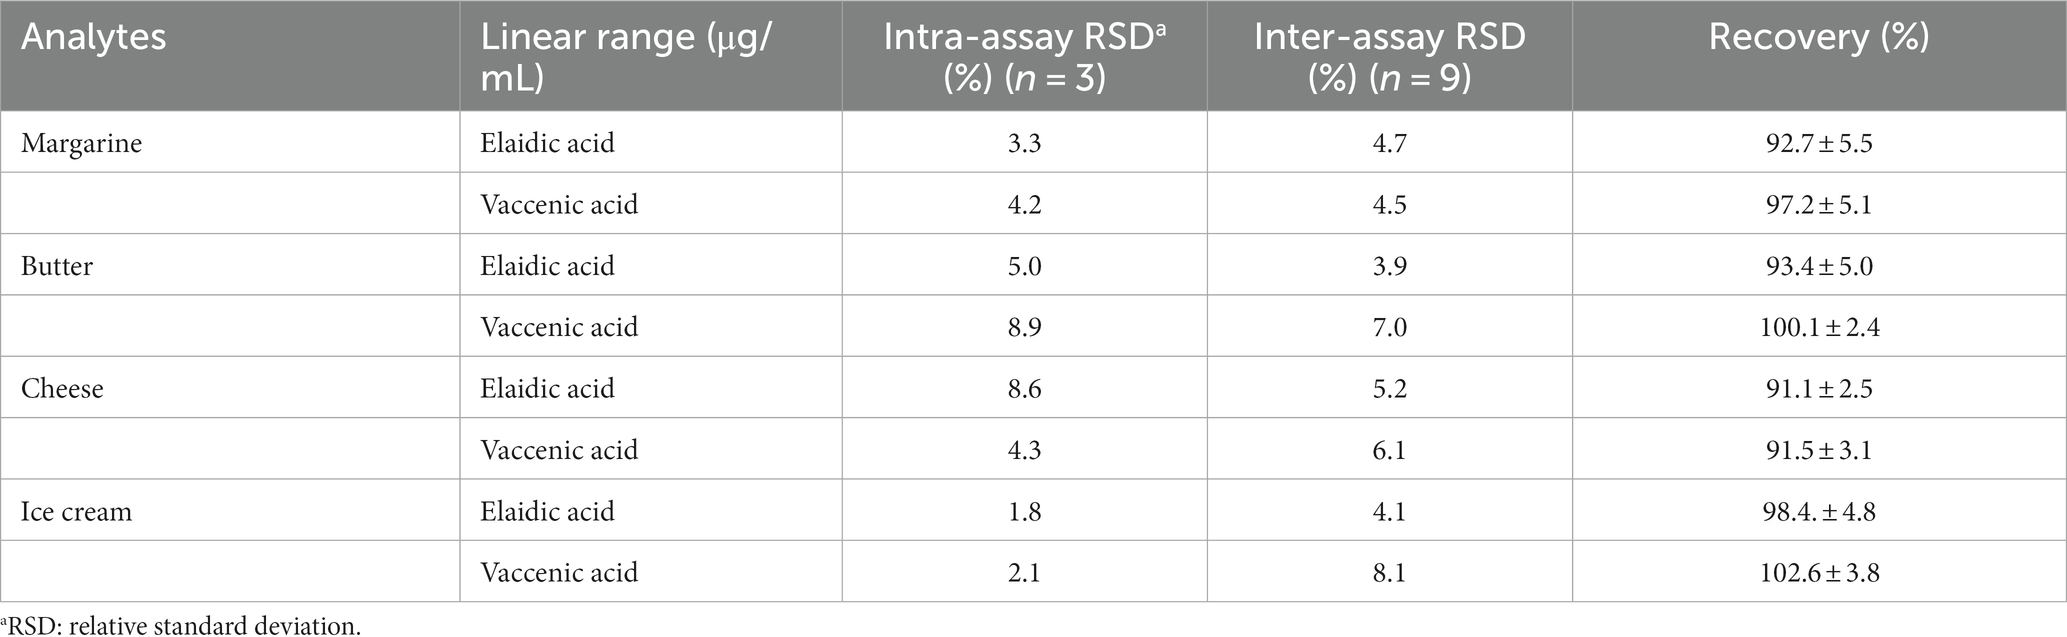
Table 3. Method validation of precision and accuracy.
Table 4 presents the results related to the total fat, TFAs, VA and EA contents of margarine, butter, cheeses, and ice creams. The total fat content varied from 8.0 g/100 g for ice cream to 99.8 g/100 g for margarine. TFA contents ranged from 1753.7 mg/100 g cheese (SIC treated) to 17314.3 mg/100 g margarine (SIC treated). In the case of margarine, TFAs decreased by 2.2% from 17314.3 mg/100 g to 16940.5 mg/100 g due to SIC treatment. With SIC treatment, similar reduction of 9.9 and 5.3% were observed in butter and cheese, both derived from natural milk. Ice cream, categorized into two groups based on nutrition facts (group 1 with added hydrogenated fat and group 2 with natural milk fat), showed a 3.8% decrease in TFAs in group 1 and a 9.0% decrease in group 2 with SIC treatment.

Table 4. Variation of total fat, trans fatty acids (TFAs), VA, and EA contents by SIC treatment.
The analysis of VA and EA, major components of C18:1 TFAs, can be affected by cis-FAs due to overlapped elution. Despite the 163°C GC temperature regimen with SIC treatment facilitating the detection of 15 t-18:1, effective differentiation between the 6 t/7 t/8 t- to 11 t-18:1 isomers remained challenging (17). While GC–MS is an effective method for determining fatty acid structures, its application in the analysis of TFAs isomers is limited due to potential isomerization under high electron impact energy (31).
In this study, SIC fractionation for the removal of cis-FAs from mixed fats was evaluated to enhance the determination of VA and EA contents in margarine, butter, cheeses, and ice creams using GCxGC-TOFMS (Table 4). SIC treatment increased the the VA contents of TFAs in margarine by 5.8% and EA contents 1.9%. The VA contents of butter and cheese increased by 51.4 and 27.6%, respectively, while EA contents decreased to 38.9 and 44.7%. As a result of SIC treatment of ice cream group 1, VA contents increased by 23.9% and EA decreased by 33.6%. In group 2, VA contents increased by 8.4% and EA decreased by 42.0%. Overall, SIC treatment resulted in an increase in the proportion of VA in TFA but showed a decrease in EA. Further studies are needed to verify this tendency.
As indicated in the previous report (14), the ratio of VA to EA (V/E ratio) is considered an important parameter for evaluating food. In this study, we examined individual TFAs in commonly available market foods such as margarine, butter, cheese and ice cream (25). The proportions of the VA and EA in the margarine, butter, cheese and ice cream, are reported in Table 5. For untreated SIC, the V/E ratios were as follows: margarine 1.00, butter 2.94, cheese 3.36, and ice cream 2.02 to 4.03. Based on the reported distribution profile of isomeric trans-C18:1, the concentrations of EA and VA in margarine were 23.7 and 13.4%, respectively (32), estimating a V/E ratio of be 0.57. However, for the butter, the concentrations of EA and VA were 1.04 and 4.37%, respectively (16), estimating V/E ratio to be 4.20. Ground beef showed EA and VA concentrations ranging from 0.23 to 0.24% and from 1.09 to 1.13%, respectively (25), estimating V/E ratio to ranging from 4.54 to 4.91. In cheese, EA and VA concentrations ranged from 0.34 to 0.35% and 3.64 to 3.71% (33), respectively estimating the V/E ratios of 10.41 and 10.60, respectively. These proportions align well with those reported in the literature (14), supporting the use of V/E ratios for discriminating of natural and hydrogenated TFAs.
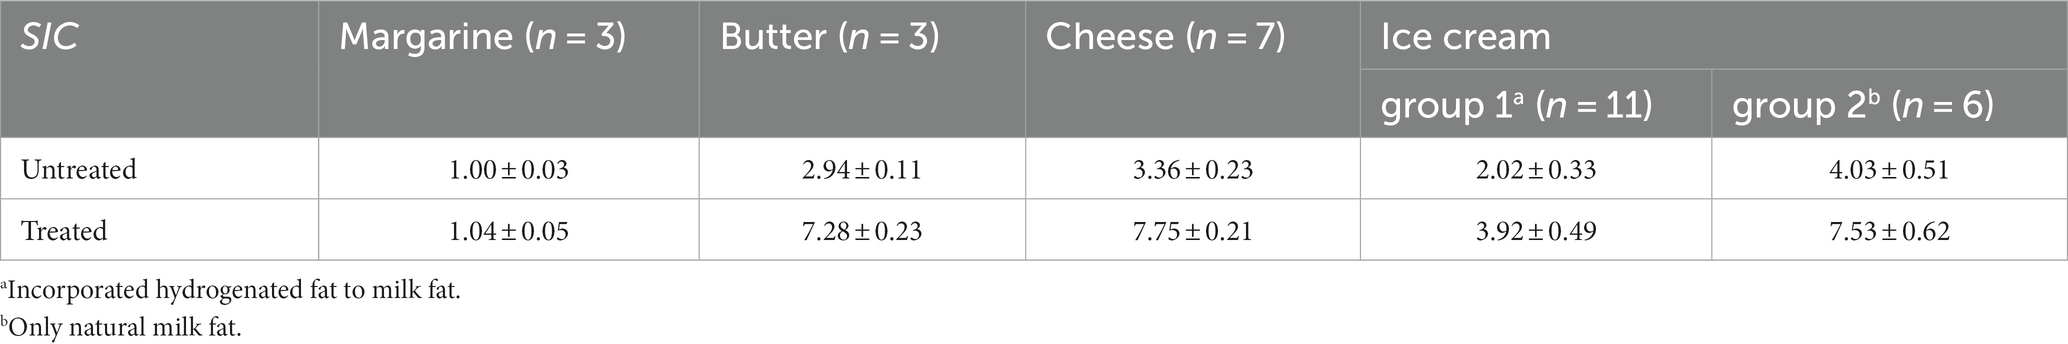
Table 5. The V/E ratio of margarine, butter, cheese, and ice creams.
On the other hand, for treated SIC, the V/E ratios were 1.04, 7.28, 7.75 and 3.92–7.53 for margarine, butter, cheese, and ice cream, respectively (Table 5). Cis-FAs removal using SIC treatment resulted in decreased amounts of trans-C18:1 and other isomers and increased VA, particularly 11 t2 and 11 t3, as shown in Figure 2. Thus, accurate estimation of V/E ratio requires the removal of cis-FAs from the test samples.
Table 5 presents the V/E ratios for two groups of ice cream treated with SIC. Margarine exhibited a V/E ratio of about 1.04, while cheese and butter had ratios of at least 7.2. Ice cream group 1 had a V/E ratio of 3.92, and the ice cream group 2 had a ratio of 7.53. A lower V/E ratio in some ice cream may indicate the addition of the hydrogenated fat. Therefore, ice cream group 1 appears to contain both natural and hydrogenated TFAs. The V/E ratio serves as a valuable tool for deducing the hydrogenated fat content in ice cream. VA, with its demonstrated bioactive properties commonly found in ruminant fats, can help discern between products using N-TFAs and those using H-TFAs or mixtures. The application of this methodology to processed foods enables the determination of added fats as natural TFAs, hydrogenated TFAs, or a combination, allowing for product differentiation.
In this study, a new method was developed by applying a SIC SPE method for cis-FAs removing so that accurate measurement of V/E ratios in food could be determined. The difference between V/E ratios applied with and without SIC was measured. Cis-FAs removal did not affect the analytical ratio of total TFAs, but it did affect the ratio of VA to EA. The accurate V/E ratio suggested in this study could be useful as scientific evidence and basic theory for evaluating new quality parameters of dairy and fatty foods. However, we have not yet precisely confirmed the properties of other TFA isomers excluding EA and VA, and further research is needed.
The original contributions presented in the study are included in the article/supplementary material, further inquiries can be directed to the corresponding authors.
MY: Writing – original draft, Conceptualization, Formal analysis. HL: Methodology, Validation, Writing – original draft, Data curation. K-WL: Supervision, Conceptualization, Funding acquisition, Writing – review & editing. DS: Conceptualization, Funding acquisition, Project administration, Supervision, Writing – original draft, Writing – review & editing.
The author(s) declare financial support was received for the research, authorship, and/or publication of this article. This research was supported by the Main Research Program (E0143033673) of the Korea Food Research Institute funded by the Ministry of Science and ICT.
The authors declare that the research was conducted in the absence of any commercial or financial relationships that could be construed as a potential conflict of interest.
All claims expressed in this article are solely those of the authors and do not necessarily represent those of their affiliated organizations, or those of the publisher, the editors and the reviewers. Any product that may be evaluated in this article, or claim that may be made by its manufacturer, is not guaranteed or endorsed by the publisher.
1. Pande, G, and Akoh, CC. Enzymatic synthesis of trans-free structured margarine at analogs with high stearate soy bean oil and palm stearin and their characterization. LWT-Food Sci. (2013) 50:232–9. doi: 10.1016/j.lwt.2012.05.027
2. Craig-Schmidt, MC. World-wide consumption of trans fatty acids. Atheroscler Suppl. (2006) 7:1–4. doi: 10.1016/j.atherosclerosissup.2006.04.001
3. Briard-Bion, V, Juaneda, P, Richoux, R, Guichard, E, and Lopez, C. Trans-C18:1 isomers in cheeses enriched in unsaturated fatty acids and manufactured with different milk fat globule sizes. J Agric Food Chem. (2008) 56:9374–82. doi: 10.1021/jf801333j
4. Mauger, JF, Lichtenstein, AH, Ausman, LM, Jalbert, SM, Jauhiainen, M, Ehnholm, C, et al. Effect of different dietary forms of dietary hydrogenated fats on LDL particle size. Am J Clin Nutr. (2003) 78:370–5. doi: 10.1093/ajcn/78.3.370
5. Chardigny, JM, Malpuech-Brugère, C, Dionisi, F, Bauman, DE, German, B, Mensink, RP, et al. Rationale and design of the TRANSFACT project phase I: a study to assess the effect of the two different dietary sources of trans fatty acids in cardiovascular risk factors in humans. Contemp Clin Trials. (2006) 27:364–73. doi: 10.1016/j.cct.2006.03.003
6. Precht, D, and Molkentin, J. Trans fatty acids: implications for health, analytical methods, incidence inedible fats and intake. Nahrung. (1995) 39:343–74. doi: 10.1002/food.19950390503
7. Judd, JT, Clevidence, BA, Muesing, RA, Wittes, J, Sunkin, ME, and Podczasy, JJ. Dietary trans fatty acids: effects of plasma lipids and lipoproteins of healthy men and women. Am J Clin Nutr. (1994) 59:861–8. doi: 10.1093/ajcn/59.4.861
8. Willett, WC. Trans fatty acids and cardiovascular disease-epidemiological data. Atheroscler Suppl. (2006) 7:5–8. doi: 10.1016/j.atherosclerosissup.2006.04.002
9. Zock, PL, and Katan, MB. Hydrogenation alternatives: effects of trans fatty acids and stearic acid versus linoleic acid on serum lipids and lipoproteins in humans. J Lipid Res. (1992) 33:399–410. doi: 10.1016/S0022-2275(20)41530-5
10. Miller, A, McGrath, E, Stanton, C, and Devery, R. Vaccenic acid (t11-18:1) is converted to c9,t11-CLAinMCF-7 and SW480 cancer cells. Lipids. (2003) 38:623–32. doi: 10.1007/s11745-003-1107-8
11. Field, CJ, Blewett, HH, Proctor, S, and Vine, D. Human health benefits of vaccenic acid. Appl Physiol Nutr Metab. (2009) 34:979–91. doi: 10.1139/H09-079
12. Banni, S, Angioni, E, Murru, E, Carta, G, Melis, MP, Bauman, D, et al. Vaccenic acid feeding increases tissue levels of conjugated linoleic acid and suppresses development of premalignant lesions in rat mammary gland. Nutr Cancer. (2001) 41:91–7. doi: 10.1080/01635581.2001.9680617
13. Wang, Y, Jacome-Sosa, MM, Ruth, MR, Goruk, SD, Reaney, MJ, Glimm, DR, et al. Trans-11 vaccenic acid reduces hepatic lipogenesis and chylomicron secretion in JCR: LA-cp rats. J Nutr. (2009) 139:2049–54. doi: 10.3945/jn.109.109488
14. Ha, J, Seo, D, and Shin, D. Determination of elaidic and vaccenic acids in foods using GC × GC-FID and GC × GC-TOFMS. Talanta. (2011) 85:252–8. doi: 10.1016/j.talanta.2011.03.053
15. Pipoyan, D, Stepanyan, S, Stepanyan, S, Beglaryan, M, Costantini, L, Molinari, R, et al. The effect of trans fatty acids on human health: regulation and consumption patterns. Foods. (2021) 10:2452. doi: 10.3390/foods10102452
16. Juanéda, P. Utilisation of reversed-phase high-performance liquid chromatography as an alternative to silver-ion chromatography for the separation of cis- and trans-C18:1 fatty acid isomers. J Chromatogr A. (2002) 954:285–9. doi: 10.1016/S0021-9673(02)00179-6
17. Kramer, JK, Hernandez, M, Cruz-Hernandez, C, Kraft, J, and Dugan, ME. Combining results of two GC separations partly achieves determination of all cis and trans 16:1, 18:1, 18:2 and 18:3 except CLA isomers of milk fat as demonstrated using ag-ion SPE fractionation. Lipids. (2008) 43:259–73. doi: 10.1007/s11745-007-3143-4
18. Villegas, C, Zhao, Y, and Curtis, JM. Two methods for the separation of monounsaturated octadecenoic acid isomers. J Chromatogr A. (2010) 1217:775–84. doi: 10.1016/j.chroma.2009.12.011
19. Amorim, TL, Duarte, LM, Dos Santos, HF, and de Oliveira, MAL. Screening method for simultaneous detection of elaidic and vaccenic trans fatty acid isomers by capillary zone electrophoresis. Anal Chim Acta. (2019) 1048:212–20. doi: 10.1016/j.aca.2018.10.057
20. Ramos-Payán, M, Ocaña-Gonzalez, JA, Fernández-Torres, RM, Llobera, A, and Bello-López, MÁ. Recent trends in capillary electrophoresis for complex samples analysis: a review. Electrophoresis. (2018) 39:111–25. doi: 10.1002/elps.201700269
21. Masci, M, Zoani, C, Nevigato, T, Turrini, A, Jasionowska, R, Caproni, R, et al. Authenticity assessment of dairy products by capillary electrophoresis. Electrophoresis. (2022) 43:340–54. doi: 10.1002/elps.202100154
22. Dreiucker, J, and Vetter, W. Fatty acids patterns in camel, moose, cow and human milk as determined with GC/MS after silver ion solid phase extraction. Food Chem. (2011) 126:762–71. doi: 10.1016/j.foodchem.2010.11.061
23. Hoker, J, Obersteiner, F, Bönisch, H, and Engel, A. Comparison of GC/time-of-flight MS with GC/quadrupole MS for halocarbon trace gas analysis. Atmos Meas Tech. (2015) 8:2195–206. doi: 10.5194/amt-8-2195-2015
24. Hytylinen, T, Kallio, M, Lehtonen, M, Lintonen, S, Perjoki, P, Jussila, M, et al. Comprehensive two-dimensional gas chromatography in the analysis of dietary fatty acids. J Sep Sci. (2004) 27:459–67. doi: 10.1002/jssc.200301674
25. Al-Jawaldeh, A, Taktouk, M, Chatila, A, Naalbandian, S, Abdollahi, Z, Ajlan, B, et al. A systematic review of trans fat reduction initiatives in the eastern Mediterranean region. Front Nutr. (2021) 8:771492. doi: 10.3389/fnut.2021.771492
26. Aldai, N, Dugan, MER, and Kramer, JKG. Can the trans-18:1 and conjugated linoleic acid profiles in retail ground beef be healthier than steak? J Food Compos Anal. (2010) 23:326–32. doi: 10.1016/j.jfca.2010.01.004
27. Domagala, J, Sady, M, Grega, T, Pustkowiak, H, and Florkiewicz, A. The influence of cheese type and fat extraction method on the content of conjugated linoleic acid. J Food Compos Anal. (2010) 23:238–43. doi: 10.1016/j.jfca.2009.11.002
28. Manzano, P, and Arnáiz, E. Juan Carlos Diego, Laura Toribio, Cristina García-Viguera, José Luis Bernal, José Bernal, comprehensive two-dimensional gas chromatography with capillary flow modulation to separate FAME isomers. J Chromatogr A. (2011) 30:4952–9. doi: 10.1016/j.chroma.2011.02.002
29. Marson, BM, Concentino, V, Junkert, AM, Fachi, MM, Vilhena, RO, and Pontarolo, R. Validation of analytical methods in a pharmaceutical quality system: an overview focused on HPLC methods. Química Nova. (2020) 43:1190–203. doi: 10.21577/0100-4042.20170589
30. European Commission. Commission decision 2002/657/EC of 12 august 2002 implementing council directive 96/23/EC concerning the performance of analytical methods and the interpretation of results. Off J Eur Communities. (2002):8–36. Available at: https://op.europa.eu/en/publication-detail/-/publication/ed928116-a955-4a84-b10a-cf7a82bad858/language-en/
31. Li, S, Xu, L, Qing, J, Wu, X, Li, H, Chen, H, et al. Multiple biological activities and biosynthesis mechanisms of specific conjugated linoleic acid isomers and analytical methods for prospective application. Food Chem. (2022):135257. doi: 10.1016/j.foodchem.2022.135257
32. Wolff, RL, Combe, NA, Destaillats, F, Boué, C, Precht, D, Molkentin, J, et al. Follow-up of the Δ4 to Δ16 trans-18:1 isomer profile and content in French processed foods containing partially hydrogenated vegetable oils during the period 1995–1999. Analytical and nutritional implications. Lipids. (2000) 35:815–25. doi: 10.1007/s11745-000-0590-2
Keywords: Vaccenic acid, elaidic acid, silver ion cartridge, GC × GC-TOFMS, trans fatty acids
Citation: Yoo M, Lee HJ, Lee K-W and Seo D (2024) Analysis of Vaccenic and Elaidic acid in foods using a silver ion cartridge applied to GC × GC-TOFMS. Front. Nutr. 10:1320550. doi: 10.3389/fnut.2023.1320550
Edited by:
Charalampos Proestos, National and Kapodistrian University of Athens, GreeceReviewed by:
Carlos F. Torres, Autonomous University of Madrid, SpainCopyright © 2024 Yoo, Lee, Lee and Seo. This is an open-access article distributed under the terms of the Creative Commons Attribution License (CC BY). The use, distribution or reproduction in other forums is permitted, provided the original author(s) and the copyright owner(s) are credited and that the original publication in this journal is cited, in accordance with accepted academic practice. No use, distribution or reproduction is permitted which does not comply with these terms.
*Correspondence: Kwang-Won Lee, a3dhbmd3b25Aa29yZWEuYWMua3I=; Dongwon Seo, ZHdzZW9Aa2ZyaS5yZS5rcg==
Disclaimer: All claims expressed in this article are solely those of the authors and do not necessarily represent those of their affiliated organizations, or those of the publisher, the editors and the reviewers. Any product that may be evaluated in this article or claim that may be made by its manufacturer is not guaranteed or endorsed by the publisher.
Research integrity at Frontiers
Learn more about the work of our research integrity team to safeguard the quality of each article we publish.