- Laboratory of Nutrition and Development, Key Laboratory of Major Diseases in Children, National Center for Children’s Health, Ministry of Education, Beijing Pediatric Research Institute, Beijing Children’s Hospital, Capital Medical University, Beijing, China
Background: This study determined the effects of the paternal dietary ratio of n-6: n-3 polyunsaturated fatty acids (PUFAs) on leptin expression in the offspring and associated gene imprinting in a mouse model.
Methods: Three- to four-week-old male C57BL/6J mice (F0) were fed an n-3 PUFA-deficient (n-3 D) diet, a diet with normal n-3 PUFA content (n-3 N; n-6: n-3 = 4.3:1), or a diet with a high n-3 PUFA content (n-3 H; n-6: n-3 = 1.5:1) for 8 weeks. Two subsequent generations were generated by mating F0 and F1 male mice with 10-week-old virgin female C57 BL/6J mice, to produce F1 and F2 offspring.
Results: Compared to the paternal n-3 D diet, paternal n-3 N and n-3 H diets reduced adipose mRNA expression of leptin (Lep) and its plasma concentrations in juvenile F1 male and female offspring, and adult F1 male and F2 female offspring, with upregulated Lep receptor mRNA expression in the hypothalamus. Meanwhile, paternal n-3 N and n-3 H diets altered the expression of the imprinted genes H19, Igf2, Igf2r, Plagl1, Cdkn1c, Kcnq1ot1, Peg3, and Grb10 in the adipose tissue of juvenile and adult F1 males, with almost no effects on F1 females, while more effects were observed in the adult F2 females than F2 males. Principal component analysis verified that Plagl1, Cdkn1c, and Kcnq1ot1 contributed the most to variation in adipose tissue expression in all offspring. Some of these genes (Plagl1, Cdkn1c, Kcnq1ot1, Peg3, and Grb10) were altered by the paternal n-3 N and n-3 H diets in the F1 and F2 generation testes as well. Furthermore, adipose Lep expression was positively correlated with expressions of H19, Igf2r, Plagl1, and Kcnq1ot1 in juvenile F1 males and females, negatively correlated with the Kcnq1ot1 expression in adult F1 males, and positively correlated with the Plagl1 expression in adult F2 females.
Conclusion: These data imply that paternal Plagl1, Cdkn1c, and Kcnq1ot1 might be part of the pathways involved in offspring leptin programming. Therefore, a lower ratio of n-6: n-3 PUFAs, with higher intake of n-3 PUFAs in paternal pre-conception, may help maintain the offspring’s optimal leptin pattern in a sex-specific manner through multiple generations, and thereby, be beneficial for the offspring’s long-term health.
1 Introduction
The fetal programming and developmental origins of health and disease hypotheses suggest that environmental factors in early life can alter the phenotype and health of offspring in later life (1, 2). Over the past decade, increasing evidence has shown that not only the maternal nutritional status, but also the pre-conceptional diet modifications in fathers, whether it be excess or restriction of nutrients, lead to negative pregnancy outcomes, metabolic changes in the progeny, and/or long-term consequences (3–5). Both maternal and paternal effects can be carried beyond the F1 generations and transferred across multiple generations, from the parents (F0) to the grandoffspring (F2/F3 and beyond), and are thus termed transgenerational effects (6). Meanwhile, sex-specific, male-line transgenerational responses to paternal nutrition and the environment have been observed in populations and animal models. For example, early paternal smoking has been found to be associated with greater body mass index in sons, but not in daughters, and the mortality risk ratios of grandsons are influenced by the diet of their paternal grandfather, while those of the granddaughters are influenced by the diet of their paternal grandmother (7, 8). Kaati et al. found that during the slow growth period, the paternal grandmother’s exposure to famine was associated with lower cardiovascular causes of death, whereas the paternal grandfather’s exposure to a surfeit of food was related to increased diabetes mortality in grandchildren (9). Thereafter, multigenerational studies have provided evidence that transgenerational inheritance can persist in a lineage-specific (to F2s, via either the paternal or maternal lineage) and/or sex-specific (to only male or female F2s) fashion, through multiple generations (10–14).
Identification of the obesity gene-encoded leptin in 1994 and characterization of its function as a major appetite suppressant are landmarks in obesity, endocrinology, and metabolism research (15, 16). Leptin is primarily synthesized and secreted by the adipose tissue, with the stomach, skeletal muscle, and liver also contributing to small amounts. It functions as an extensive modulator in the metabolism of various systems and inflammation (17), beyond its role in maintaining energy homeostasis and body fat at levels required for both the central nervous and peripheral systems, by acting on the leptin receptor (18, 19). At low or moderate levels, leptin supports physiological roles, but chronically higher doses exhibit detrimental effects on various systems (17). In most cases, circulating leptin levels are elevated in obese subjects, who are believed to develop leptin resistance, which is characterized by the reduced ability of leptin to suppress appetite and weight gain (19, 20). Recently, it has been reported that maintaining lower levels of leptin expression in animal adulthood protects against high-fat-induced obesity and associated metabolic disorders, and increases sensitivity to exogenous leptin (21, 22). In addition, in the early stages of life, maintenance of the optimal expression pattern and trajectory of leptin and leptin sensitivity is of vital importance for the development of central and peripheral systems involved in energy homeostasis and brain development, and thus, is helpful for the prevention of chronic metabolic and neurodegenerative diseases in later life (23–28).
Several food components, such as phenols, peptides, vitamins, and n-3 polyunsaturated fatty acids (n-3 PUFAs), can improve leptin sensitivity, by upregulating or downregulating leptin signaling molecules and reducing inflammation (29). Maternal supplementation with n-3 PUFAs during pregnancy and the balance between n-6 and n-3 PUFAs (lower ratio of n-6: n-3 PUFAs) generally reduces leptin expression and its circulating level, through epigenetic modification of the gene promoter in young and adult offspring of both animals and humans, which may be beneficial for later health; however, conclusions in this respect have not been consistent (30–36). It has been demonstrated that mammalian spermatozoa are characterized by a high proportion of PUFAs, particularly docosahexaenoic acid (DHA, C22: 6n-3), and that increased intake of n-3 PUFAs in men, either as supplements or from foods, appears to have a positive effect on spermatogenesis, with higher sperm motility, normal morphology, and concentration (37–39). However, little is known about the impact of paternal n-3 PUFA status on the pre- and postnatal growth and development of offspring and their later health.
Epigenetic modifications of target genes in somatic or germline cells are key pathways that mediate the effects of parental nutrition on offspring development and health in intergenerational and transgenerational transmission (3–5, 40). Sperm epigenetic status (DNA methylation, histone modifications, and RNA methylation) and microRNA content are modulated by poor paternal peri-conceptional nutrition, which are potential signals that program offspring health and initiate the transmission of obesity, glucose intolerance, impaired vascular function, and non-alcoholic fatty liver disease to future generations (12, 41, 42). Gene imprinting, a process that reversibly marks one of the two homologous loci, chromosome/chromosomal sets, and functional non-equivalence of gene expression, plays an important role in modulating fetal-placental growth and resource acquisition, postnatal growth and energy homeostasis, and transgenerational inheritance (43–45). Abnormalities in imprinting genes, caused by mutations, deletions, and epigenetic aberrations, can result in the loss of imprinting and imprinting disorders such as complex syndromes of neurodevelopmental disabilities, cognitive problems, and metabolic diseases (46). In addition, imprinted gene products act at multiple levels in the adipose-hypothalamic axis, to modulate set-points of energy homeostasis, by altering leptin expression and the sensitivity of neuroendocrine pathways to leptin (43).
With respect to the association between gene imprinting and leptin, it has been reported that the products of Mest and Grb10 promote leptin production or leptin signaling, whereas those of Cdkn1c, Dlk1, H19, Peg3, and Magel2 can suppress leptin production or its actions (47–51). Specifically, Mest-knockout mice show lighter body weight with reduced adiposity (48), whereas diet-induced or genetically obese mice display enhanced expression of Mest in the white adipose tissue, and ectopic expression of Mest increases the expression of leptin and other adipose markers such as peroxisome proliferator-activated receptor γ (PPARγ), CCAAT/enhancer binding protein α and adipocyte fatty acid binding protein 2, with enlarged adipocytes (52). Grb10 encodes an intracellular signaling adaptor protein that restricts fetal growth and is permissive of adipose deposition in adulthood, with increased leptin levels (53, 54). Moreover, offspring Grb10 suppresses the development of lean mass, whereas the offspring fat mass is promoted by Grb10 expressed in the mother and acts on postnatal nutrient supply, jointly promoting optimal offspring body proportions (49). In contrast, the lack of Peg3, which encodes a zinc finger protein, leads to growth retardation in early life and increases adiposity in adult males, with increased leptin expression (47, 55). Dlk1, known to play a crucial role in adipose homeostasis, promotes fetal growth and restricts adipose deposition and leptin expression in adults (53, 56–58). Mice lacking Dlk1 display pre- and postnatal growth retardation, followed by a catching up in body weight, at approximately 90 d for females and 65 d for males, with increased leptin expression (53, 56, 57), whereas overexpression of Dlk1 causes a shift in the metabolic mode of the organism toward peripheral lipid oxidation and away from lipid storage, with downregulation of leptin expression (58). Similarly, Magel2-null pups endure growth retardation after birth, equalize their mean weight to wild-type levels at a young age, and subsequently gain more weight than their wild-type littermates in adulthood, with a higher plasma leptin level (59), due to decline in leptin sensitivity (60). Although their contribution to leptin expression has not been reported, Plagl1, Cdkn1c, and Kcnq1ot1 have been found to be involved in adiposity and obesity (61–68), implying that they may impact leptin expression in the adipose tissue. Beyond its association with metabolic, genetic, and neoplastic illnesses through multiple pathways (61), Plagl1 has been found to be highly expressed in the white adipose tissue of adult rats, as compared to the other organs and tissues, and has a positive correlation with PPARγ and fatty acid binding protein 4 (62). Increased expression of Cdkn1c causes the child growth-restriction disorders, Silver–Russell and IMAGe syndromes, while loss of its function causes the overgrowth disorder Beckwith–Wiedemann syndrome (63, 64). Using a transgenic mouse model, Vega-Benedetti et al. found that overexpression of Cdkn1c during development protects against age- and diet-induced obesity, by promoting brown adipose tissue formation, with reduced adiposity (65, 66). The expression of Kcnq1ot1 is downregulated in the mouse cartilage tissue of osteoarthritis and islets in high-fat-induced obesity, and knockdown of Kcnq1ot1 in vivo reduces glucose tolerance and insulin secretion (67, 68).
Therefore, it is of great interest to determine whether the dietary ratio of n-6: n-3 PUFAs in paternal pre-conception can affect offspring leptin expression and associated growth and development, with transgenerational transmission. In the present study, using a mouse model that received feeding intervention, we investigated the effects of pre-conception n-3 PUFA supplementation in the father (F0) on leptin expression in the offspring (F1 and F2) and associated gene imprinting.
2 Materials and methods
2.1 Animals and diets
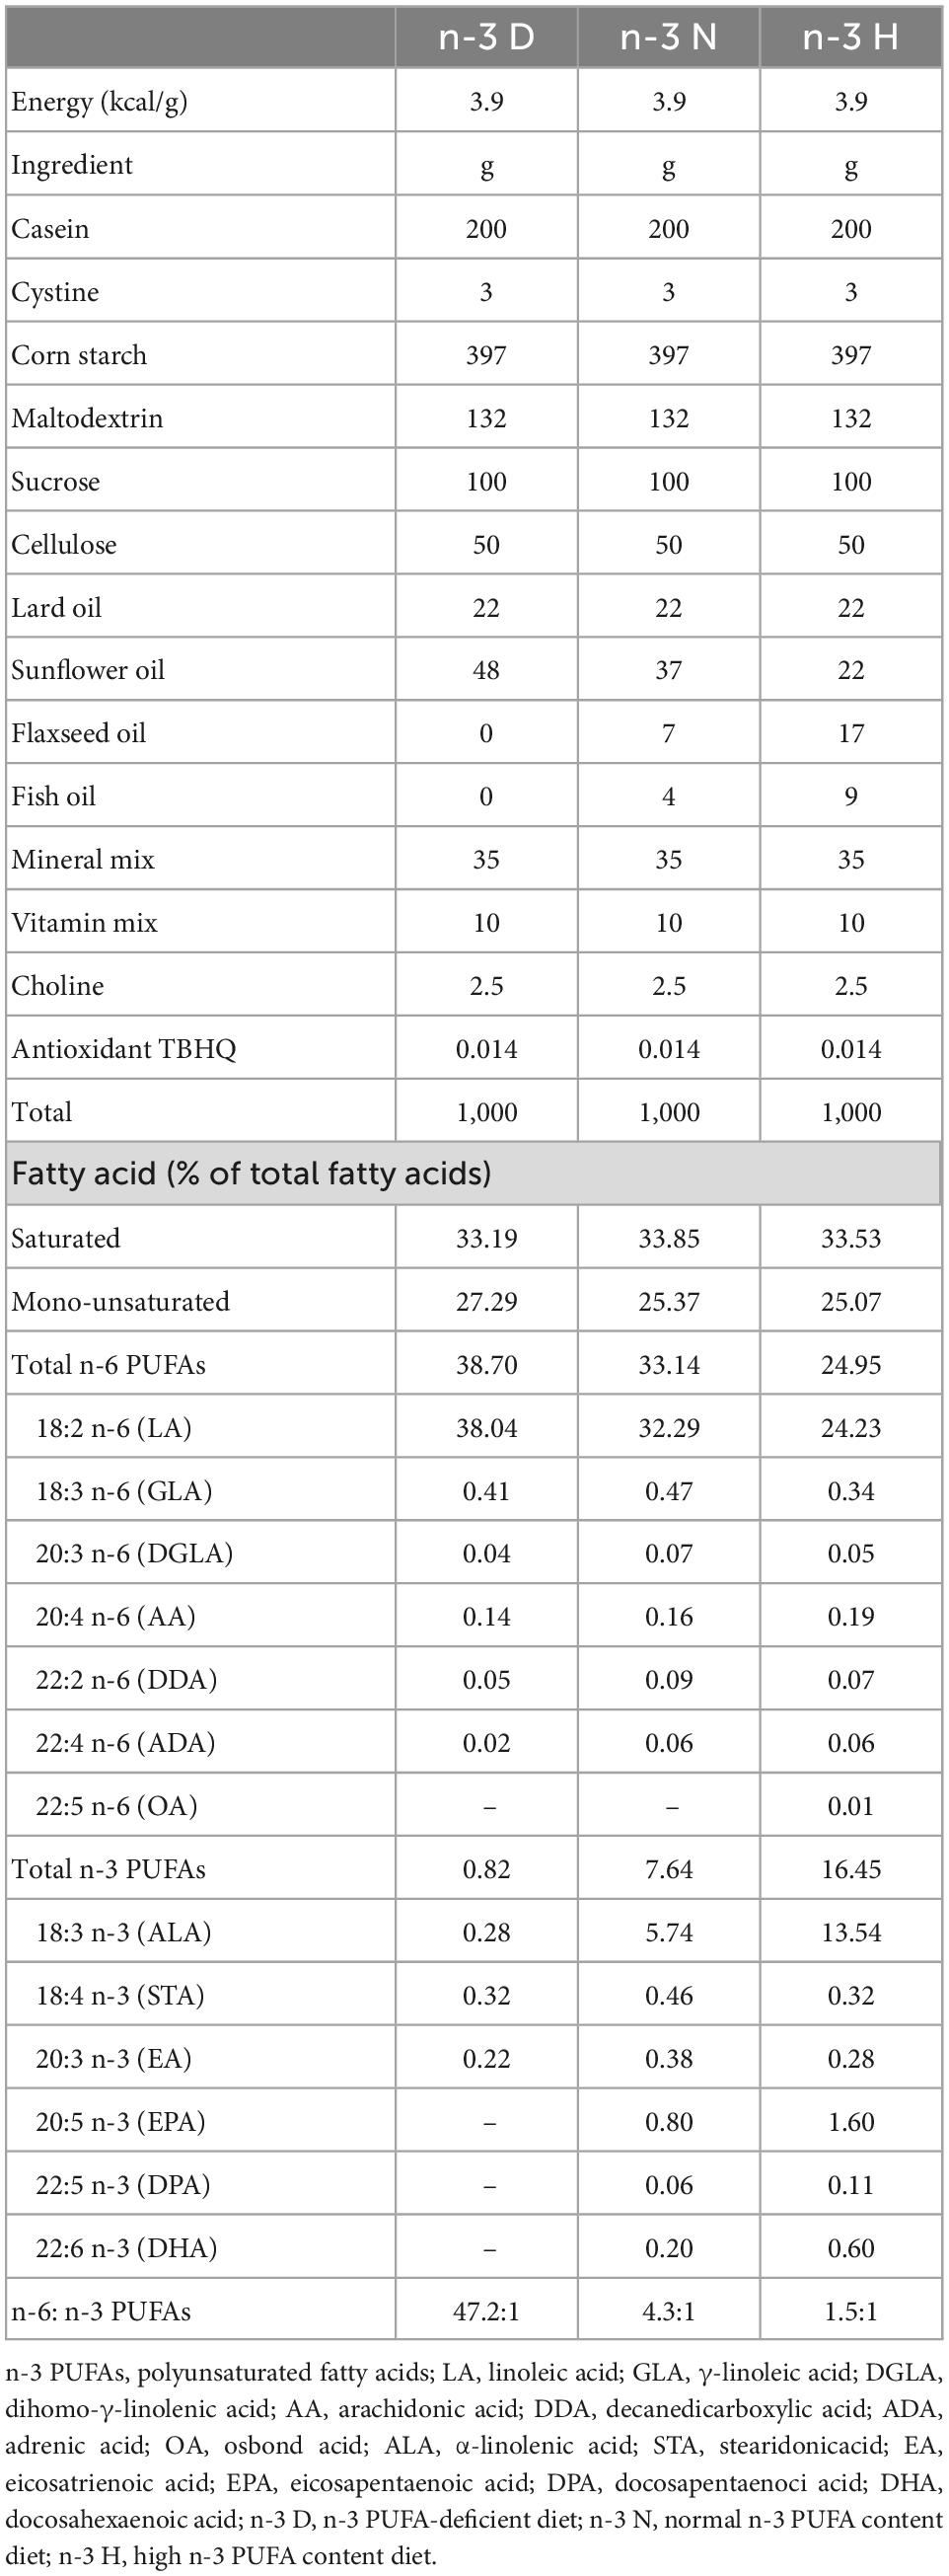
All experiments complied with the ARRIVE guidelines, and all procedures were conducted in accordance with the Animals (Scientific Procedures) 1986 Act (UK) (amended 2013) and the Guide for the Care and Use of Laboratory Animals in China and approved by the Ethics Committee of the National Institute of Occupational Health and Poison Control, China CDC (Beijing, China) (approval no. EAWE-2021-06). Three- to four-week-old male C57BL/6J mice were purchased from Beijing Si Pei Fu Biotechnology Co., Ltd. (Beijing, China) and housed at the animal facilities of the National Institute of Occupational Health and Poison Control, China CDC, under specific pathogen-free grade conditions. These founder (F0) mice were provided one of three diets, an n-3 PUFA-deficient (n-3 D) diet, a diet with normal n-3 PUFA content (n-3 N) and an n-6: n-3 ratio of 4.3:1, or a diet with high n-3 PUFA content (n-3 H) and an n-6: n-3 ratio of 1.5:1, for 8 weeks. The diets were designed by modifying the fat type to generate different n-3 PUFA contents, as previously described (69). The diet formula for the fat content and fatty acid composition is shown in Table 1. All diets were manufactured by Beijing Huafukang Bioscience Co., Ltd. (Beijing, China), and stored at −20°C before use.
In case of the n-3 D diet, lard oil and sunflower oil were added to make the diet n-3 PUFA-deficient, with an n-6: n-3 PUFA ratio of 47.2:1. In case of the n-3 N and n-3 H diets, flaxseed and fish oils (the main sources of n-3 PUFAs) were combined with sunflower oil to yield two different n-6: n-3 PUFA ratios of 4.3:1 and 1.5:1, respectively, which represent the recommended ratio (4–10:1) and ratio in our ancestors’ diet (1–2:1), respectively, containing both longer-chain n-3 PUFAs, such as eicosapentaenoic acid (EPA; C20:5n-3) and DHA, and their precursor α-linolenic acid (ALA, C18:3n-3) (70, 71). The n-3 N and n-3 H diets contained ALA longer-chain n-3 PUFAs, at concentrations of 7.64 and 16.45% of the total fatty acids, respectively, equivalent to 1.20 and 2.59% of the total energy (TE), respectively. The dose of n-3 PUFAs is reasonably achievable in humans, within the range of minimum and safe values. The World Health Organization recommends that the total n-3 PUFA intake can range between 0.5 and 2% TE, whereas the minimum dietary requirement of ALA (>0.5% TE) for adults prevents deficiency symptoms and a higher value of 2% TE (ALA) plus EPA and DHA (0.250–2.0 g) can be part of a healthy diet. Reference values in Australia, New Zealand, and US (by the Food and Drug Administration) for the upper and safe intake of EPA plus DHA have been set at 3 g/d (72). In Eskimos, the average intake of n-3 PUFAs obtained mostly from fish oils is approximately 5% of the TE (73).
2.2 Animal procedure
A diagrammatic representation of the study design and offspring generation is provided in Figure 1. After 8 weeks of feeding intervention, F0 mice (n = 10 per group) were mated with 12-week-old virgin female normal-weight naturally cycling C57BL/6J mice (one male for two females per cage), to produce F1 offspring. For production of the F2 generation, 12-week-old F1 males (n = 6 per group; each from separate litters) were mated naturally with 12-week-old virgin female C57BL/6 mice. In the case of males in which an epigenetic change is induced, the founder (F0) and his germline (future F1) are exposed; F1 is thus considered intergenerational, and F2 and subsequent generations are considered transgenerational (74). Therefore, in this study, the F2 generation was used to identify evidence of transgenerational inheritance. The mating female mice were fed AIN-93G diet (H10293G) throughout gestation and the 3 weeks of lactation, whereas all F1 and F2 offspring received the AIN-93M diet (H10293M) (Beijing Huafukang Bioscience Co., Ltd.) after weaning and water ad libitum throughout the study. At the end of the experiments, using intraperitoneal injection of avertin (2,2,2-tribromoethanol) (T-4840-2, Aldrich Chemical, Co., Inc., Milwaukee, USA) (125 mg/kg) for anesthesia followed by decapitation, F0 male mice after mating, F1 offspring at either 4 weeks (juvenile; n = 6 in each group) or 16 weeks (adult; n = 8 in each group) of age, and F2 offspring (n = 8 in each group) at 16 weeks of age were sacrificed. Each of the F1 or F2 mice in each diet group were from separate litters, to avoid being born from the same father. Blood samples were obtained via heart puncture, mixed with EDTA as an anticoagulant, and centrifuged at 3,000 rpm (4°C for 15 min), following which the plasma was aliquoted and stored at –80°C. Two cauda epidydimuses were collected from each F0 male mouse, cut three times, placed in a 1.5 mL eppendorf tube with 1 mL of Whittens-HEPES media (1 mM chlortetracycline, 20 mM Tris, 130 mM NaCl, and 5 mM cysteine, pH 7.2–7.4), and incubated at room temperature for 30 min (to allow the sperm to swim out). Sperms were centrifuged 300 × g for 5 min and washed twice with Whittens-HEPES medium. For the sperm count, a solution containing sperm was placed in the chamber of a Neubauer hemocytometer (depth: 0.100 mm; area: 0.0025 mm2), and the cells were counted under a light microscope (CX41RF, Olympus Corporation, Tokyo, Japan), at 400 × magnification. Two hemocytometers were used per animal, and 20 squares from a total of 100 squares were measured. After sacrifice, the epididymal fat, testis, and hypothalamus were immediately dissected free of the surrounding tissue, removed, frozen in liquid N2, and then transferred to -80°C until further use.
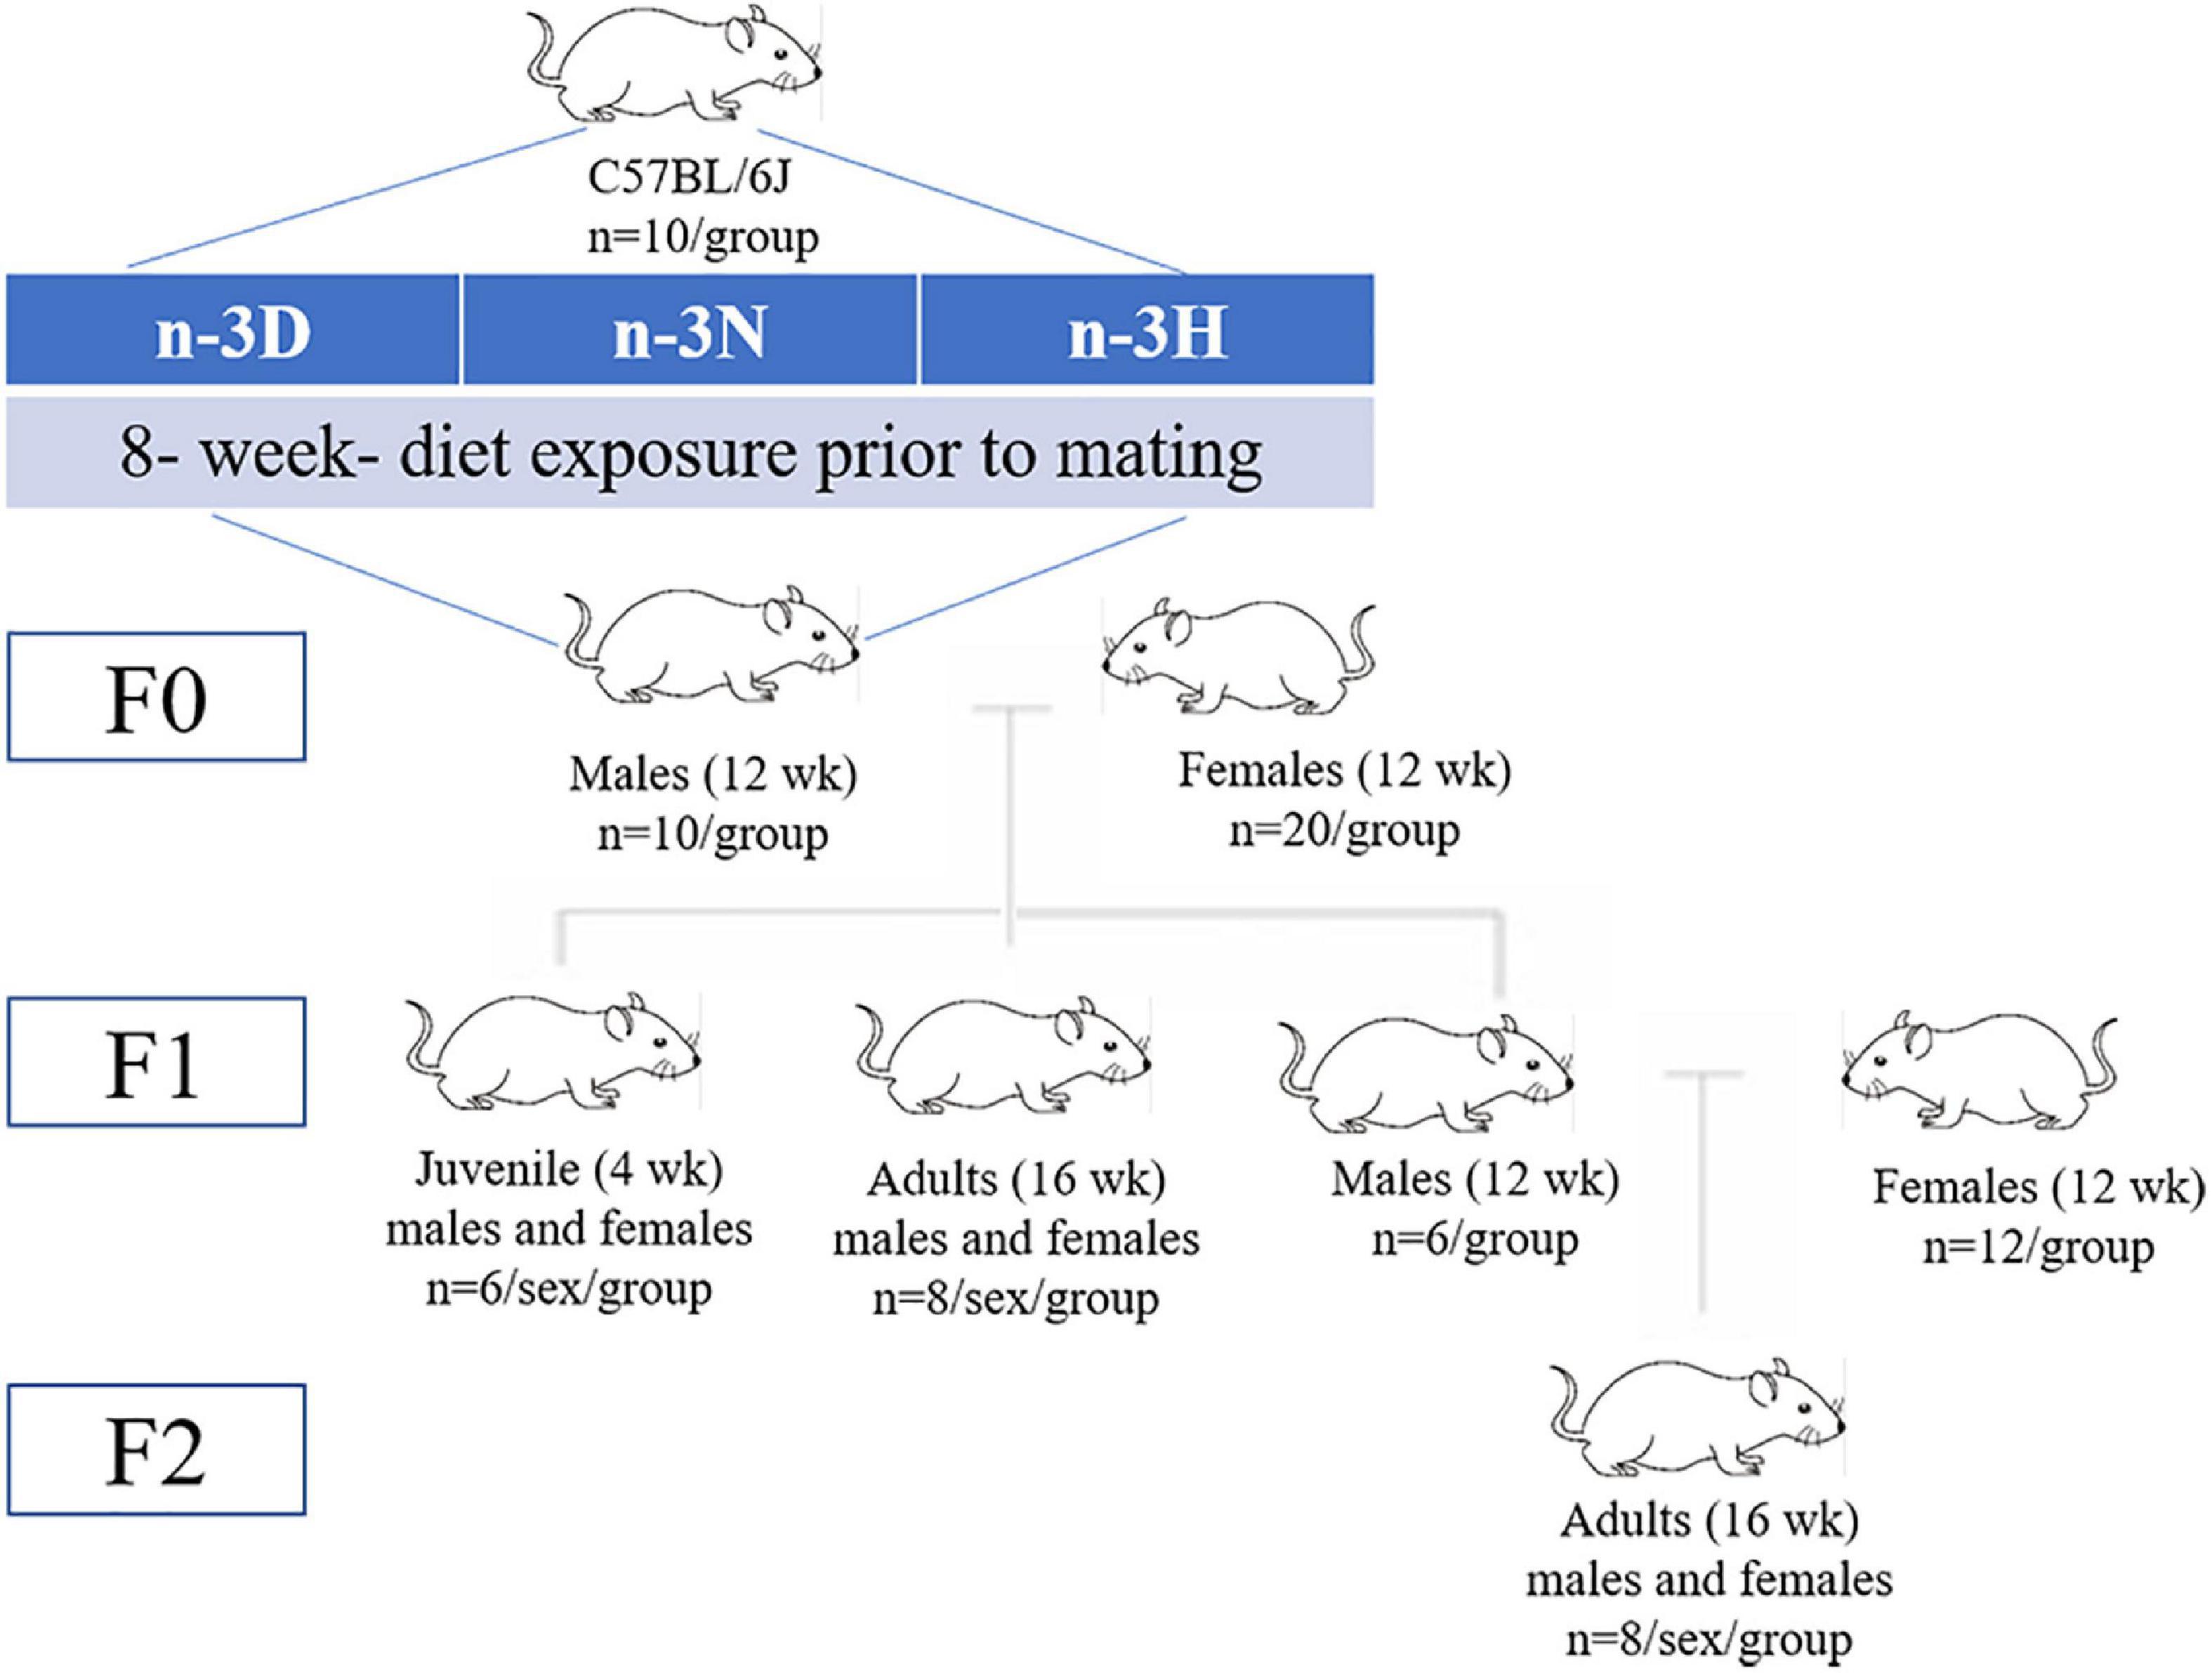
Figure 1. Schematic overview of the study design. Founder (F0) male mice were allocated either an n-3 polyunsaturated fatty acid (n-3 PUFA)-deficient (n-3 D) diet, a diet with normal n-3 PUFA content (n-3 N with an n-6: n-3 PUFA ratio at 4.3:1), or a diet with a high n-3 PUFA content (n-3 H with an n-6: n-3 PUFA ratio of 1.5:1) for 8 weeks. After 8 weeks of feeding intervention, the F0 mice were mated with 12-week-old virgin female normal-weight naturally cycling C57BL/6J mice (1 male for 2 females per cage), to produce F1 offspring. For production of the F2 generation, 12-week-old F1 males (each from separate litters) were mated naturally to 12-week-old virgin female C57BL/6 mice.
2.3 Estimation of plasma parameters
Mouse plasma leptin concentrations were estimated using the Mouse/Rat Leptin Quantikine® ELISA Kit (MOB00B, R&D Systems, Minneapolis, MN, USA). The minimum detectable dose of mouse and rat leptin was in the range of 1.28–5.56 pg/mL. Recombinant human leptin cross-reacts by approximately 0.09% and interferes at concentrations > 10 ng/mL. Concentrations of plasma triglyceride and total cholesterol were assayed using the enzymatic procedures, gliseril phospo para amino phenazone and cholesterol oxidase p-aminophenol, respectively, with commercial kits (CH0101151 and CH0101152, Sichuan Maccura Science Tech. Co., Ltd., Chengdu, China). Plasma insulin concentrations were determined using the Mouse Insulin ELISA Kit (H203-1-2), while plasma glucose concentrations were tested using glucose oxidase method, with the GLU Kit (A154-1-1) (NanJing JianCheng Bioengineering Institute, Nanjing, China).
2.4 Fatty acid determination
The fatty acids in the F0 testis tissue were analyzed using gas chromatography, on a 6890N GC System (Agilent Technologies, Inc., Santa Clara, CA, USA) equipped with a flame ionization detector and injector, using the fatty acid methyl esters (FAMEs) method, as previously described (69, 75). The separation of FAMEs was conducted on an high resolution gas chromatography column (100 m 0.25 mm id 0.2 μm DB, P/N 112-88A7, HP-88) (Agilent Technologies, Inc.). The tissue fatty acid data were expressed as the percent (%) (wt/wt) of total fatty acids.
2.5 Analysis of mRNA expression
Total RNA extraction was performed using 80 mg of epididymal fat or 20 mg of testis or hypothalamus, with the RNAiso Plus Kit (9109, Takara Bio. Inc., Kusatsu Shiga, Japan), and then reverse transcribed to cDNA using the RT Kit (AT341-02, TransGen Biotech Co., Ltd., Beijing, China), according to the manufacturer’s instructions. The mRNA expression of targeted genes, including adipokines, leptin (Lep), adiponectin (Adipoq), and resistin (Retn), leptin receptor (Lepr), growth- and development-associated imprinted genes (H19, Igf2, Igf2r, Plagl1, Cdkn1c, Kcnq1ot1, Mest, Peg3, Dlk1, Grb10, and Magel2), and epigenetically modifying enzymes, DNA methyltransferase (Dnmts; Dnmt1, Dnmt2, Dnmt3a, Dnmt3b, and Dnmt3l) and histone deacetylases (Hdacs; Hdac1, Hdac2, Hdac3, Hdac6, and Hdac9), was measured using real-time qPCR with a CFX96 Touch™ Real-Time PCR Detection System (Bio-Rad Laboratories, Inc., Hercules, CA, USA) and the Top Green qPCR SuperMix (AQ131-04, TransGen Biotech Co., Ltd.). Ribosomal protein large P0 (Rplp0), or glyceraldehyde-3-phosphate dehydrogenase (Gapdh) was used as the internal control. The expression levels of the targeted genes were normalized to those of the internal reference gene using the 2–ΔCT method. The designed oligonucleotide primers for the targeted genes were verified using Primer-Blast,1 synthesized by Sangon Biotech (Shanghai) Co., Ltd. (Shanghai, China), as indicated in Supplementary Table 1.
2.6 Bisulfite conversion and sequencing
DNA methylation in the Lep promoter and differentially methylated regions (DMRs) of imprinted genes were analyzed using bisulfite sequencing, according to our previous method (35). Genomic DNA was isolated and purified from epididymal fat using an Animal Tissue DNA Kit (Simgen Biotechnology Co., Ltd., Hangzhou, China), while bisulfite modification was performed using an EZ DNA Methylation™ Kit (D5002, Zymo Research, Orange County, CA, USA). The converted DNA was amplified using nested PCR on a ETC811 Thermal Cycler (Eastwin Scientific Equipments Inc., Suzhou, China), with the Taq DNA Polymerase Master Mix (KT201, Tiangen Biotech Inc., Beijing, China) and specific primers for the Lep promoter and DMRs of the four altered imprinted genes (H19, Igf2, Plagl1, and Kcnq1ot1), which were designed using Methprimer software (The Li Lab, Peking Union Medical College Hospital, Chinese Academy of Medical Sciences) (Supplementary Table 2). The examined promoter regions of Lep and DMRs of the imprinted genes are listed in Supplementary Figure 1. The product DNA sequencing was performed using the method of Sanger sequencing (76) with Applied BiosystemsrmTM ABI3730xl DNA Analyzer (Thermo Fisher Scientific, Waltham, MA, USA), by BGI Tech Solutions (Beijing Liuhe) Co., Ltd. (Beijing, China). Briefly, the single band of the product was confirmed by gel electrophoresis, and polymerase enzymes, unbound primers, and other impurities in the product were eliminated. Then, the sequencing reaction was conducted with the appropriate concentration and ratio between primers and sequencing target. After purification and quantification, the targeted amplicon was loaded on plate using capillary separation for cycle sequencing. The methylation fraction was calculated from the amplitude of cytosine and thymine within each CpG dinucleotide, C/(C + T), as described by Feskens et al. (77).
2.7 Statistical analysis
All statistical analyses were conducted using SPSS for Windows (version 21.0, IBM Corp., Armonk, NY, USA). One-way analysis of variance was used to compare the means in different groups when the data were normally distributed. Following analysis of variance, a post hoc test, either the Bonferroni or Dunnett’s T3 test, was conducted for data lacking homogeneity of variance. The Kolmogorov–Smirnov test was used to evaluate whether the data were normally distributed, whereas the Kruskal–Wallis test was used for non-normally distributed data. Linear relationships between the variables were tested using Spearman’s correlations. Principal component analysis (PCA) was performed to determine the major variability patterns of the imprinted genes between the different n-3 PUFA diet groups. Statistical significance was set at P < 0.05.
3 Results
3.1 Effects of paternal n-3 PUFAs on body weight and reproduction
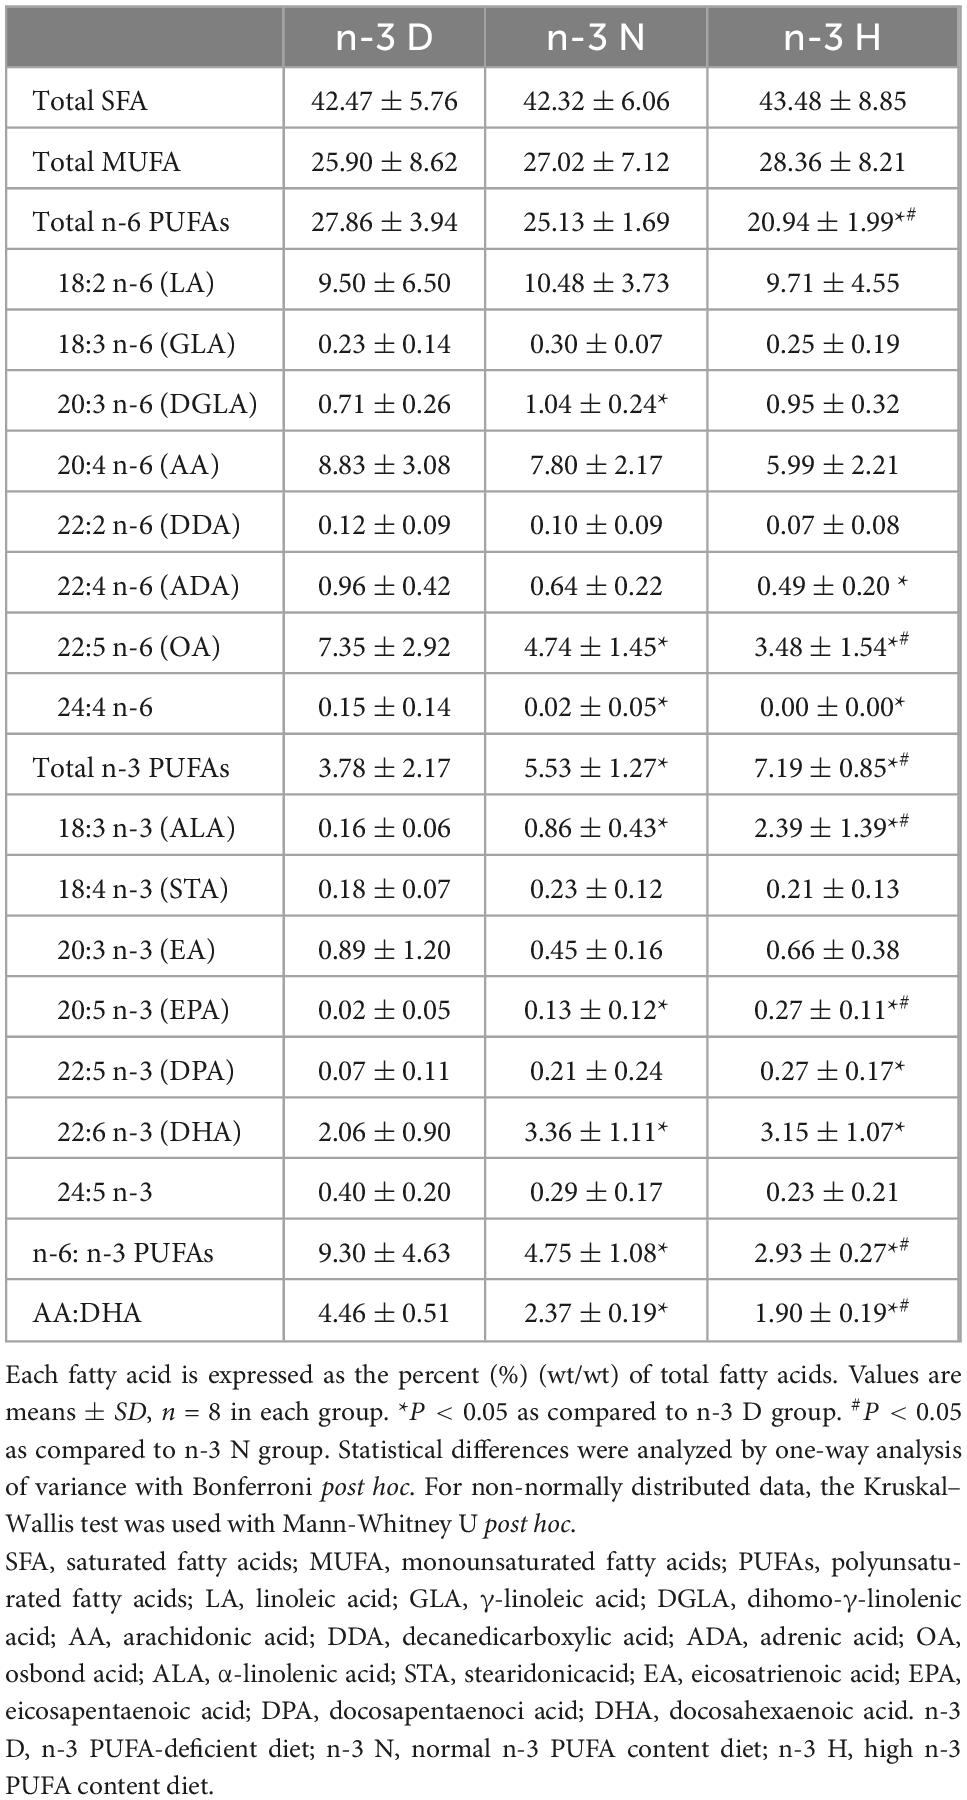
As shown in Table 2, fathers fed either the n-3 N or n-3 H diet did not show any changes in their body weight and energy intake. They had increased sperm counts and vitality, with no alterations in litter size and sex ratio in either F1 or F2 offspring. Testis fatty acid analysis showed that the n-3 N and n-3 H diets increased the concentrations of total n-3 PUFAs, EPA, and DHA, with reduced ratios of n-6: n-3 PUFAs and AA:DHA. Furthermore, the effects of the n-3 H diet on testis fatty acids were greater than the n-3 N diet (Table 3).
3.2 Effects of paternal n-3 PUFAs on offspring Lep expression
As shown in Figure 2, as compared to the n-3 D diet, the paternal n-3 N and n-3 H diets downregulated adipose mRNA expression of Lep in the juvenile F1 males and females, while only adult F1 males (but not females) and adult F2 females (but not males) had downregulated Lep expression in the adipose tissue, with upregulated Lepr expression in the hypothalamus. Consistently, plasma concentrations of leptin in the juvenile F1 offspring (both male and female) and adult F1 males and F2 females were reduced by the paternal n-3 N and n-3 H diets (Table 4). No differences in the adipose expression of Adipoq and Retn were observed among the three paternal diet groups, either in the F1 or F2 offspring (Figure 2). Moreover, the plasma concentrations of total cholesterol, triglycerides, glucose, and insulin were not different among the three paternal diet groups in the offspring (Table 4).
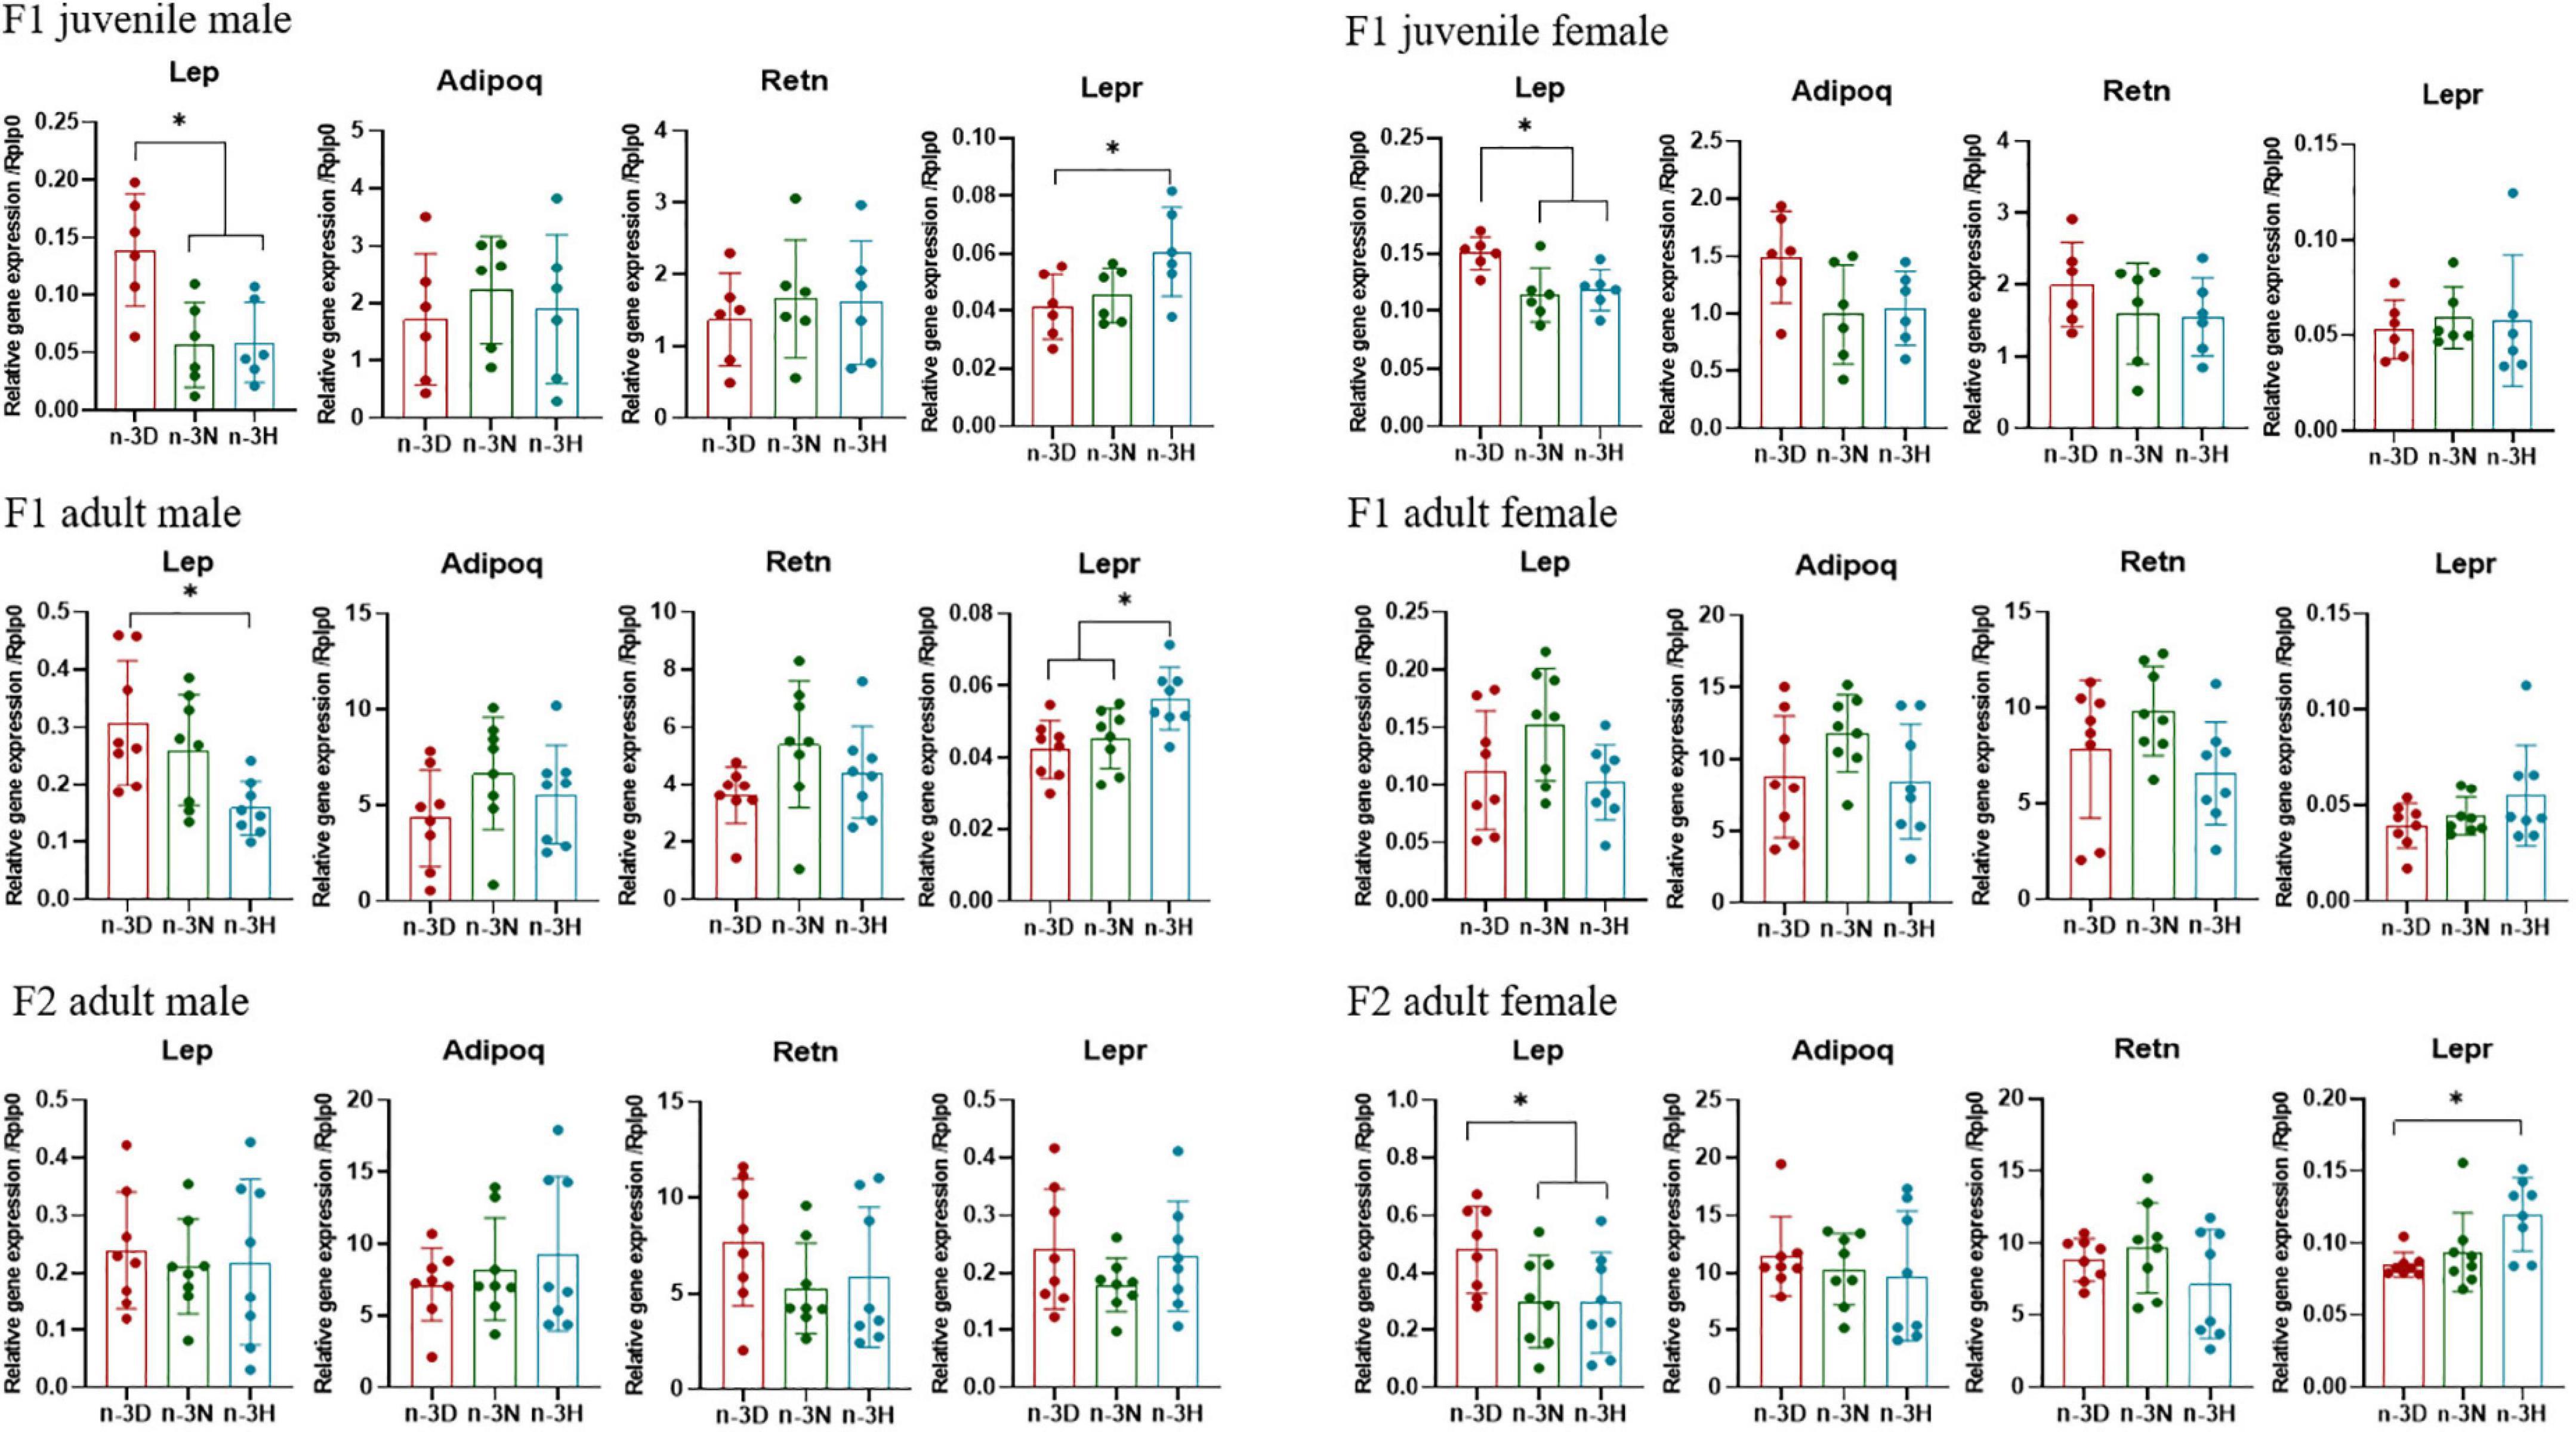
Figure 2. Effects of paternal dietary ratio of n-6: n-3 PUFAs on the expression of Lep, Adipoq, Retn, and Lepr in the adipose tissue of offspring. The protocols for production of F1 and F2 offspring as well as the experiments were the same as those described in Figure 1. Mice from the F1 or F2 offspring were fed normal chow diet for 16 weeks. The mRNA expression of leptin (Lep), adiponectin (Adipoq), and resistin (Retn) in the epididymal fat, as well as, Lep receptor (Lepr) in the hypothalamus, was measured using real-time qPCR. n = 6–8 mice in each group. Data have been presented as mean values with standard deviation. *P < 0.05. Statistical differences were analyzed by one-way analysis of variance with Bonferroni post hoc, or Dunnett’s T3 test for data lacking homogeneity of variance. For non-normally distributed data, the Kruskal–Wallis test was used with Mann-Whitney U post hoc.
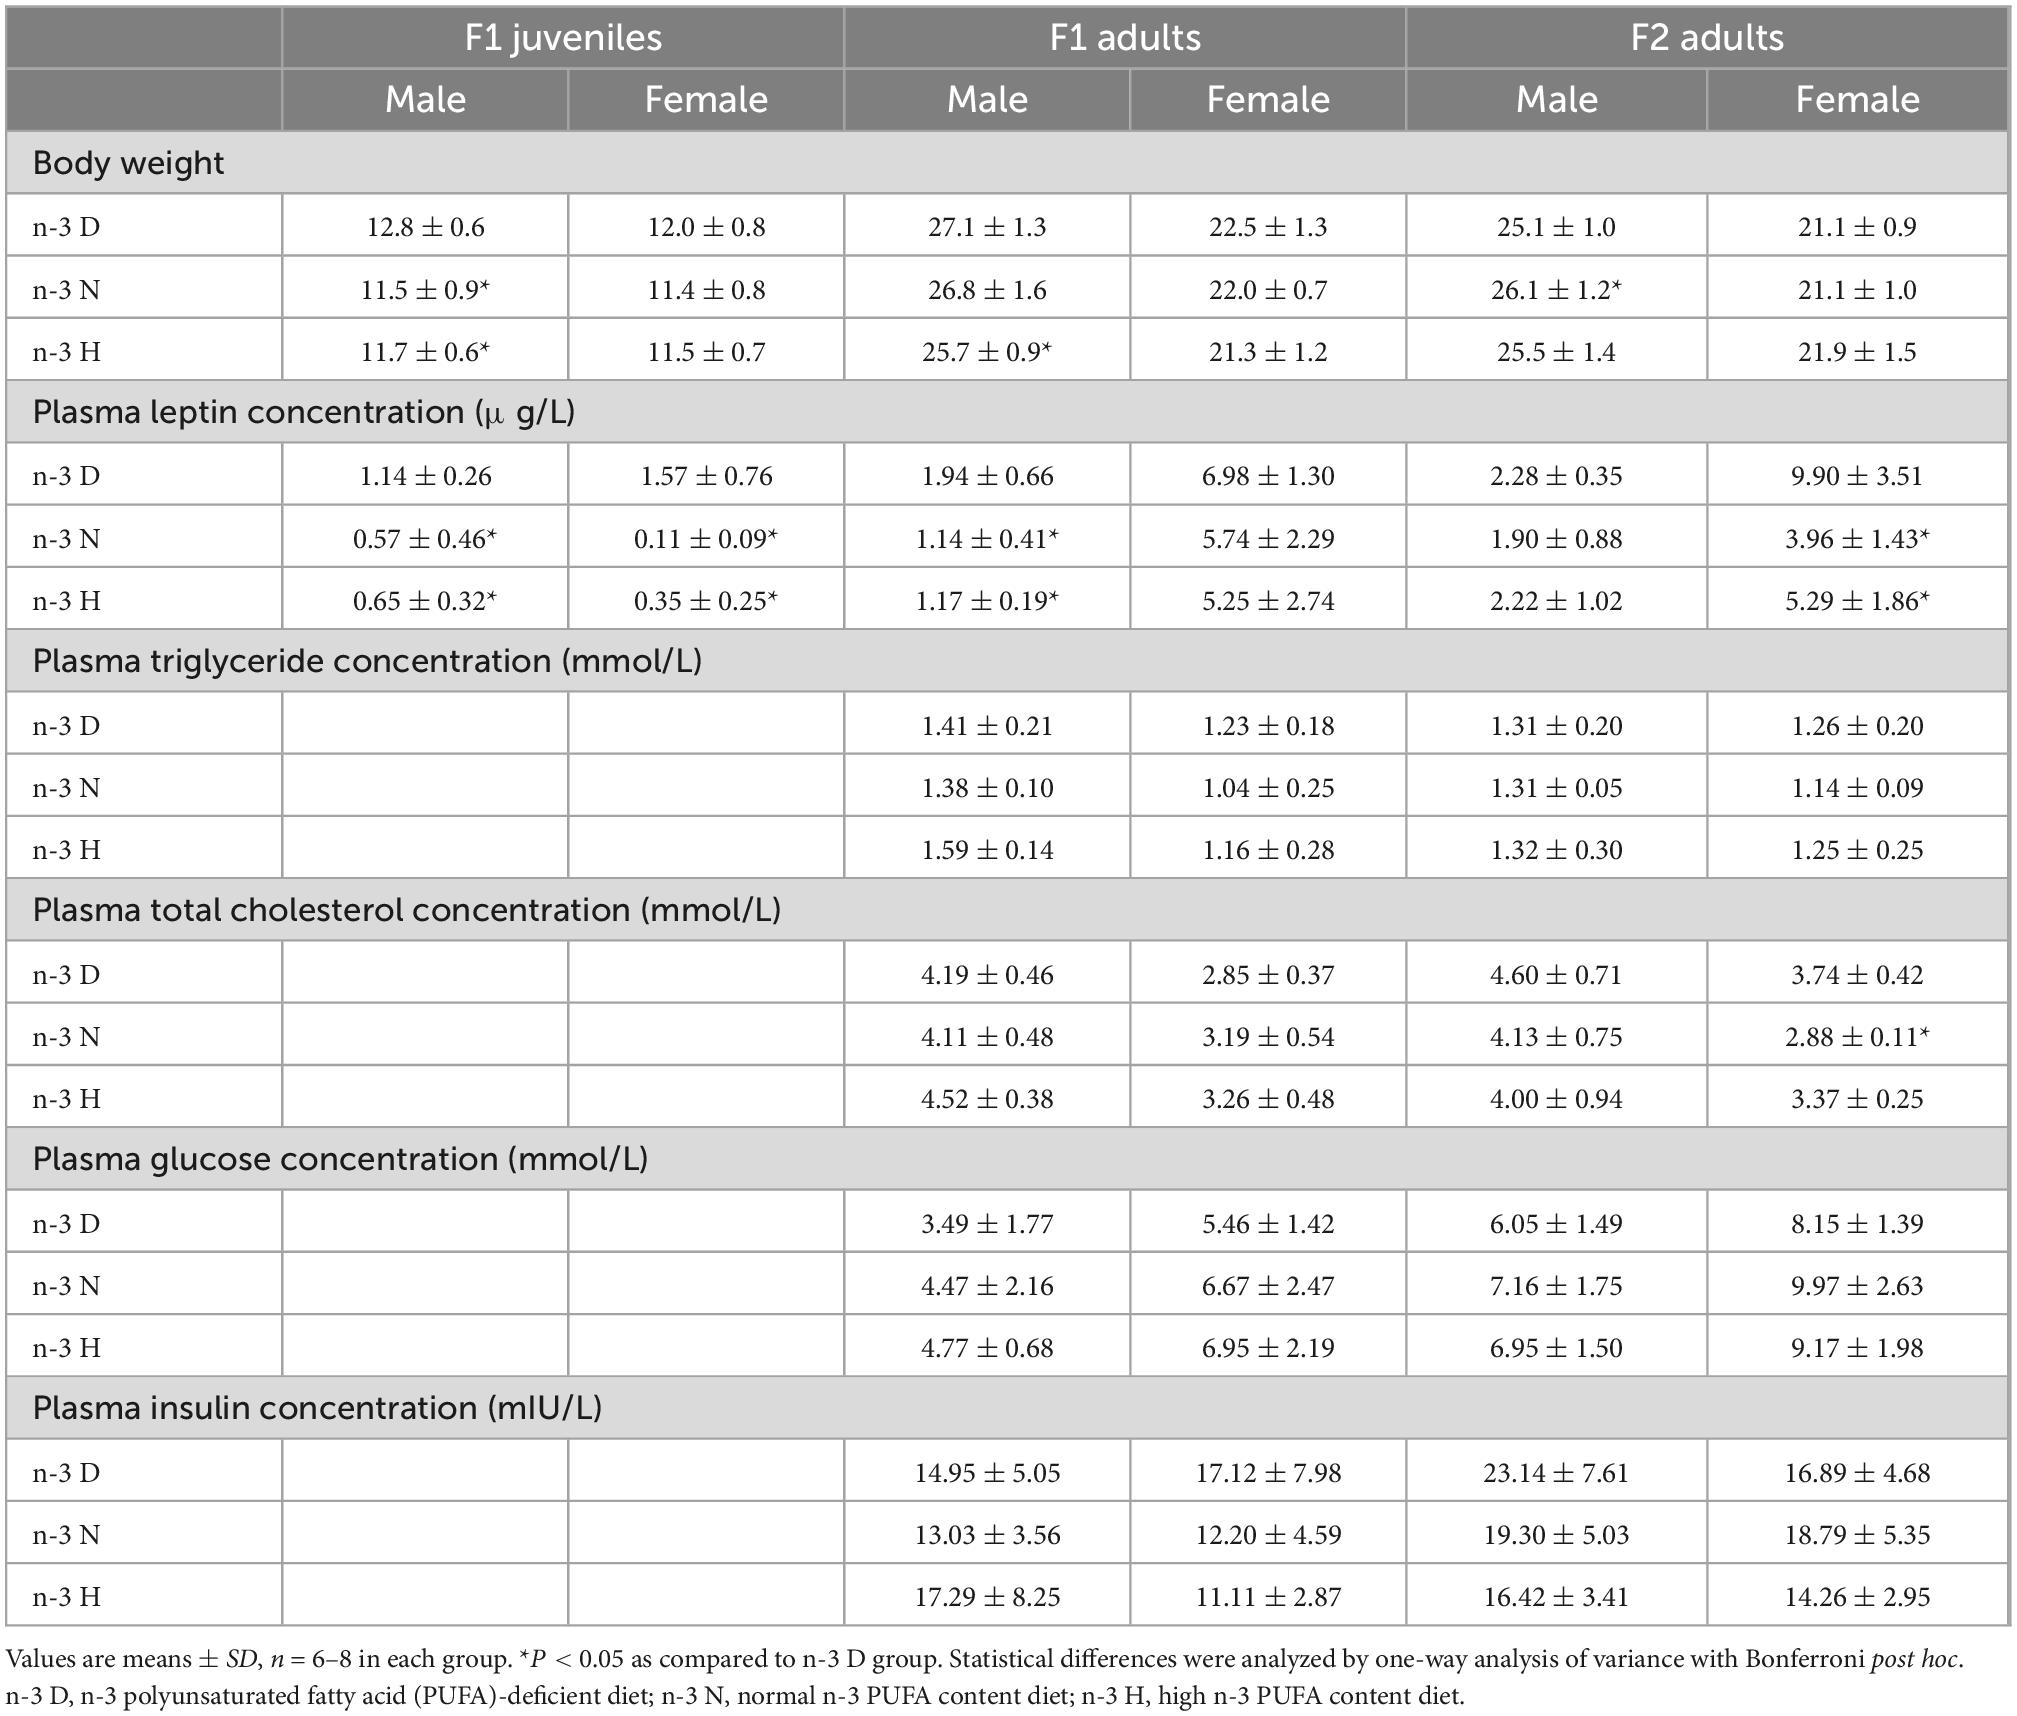
Table 4. Effects of paternal n-6: n-3 PUFAs on plasma concentrations of leptin and biochemical parameters in the offspring.
3.3 Effects of paternal n-3 PUFAs on the expression of imprinted genes in the adipose tissue of offspring
Figures 3, 4 depict the effects of paternal n-3 PUFA status on the expression of imprinted genes in the epididymal fat from the F1 and F2 generations. In the F1 offspring, as compared to the n-3 D diet, paternal n-3 N and n-3 H diets downregulated the mRNA expression of H19, Igf2r, Plagl1, and Kcnq1ot1, with increased expression of Igf2 and Grb10 in juvenile males, but upregulated the mRNA expression of H19, Plagl1, Cdkn1c, Kcnq1ot1, and Peg3, with decreased expression of Igf2r and Dlk1 in adult males. Little or no effect of paternal n-3 N or n-3 H diet was observed on the expression of these genes in either juvenile or adult females. In case of the adult F2 offspring, only the paternal n-3 H diet altered the expression of imprinted genes, with downregulation of H19 and upregulation of Cdkn1c and Kcnq1ot1 in males; whereas, either paternal n-3 N or n-3 H diet downregulated the expression of Plagl1, Cdkn1c, Kcnq1ot1, Peg3, and Grb10 in females, indicating that female offspring are more easily affected by paternal n-3 PUFAs than male offspring.
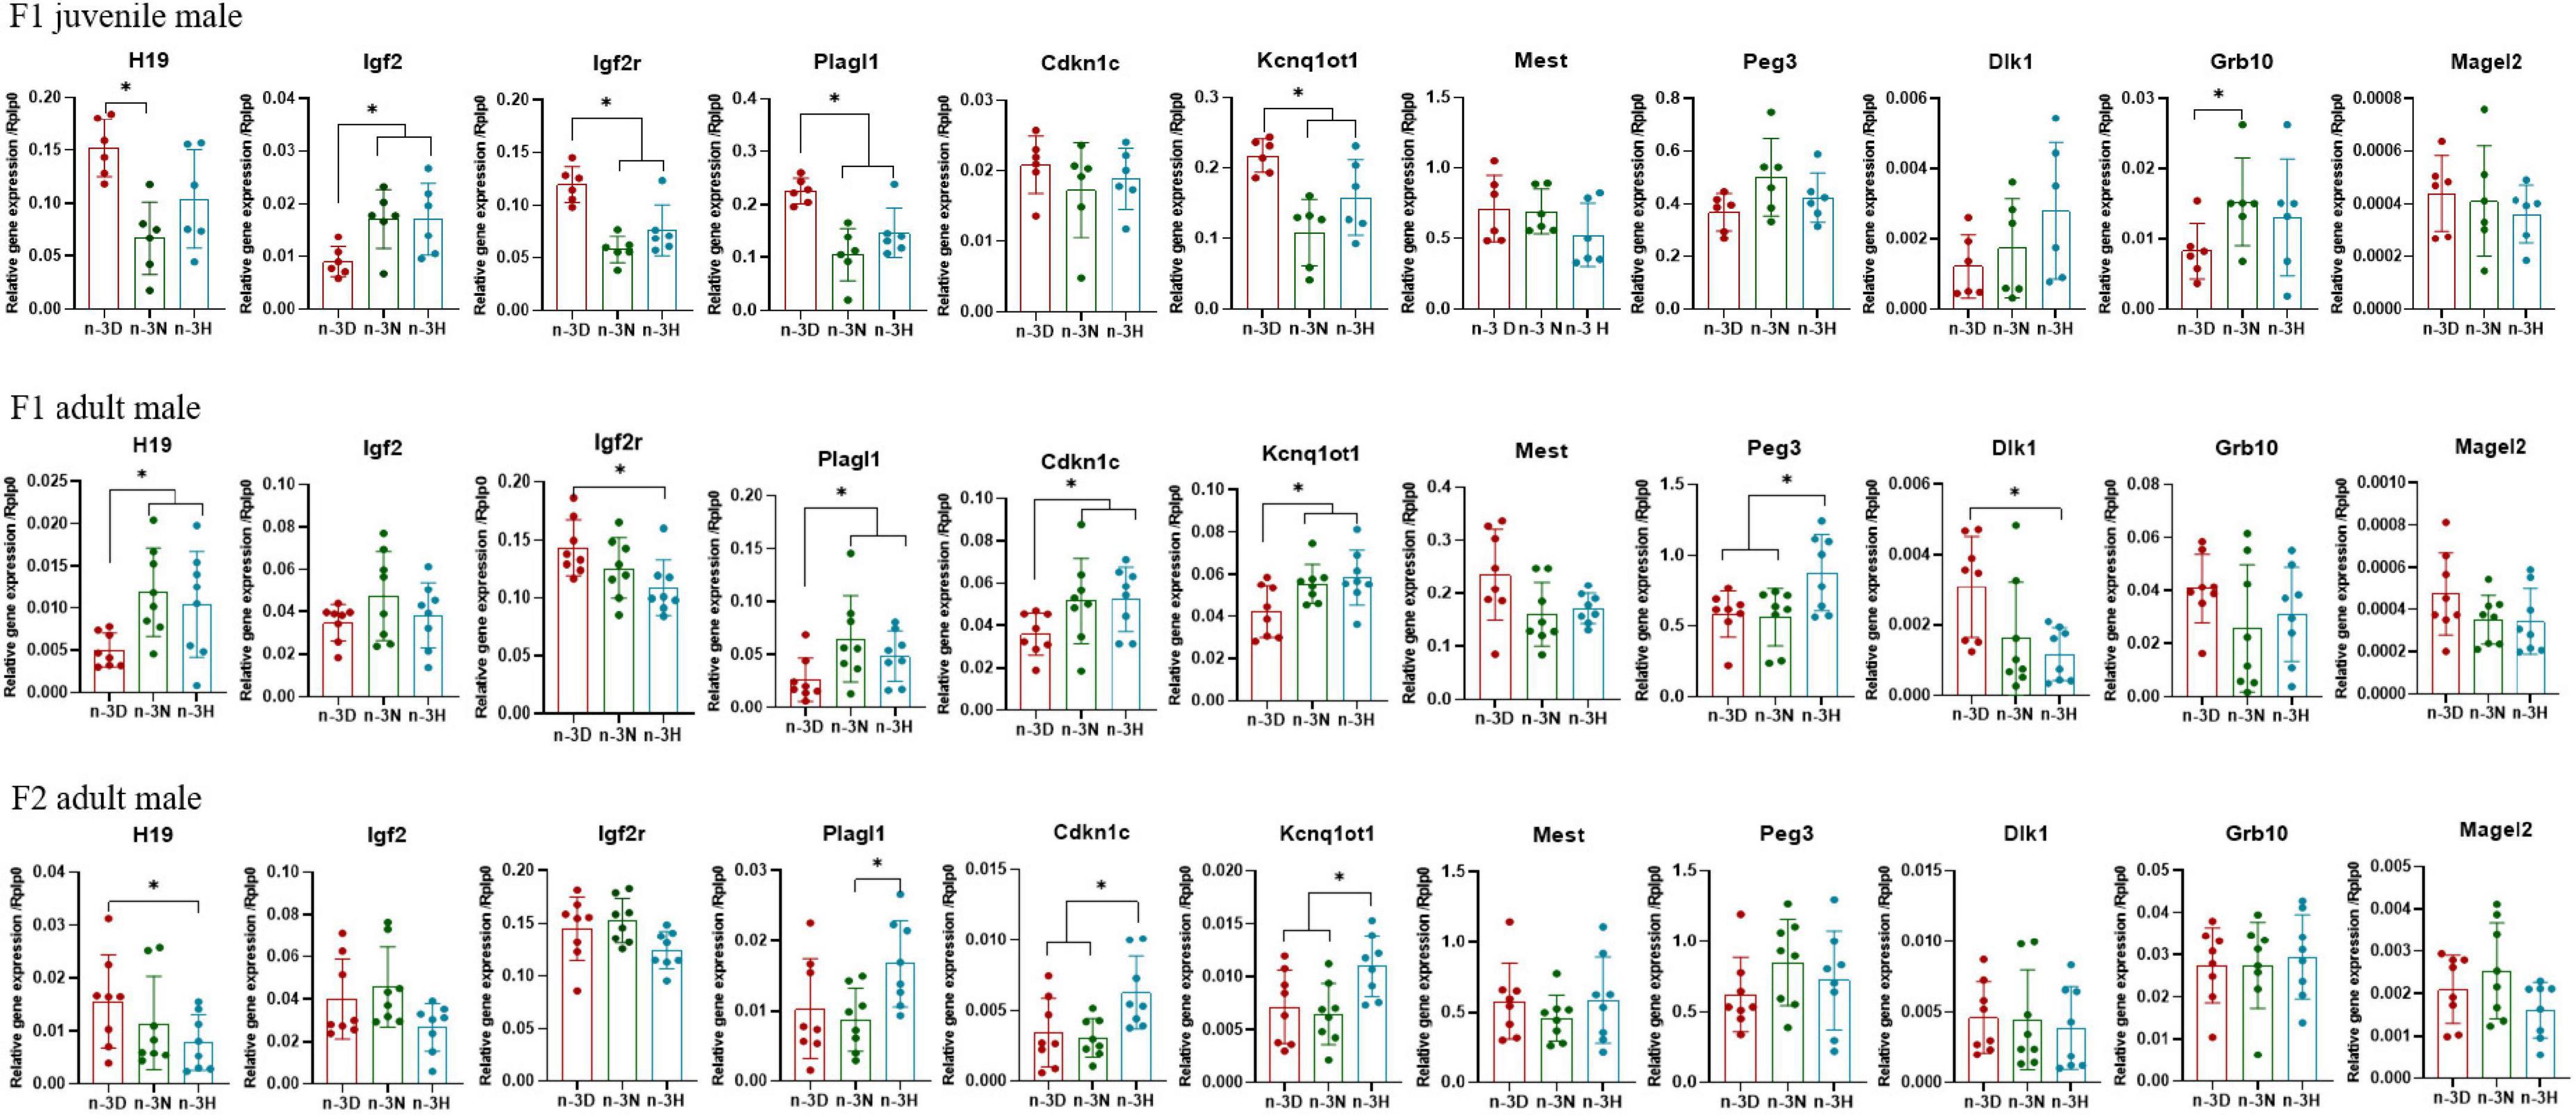
Figure 3. Effects of paternal dietary ratio of n-6: n-3 PUFAs on the expression of imprinted genes in the adipose tissue of male offspring. The protocols for production of F1 and F2 offspring as well as the experiments were the same as those described in Figure 1. Mice from the F1 or F2 offspring were fed normal chow diet for 16 weeks. The mRNA expression of the imprinted genes in the epididymal fat was measured using real-time qPCR. n = 6–8 mice in each group. Data have been presented as mean values with standard deviation. *P < 0.05. Statistical differences were analyzed by one-way analysis of variance with Bonferroni post hoc, or Dunnett’s T3 test for data lacking homogeneity of variance. For non-normally distributed data, the Kruskal–Wallis test was used with Mann-Whitney U post hoc.
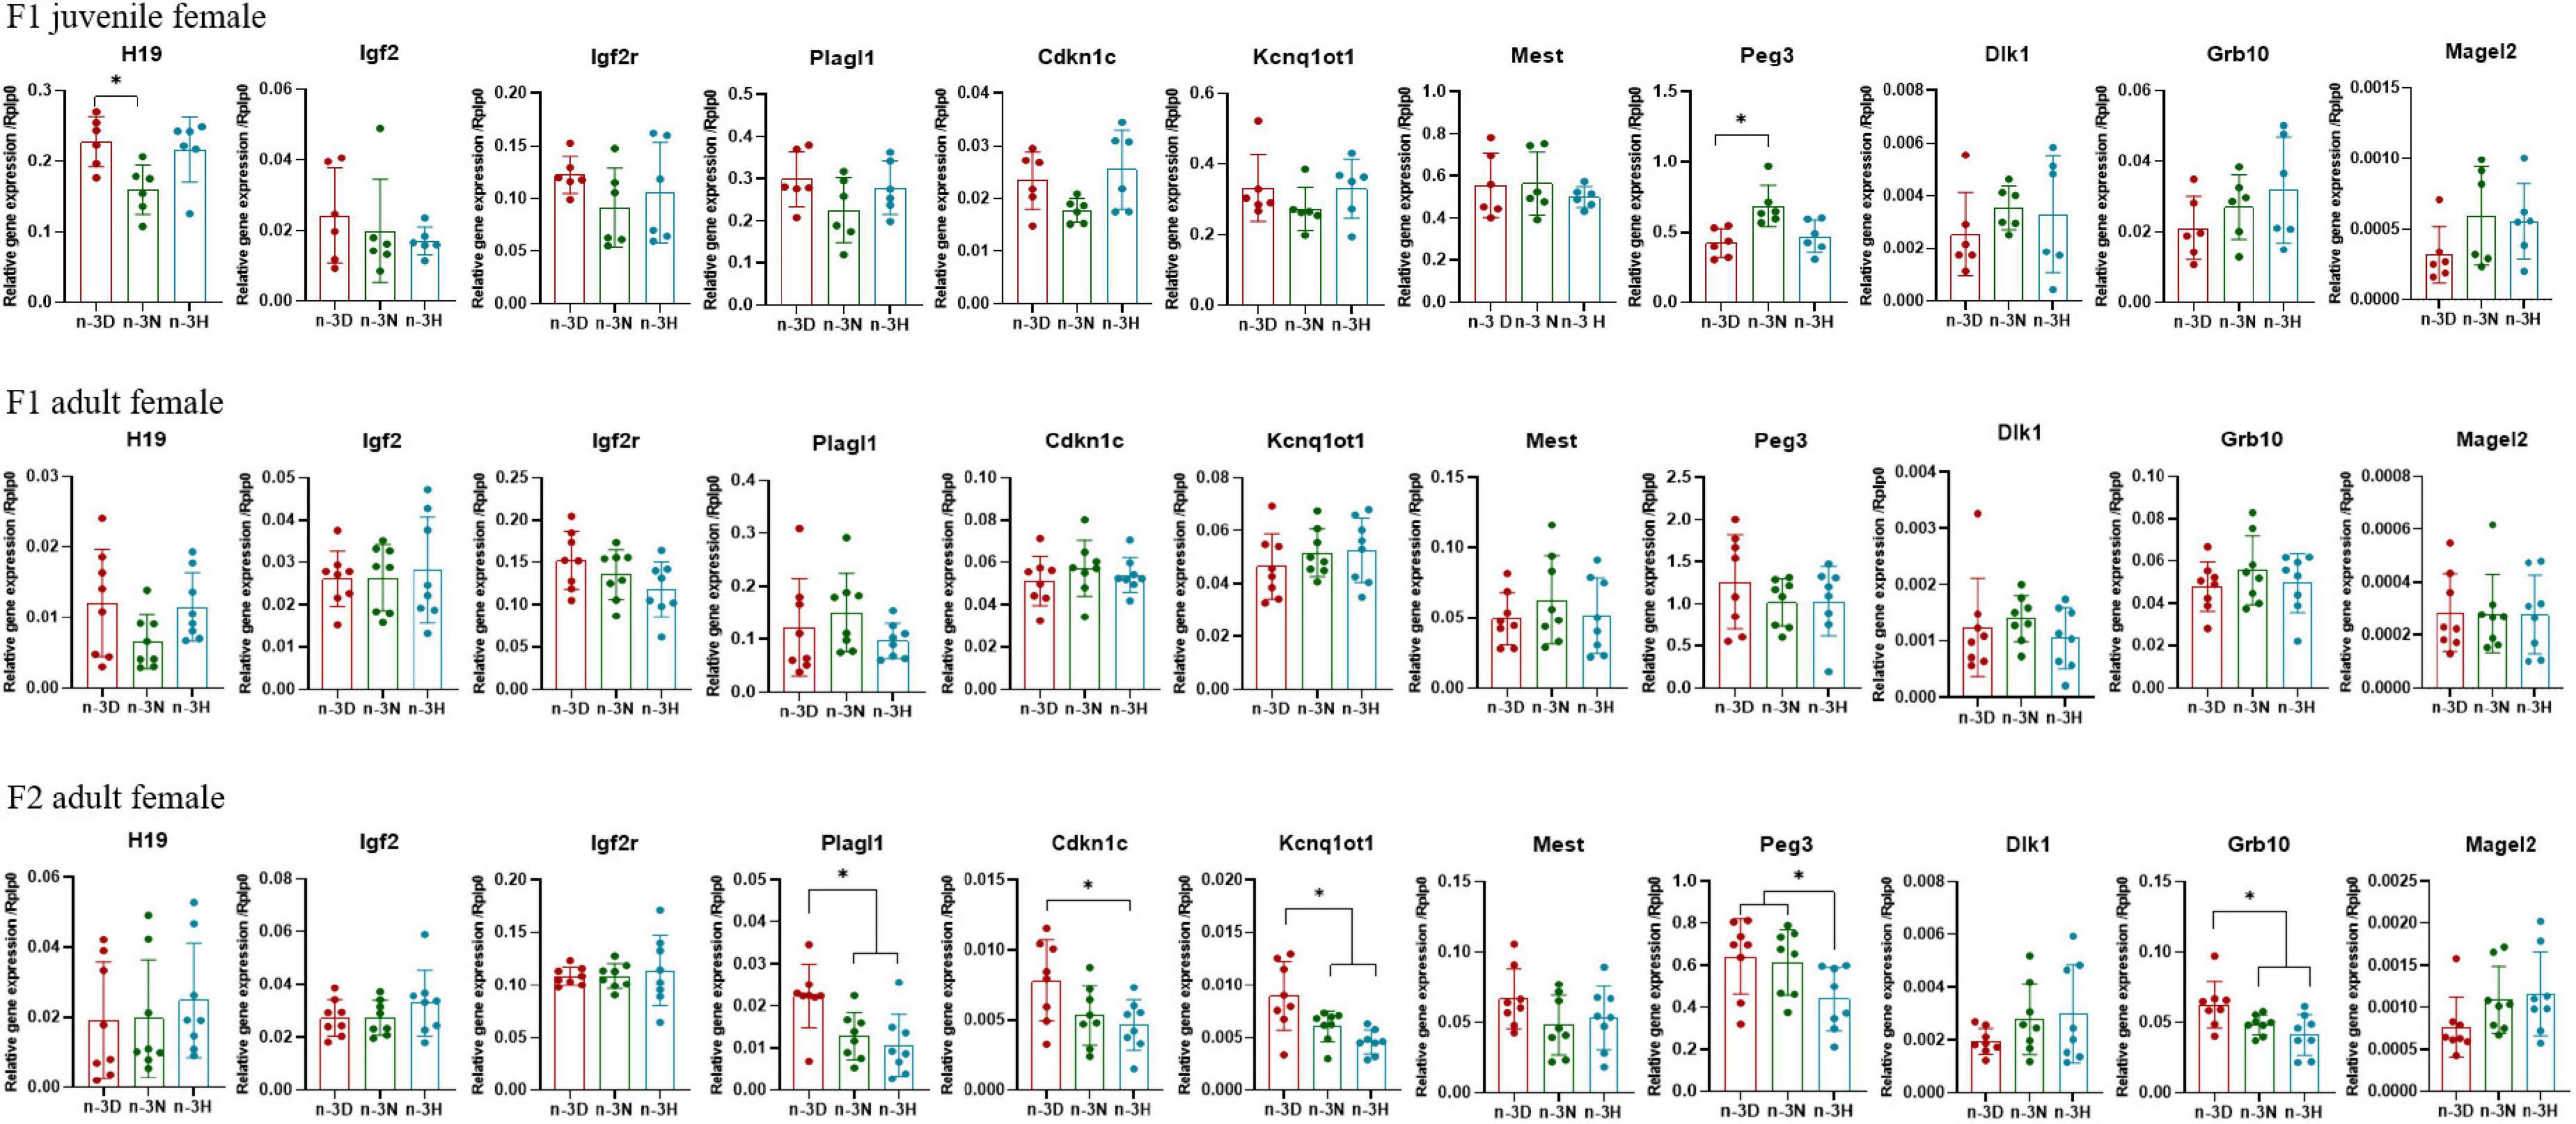
Figure 4. Effects of paternal dietary ratio of n-6: n-3 PUFAs on the expression of imprinted genes in the adipose tissue of female offspring. The protocols for production of F1 and F2 offspring as well as the experiments were the same as those described in Figure 1. Mice from the F1 or F2 offspring were fed normal chow diet for 16 weeks. The mRNA expression of the imprinted genes in the epididymal fat was measured using real-time qPCR. n = 6–8 mice in each group. Data have been presented as mean values with standard deviation. *P < 0.05. Statistical differences were analyzed by one-way analysis of variance with Bonferroni post hoc, or Dunnett’s T3 test for data lacking homogeneity of variance. For non-normally distributed data, the Kruskal–Wallis test was used with Mann-Whitney U post hoc.
3.4 Correlation between leptin and imprinted genes in the adipose tissue
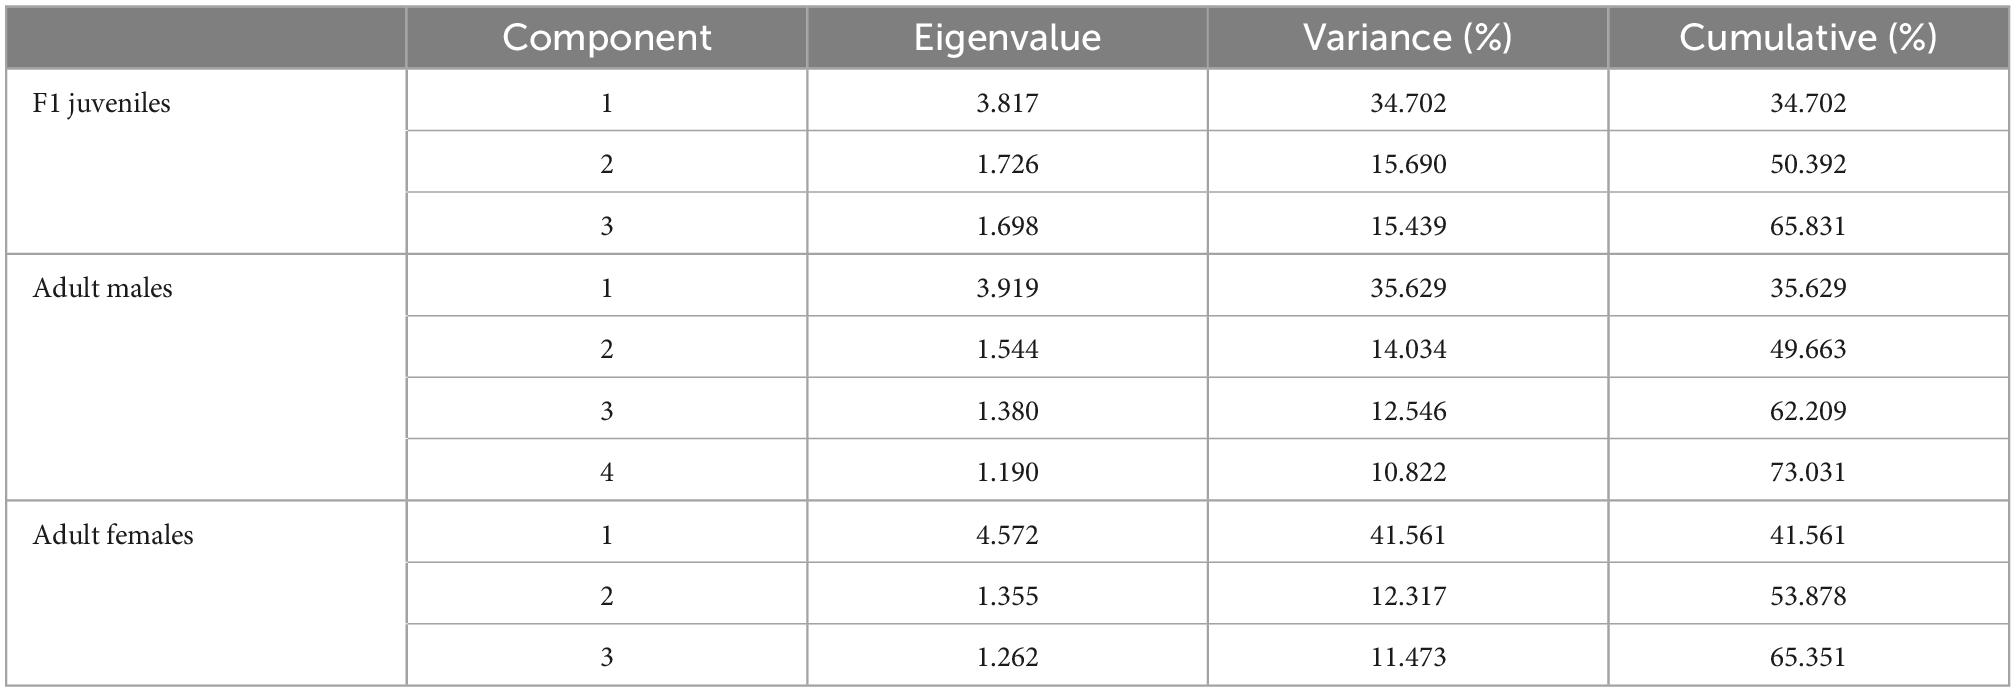
Linear correlation analysis indicated that adipose leptin expression was positively correlated with the expression of H19, Igf2r, Plagl1, and Kcnq1ot1 in juvenile F1 males and females; negatively correlated with the expression of Kcnq1ot1 in adult F1 males, with a negative trend toward significance for the Cdkn1c expression; and positively correlated with the expression of Plagl1 in adult F2 females, with a positive trend toward significance for the Kcnq1ot1 expression (Figure 5). PCA identified 3–4 components with an eigenvalue ≥ 1, which accounted for 65.831, 73.031, and 65.351% of the total variance in juvenile F1 males and females, adult F1 and F2 males, and adult F1 and F2 females, respectively, with the first factor accounting for 34.702, 35.629, and 41.561% of the variance, respectively (Table 5). Supplementary Table 3 shows the variables that accounted for the majority of variance in the data. The first factor was predominantly loaded by H19, Igf2r, Plagl1, Cdkn1c, and Kcnq1ot1 in juvenile F1 males and females; Plagl1, Cdkn1c, Kcnq1ot1, Mest, Dlk1, and Magel2 in all adult F1 and F2 males; and Igf2r, Plagl1, Cdkn1c, Kcnq1ot1, Peg3, Dlk1, and Magel2 in adult F1 and F2 females.
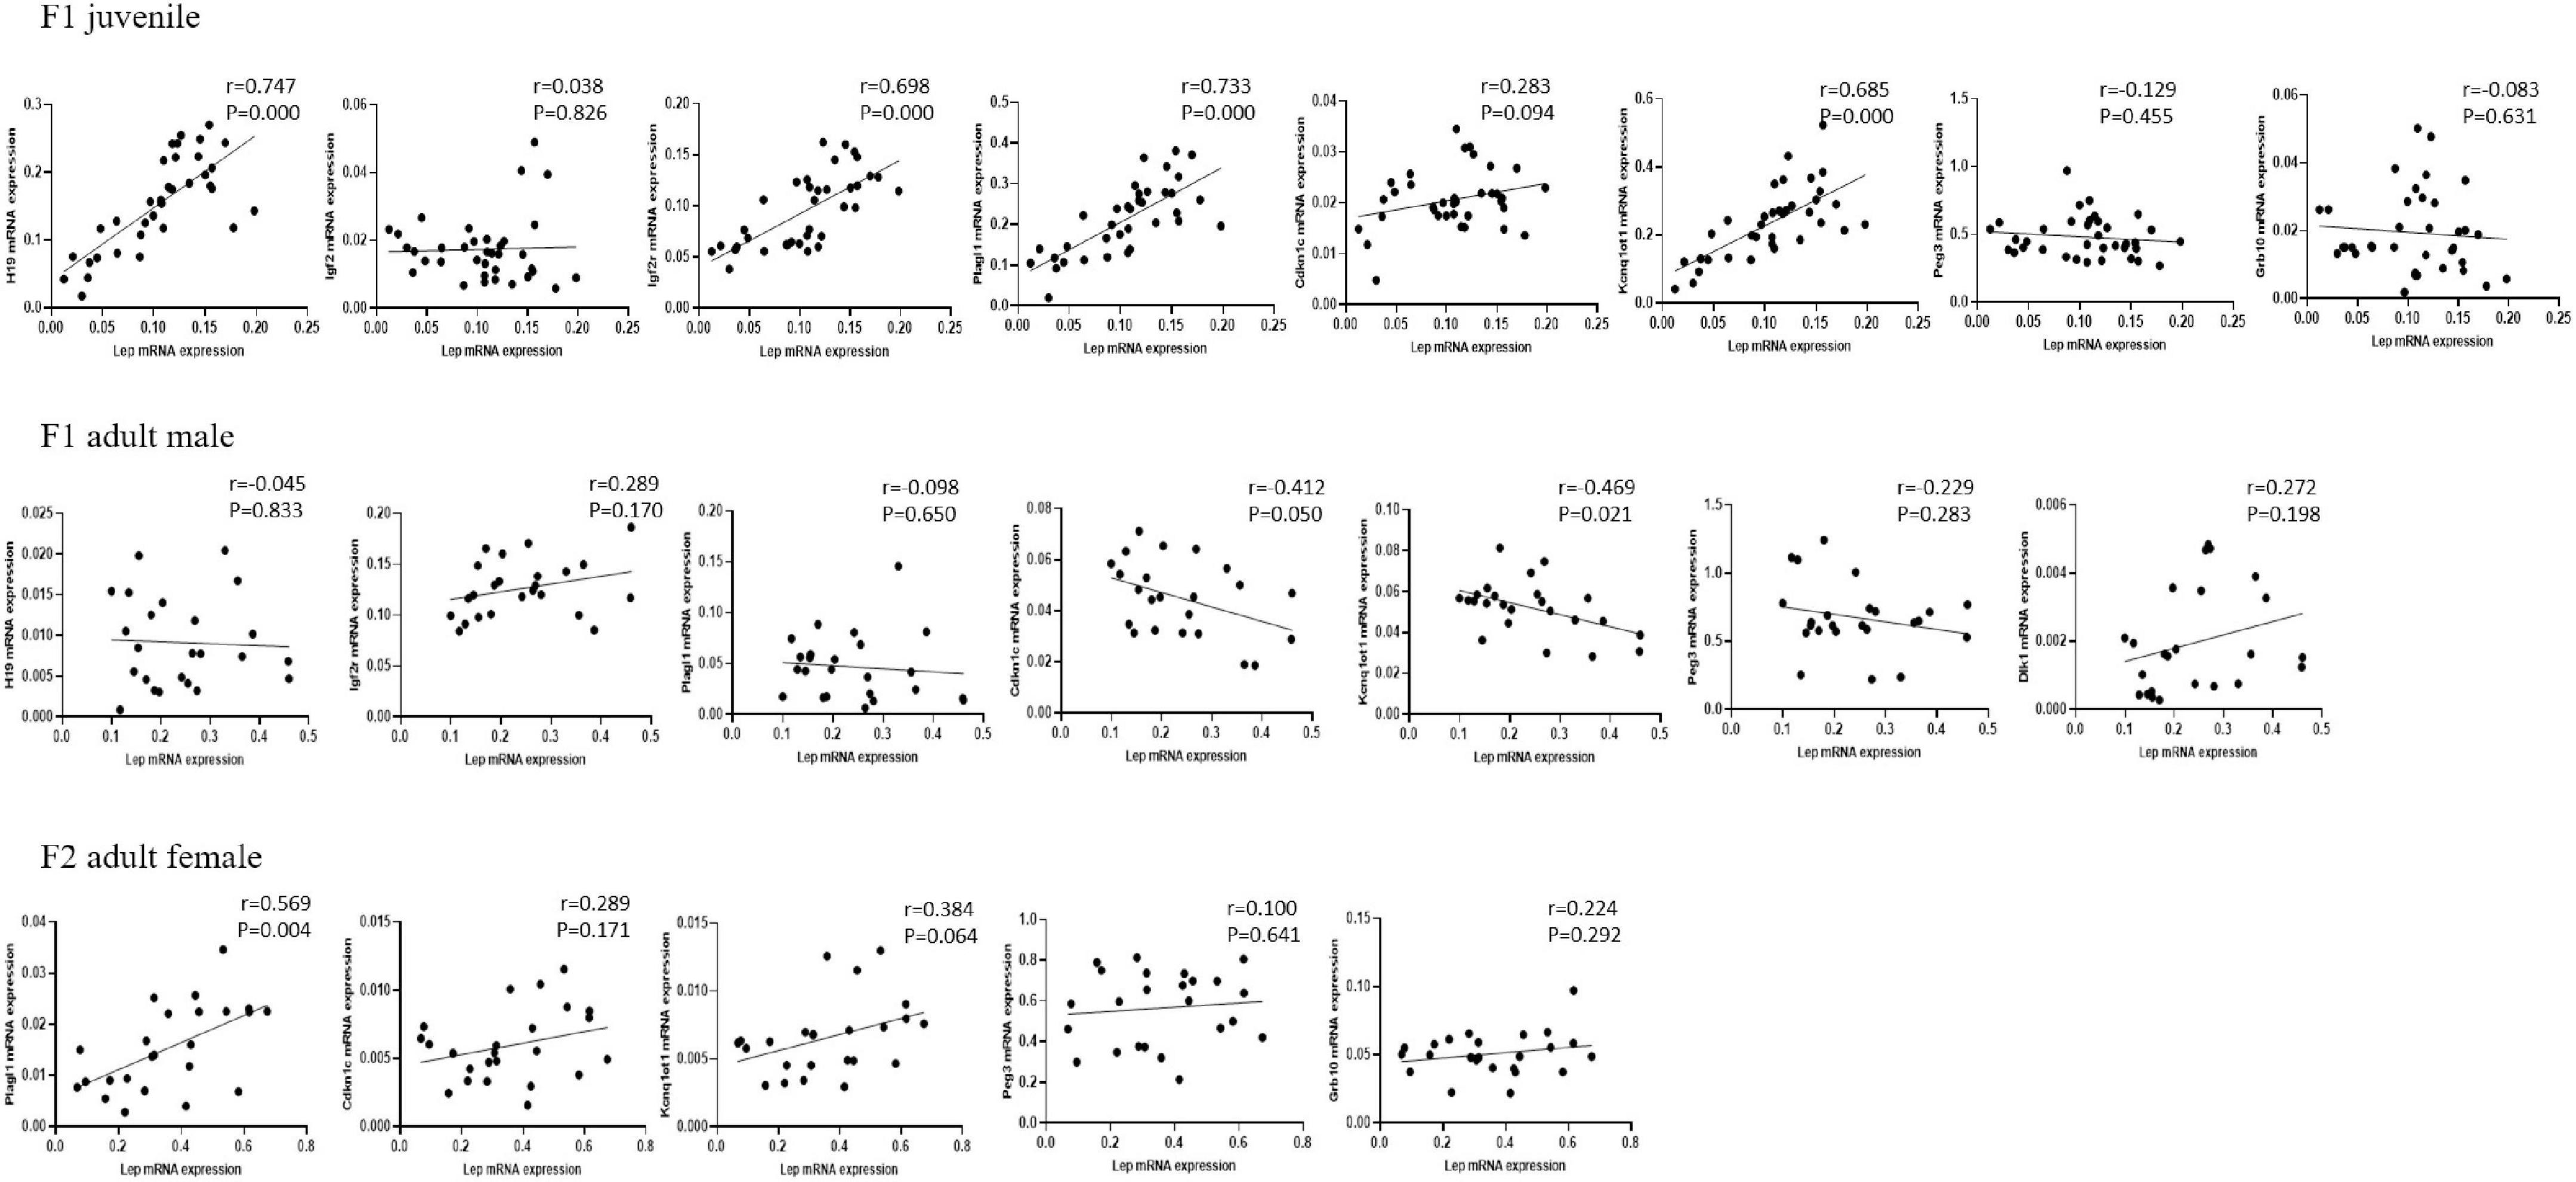
Figure 5. Correlation between the expression of Lep and imprinted genes in the adipose tissue. The protocols for production of F1 and F2 offspring as well as the experiments were the same as those described in Figure 1. Mice from the F1 and F2 offspring were fed normal chow diet for 16 weeks. Linear correlation analysis was performed to compare the expression of leptin (Lep) and other altered imprinted genes in juvenile F1 males and females, adult F1 males, and adult F2 females.
3.5 Effects of paternal n-3 PUFAs on the expression of imprinted genes in the offspring testis
Figures 6, 7 depict the effects of paternal n-3 PUFA status on the expression of imprinted genes in the testes from the F1 and F2 generations. Paternal n-3 H diet downregulated the mRNA expression of Plagl1, Cdkn1c, Peg3, and Grb10, with altered expression of Dnmts (Dnmt1, Dnmt3b, and Dnmt3l) and Hdac1 (founder F0 fathers). Examination of the imprinted genes in F1 testes revealed that the paternal n-3 N and n-3 H diets downregulated the expression of Igf2, Igf2r, Plagl1, Kcnq1ot1, and Grb10, and decreased the expression of Hdac2, Hdac3, and Hdac9 in juvenile offspring, but upregulated the expression of Igf2r, Plagl1, Cdkn1c, Kcnq1ot1, Peg3, and Grb10, with increased expression of Dnmt3a, Dnmt3b, Hdac1, Hdac6, and Hdac9 in adult offspring. Similar to the observations in F1 adults, the paternal n-3 N and n-3 H diets upregulated the expression of Igf2r, Plagl1, Cdkn1c, Peg3, and Grb10, with increased expression of Dnmt3a, Dnmt3b, Hdac1, Hdac6, and Hdac9 in the testes of adult F2 offspring.
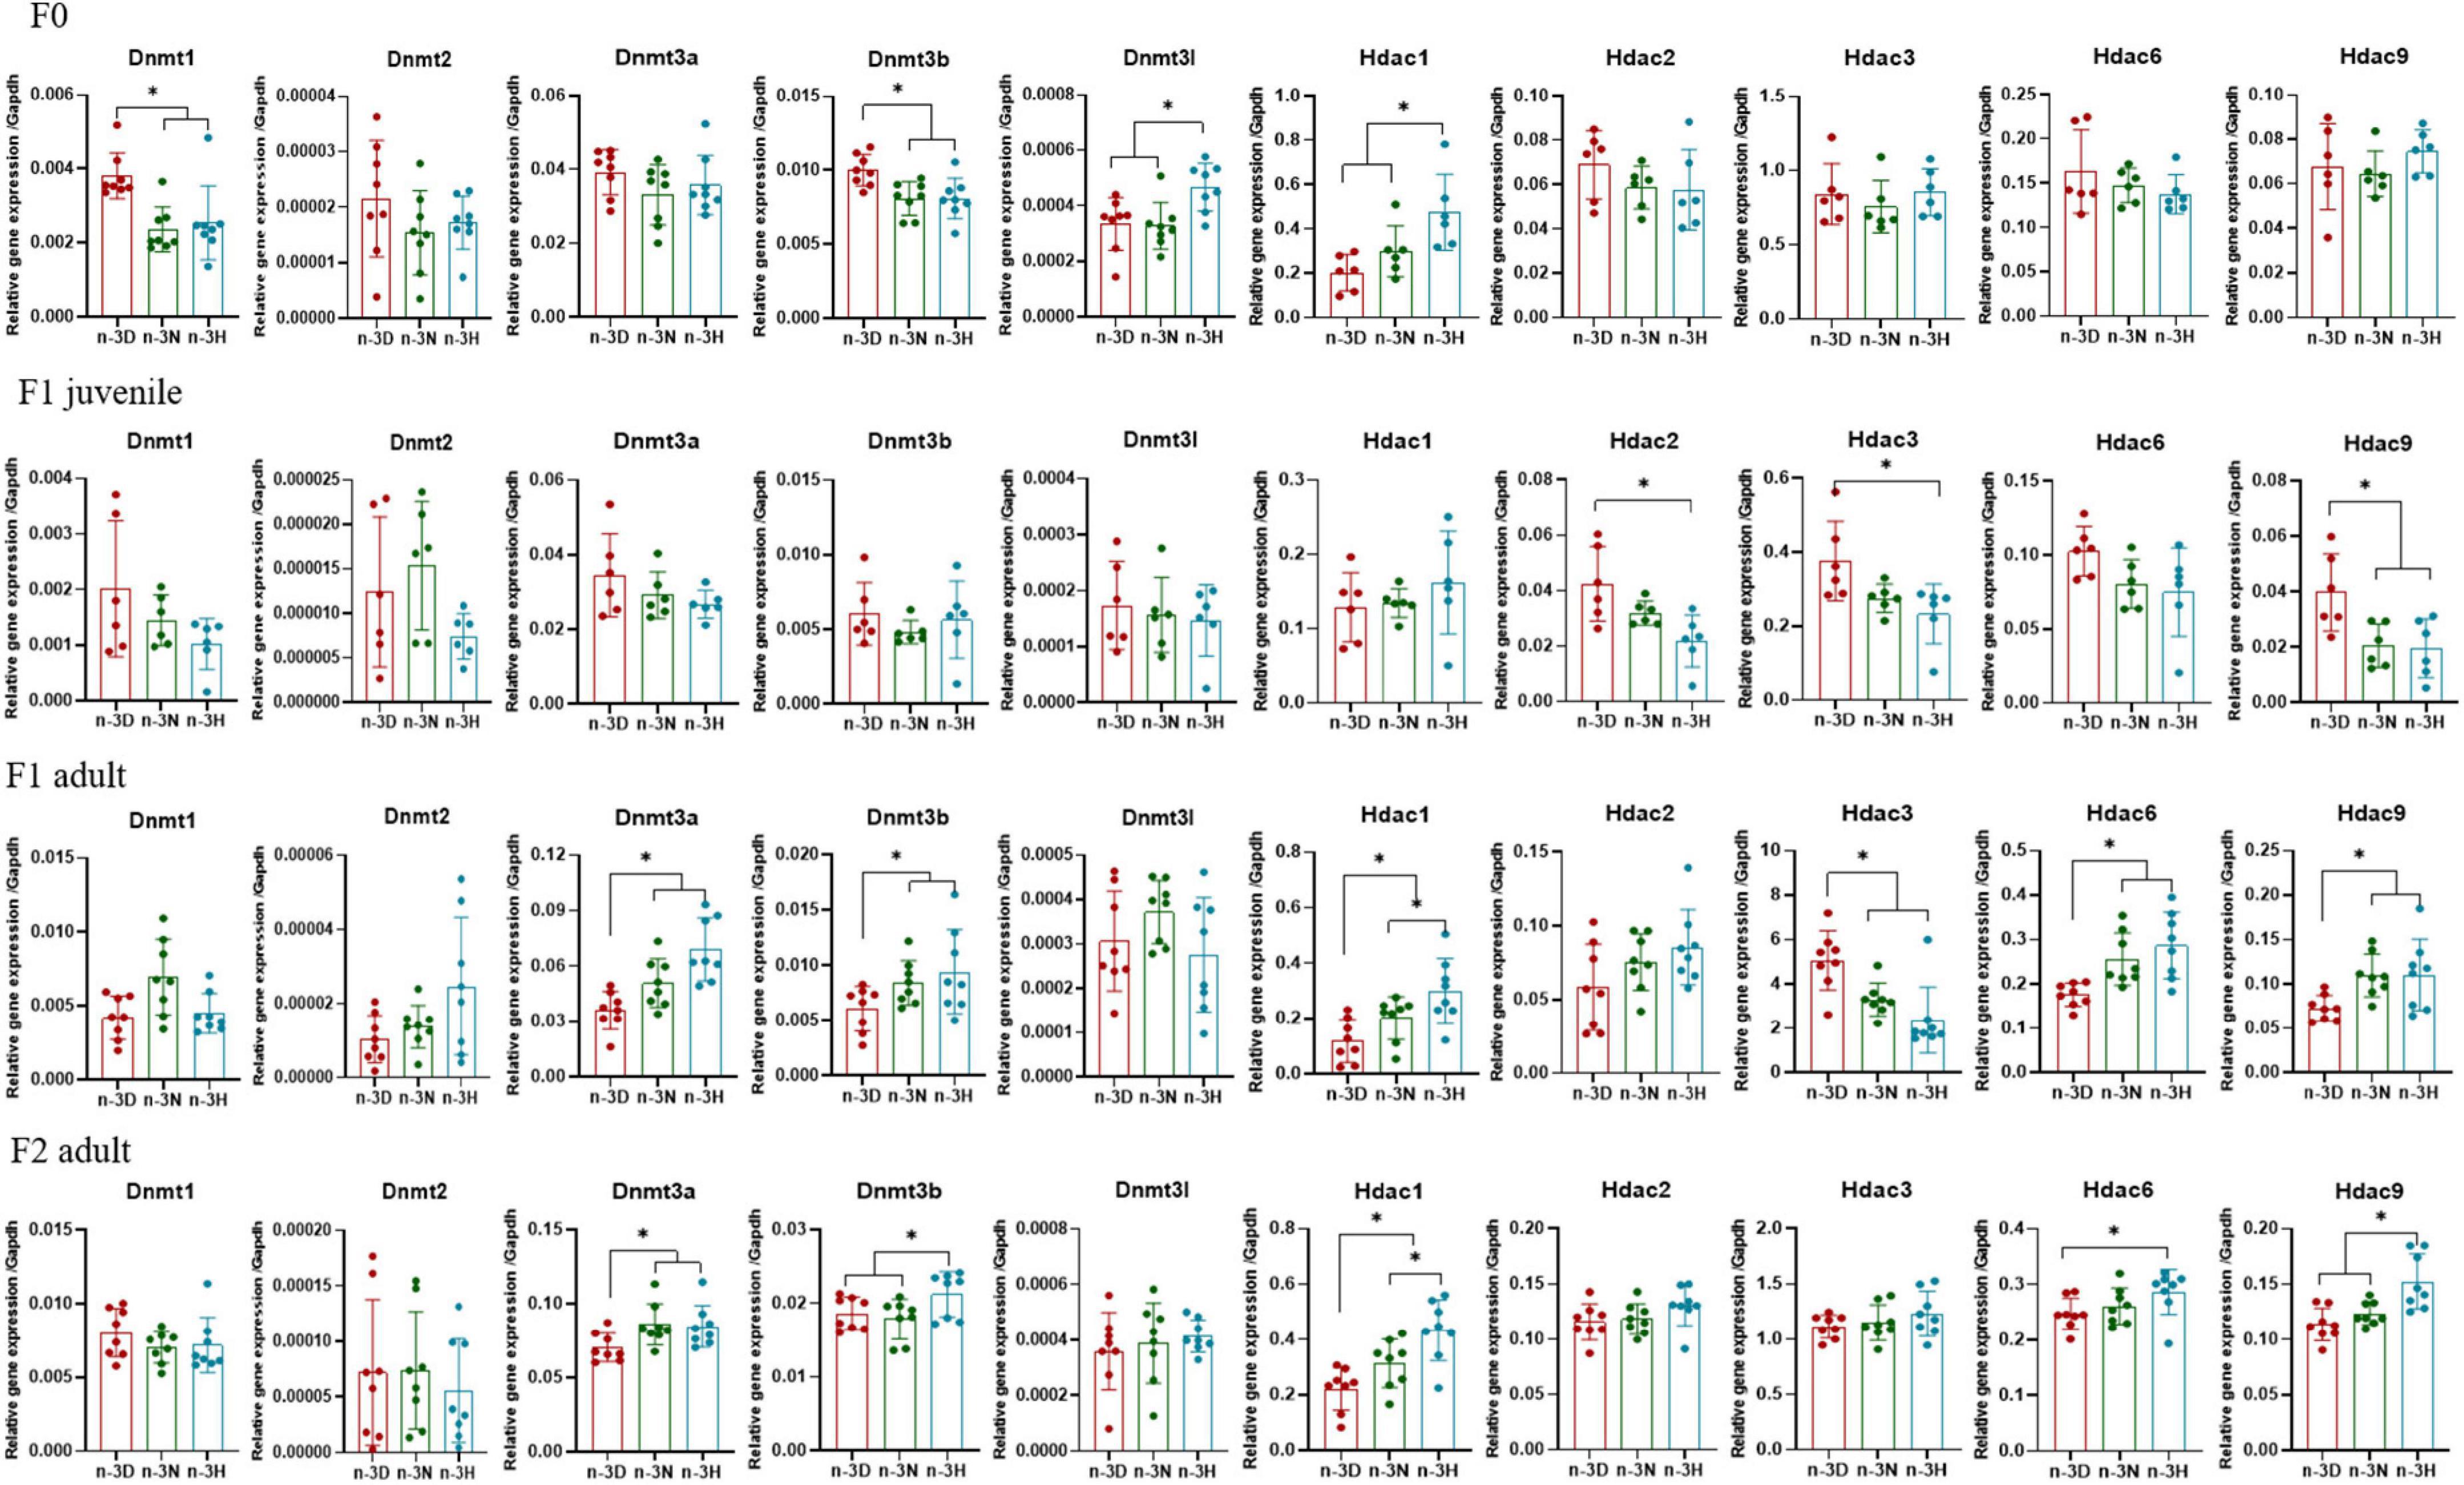
Figure 6. Effects of paternal dietary ratio of n-6: n-3 PUFAs on the expression of Dnmts and Hdacs in the offspring testis. The protocols for production of F1 and F2 offspring as well as the experiments were the same as those described in Figure 1. Mice from the F1 or F2 offspring were fed normal chow diet for 16 weeks. The mRNA expression of DNA methyltransferase (Dnmts) and histone deacetylases (Hdacs) in the testis was measured using real-time qPCR. n = 6–8 mice in each group. Data have been presented as mean values with standard deviation. *P < 0.05. Statistical differences were analyzed by one-way analysis of variance with Bonferroni post hoc, or Dunnett’s T3 test for data lacking homogeneity of variance. For non-normally distributed data, the Kruskal–Wallis test was used with Mann-Whitney U post hoc.
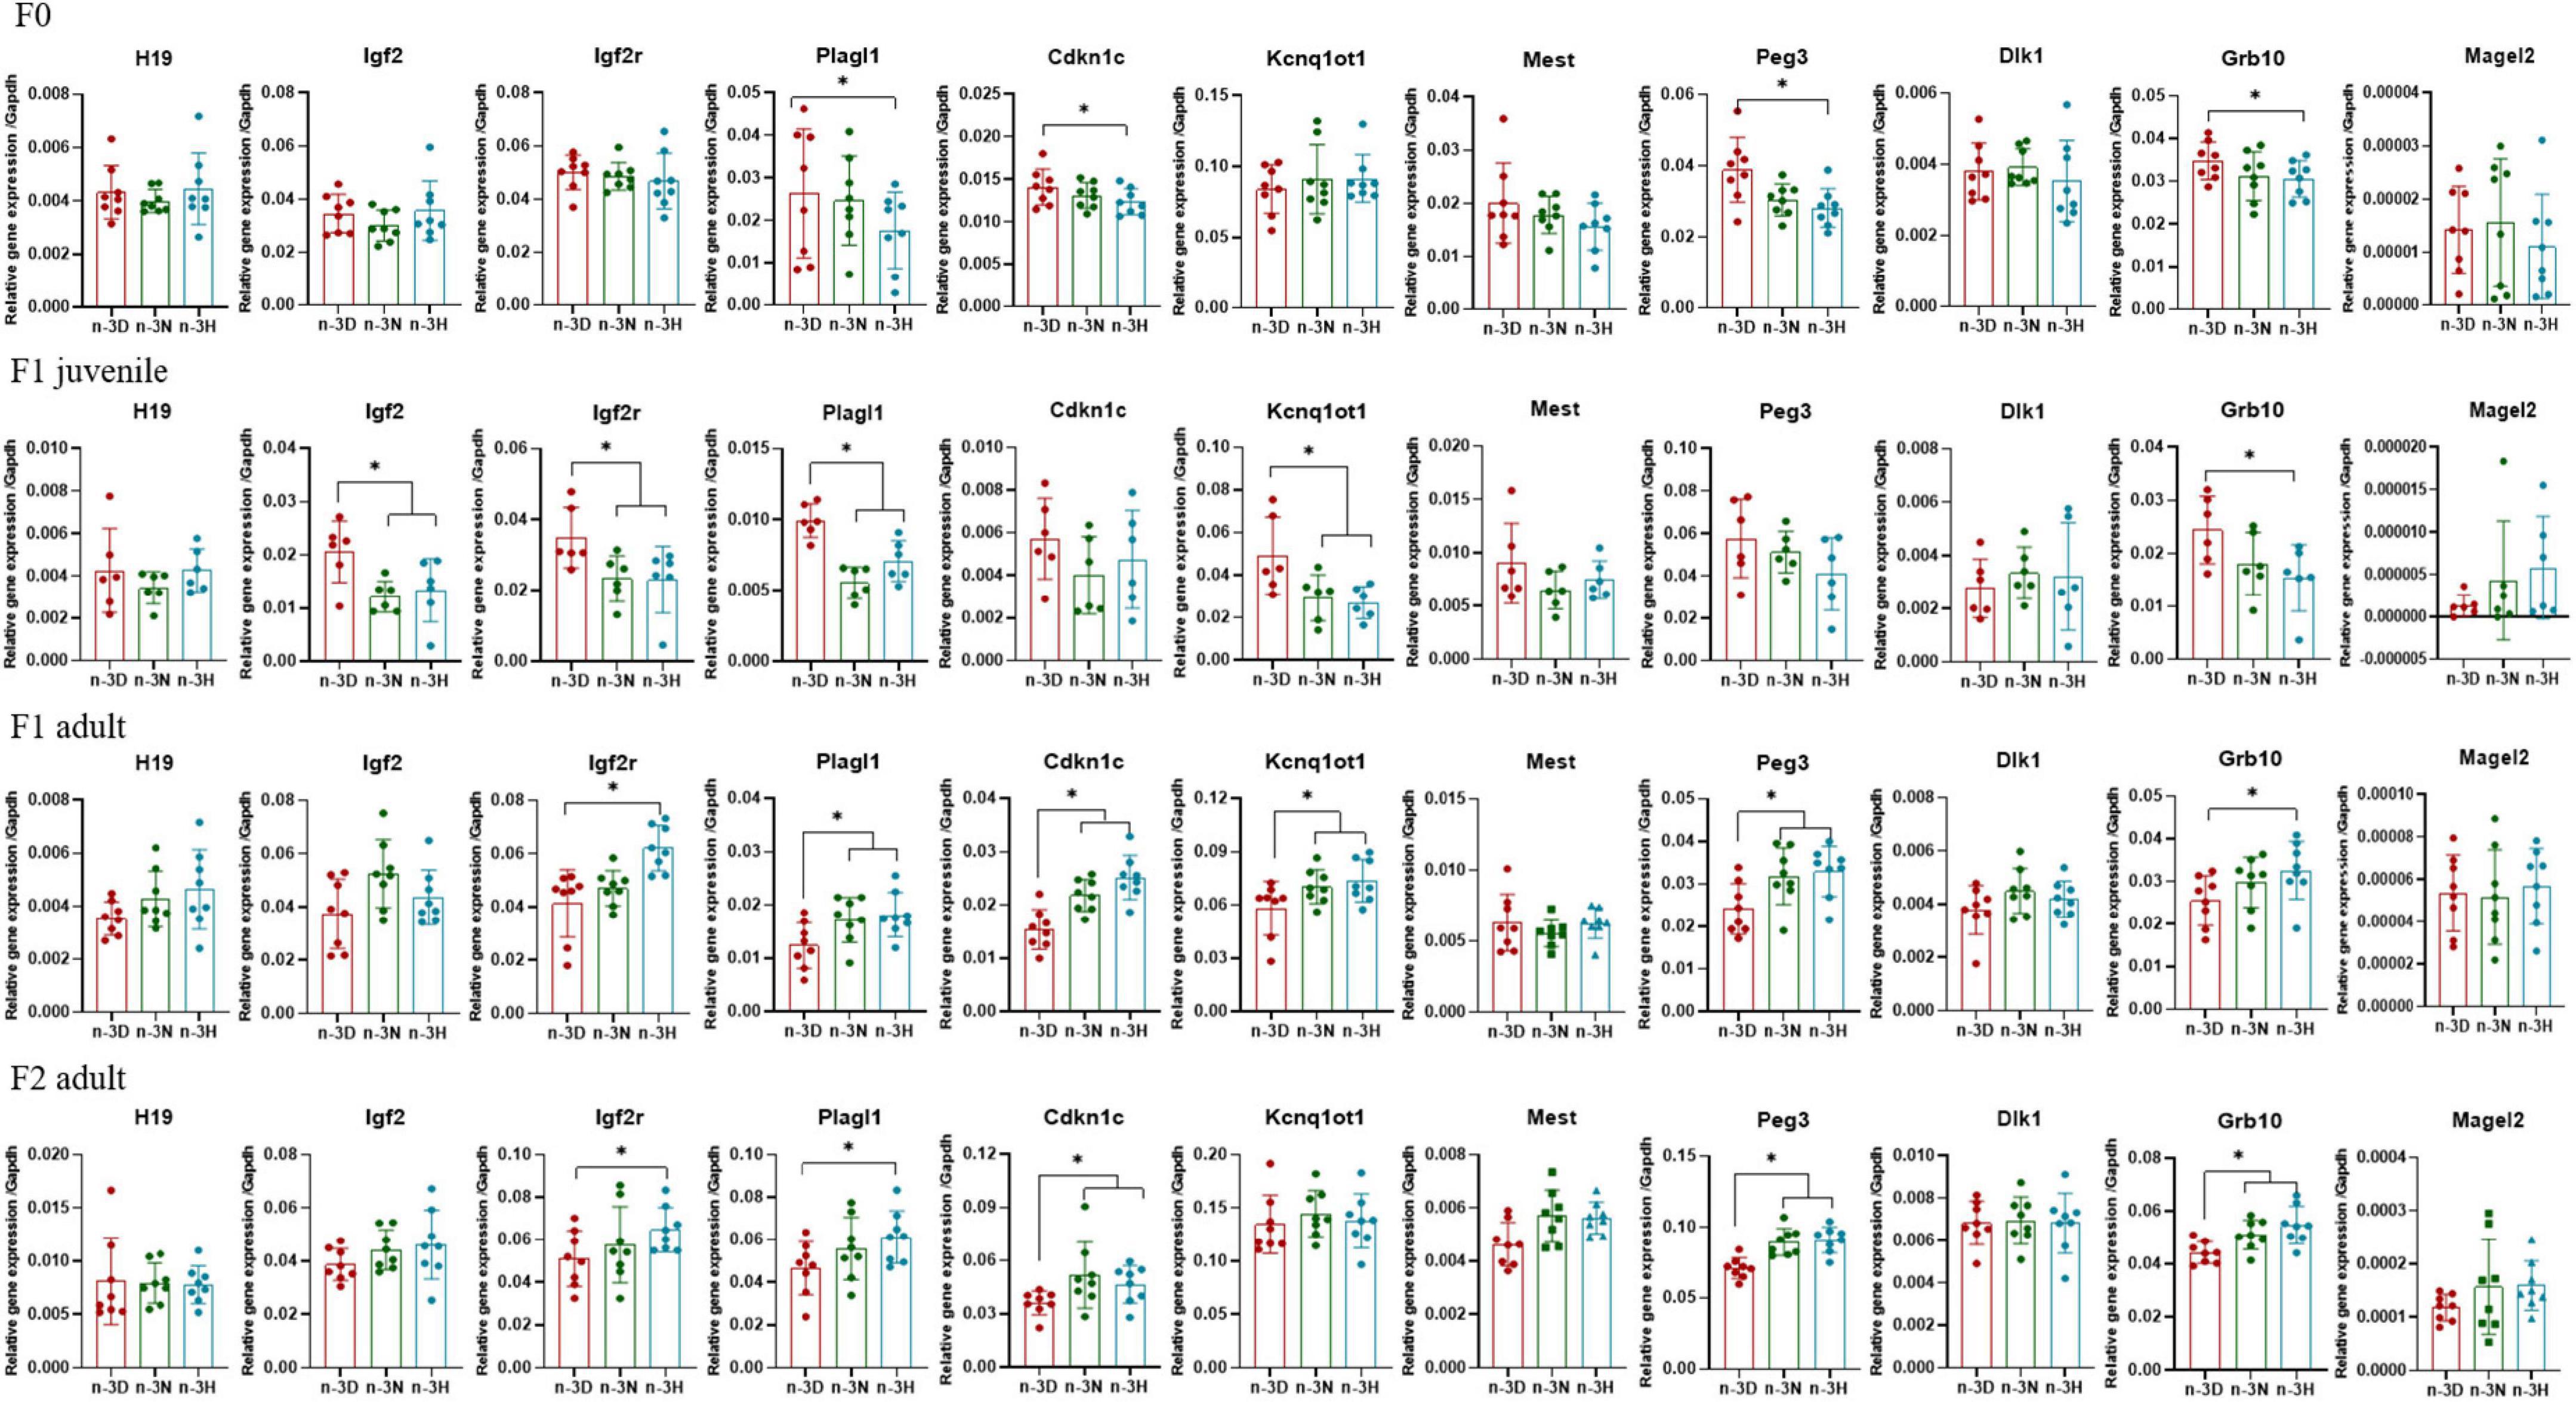
Figure 7. Effects of paternal dietary ratio of n-6: n-3 PUFAs on the expression of imprinted genes in the offspring testis. The protocols for production of F1 and F2 offspring as well as the experiments were the same as those described in Figure 1. Mice from the F1 or F2 offspring were fed normal chow diet for 16 weeks. The mRNA expression of the imprinted genes in the testis was measured using real-time qPCR. n = 6–8 mice in each group. Data have been presented as mean values with standard deviation. *P < 0.05. Statistical differences were analyzed by one-way analysis of variance with Bonferroni post hoc. For non-normally distributed data, the Kruskal–Wallis test was used with Mann-Whitney U post hoc.
3.6 Effects of paternal n-3 PUFAs on gene DNA methylation in the offspring
Alterations in the average DNA methylation fractions of the leptin promoter in the adipose tissue was only observed upon administration of the paternal n-3 H diet, and in adult F1 males. Paternal n-3 N and n-3 H diets decreased the average DNA methylation fractions of H19 in adult F1 males, and Igf2 DMRs in both juvenile and adult F1 males, but elevated those of Igf2 DMR in adult F2 males. Meanwhile, paternal n-3 N and n-3 H diets increased the average DNA methylation fractions of Kcnq1ot1 DMR in adult F1 males, but decreased them in adult F2 males and females (Table 6). The methylation fractions for the specific CpG sites are shown in Supplementary Tables 4–8.
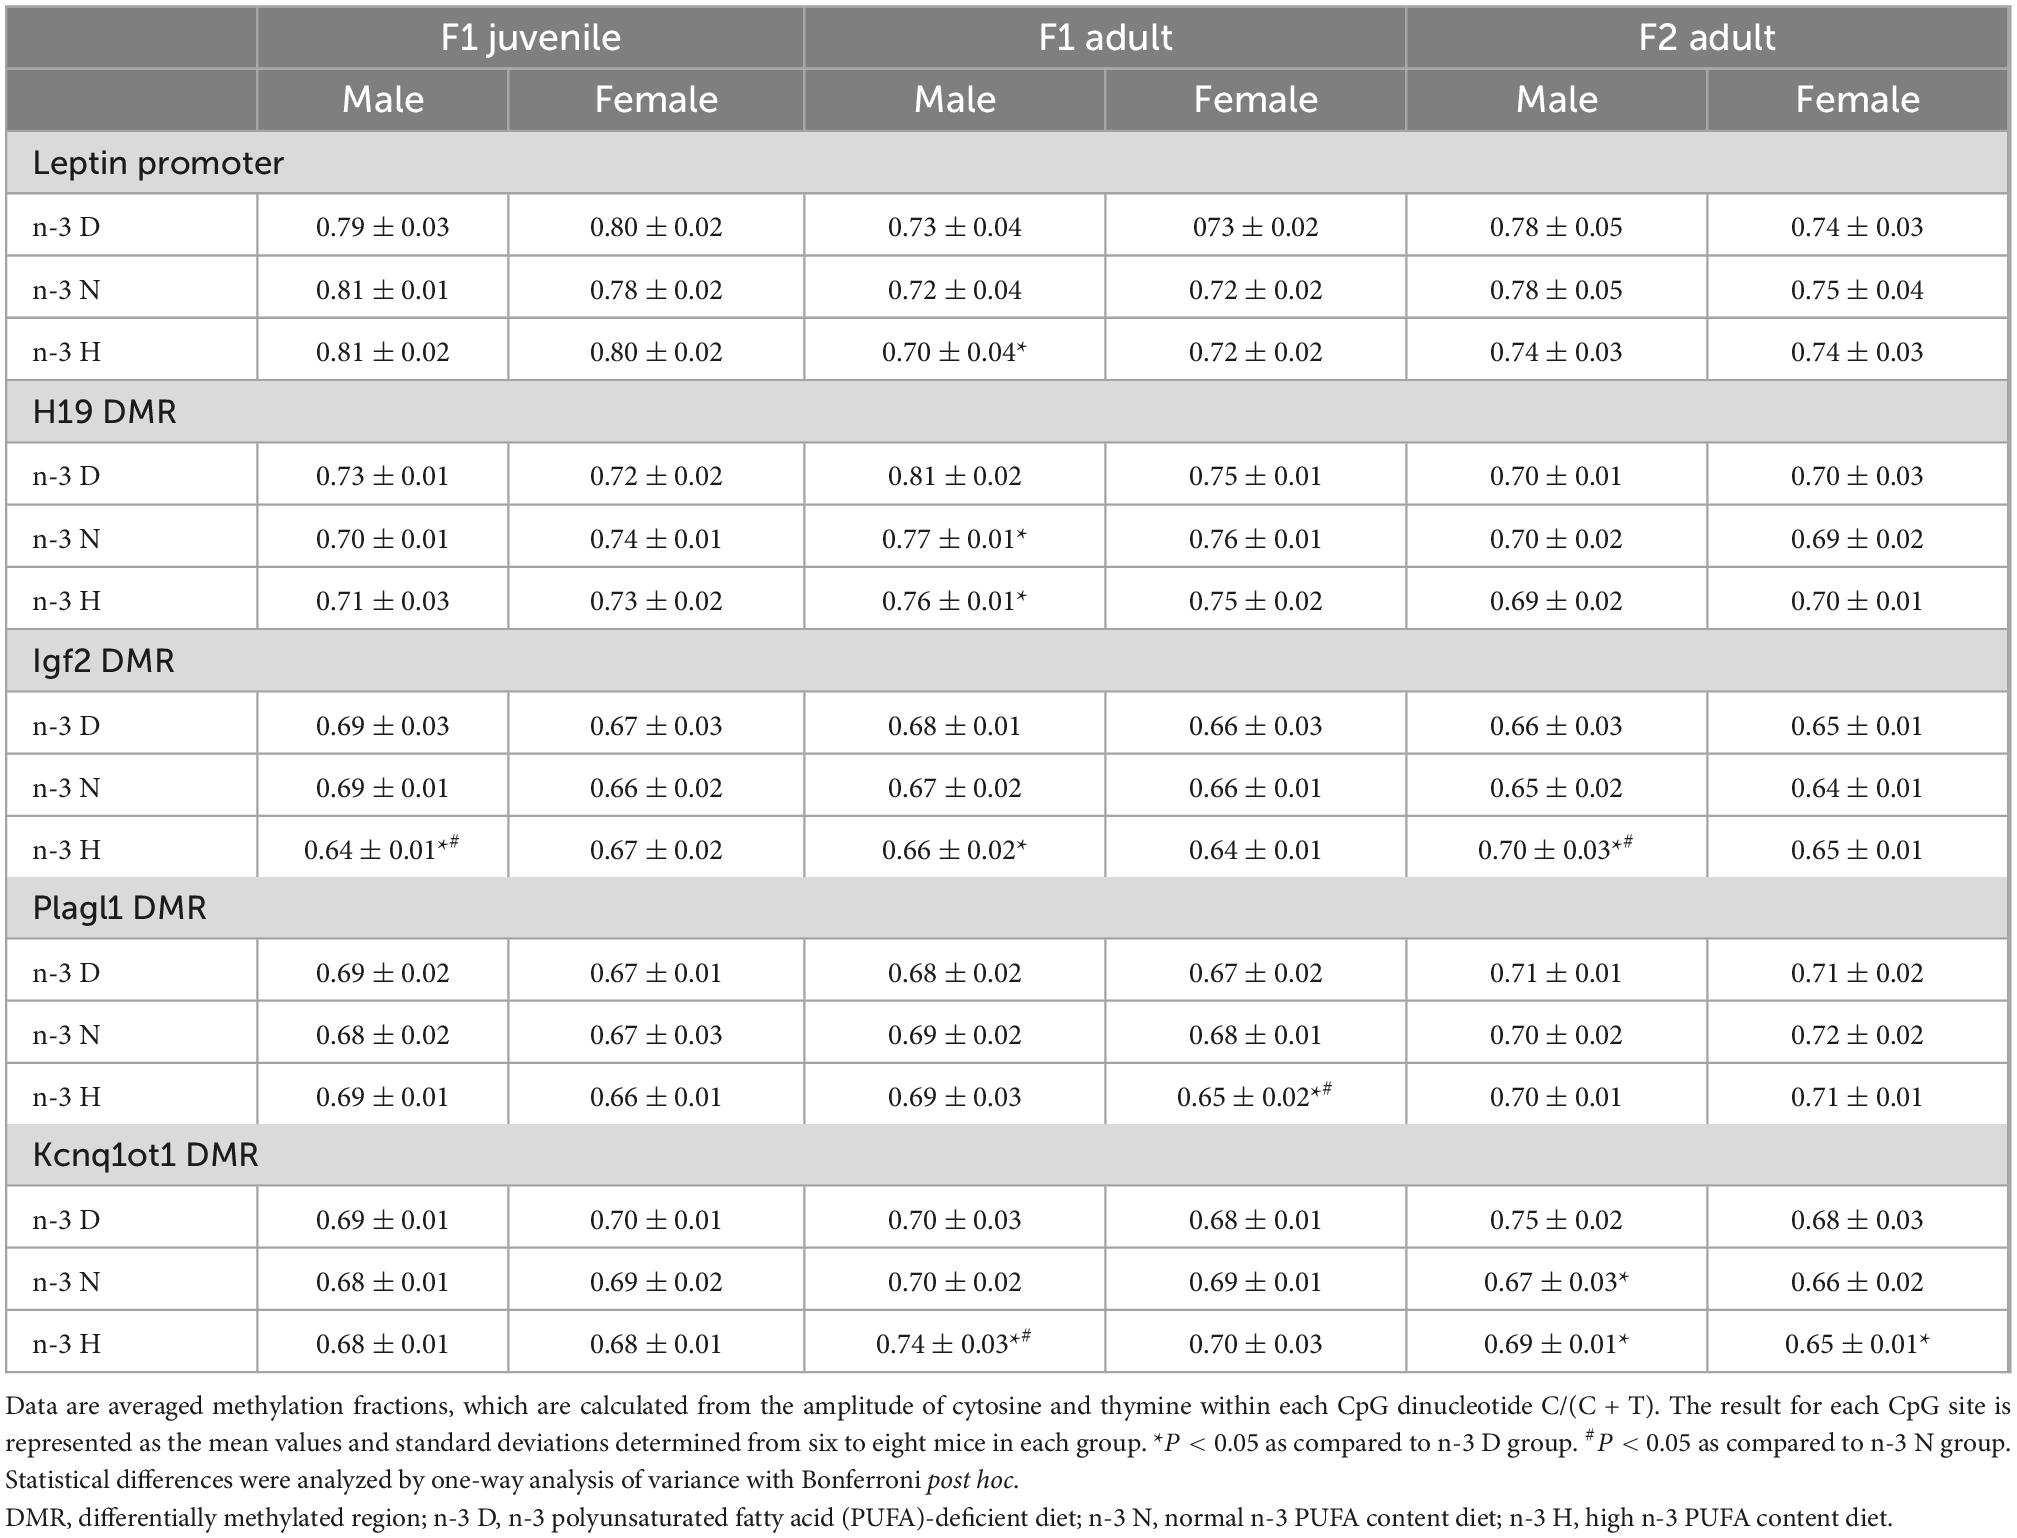
Table 6. Effects of paternal n-6: n-3 PUFAs on DNA methylation of the leptin promoter and DMRs of imprinted genes in the adipose tissue.
4 Discussion
In the current study, paternal pre-conceptional supplementation with n-3 PUFAs reduced adipose expression and plasma concentrations of leptin in juvenile F1 males and females, as well as adult F1 males and F2 females, accompanied by upregulated expression of Lepr in the hypothalamus. Meanwhile, the expression of imprinted genes (H19, Igf2, Igf2r, Plagl1, Cdkn1c, Kcnq1ot1, Peg3, and Grb10) in the adipose tissue was greatly altered in juvenile or adult F1 males, but not F1 females, upon paternal n-3 PUFA supplementation. However, in adult F2 offspring, greater effects of paternal n-3 PUFAs on imprinted gene expression were observed in females than in males. In addition, the expression of imprinted genes (Igf2, Igf2r, Plagl1, Cdkn1c, Kcnq1ot1, Peg3, or Grb10) in the testes was altered by paternal n-3 PUFAs, with altered expression of epigenetic regulators, Dnmt3 (3a and 3b) and Hdacs (1, 2, 3, 6, and 9), in juvenile or adult F1 offspring, as well as adult F2 offspring.
In keeping with the reduced effects of paternal n-3 PUFA supplementation on offspring Lep expression described herein, studies on maternal intervention have shown that maternal n-3 PUFA supplementation lowers leptin levels in the offspring (31–33). The lower leptin levels caused by parental n-3 PUFA supplementation might be helpful for the offspring’s health, because relatively lower leptin levels during early life or adulthood can improve the development of central and peripheral systems (30–34, 36) and further prevent the occurrence of metabolic diseases in later life (24–28). Adipoq and Retn, which are adipokines secreted by adipose tissue, are important for maintaining homeostasis of insulin action, energy, glucose, lipids, and inflammation (78, 79). In our study, paternal n-3 PUFA supplementation had no effect on the adipose expression of Adipoq and Retn, in both the F1 and F2 generations. To date, only a few studies have demonstrated that maternal DHA supplementation during pregnancy and lactation increases adipose expression of Adipoq in animals, and that higher maternal n-3 PUFAs are inversely related to Adipoq expression in early childhood; however, none of these associations were found to persist in mid-childhood (80, 81).
Interestingly, we found that paternal n-3 PUFAs reduced leptin levels in adult offspring in a sex-specific manner, with effects on F1 males and F2 females. In keeping with this, peri-conceptional exposure to other nutritional changes (e.g., obesity, fructose-rich diet, and Zn deficiency) is sufficient to shape offspring expression patterns of metabolism-associated genes, characterized by impacts on males instead of females in the F1 generation (82–86). However, inconsistent results have also been reported, with female (but not male) offspring from fathers fed a high-fat diet before mating displaying impaired pancreatic β-cell function with increased body weight (87). In addition, maternal and paternal deficiency of endothelial nitric oxide synthase, which mediates the effects of n-3 PUFAs on leptin expression in endothelial progenitor cells (88), determines the mouse fatty liver phenotype in female and male offspring, respectively (89, 90). A study on F2 offspring indicated that paternal pre-conceptional high- fat-, sucrose-, and salt-rich diets predispose female F2 offspring to chronic kidney disease in rats (91). Herein, the variations in leptin expression between the sexes might also be due to biological differences. It has been demonstrated that sexual dimorphism in leptin plasma levels and adipose mRNA expression is apparent early in life and becomes more marked with age, and this can be influenced by food intake, diurnal rhythm, and species (92–95). Male mice in the fed state had higher (92) or similar (93) circulating leptin levels than female mice, probably because of the increased adipose tissue mass apparent in males, as compared to females (92, 94). However, during fasting, the reduction in leptin was more pronounced in males than in females, resulting in a higher plasma leptin level after fasting in females (93), which is consistent with the findings in the fasted state in the current study. In humans, females naturally have higher fat mass and circulating serum leptin concentrations than males, which may mask any association between paternal n-3 PUFAs and leptin expression (95). The same was true for the mouse model used in the present study.
It has been reported that paternal nutrition before conception (such as a high-fat diet) can over multiple generations have effects on offspring metabolic traits, including the expression of Adipoq and Lep, and their gene promoter methylation and histone modification in the adipose tissue (96). In this study, paternal n-3 H diet caused a reduction in the average DNA methylation fractions of the Lep promoter exclusively in adult male F1 offspring, which could not explain for the downregulated Lep mRNA expression caused by both paternal n-3 N and n-3 H diets in both juvenile and adult F1 males as well as adult F2 females. Thus, whether other types of epigenetic pathways, such as histone modification and altered binding domain proteins (36) at the Lep promoter, might contribute to the effects of paternal n-3 PUFAs on offspring leptin programming needs to be elucidated in the future.
Furthermore, determination of the imprinted genes associated with growth and development showed that the effects of paternal n-3 N and n-3 H diets on gene imprinting in the adipose tissue of juvenile and adult F1 males and adult F2 females were similar, with altered expression of H19, Plagl1, Cdkn1c, Kcnq1ot1, Peg3, or Grb10 being common. PCA results showed that besides H19 and Igf2r in juveniles, and Mest, Dlk1, and Magel2 in adults, Plagl1, Cdkn1c, and Kcnq1ot1 contributed the most to variation in adipose tissue expression in all offspring. Linear correlation analysis indicated that most of these genes were closely correlated with Lep mRNA expression, implying that they may be involved in the inhibitory effects of paternal n-3 PUFA supplementation on leptin production. This is consistent with other reports that imprinted genes may regulate leptin expression (47–51, 61–68). Simultaneously, the testes in juvenile F1 offspring, and adult F1 and F2 offspring had altered expression of the same genes, Plagl1, Cdkn1c, Kcnq1ot1, Peg3, and Grb10, upon paternal n-3 PUFA supplementation. This hints at the possibility that the paternal n-3 PUFA supplementation-induced epigenetic memory, particularly imprinting of genes (Plagl1, Cdkn1c, and Kcnq1ot1), which occurs during germ cell development, might contribute to transgenerational transmission.
Moreover, the paternal n-3 PUFA-mediated alterations in adipose expression of the above-mentioned imprinted genes occurred in opposite directions between juvenile and adult male F1 offspring, and between adult male F1 offspring and female F2 offspring. However, in these offspring mice, leptin expression in the adipose tissue was consistently downregulated by paternal n-3 PUFA supplementation. Therefore, the positive or negative effects of imprinted genes on leptin production and related metabolic processes may be complicated. Studies have indicated that spatiotemporal regulation of imprinted genes and their activities vary with life stages, sex, and genetic background (47, 97, 98). For example, Bergmann et al. found that deletion of Nnat in mice of the 129S2/Sv background, but not the C57BL/6J background, causes postnatal growth-restriction with reduced adipose tissue accumulation, followed by catch-up growth after weaning (98). Male mice that inherit a Peg3 deletion from their father have growth retardation at birth and delayed adipose accumulation after weaning, but enhanced white adipose deposition with high levels of circulating leptin in adulthood (47). However, females with an ablated Peg3 gene are poor mothers who fail to increase food intake in early gestation and consequently have a reduced postpartum adipose reserve (97). Thus, in our study, the paternal n-3 PUFA supplementation-mediated increased expression of Peg3 observed in F1 males, but decreased expression observed in F2 females, may explain the decrease in leptin expression in both adult F1 males and F2 females. However, it remains unclear whether this phenomenon can be extended to other imprinted genes, among which the expression of Plagl1, Cdkn1c, Kcnq1ot1, and Peg3, was upregulated in adult F1 males, but downregulated in adult F2 females, upon paternal n-3 PUFA supplementation.
The parent-of-origin-specific acquisition of DNA methylation marks at DMRs in the germline is essential for the monoallelic expression of imprinted genes in embryos, and is retained as the memory of parental origin after fertilization (99). Generally, methylation of imprinting control region 1 (ICR1) at the H19/IGF2 locus and unmethylation of ICR2 at the Cdkn1c/Kcnq1ot1 locus on the paternal allele initiates the expression of Igf2 and Kcnq1ot1, with silenced expression of H19 and Cdkn1c (46). In the present study, we found that the paternal n-3 H diet decreased the average DNA methylation fractions of H19 DMR (ICR1) and Igf2 DMR in both juvenile and adult F1 males, but elevated them in adult F2 males. Meanwhile, the paternal n-3 N and n-3 H diets increased the average DNA methylation fractions of Kcnq1ot1 DMR (ICR2) in adult F1 males, but decreased them in adult F2 males and females. Alterations in DMR methylation of these imprinted genes did not match their mRNA expression levels. This might be attributable to the contribution of other pathways, such as histone modification and non-coding RNA (6), which need to be investigated in the future.
Accumulating evidence indicates that the n-6: n-3 PUFAs balance is an important factor in the maintenance of body homeostasis, normal development, and mental health throughout the life cycle, with a n-6: n-3 PUFAs ratio of 1:1–2:1 being considered an optimal target for health (71). Maternal intervention studies have demonstrated that reduction of the n-6: n-3 PUFA ratio from the range of 9–7:1 to that of 3.5–1:1 has more beneficial effects on problem-solving in infancy and obesity-prevention at preschool age (100–102). In the current study, we found that a paternal diet with an n-6: n-3 ratio of 1.5:1 altered more parameters than one with a ratio of 4.3:1, in both the adipose tissue and testis of mice, thereby implying a dose-dependent effect of n-3 PUFAs, to some extent.
To our knowledge, this is the first study to confirm the effects of the paternal dietary ratio of n-6: n-3 PUFAs on leptin expression and associated gene imprinting in offspring. However, some limitations of the current study must be addressed. Although several imprinted genes have been shown to influence leptin expression, the possibility that alterations in leptin expression result from adiposity changes induced by these imprinted genes cannot be ruled out. It is not known whether the imprinted gene products directly regulate leptin expression, neither is the underlying mechanism(s); this question has not been answered in the current study as well. Thus, the causal relationship between imprinted genes and leptin expression should be investigated intensively, as it may clarify the role of diet- and environment-associated gene imprinting in health and disease.
In summary, in mice, a lower paternal n-6: n-3 PUFA ratio with n-3 PUFA supplementation during pre-conception reduced the adipose mRNA expression of Lep and its plasma levels in juvenile male and female F1 offspring as well as adult male F1 and female F2 offspring, with concomitant alterations in the expression of imprinted genes, both in the adipose tissue and testis. These data suggest that paternal n-3 PUFAs program leptin expression, possibly through gene imprinting in a sex-specific manner over successive generations, and thus, may be beneficial for offspring growth and long-term health. It would be of extreme value to verify the findings of this study in humans.
Data availability statement
The original contributions presented in this study are included in the article/Supplementary material, further inquiries can be directed to the corresponding author.
Ethics statement
The animal study was reviewed and approved by the Ethic Committee of the National Institute of Occupational Health and Poison Control, China CDC.
Author contributions
QS and KQ contributed to the study conception and design and wrote the manuscript. QS and XL performed the experiments and collected the data. XF and RW performed the statistical analyses. All authors commented on the previous versions of the manuscript and approved the final manuscript.
Funding
This work was supported by the National Natural Science Foundation of China (to KQ, grant no. 81670775) and the Research Funds of Profession Quota Budget from the Beijing Municipal Science and Technology Commission (grant no. 2021-bjsekyjs to KQ).
Conflict of interest
The authors declare that the research was conducted in the absence of any commercial or financial relationships that could be construed as a potential conflict of interest.
Publisher’s note
All claims expressed in this article are solely those of the authors and do not necessarily represent those of their affiliated organizations, or those of the publisher, the editors and the reviewers. Any product that may be evaluated in this article, or claim that may be made by its manufacturer, is not guaranteed or endorsed by the publisher.
Supplementary material
The Supplementary Material for this article can be found online at: https://www.frontiersin.org/articles/10.3389/fnut.2022.1043876/full#supplementary-material
Footnotes
References
1. Barker D. Fetal origins of coronary heart disease. BMJ. (1995) 311:171–4. doi: 10.1136/bmj.311.6998.171
2. Gluckman P, Hanson M, Beedle A. Early life events and their consequences for later disease: a life history and evolutionary perspective. Am J Hum Biol. (2007) 19:1–19. doi: 10.1002/ajhb.20590
3. Soubry A. POHaD: why we should study future fathers. Environ Epigenet. (2018) 4:dvy007. doi: 10.1093/eep/dvy007
4. Champroux A, Cocquet J, Henry-Berger J, Drevet J, Kocer AA. Decade of exploring the mammalian sperm epigenome: paternal epigenetic and transgenerational inheritance. Front Cell Dev Biol. (2018) 6:50. doi: 10.3389/fcell.2018.00050
5. Dimofski P, Meyre D, Dreumont N, Leininger-Muller B. Consequences of paternal nutrition on offspring health and disease. Nutrients. (2021) 13:2818. doi: 10.3390/nu13082818
6. Ryan C, Kuzawa C. Germline epigenetic inheritance: challenges and opportunities for linking human paternal experience with offspring biology and health. Evol Anthropol. (2020) 29:180–200. doi: 10.1002/evan.21828
7. Bygren L, Kaati G, Edvinsson S. Longevity determined by paternal ancestors’ nutrition during their slow growth period. Acta Biotheor. (2001) 49:53–9. doi: 10.1023/a:1010241825519
8. Pembrey M, Bygren L, Kaati G, Edvinsson S, Northstone K, Sjöström M, et al. Sex-specific, male-line transgenerational responses in humans. Eur J Hum Genet. (2006) 14:159–66. doi: 10.1038/sj.ejhg.5201538
9. Kaati G, Bygren L, Edvinsson S. Cardiovascular and diabetes mortality determined by nutrition during parents’ and grandparents’ slow growth period. Eur J Hum Genet. (2002) 10:682–8. doi: 10.1038/sj.ejhg.5200859
10. Cropley J, Eaton S, Aiken A, Young P, Giannoulatou E, Ho J, et al. Male-lineage transmission of an acquired metabolic phenotype induced by grand-paternal obesity. Mol Metab. (2016) 5:699–708. doi: 10.1016/j.molmet.2016.06.008
11. Chambers T, Morgan M, Heger A, Sharpe R, Drake A. High-fat diet disrupts metabolism in two generations of rats in a parent-of-origin specific manner. Sci Rep. (2016) 6:31857. doi: 10.1038/srep31857
12. Fullston T, Ohlsson Teague E, Palmer N, DeBlasio M, Mitchell M, Corbett M, et al. Paternal obesity initiates metabolic disturbances in two generations of mice with incomplete penetrance to the F2 generation and alters the transcriptional profile of testis and sperm microRNA content. FASEB J. (2013) 27:4226–43. doi: 10.1096/fj.12-224048
13. Zhang Z, Chen J, Luo B, Ni M, Liu X, Zeng L, et al. Maternal inflammation induces spatial learning and memory impairment in the F1 and F2 generations of mice via sex-specific epigenetic mechanisms. Brain Res Bull. (2022) 188:143–54. doi: 10.1016/j.brainresbull.2022.08.001
14. Hellmann J, Carlson E, Bell A. Sex-specific plasticity across generations II: grandpaternal effects are lineage specific and sex specific. J Anim Ecol. (2020) 89:2800–12. doi: 10.1111/1365-2656.13365
15. Zhang Y, Proenca R, Maffei M, Barone M, Leopold L, Friedman J. Positional cloning of the mouse obese gene and its human homologue. Nature. (1994) 372:425–32. doi: 10.1038/372425a0
16. Izquierdo A, Crujeiras A, Casanueva F, Carreira M. Leptin, obesity, and leptin resistance: where are we 25 years later? Nutrients. (2019) 11:2704. doi: 10.3390/nu11112704
17. Misch M, Puthanveetil P. The head-to-toe hormone: leptin as an extensive modulator of physiologic systems. Int J Mol Sci. (2022) 23:5439. doi: 10.3390/ijms23105439
18. Flier J, Maratos-Flier E. Leptin’s physiologic role: does the emperor of energy balance have no clothes? Cell Metab. (2017) 26:24–6. doi: 10.1016/j.cmet.2017.05.013
19. Ahima R, Flier J. Leptin. Annu Rev Physiol. (2000) 62:413–37. doi: 10.1146/annurev.physiol.62.1.413
21. Zhao S, Li N, Zhu Y, Straub L, Zhang Z, Wang M, et al. Partial leptin deficiency confers resistance to diet-induced obesity in mice. Mol Metab. (2020) 37:100995. doi: 10.1016/j.molmet.2020.100995
22. Zhao S, Zhu Y, Schultz R, Li N, He Z, Zhang Z, et al. Partial leptin reduction as an insulin sensitization and weight loss strategy. Cell Metab. (2019) 30:706–19.e6. doi: 10.1016/j.cmet.2019.08.005
23. Haugen A, Schug T, Collman G, Heindel J. Evolution of DOHaD: the impact of environmental health sciences. J Dev Orig Health Dis. (2015) 6:55–64. doi: 10.1017/S2040174414000580
24. Granado M, Fuente-Martín E, García-Cáceres C, Argente J, Chowen J. Leptin in early life: a key factor for the development of the adult metabolic profile. Obes Facts. (2012) 5:138–50. doi: 10.1159/000336967
25. Kim J, Lee B, Jeong J. Temporal leptin to determine cardiovascular and metabolic fate throughout the life. Nutrients. (2020) 12:3256. doi: 10.3390/nu12113256
26. Li L, Rifas-Shiman S, Aris I, Mantzoros C, Hivert M, Oken E. Leptin trajectories from birth to mid-childhood and cardio-metabolic health in early adolescence. Metabolism. (2019) 91:30–8. doi: 10.1016/j.metabol.2018.11.003
27. Telschow A, Ferrari N, Deibert C, Flöck A, Merz W, Gembruch U, et al. High maternal and low cord blood leptin are associated with BMI-SDS gain in the first year of life. Obes Facts. (2019) 12:575–85. doi: 10.1159/000502421
28. Li N, Arbuckle T, Muckle G, Lanphear B, Boivin M, Chen A, et al. Associations of cord blood leptin and adiponectin with children’s cognitive abilities. Psychoneuroendocrinology. (2019) 99:257–64. doi: 10.1016/j.psyneuen.2018.10.021
29. Montserrat-de la Paz S, Pérez-Pérez A, Vilariño-García T, Jiménez-Cortegana C, Muriana F, Millán-Linares M, et al. Nutritional modulation of leptin expression and leptin action in obesity and obesity-associated complications. J Nutr Biochem. (2021) 89:108561. doi: 10.1016/j.jnutbio.2020.108561
30. Xavier S, Gili J, McGowan P, Younesi S, Wright P, Walker D, et al. High maternal omega-3 supplementation dysregulates body weight and leptin in newborn male and female rats: implications for hypothalamic developmental programming. Nutrients. (2020) 13:89. doi: 10.3390/nu13010089
31. Reddy K, Naidu K. Maternal supplementation of α-linolenic acid in normal and protein-restricted diets modulate lipid metabolism, adipose tissue growth and leptin levels in the suckling offspring. Eur J Nutr. (2015) 54:761–70. doi: 10.1007/s00394-014-0755-3
32. Korotkova M, Gabrielsson B, Lönn M, Hanson L, Strandvik B. Leptin levels in rat offspring are modified by the ratio of linoleic to alpha-linolenic acid in the maternal diet. J Lipid Res. (2002) 43:1743–9. doi: 10.1194/jlr.m200105-jlr200
33. Maslova E, Rifas-Shiman S, Olsen S, Gillman M, Oken E. Prenatal n-3 long-chain fatty acid status and offspring metabolic health in early and mid-childhood: results from project viva. Nutr Diabetes. (2018) 8:29. doi: 10.1038/s41387-018-0040-2
34. Coleman D, Murphy K, Relling A. Prepartum fatty acid supplementation in sheep. II. Supplementation of eicosapentaenoic acid and docosahexaenoic acid during late gestation alters the fatty acid profile of plasma, colostrum, milk and adipose tissue, and increases lipogenic gene expression of adipose tissue. J Anim Sci. (2018) 96:1181–204. doi: 10.1093/jas/skx013
35. Shen W, Wang C, Xia L, Fan C, Dong H, Deckelbaum R, et al. Epigenetic modification of the leptin promoter in diet-induced obese mice and the effects of N-3 polyunsaturated fatty acids. Sci Rep. (2014) 4:5282. doi: 10.1038/srep05282
36. Li P, Chen X, Chen Y, Fan X, Tang T, Wang R, et al. DHA-rich n–3 PUFAs intake from the early and mid pregnancy decreases the weight gain by affecting the DNA methylation status in Chinese han infants. Food Nutr Res. (2021) 65:7548. doi: 10.29219/fnr.v65.7548
37. delBarco-Trillo J, Mateo R, Roldan E. Differences in the fatty-acid composition of rodent spermatozoa are associated to levels of sperm competition. Biol Open. (2015) 4:466–73. doi: 10.1242/bio.201411288
38. Esmaeili V, Shahverdi A, Moghadasian M, Alizadeh A. Dietary fatty acids affect semen quality: a review. Andrology. (2015) 3:450–61. doi: 10.1111/andr.12024
39. Nassan F, Chavarro J, Tanrikut C. Diet and men’s fertility: does diet affect sperm quality? Fertil Steril. (2018) 110:570–7. doi: 10.1016/j.fertnstert.2018.05.025
40. Goyal D, Limesand S, Goyal R. Epigenetic responses and the developmental origins of health and disease. J Endocrinol. (2019) 242:T105–19. doi: 10.1530/JOE-19-0009
41. Morgan H, Paganopoulou P, Akhtar S, Urquhart N, Philomin R, Dickinson Y, et al. Paternal diet impairs F1 and F2 offspring vascular function through sperm and seminal plasma specific mechanisms in mice. J Physiol. (2020) 598:699–715. doi: 10.1113/JP278270
42. Watkins A, Dias I, Tsuro H, Allen D, Emes R, Moreton J, et al. Paternal diet programs offspring health through sperm- and seminal plasma-specific pathways in mice. Proc Natl Acad Sci USA. (2018) 115:10064–9. doi: 10.1073/pnas.1806333115
43. Cassidy F, Charalambous M. Genomic imprinting, growth and maternal-fetal interactions. J Exp Biol. (2018) 221:jeb164517. doi: 10.1242/jeb.164517
44. Thamban T, Agarwaal V, Khosla S. Role of genomic imprinting in mammalian development. J Biosci. (2020) 45:20. doi: 10.1007/s12038-019-9984-1
45. Mitchell M, Strick R, Strissel P, Dittrich R, McPherson N, Lane M, et al. Gene expression and epigenetic aberrations in F1-placentas fathered by obese males. Mol Reprod Dev. (2017) 84:316–28. doi: 10.1002/mrd.22784
46. Elhamamsy A. Role of DNA methylation in imprinting disorders: an updated review. J Assist Reprod Genet. (2017) 34:549–62. doi: 10.1007/s10815-017-0895-5
47. Curley J, Pinnock S, Dickson S, Thresher R, Miyoshi N, Surani M, et al. Increased body fat in mice with a targeted mutation of the paternally expressed imprinted gene Peg3. FASEB J. (2005) 19:1302–4. doi: 10.1096/fj.04-3216fje
48. Nikonova L, Koza R, Mendoza T, Chao P, Curley J, Kozak L. Mesoderm-specific transcript is associated with fat mass expansion in response to a positive energy balance. FASEB J. (2008) 22:3925–37. doi: 10.1096/fj.08-108266
49. Cowley M, Garfield A, Madon-Simon M, Charalambous M, Clarkson R, Smalley M, et al. Developmental programming mediated by complementary roles of imprinted Grb10 in mother and pup. PLoS Biol. (2014) 12:e1001799. doi: 10.1371/journal.pbio.1001799
50. Li Y, Zhang Y, Hu Q, Egranov S, Xing Z, Zhang Z, et al. Functional significance of gain-of-function H19 lncRNA in skeletal muscle differentiation and anti-obesity effects. Genome Med. (2021) 13:137. doi: 10.1186/s13073-021-00937-4
51. Cleaton M, Dent C, Howard M, Corish J, Gutteridge I, Sovio U, et al. Fetus-derived DLK1 is required for maternal metabolic adaptations to pregnancy and is associated with fetal growth restriction. Nat Genet. (2016) 48:1473–80.
52. Takahashi M, Kamei Y, Ezaki O. Mest/Peg1 imprinted gene enlarges adipocytes and is a marker of adipocyte size. Am J Physiol Endocrinol Metab. (2005) 288:E117–24. doi: 10.1152/ajpendo.00244.2004
53. Madon-Simon M, Cowley M, Garfield A, Moorwood K, Bauer S, Ward A. Antagonistic roles in fetal development and adult physiology for the oppositely imprinted Grb10 and Dlk1 genes. BMC Biol. (2014) 12:771. doi: 10.1186/s12915-014-0099-8
54. Smith F, Holt L, Garfield A, Charalambous M, Koumanov F, Perry M, et al. Mice with a disruption of the imprinted Grb10 gene exhibit altered body composition, glucose homeostasis, and insulin signaling during postnatal life. Mol Cell Biol. (2007) 27:5871–86. doi: 10.1128/MCB.02087-06
55. Tanaka K, Besson V, Rivagorda M, Oury F, Marazzi G, Sassoon D. Paternally expressed gene 3 (Pw1/Peg3) promotes sexual dimorphism in metabolism and behavior. PLoS Genet. (2022) 18:e1010003. doi: 10.1371/journal.pgen.1010003
56. Moon Y, Smas C, Lee K, Villena J, Kim K, Yun E, et al. Mice lacking paternally expressed pref-1/Dlk1 display growth retardation and accelerated adiposity. Mol Cell Biol. (2002) 22:5585–92. doi: 10.1128/MCB.22.15.5585-5592.2002
57. Leaton M, Dent C, Howard M, Corish J, Gutteridge I, Sovio U, et al. Fetus-derived DLK1 is required for maternal metabolic adaptations to pregnancy and is associated with fetal growth restriction. Nat Genet. (2016) 48:1473–80.
58. Charalambous M, Da Rocha S, Radford E, Medina-Gomez G, Curran S, Pinnock S, et al. DLK1/PREF1 regulates nutrient metabolism and protects from steatosis. Proc Natl Acad Sci USA. (2014) 111:16088–93. doi: 10.1073/pnas.1406119111
59. Bischof J, Stewart C, Wevrick R. Inactivation of the mouse Magel2 gene results in growth abnormalities similar to prader-willi syndrome. Hum Mol Genet. (2007) 16:2713–9. doi: 10.1093/hmg/ddm225
60. Pravdivyi I, Ballanyi K, Colmers W, Wevrick R. Progressive postnatal decline in leptin sensitivity of arcuate hypothalamic neurons in the Magel2-null mouse model of prader-willi syndrome. Hum Mol Genet. (2015) 24:4276–83. doi: 10.1093/hmg/ddv159
61. Vega-Benedetti A, Saucedo C, Zavattari P, Vanni R, Zugaza J, Parada L. PLAGL1: an important player in diverse pathological processes. J Appl Genet. (2017) 58:71–8. doi: 10.1007/s13353-016-0355-4
62. Mirowska A, Sledzinski T, Smolenski R, Swierczynski J. Down-regulation of Zac1 gene expression in rat white adipose tissue by androgens. J Steroid Biochem Mol Biol. (2014) 140:63–70. doi: 10.1016/j.jsbmb.2013.11.015
63. Chiesa N, De Crescenzo A, Mishra K, Perone L, Carella M, Palumbo O, et al. The KCNQ1OT1 imprinting control region and non-coding RNA: new properties derived from the study of Beckwith-Wiedemann syndrome and Silver-Russell syndrome cases. Hum Mol Genet. (2012) 21:10–25. doi: 10.1093/hmg/ddr419
64. Eggermann T, Binder G, Brioude F, Maher E, Lapunzina P, Cubellis M, et al. CDKN1C mutations: two sides of the same coin. Trends Mol Med. (2014) 20:614–22. doi: 10.1016/j.molmed.2014.09.001
65. Van de Pette M, Tunster S, John R. Loss of imprinting of Cdkn1c protects against age and diet-induced obesity. Int J Mol Sci. (2018) 19:2734. doi: 10.3390/ijms19092734
66. Van De Pette M, Tunster S, McNamara G, Shelkovnikova T, Millership S, Benson L, et al. Cdkn1c boosts the development of brown adipose tissue in a murine model of Silver Russell syndrome. PLoS Genet. (2016) 12:e1005916. doi: 10.1371/journal.pgen.1005916
67. Sun T, Wang F, Hu G, Li Z. Salvianolic acid B activates chondrocytes autophagy and reduces chondrocyte apoptosis in obese mice via the KCNQ1OT1/miR-128-3p/SIRT1 signaling pathways. Nutr Metab. (2022) 19:53. doi: 10.1186/s12986-022-00686-0
68. Li Y, Chen Y, Liu Z, Lin B, Deng X, Xiao Q, et al. Downregulation of Kcnq1ot1 attenuates β-cell proliferation and insulin secretion via the miR-15b-5p/Ccnd1 and Ccnd2 axis. Acta Diabetol. (2022) 59:885–99. doi: 10.1007/s00592-022-01871-6
69. Tian C, Fan C, Liu X, Xu F, Qi K. Brain histological changes in young mice submitted to diets with different ratios of n-6/n-3 polyunsaturated fatty acids during maternal pregnancy and lactation. Clin Nutr. (2011) 30:659–67. doi: 10.1016/j.clnu.2011.03.002
70. Calder P. Very long-chain n-3 fatty acids and human health: fact, fiction and the future. Proc Nutr Soc. (2018) 77:52–72. doi: 10.1017/S0029665117003950
71. Simopoulos A. Importance of the omega-6/omega-3 balance in health and disease: evolutionary aspects of diet. World Rev Nutr Diet. (2011) 102:10–21. doi: 10.1159/000327785
72. Food and Agriculture Organization. Fats and fatty acids in human nutrition. Report of an expert consultation. FAO Food Nutr Pap. (2010) 91:1–166.
73. Feskens E, Kromhout D. Epidemiologic studies on eskimos and fish intake. Ann N Y Acad Sci. (1993) 683:9–15. doi: 10.1111/j.1749-6632.1993.tb35688.x
74. Heard E, Martienssen R. Transgenerational epigenetic inheritance: myths and mechanisms. Cell. (2014) 157:95–109. doi: 10.1016/j.cell.2014.02.045
75. Fan C, Fu H, Dong H, Lu Y, Lu Y, Qi K. Maternal n-3 polyunsaturated fatty acid deprivation during pregnancy and lactation affects neurogenesis and apoptosis in adult offspring: associated with DNA methylation of brain-derived neurotrophic factor transcripts. Nutr Res. (2016) 36:1013–21. doi: 10.1016/j.nutres.2016.06.005
76. Crossley B, Bai J, Glaser A, Maes R, Porter E, Killian M, et al. Guidelines for Sanger sequencing and molecular assay monitoring. J Vet Diagn Invest. (2020) 32:767–75. doi: 10.1177/1040638720905833
77. Lewin J, Schmitt A, Adorján P, Hildmann T, Piepenbrock C. Quantitative DNA methylation analysis based on four-dye trace data from direct sequencing of PCR amplificates. Bioinformatics. (2004) 20:3005–12. doi: 10.1093/bioinformatics/bth346
78. McTernan C, McTernan P, Harte A, Levick P, Barnett A, Kumar S. Resistin, central obesity, and type 2 diabetes. Lancet. (2002) 359:46–7. doi: 10.1016/s0140-6736(02)07281-1
79. Nigro E, Scudiero O, Monaco M, Palmieri A, Mazzarella G, Costagliola C, et al. New insight into adiponectin role in obesity and obesity-related diseases. Biomed Res Int. (2014) 2014:658913. doi: 10.1155/2014/658913
80. Higashioka M, Hirakawa Y, Kawamura R, Honda T, Hata J, Yoshida D, et al. Ratios of serum eicosapentaenoic acid to arachidonic acid and docosahexaenoic acid to arachidonic acid were inversely associated with serum resistin levels: the Hisayama study. J Diabetes Investig. (2020) 11:482–9. doi: 10.1111/jdi.13129
81. Mostowik M, Gajos G, Zalewski J, Nessler J, Undas A. Omega-3 polyunsaturated fatty acids increase plasma adiponectin to leptin ratio in stable coronary artery disease. Cardiovasc Drugs Ther. (2013) 27:289–95. doi: 10.1007/s10557-013-6457-x
82. Dahlhoff M, Pfister S, Blutke A, Rozman J, Klingenspor M, Deutsch M, et al. Peri-conceptional obesogenic exposure induces sex-specific programming of disease susceptibilities in adult mouse offspring. Biochim Biophys Acta. (2014) 1842:304–17. doi: 10.1016/j.bbadis.2013.11.021
83. Sanchez-Garrido M, Ruiz-Pino F, Velasco I, Barroso A, Fernandois D, Heras V, et al. Intergenerational influence of paternal obesity on metabolic and reproductive health parameters of the offspring: male-preferential impact and involvement of kiss1-mediated pathways. Endocrinology. (2018) 159:1005–18.
84. do Carmo J, Omoto A, Dai X, Moak S, Mega G, Li X, et al. Sex differences in the impact of parental obesity on offspring cardiac SIRT3 expression, mitochondrial efficiency, and diastolic function early in life. Am J Physiol Heart Circ Physiol. (2021) 321:H485–95. doi: 10.1152/ajpheart.00176.2021
85. Ornellas F, Carapeto P, Aguila M, Mandarim-de-Lacerda C. Sex-linked changes and high cardiovascular risk markers in the mature progeny of father, mother, or both father and mother consuming a high-fructose diet. Nutrition. (2020) 71:110612. doi: 10.1016/j.nut.2019.110612
86. Li G, Dong Z, Yue S, Wan D, Yin Y. Paternal Zn-deficiency abolishes metabolic effects in offspring induced by diet type. Anim Nutr. (2022) 8:310–20. doi: 10.1016/j.aninu.2021.09.001
87. Ng S, Lin R, Laybutt D, Barres R, Owens J, Morris M. Chronic high-fat diet in fathers programs β-cell dysfunction in female rat offspring. Nature. (2010) 467:963–6. doi: 10.1038/nature09491
88. Turgeon J, Dussault S, Maingrette F, Groleau J, Haddad P, Perez G, et al. Fish oil-enriched diet protects against ischemia by improving angiogenesis, endothelial progenitor cell function and postnatal neovascularization. Atherosclerosis. (2013) 229:295–303. doi: 10.1016/j.atherosclerosis.2013.05.020
89. Hocher B, Haumann H, Rahnenführer J, Reichetzeder C, Kalk P, Pfab T, et al. Maternal eNOS deficiency determines a fatty liver phenotype of the offspring in a sex dependent manner. Epigenetics. (2016) 11:539–52. doi: 10.1080/15592294.2016.1184800
90. Hocher B, Lu Y, Reichetzeder C, Zhang X, Tsuprykov O, Rahnenführer J, et al. Paternal eNOS deficiency in mice affects glucose homeostasis and liver glycogen in male offspring without inheritance of eNOS deficiency itself. Diabetologia. (2022) 65:1222–36. doi: 10.1007/s00125-022-05700-x
91. Zhang X, Hasan A, Wu H, Gaballa M, Zeng S, Liu L, et al. High-fat, sucrose and salt-rich diet during rat spermatogenesis lead to the development of chronic kidney disease in the female offspring of the F2 generation. FASEB J. (2022) 36:e22259. doi: 10.1096/fj.202101789RR
92. Gui Y, Silha J, Murphy L. Sexual dimorphism and regulation of resistin, adiponectin, and leptin expression in the mouse. Obes Res. (2004) 12:1481–91. doi: 10.1038/oby.2004.185
93. Ahrén B. Diurnal variation in circulating leptin is dependent on gender, food intake and circulating insulin in mice. Acta Physiol Scand. (2000) 169:325–31. doi: 10.1046/j.1365-201x.2000.00746.x
94. Bergmann P, Militzer K, Schmidt P, Büttner D. Sex differences in age development of a mouse inbred strain: body composition, adipocyte size and organ weights of liver, heart and muscles. Lab Anim. (1995) 29:102–9. doi: 10.1258/002367795780740447
95. Nagy T, Gower B, Trowbridge C, Dezenberg C, Shewchuk R, Goran M. Effects of gender, ethnicity, body composition, and fat distribution on serum leptin concentrations in children. J Clin Endocrinol Metab. (1997) 82:2148–52. doi: 10.1210/jcem.82.7.4077
96. Masuyama H, Mitsui T, Eguchi T, Tamada S, Hiramatsu Y. The effects of paternal high-fat diet exposure on offspring metabolism with epigenetic changes in the mouse adiponectin and leptin gene promoters. Am J Physiol Endocrinol Metab. (2016) 311:E236–45. doi: 10.1152/ajpendo.00095.2016
97. Li L, Keverne E, Aparicio S, Ishino F, Barton S, Surani M. Regulation of maternal behavior and offspring growth by paternally expressed Peg3. Science. (1999) 284:330–3. doi: 10.1126/science.284.5412.330
98. Millership S, Tunster S, Van de Pette M, Choudhury A, Irvine E, Christian M, et al. Neuronatin deletion causes postnatal growth restriction and adult obesity in 129S2/Sv mice. Mol Metab. (2018) 18:97–106. doi: 10.1016/j.molmet.2018.09.001
99. Kelsey G, Feil R. New insights into establishment and maintenance of DNA methylation imprints in mammals. Philos Trans R Soc Lond B Biol Sci. (2013) 368:20110336. doi: 10.1098/rstb.2011.0336
100. Hamazaki K, Matsumura K, Tsuchida A, Kasamatsu H, Tanaka T, Ito M, et al. Maternal dietary intake of fish and PUFAs and child neurodevelopment at 6 months and 1 year of age: a nationwide birth cohort-the Japan environment and children’s study (JECS). Am J Clin Nutr. (2020) 112:1295–303. doi: 10.1093/ajcn/nqaa190
101. Brei C, Stecher L, Much D, Karla M, Amann-Gassner U, Shen J, et al. Reduction of the n-6:n-3 long-chain PUFA ratio during pregnancy and lactation on offspring body composition: follow-up results from a randomized controlled trial up to 5 y of age. Am J Clin Nutr. (2016) 103:1472–81. doi: 10.3945/ajcn.115.128520
Keywords: gene imprinting, paternal programming, n-3 fatty acids, leptin, offspring
Citation: Shi Q, Liu X, Fan X, Wang R and Qi K (2022) Paternal dietary ratio of n-6: n-3 polyunsaturated fatty acids programs offspring leptin expression and gene imprinting in mice. Front. Nutr. 9:1043876. doi: 10.3389/fnut.2022.1043876
Received: 15 September 2022; Accepted: 08 December 2022;
Published: 23 December 2022.
Edited by:
Arpita Mukhopadhyay, St. John’s Research Institute, IndiaReviewed by:
Berthold Hocher, Heidelberg University, GermanyAlexandre Fisette, Université du Québec à Trois-Rivières, Canada
Copyright © 2022 Shi, Liu, Fan, Wang and Qi. This is an open-access article distributed under the terms of the Creative Commons Attribution License (CC BY). The use, distribution or reproduction in other forums is permitted, provided the original author(s) and the copyright owner(s) are credited and that the original publication in this journal is cited, in accordance with accepted academic practice. No use, distribution or reproduction is permitted which does not comply with these terms.
*Correspondence: Kemin Qi, ✉ cWlrZW1pbkBiY2guY29tLmNu
 Qiaoyu Shi
 Xuanyi Liu
 Xiuqin Fan
 Rui Wang
 Kemin Qi