- 1Department of Clinical Medicine, Jining Medical University, Jining, Shandong, China
- 2Department of Endocrinology, Affiliated Hospital of Jining Medical University, Jining, Shandong, China
- 3Department of Nutrition, Affiliated Hospital of Jining Medical University, Jining, Shandong, China
Background: The ratio of creatinine to cystatin C (Cre/CysC), a marker of muscle function and muscle mass, can be used to predict sarcopenia in different populations. Since sarcopenia is closely associated with osteoporosis, this study investigated the association between Cre/CysC and bone mineral density (BMD) in patients with type 2 diabetes mellitus (T2DM).
Method: This cross-sectional study included 391 Chinese patients with T2DM. General information, biochemical indicators, and the BMD of lumbar spine (LS), femoral neck (FN), and total hip (TH) were measured.
Results: Pearson correlation analysis showed that Cre/CysC was significantly positively correlated with the BMD of LS (r = 0.170, p = 0.001), FN (r = 0.178, p < 0.001), and TH (r = 0.205, p < 0.001). The results of stepwise linear regression suggested that Cre/CysC was the only biochemical predictor of the BMD at three sites (LS: β = 0.137, p = 0.01; FN: β = 0.097, p = 0.038; TH: β = 0.145, p = 0.002).
Conclusion: In older patients with T2DM, high Cre/CysC value is independently positively associated with BMD and hence, Cre/CysC may serve as a valuable marker of osteoporosis.
Introduction
In the past few years, the incidence of diabetes has increased significantly. According to the 2021 International Diabetes Federation report, diabetes affects approximately 537 million adults aged 20–79 years worldwide, and it is predicted that 783 million people will have diabetes by 2045 (1); thus, diabetes has become an increasingly serious global health problem. Some studies have documented that the risk of osteoporosis is significantly higher in patients with type 2 diabetes mellitus (T2DM) than in those without T2DM (2). The guidelines for primary osteoporosis diagnosis mention bone mineral density (BMD) as an essential marker for the diagnosis of osteoporosis (3). A recent large-scale study assessing the determinants of clinical risk of fractures by genome-wide analysis confirmed that only BMD had a major effect on fractures, and low BMD was a pivotal cause of osteoporotic fracture (4). Therefore, in such patients, early identification of risk factors related to BMD is crucial for the early diagnosis and treatment of osteoporosis and the prevention of adverse fracture outcomes.
Sarcopenia is characterized by both decreased muscle mass and function (5). Compared with the population without diabetes, the incidence of sarcopenia in patients with T2DM increased significantly (6). Studies have shown that muscle mass and muscle function are closely related to bone health, which mainly manifested in the increased risk of falls and fractures (7–9). In the T2DM population, the presence of risk factors, such as reduced physical activity, obesity, and steroid hormone use, will further aggravate muscle and bone diseases.
Creatinine is the product of normal catabolism of muscle tissue and is proportional to muscle mass; however, as renal function affects creatinine level, it cannot be used as a potential indicator of muscle mass in clinical settings. Cystatin C, an endogenous protein, can reliably reflect the glomerular filtration rate (10). Therefore, the ratio of creatinine to cystatin C (Cre/CysC) is considered to be the ratio of muscle mass to total body mass after adjusting for renal function, which reflects muscle volume and is closely related to skeletal muscle mass volume (11). Based on this theory, previous studies have confirmed that Cre/CysC can accurately predict the incidence of sarcopenia in different populations. Osaka et al. have indicated that decreased Cre/CysC is considered an independent predictor of sarcopenia in patients with T2DM (12). Considering the close relationship between muscle mass, muscle function, and osteoporosis, Cre/CysC may be a reliable index for predicting osteoporosis. A study report on indicators of bone properties in older adults showed that Cre/CysC might be used as a biochemical marker of bone property independent of muscle mass in the population with preserved renal function (13). In another study on Japanese postmenopausal women, Cre/CysC had a positive correlation with BMD, and was suggested to be one of the surrogate marker candidates of osteoporosis (3). However, to date, the relationship between Cre/CysC and BMD in patients with T2DM has not been researched. Given these backgrounds, this study aimed to clarify the relationship between serum Cre/CysC and BMD in older patients with T2DM.
Materials and methods
Study patients
This study analyzed data collected from 391 patients at the Department of Endocrinology, Affiliated Hospital of Jining Medical College between June 2021 and April 2022. Information related to demographics, health status and function, health outcomes, including blood biomarker measurements, and BMD measurements, were collected. All patients had been diagnosed with T2DM at baseline according to the 2019 World Health Organization (WHO) standards. The exclusion criteria were as follows: patients younger than 50 years and premenopausal women; patients without anthropometric measures; those lacking blood biochemical index data of creatinine and cystatin C; those lacking BMD examination; those with the presence of malignant tumor, serious liver, kidney, heart disease, or metabolic diseases, such as those involving the pituitary, thyroid, and adrenal glands; and those receiving hemodialysis, immunosuppressive drugs, or drugs that affect bone metabolism, including vitamin D and calcium. The Human Ethics Committee of the Affiliated Hospital of Jining Medical University approved this study.
Body composition measurement
Information on the clinical characteristic, including sex, age, weight, height, body mass index (BMI), blood pressure, duration of diabetes, disease history (such as hypertension, hyperlipidemia, cerebrovascular accident, coronary artery disease, and kidney disease), and drug consumption history were obtained from the electronic medical records of the hospital. Height and weight were measured accurately to 0.1 cm and 0.1 kg, respectively. BMI was calculated as weight (kilograms)/height (meters squared). The duration of diabetes was calculated from the time when T2DM was diagnosed based on the patient’s medical records to the year when blood and BMD tests were performed.
Laboratory measurements
After fasting for 8–12 h, fasting blood samples were obtained from all patients for laboratory analyses. Glucose metabolism indices included the following: glycated hemoglobin (HbA1c), fasting blood glucose (FBG), and serum C-peptide; renal function indices: uric acid (UA), creatinine, and cystatin C; liver function indices: total protein, albumin (ALB), total bilirubin, direct bilirubin, and indirect bilirubin; serum lipid metabolism indices: total cholesterol, triglycerides (TG), high-density lipoprotein (HDL), low-density lipoprotein, and very low-density lipoprotein; thyroid function indices: free triiodothyronine, free thyroxine, and thyroid-stimulating hormone. Parathyroid hormone, calcitonin, 25-hydroxy-vitamin D3, serum calcium, serum magnesium, and serum phosphorus were also measured. In particular, creatinine (mg/dl) was determined using a sarcosine oxidase method (Diacegene, Sichuan, China), and cystatin C was measured by the particle-enhanced turbidimetric assay (Zybio, Chongqing, China). Serum creatinine (mg/L) was divided by serum cystatin C to calculate Cre/CysC (mg/L).
Bone mineral density measurement
Dual-energy X-ray absorptiometry (DEXA) was used to measure BMD (grams per square centimeter). Each patient was measured at three sites: the lumbar spine (LS), femoral neck (FN), and total hip (TH). BMD was measured according to the WHO standards as follows: normal, T-scores ≥−1.0; osteopenia, T-scores between −1.0 and −2.5; and osteoporosis, T-scores <−2.5 (14).
Statistical analysis
All statistical analyses were performed using the SPSS software (V.26.0). Continuous data with a normal distribution are expressed as mean values ± SD, whereas non-normal distributed data are expressed as medians (quartile). An independent sample t-test or Mann–Whitney U test was used to compare the data between the two groups. Categorical data were presented in terms of frequency or percentage and analyzed with Chi-square tests. Pearson’s correlation coefficients were used to examine the correlation between biochemical indices and BMD. Variables that significantly correlated with BMD were included in the multiple stepwise linear regression analysis, and multiple stepwise linear regression analysis was performed using the stepwise selection of the variables to determine the variables independently related to the BMD of the LS, FN, and TH. Receiver operating characteristic (ROC) curves were plotted with osteopenia and osteoporosis as state variable. The area under the curve (AUC) and Youden index were calculated to get cut-off points of Cre/CysC. All tests for statistical significance were two-tailed, and statistical significance was set at p < 0.05.
Results
Patient characteristics
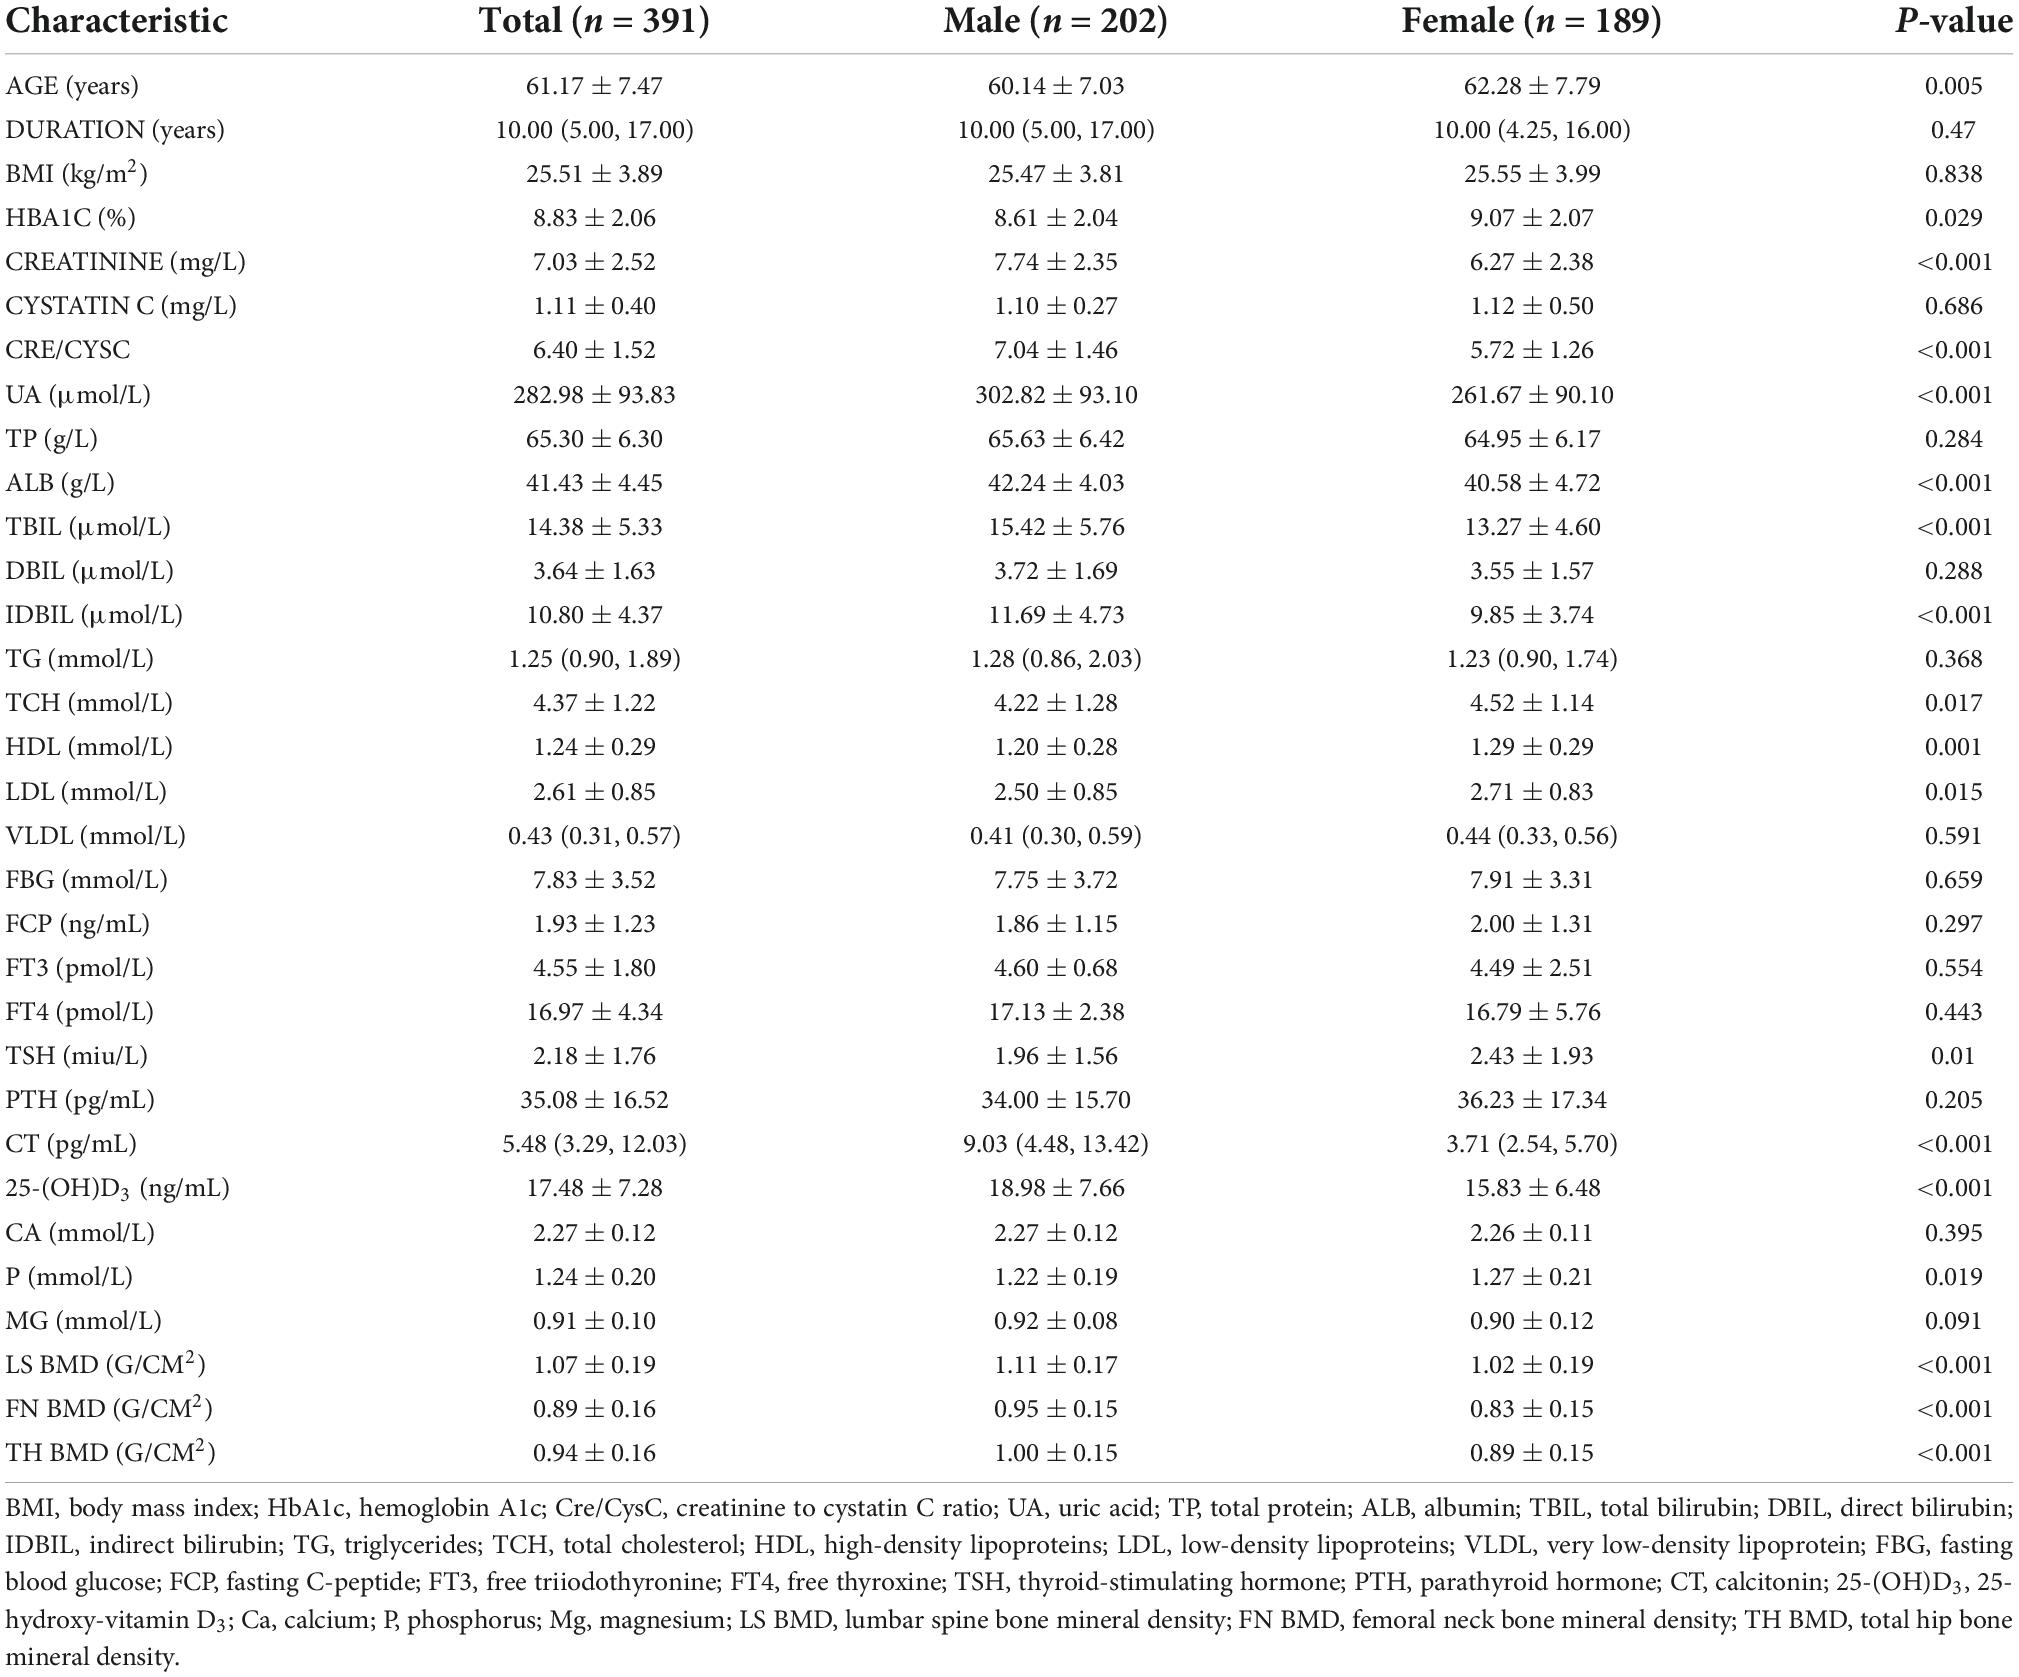
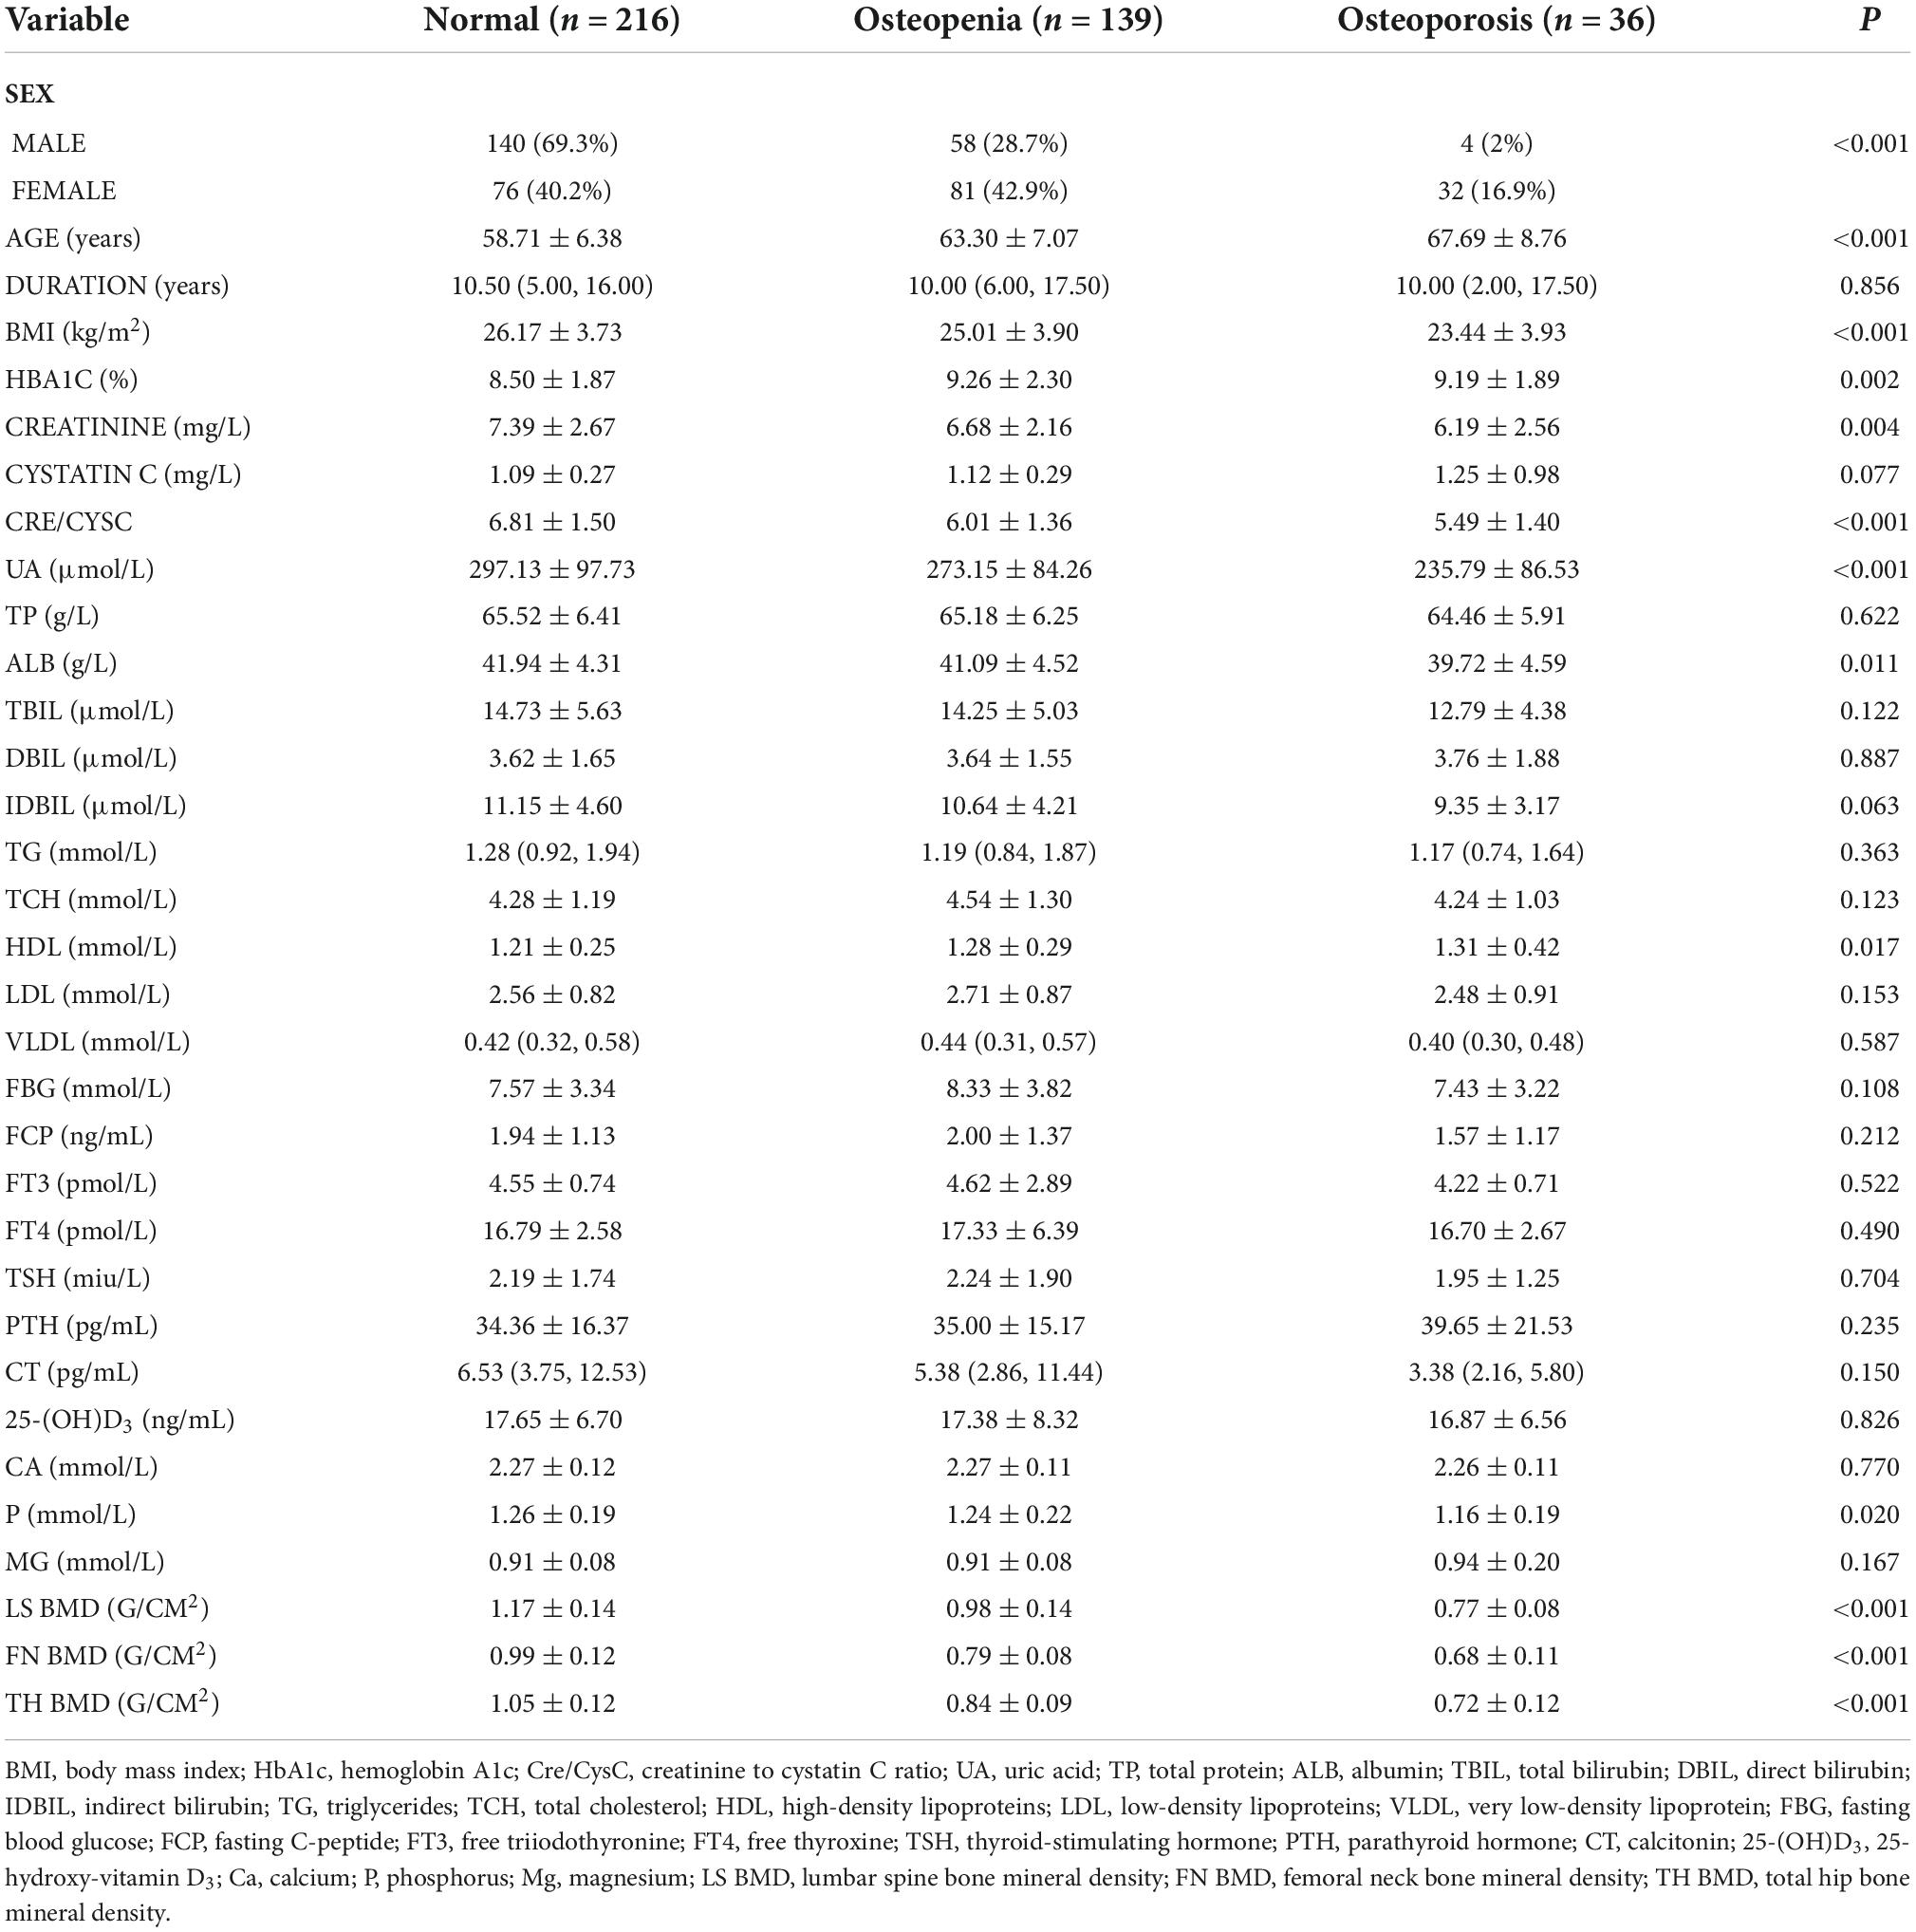
The clinical and laboratory characteristics of the patients are summarized in Table 1. Among the 391 patients, 202 were men and 189 were women. The average age of patients was 61.17 ± 9.47 years. Patients had an average duration of 10 years of having T2DM. The mean HbA1c level was 8.83 ± 2.06%, which was significantly higher in women (9.07 ± 2.07) than in men (8.61 ± 2.04). The mean creatinine level was 7.03 ± 2.52 mg/L, which was significantly higher in men (7.74 ± 2.35) than in women (6.27 ± 2.38). The mean cystatin C level was 1.11 ± 0.40 mg/L, which was higher in women (1.12 ± 0.50) than in men (1.10 ± 0.27), although the difference was not statistically significant. The average Cre/CysC value was 6.40 ± 1.52, which was significantly higher in men (7.04 ± 1.46) than in women (5.72 ± 1.26). The average BMD of LS, FN, and TH were 1.07 ± 0.19, 0.89 ± 0.16, and 0.94 ± 0.16, respectively. The BMD of men at the three sites was significantly higher than that of women (Table 1).
Correlations between clinical factors and bone mineral densities
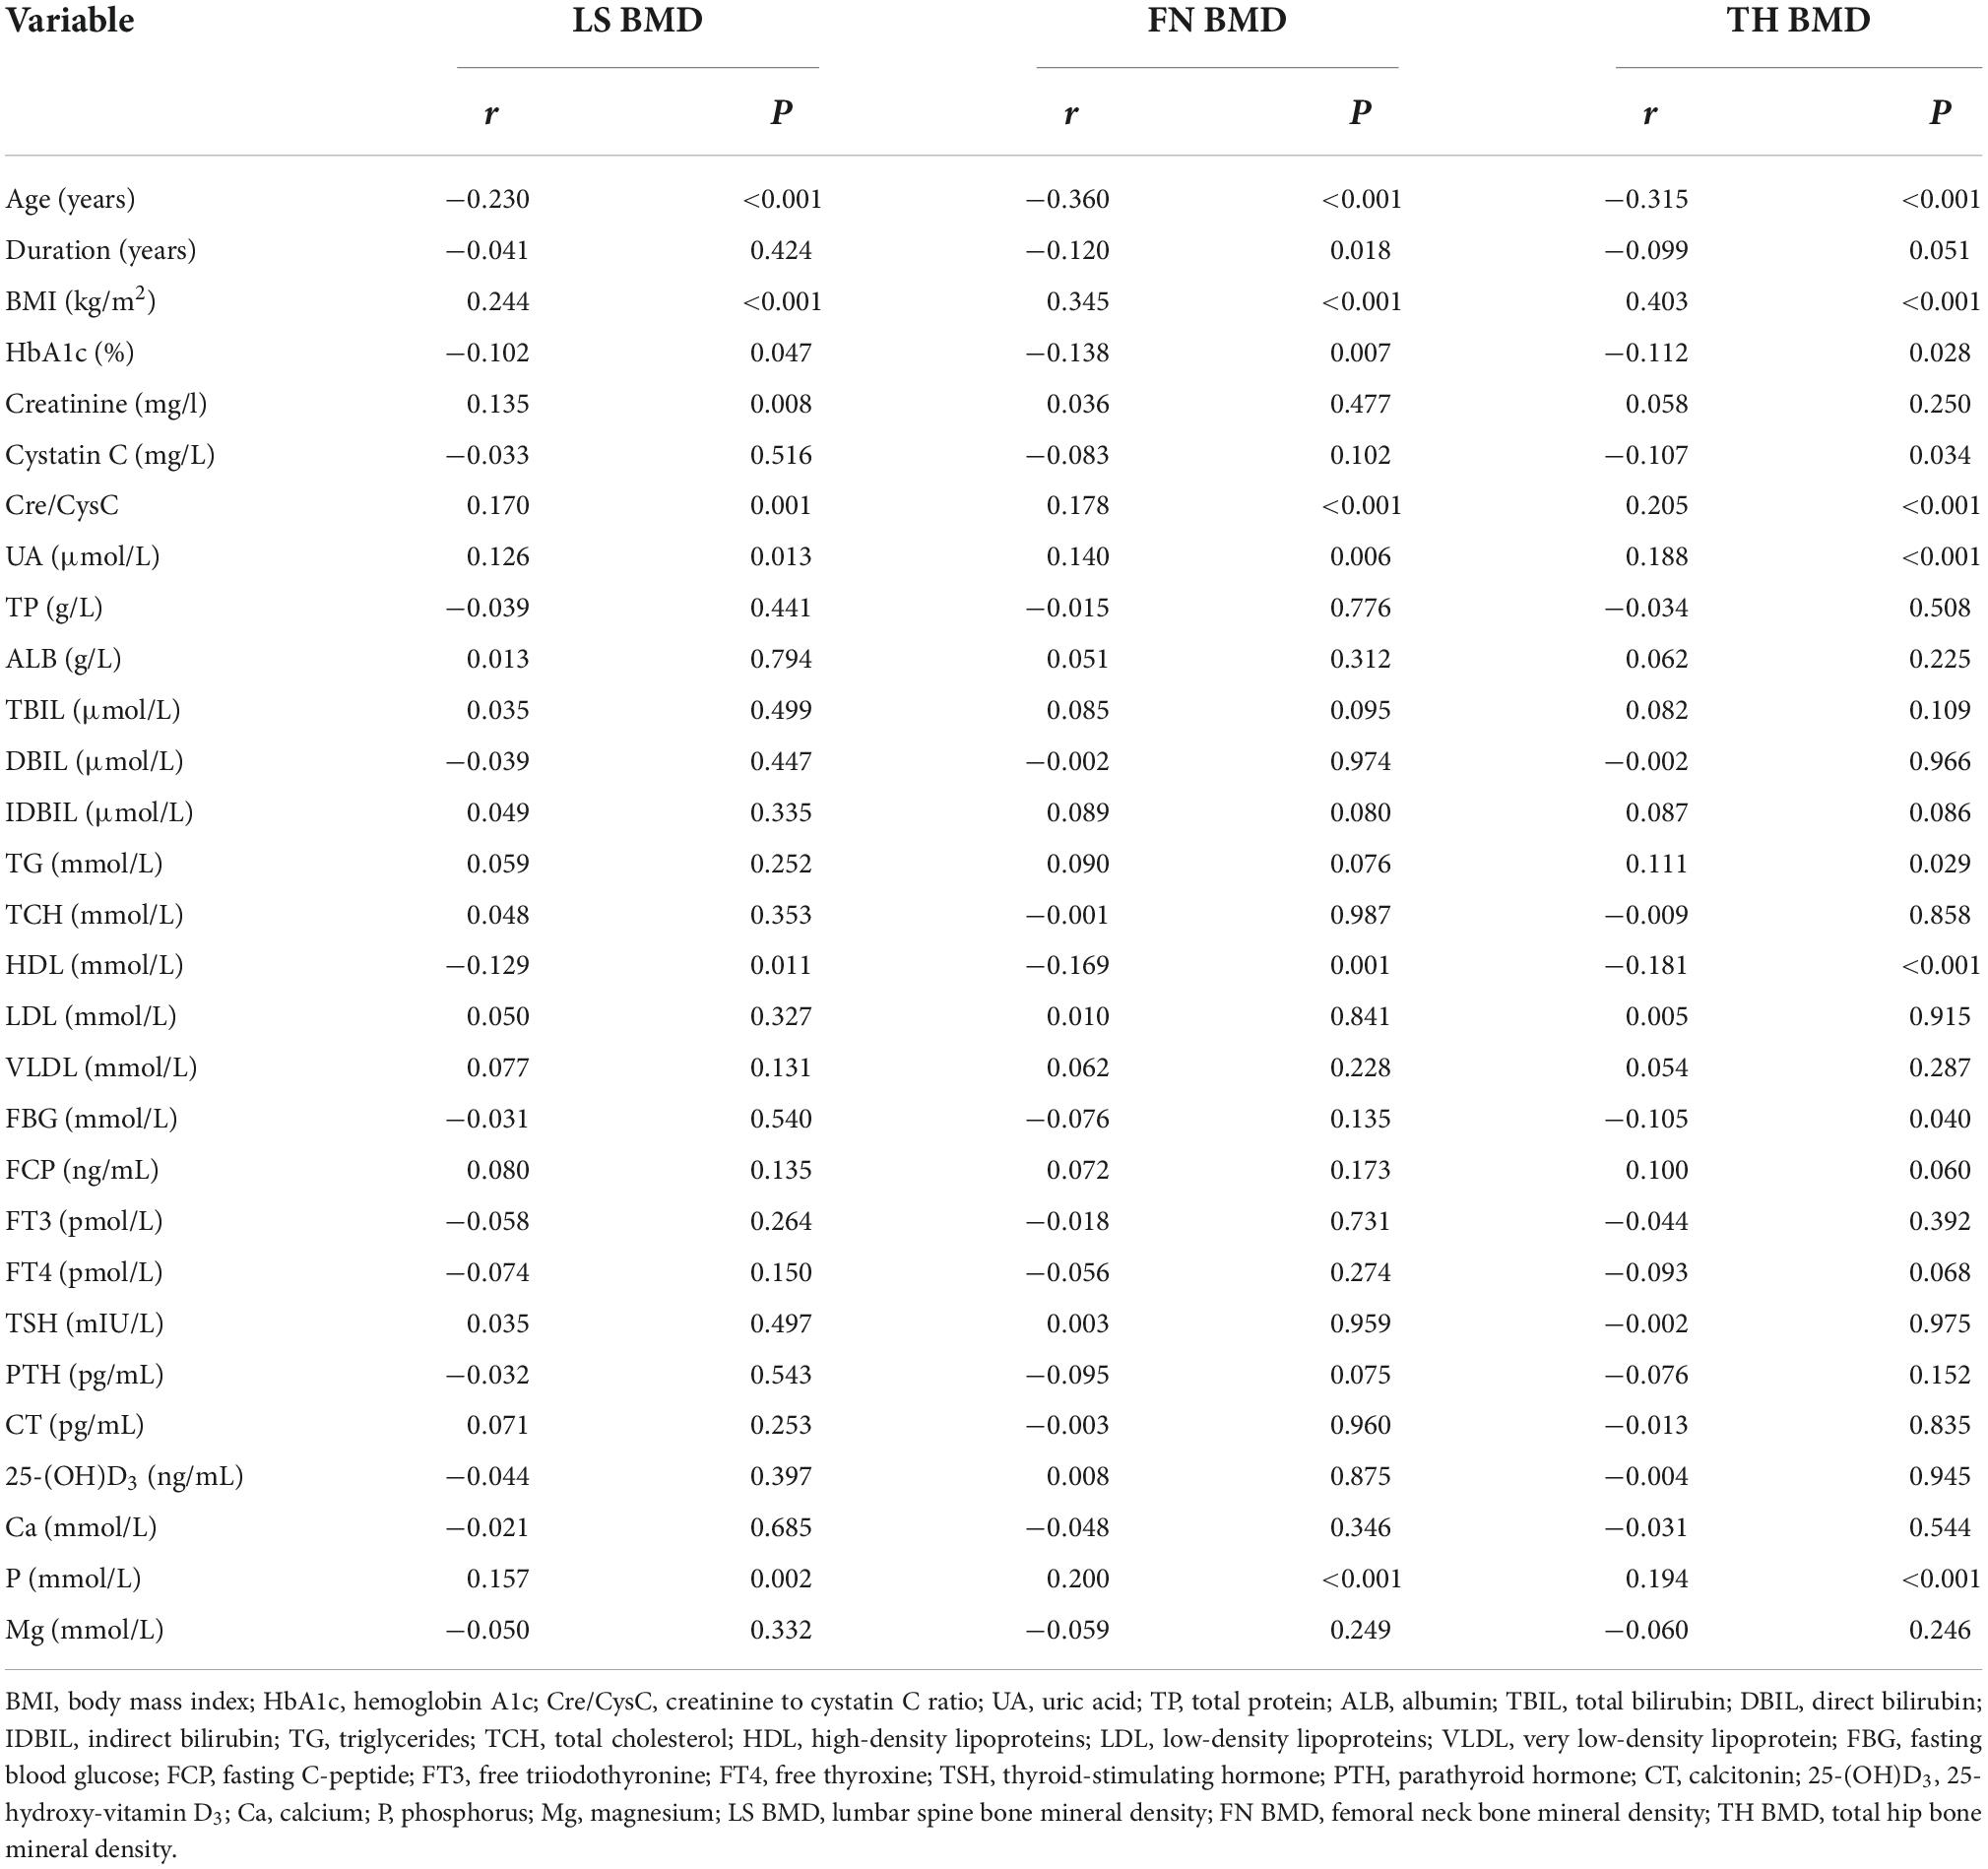
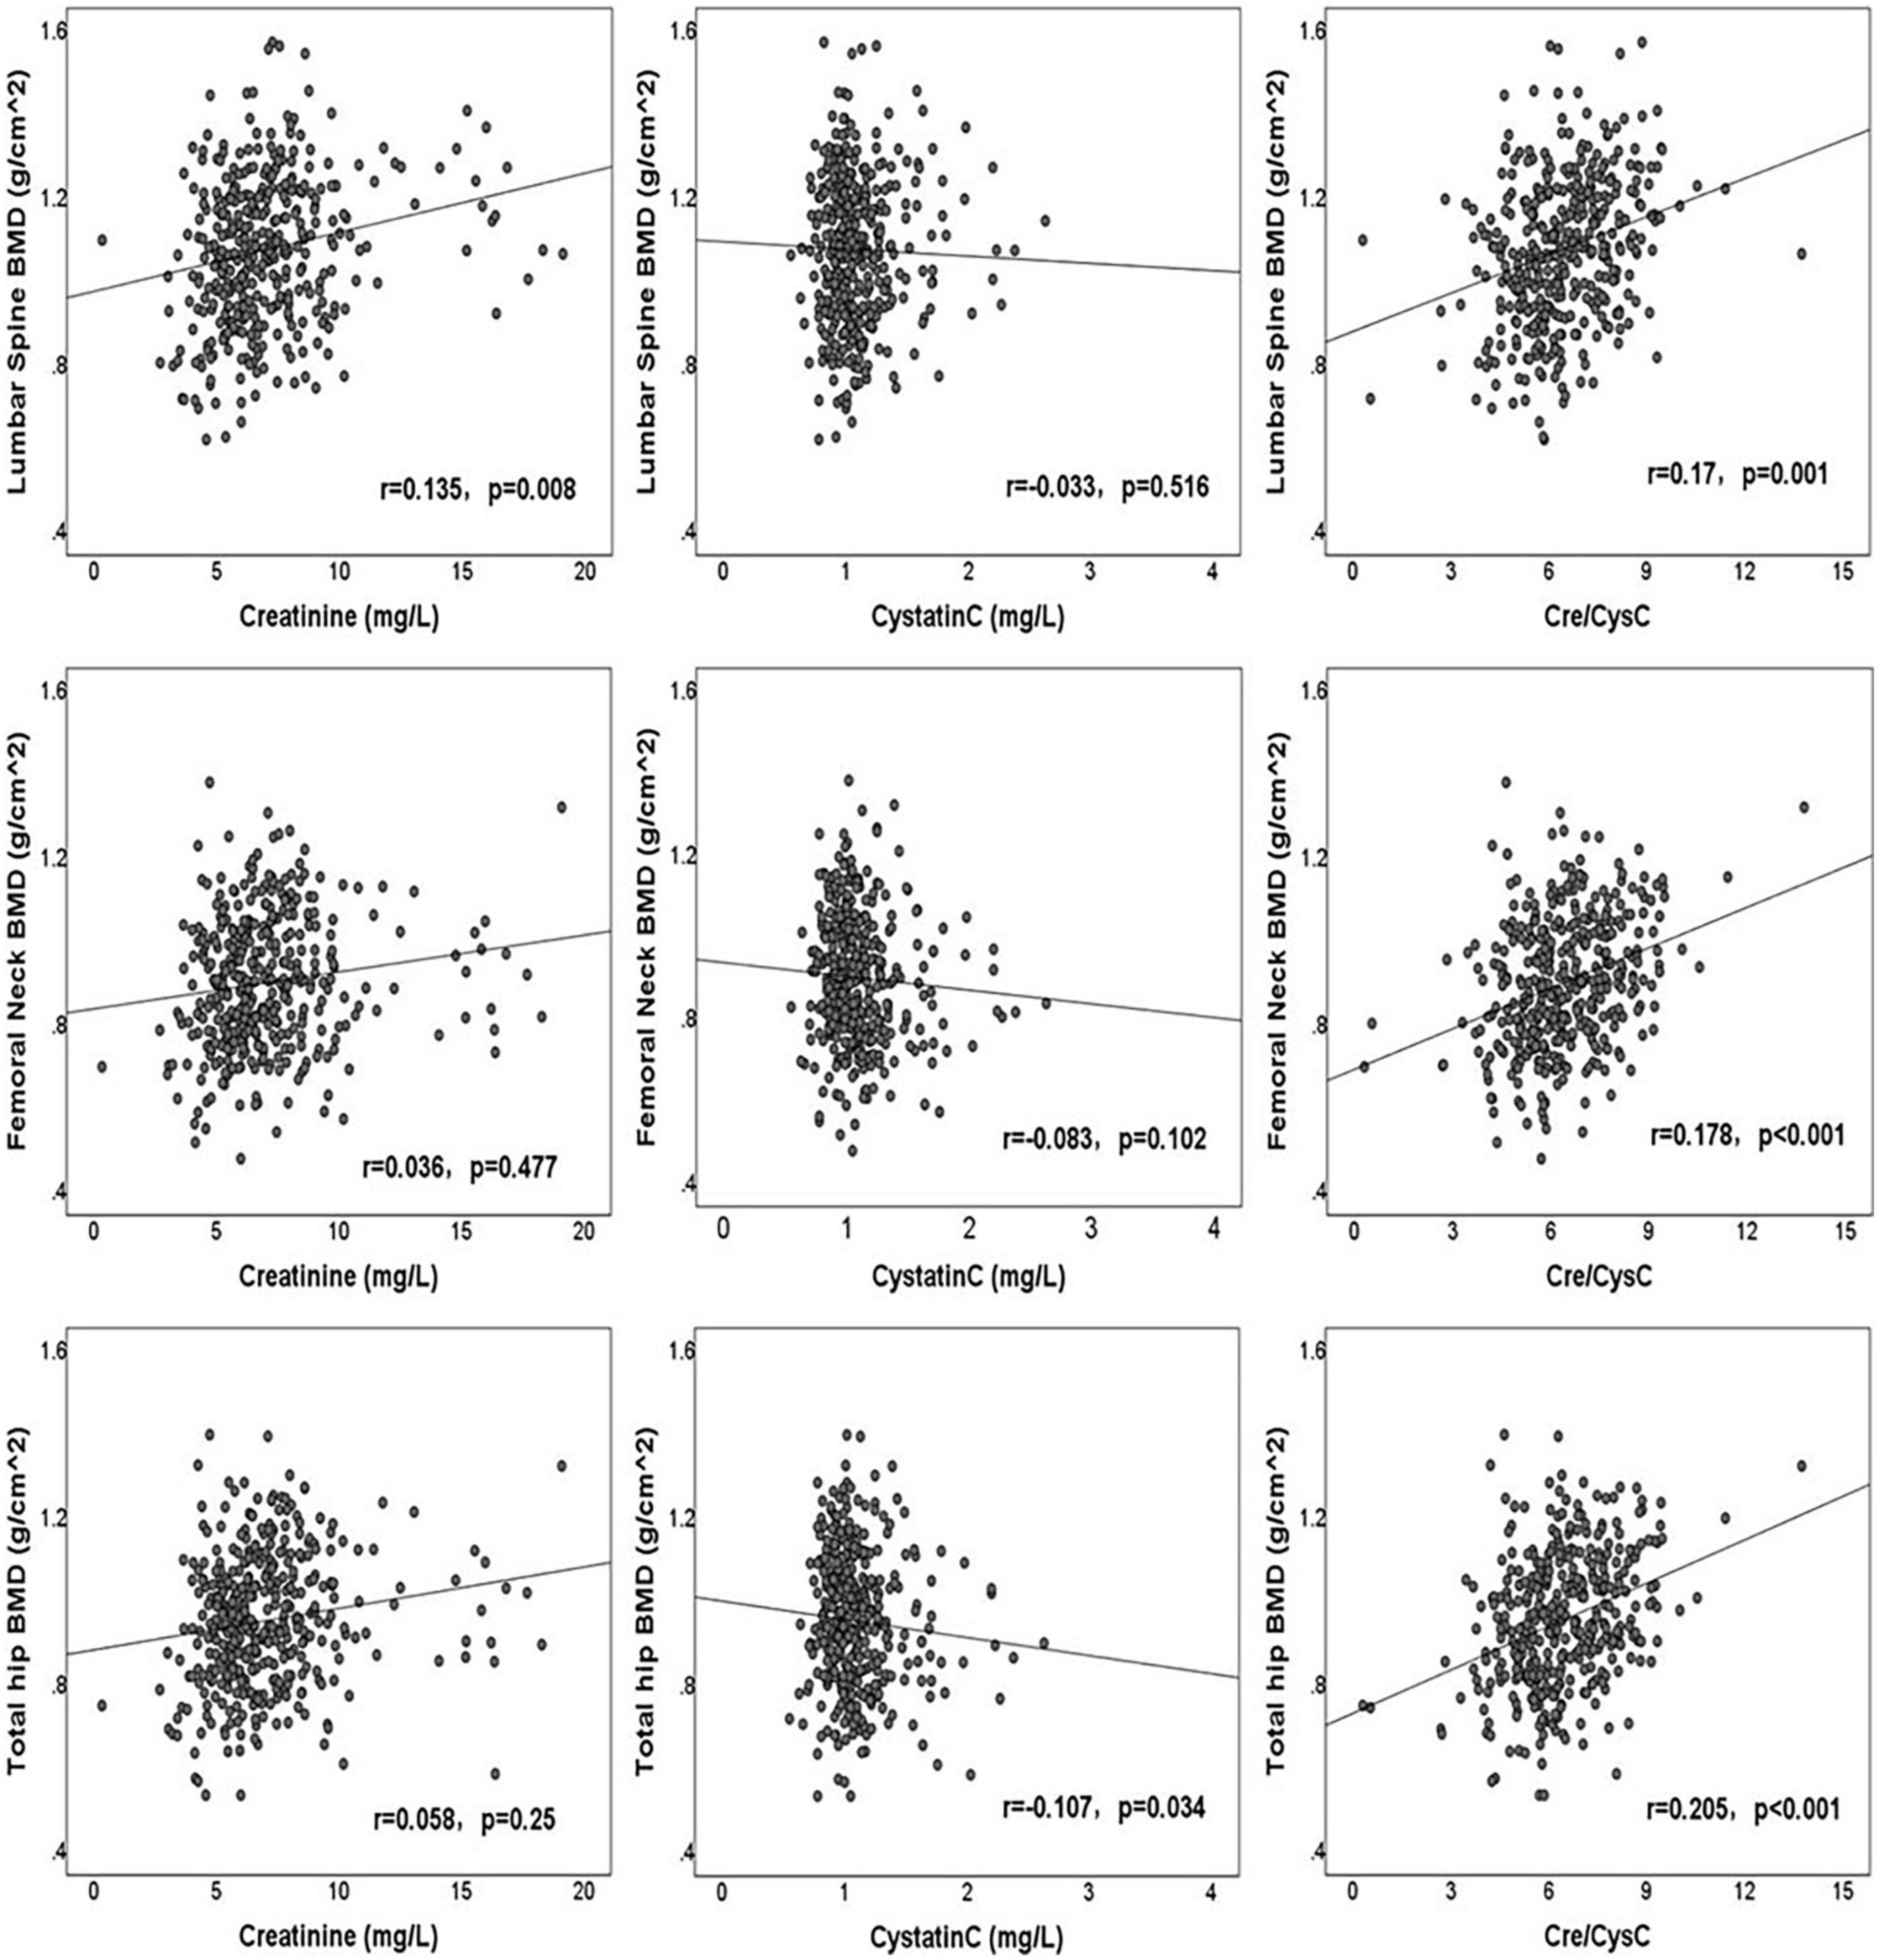
The correlations between clinical factors and BMDs of the LS, FN, and TH are shown in Table 2. Creatinine had a significantly positive correlation with LS BMD (r = 0.135, p = 0.008), although without significant correlation with FN BMD (r = 0.036, p = 0.477) and TH BMD (r = 0.058, p = 0.250). Cystatin C was significantly negatively correlated with the BMD of TH (r = −0.107, p = 0.034), but was not associated with the BMD of LS (r = −0.033, p = 0.516) and FN (r = −0.083, p = 0.102). Cre/CysC had a strong positive relationship with the BMD of LS (r = 0.170, p = 0.001), FN (r = 0.178, p < 0.001), and TH (r = 0.205, p < 0.001). The correlations between creatinine, cystatin C, Cre/CysC, and BMD are shown in Figure 1. In addition, we observed significant correlations between the age, BMI, HbA1c, UA level, HDL, serum phosphorus level, and the BMDs of LS, FN, and TH. The duration of diabetes was only related to FN BMD, whereas TG and FBG were only related to TH BMD (Table 2).
Multiple stepwise linear regression analyses of variables related to the bone mineral densities
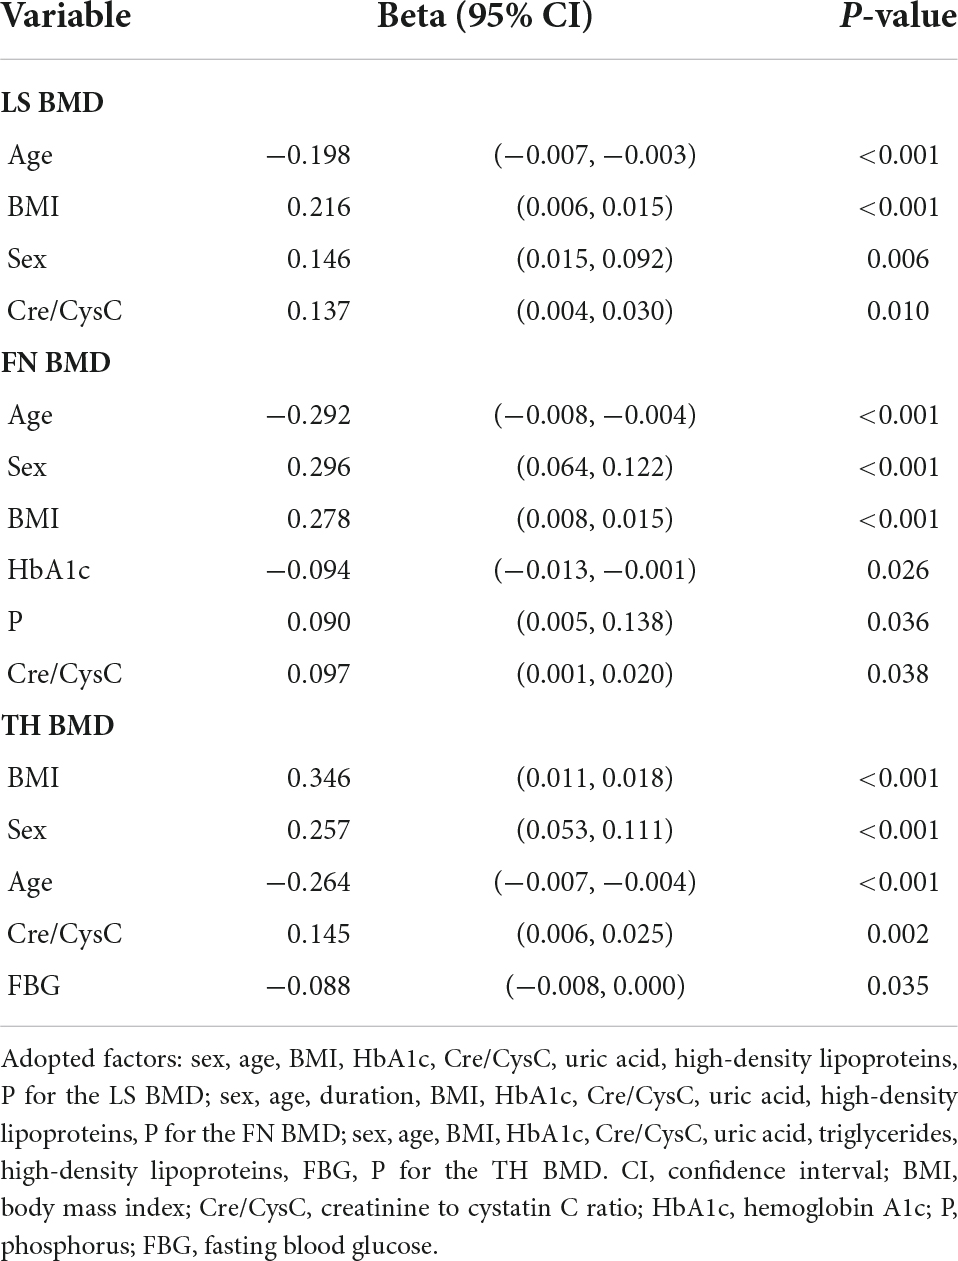
Multiple stepwise linear regression analyses of variables related to the BMDs of LS, FN, and TH are shown in Table 3. We observed that Cre/CysC was the only biochemical predictor of the BMDs of LS (β = 0.137, p = 0.01), FN (β = 0.097, p = 0.038), and TH (β = 0.145, p = 0.002). In addition to Cre/CysC, BMI (LS: β = 0.216, p < 0.001; FN: β = 0.278, p < 0.001; TH: β = 0.346, p < 0.001), age (LS: β = −0.198, p < 0.001; FN: β = −0.292, p < 0.001; TH: β = −0.264, p < 0.001), and sex (LS: β = 0.146, p = 0.006; FN: β = 0.296, p < 0.001; TH: β = 0.257, p < 0.001) were also independent predictors of BMD at the three sites. Moreover, HbA1c (β = −0.094, p = 0.026) and serum phosphorus (β = 0.090, p = 0.036) were independent predictors of FN BMD. FBG (β = −0.088, p = 0.035) was a predictor of TH BMD (Table 3).
Subgroup analysis according to sex and bone mass
Considering the significant effect of sex on BMD, Pearson correlation and multivariate regression analysis of BMD were performed according to sex groups (Supplementary Tables 1, 2). The Cre/CysC has a significant correlation with BMD in men (LS: r = 0.144, p = 0.042; FN: r = 0.235, p = 0.001; TH: r = 0.284, p < 0.001), and only significantly correlated with LS BMD (r = 0.203, p = 0.005) in women; however, the positive correlation trend was observed in the BMDs of FN (r = 0.108, p = 0.138) and TH (r = 0.114, p = 0.119) in women. In multiple stepwise linear regression analysis, after adjusting for confounding factors, Cre/CysC was the independent predictor of the BMDs of FN (β = 0.157, p = 0.014) and TH (β = 0.21, p = 0.001) in men. Meanwhile, it was the independent predictor of LS BMD (β = 0.159, p = 0.02) in women.
Patients were further classified based on the T-scores as follows: normal, osteopenic, and osteoporotic groups. Of the patients, 140 men (69.3%) and 76 women (40.2%) were diagnosed as normal; 58 men (28.7%) and 81 women (42.9%) were diagnosed with osteopenia; and 4 men (2%) and 32 women (16.9%) were diagnosed with osteoporosis. Older patients, patients with low BMI, and those with low Cre/CysC values were more likely to have osteopenia and osteoporosis. In addition, serum creatinine, UA, ALB, and serum phosphorus levels of patients with osteopenia and osteoporosis were decreased compared to patients with normal T-scores. However, the HDL levels of patients with osteopenia and osteoporosis were higher than that of patients with normal T-scores. The difference between the groups was statistically significant (Table 4).
The predictive ability of Cre/CysC about osteopenia and osteoporosis was assessed using ROC curve analysis (Figure 2). Cre/CysC showed moderate strength in predicting both osteopenia and osteoporosis with AUC = 0.671 and 0.685, respectively. The values of Cre/CysC = 6.51 (sensitivity 73.7%, specificity 56.9%) and 5.87 (sensitivity 66.7%, specificity 65.1%) were determined as cut-off points for osteopenia and osteoporosis.
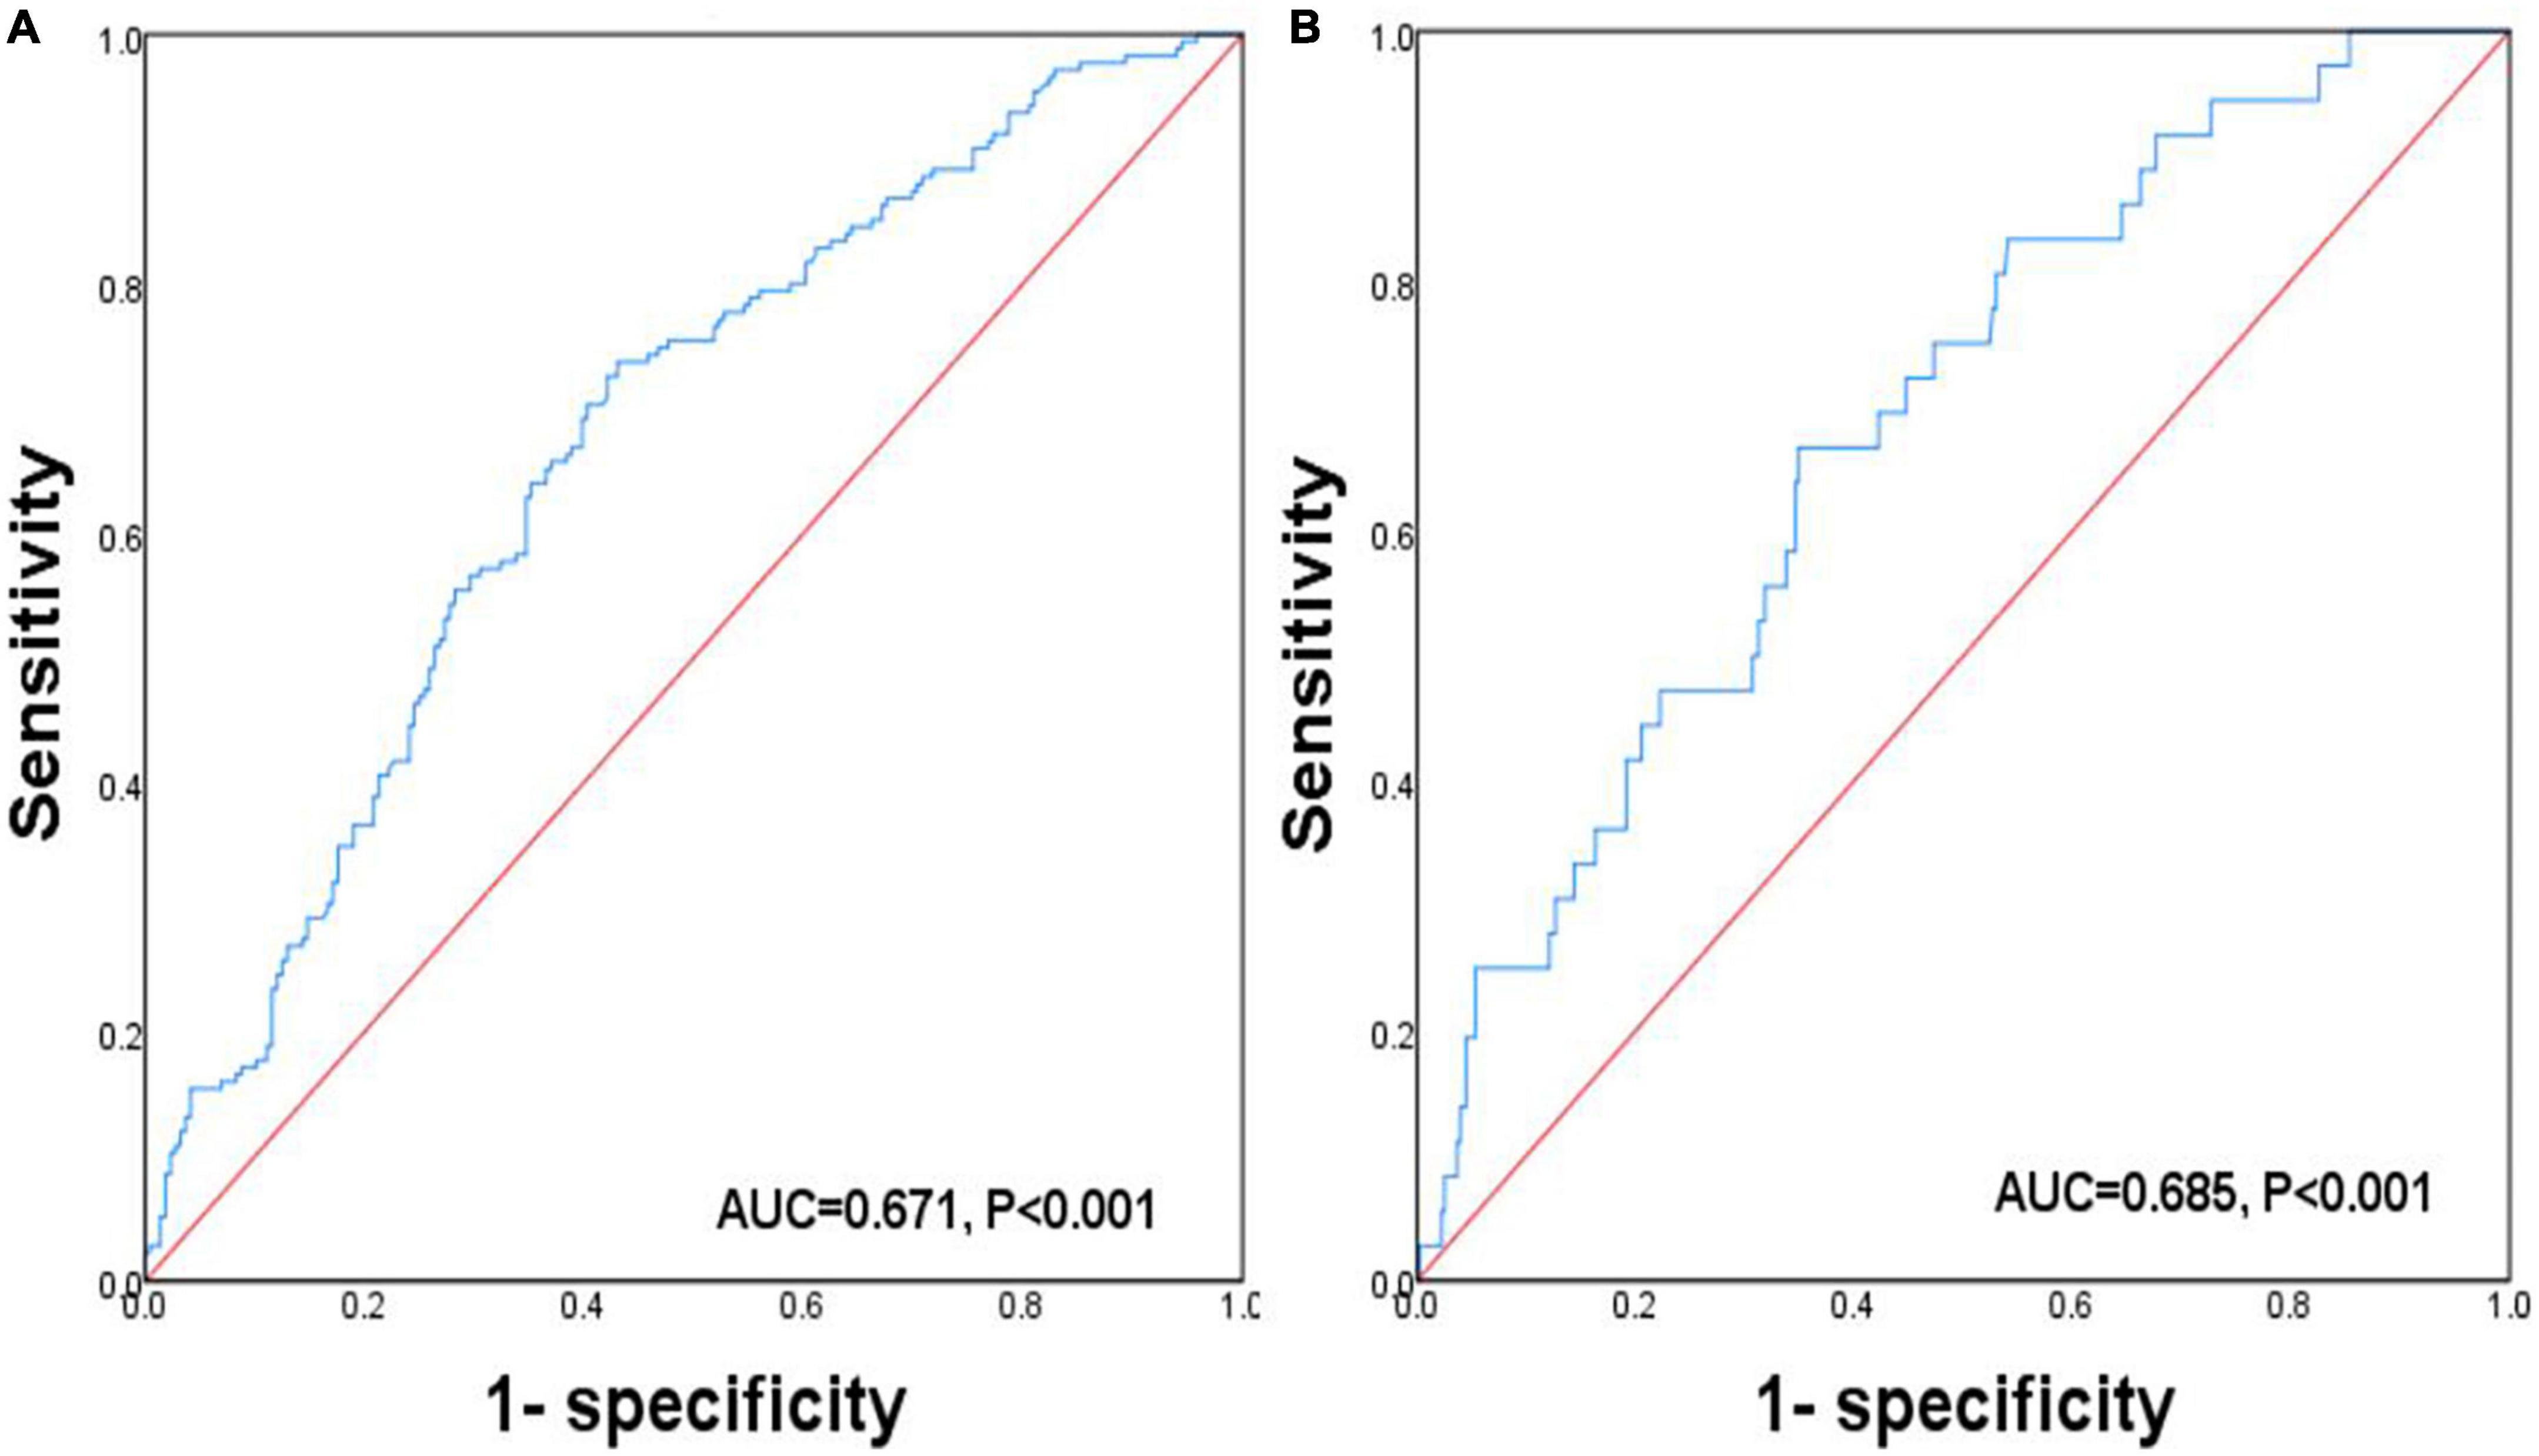
Figure 2. Receiver operating characteristic curve analysis related to the impact of Cre/CysC on the BMDs. (A) ROC curve analysis related to the impact of Cre/CysC on the diagnosis of osteopenia. (B) ROC curve analysis related to the impact of Cre/CysC on the diagnosis of osteoporosis.
Discussion
In this cross-sectional study of Chinese patients with T2DM, we found positive correlations between Cre/CysC and LS, FN, and TH BMDs. After adjusting for sex, age, BMI, and other multiple confounding factors such as serum UA and blood phosphorus, it was still an independent predictor of the above indicators. In addition, according to T-scores grouping analysis, the Cre/CysC of the osteoporosis group was significantly lower than that of the osteopenia and normal groups. To our knowledge, this is the first time that the correlation between Cre/CysC and BMD has been confirmed in patients with T2DM.
Type 2 diabetes mellitus is an inflammatory chronic condition characterized by insulin resistance and impaired glucose metabolism, as well as complications of multiple organ systems (15). A cohort study reported that the incidence of sarcopenia in patients with T2DM was 15.7%, a significantly higher rate than that in healthy controls (6.9%), and the odds ratio for sarcopenia was 3.06 (16). According to the guideline of European Working Group on Sarcopenia in Older People, sarcopenia can only be diagnosed when a patient has a low muscle strength as well as low muscle mass (5). A major determinant of muscle strength is muscle myosteatosis, which could be reflected by muscle density (high muscle density means low fat infiltration) (17). Therefore, both muscle mass and muscle density are two determining factors for sarcopenia. A previous study on Korean adults with T2DM aged 50 years and older found that the total body muscle mass was an important factor related to FN BMD (2). In patients with T2DM, decreased muscle mass leads to deteriorated insulin sensitivity, aggravated diabetes (18), increased somatostatin secretion, abnormal bone metabolism, and reduced bone mass, and is associated with osteoporosis (19). Moreover, previous studies also reported that compared with the healthy control group, patients with T2DM mainly presented reduced muscle strength and performance, which was related to muscle density (20). The mechanism leading to the decrease of muscle density in patients with T2DM remains unclear, but may be related to insulin resistance and decreased function and number of mitochondria (21, 22).
The circulating Cre/CysC, which can be used as a predictor of myosteatosis and muscle mass (23), was first reported in 2013 and has received widespread attention. It has been increasingly used in the screening of sarcopenia in diabetic and non-diabetic patients. Our previous studies have shown that the Cre/CysC can predict not only the muscle mass but also muscle density in patients with T2DM (24). Based on the close correlation between muscle and bone health, we further confirmed that Cre/CysC could be used as an independent predictor of BMD in the LS, FN, and TH. The positive correlation between Cre/CysC and BMD may be related to the fact that Cre/CysC is an alternative indicator of muscle density and mass; this is consistent with the findings of a small-scale study in patients with primary osteoporosis, which reported that Cre/CysC was positively correlated with LS and FN BMD (3). Furthermore, Komorita et al. confirmed that Cre/CysC was a major risk factor for brittle fractures in patients with T2DM (25). We also observed that the correlation between Cre/CysC and BMD was stronger than that between BMD and creatinine or cystatin C alone, indicating that the Cre/CysC value, rather than serum creatinine or cystatin C level, would be a more appropriate alternative indicator of bone health in patients with T2DM.
The relationship between osteoporosis and sarcopenia is reasonable in the context of the bone–muscle subunit and a common mesenchymal precursor of muscle and bone are formed from (26). The crosstalk between muscle and both has been summarized into two major aspects, including mechanical communication and biochemical communication. The mechanical communication has been investigated in detail and plays critical roles during embryonic patterning, postnatal allometric growth, and the homeostatic relationship of adult life and aging (27). Both muscle and bone could be regarded as secretory/endocrine organs. The myokines secreted by muscles may regulate the bone mineral content, such IL-15 (28), IL-8 (29) and irisin (30). On the other side, the factors released by bone including IGF-1 (26), Wnt3a (31), FGF23 (32) and osteocalcin (33), can mediate myogenesis and muscle function. Therefore, as a marker of sarcopenia, Cre/CysC can also predict BMD. The associations and possible mechanisms between Cre/CysC, sarcopenia and osteoporosis were shown in Figure 3.
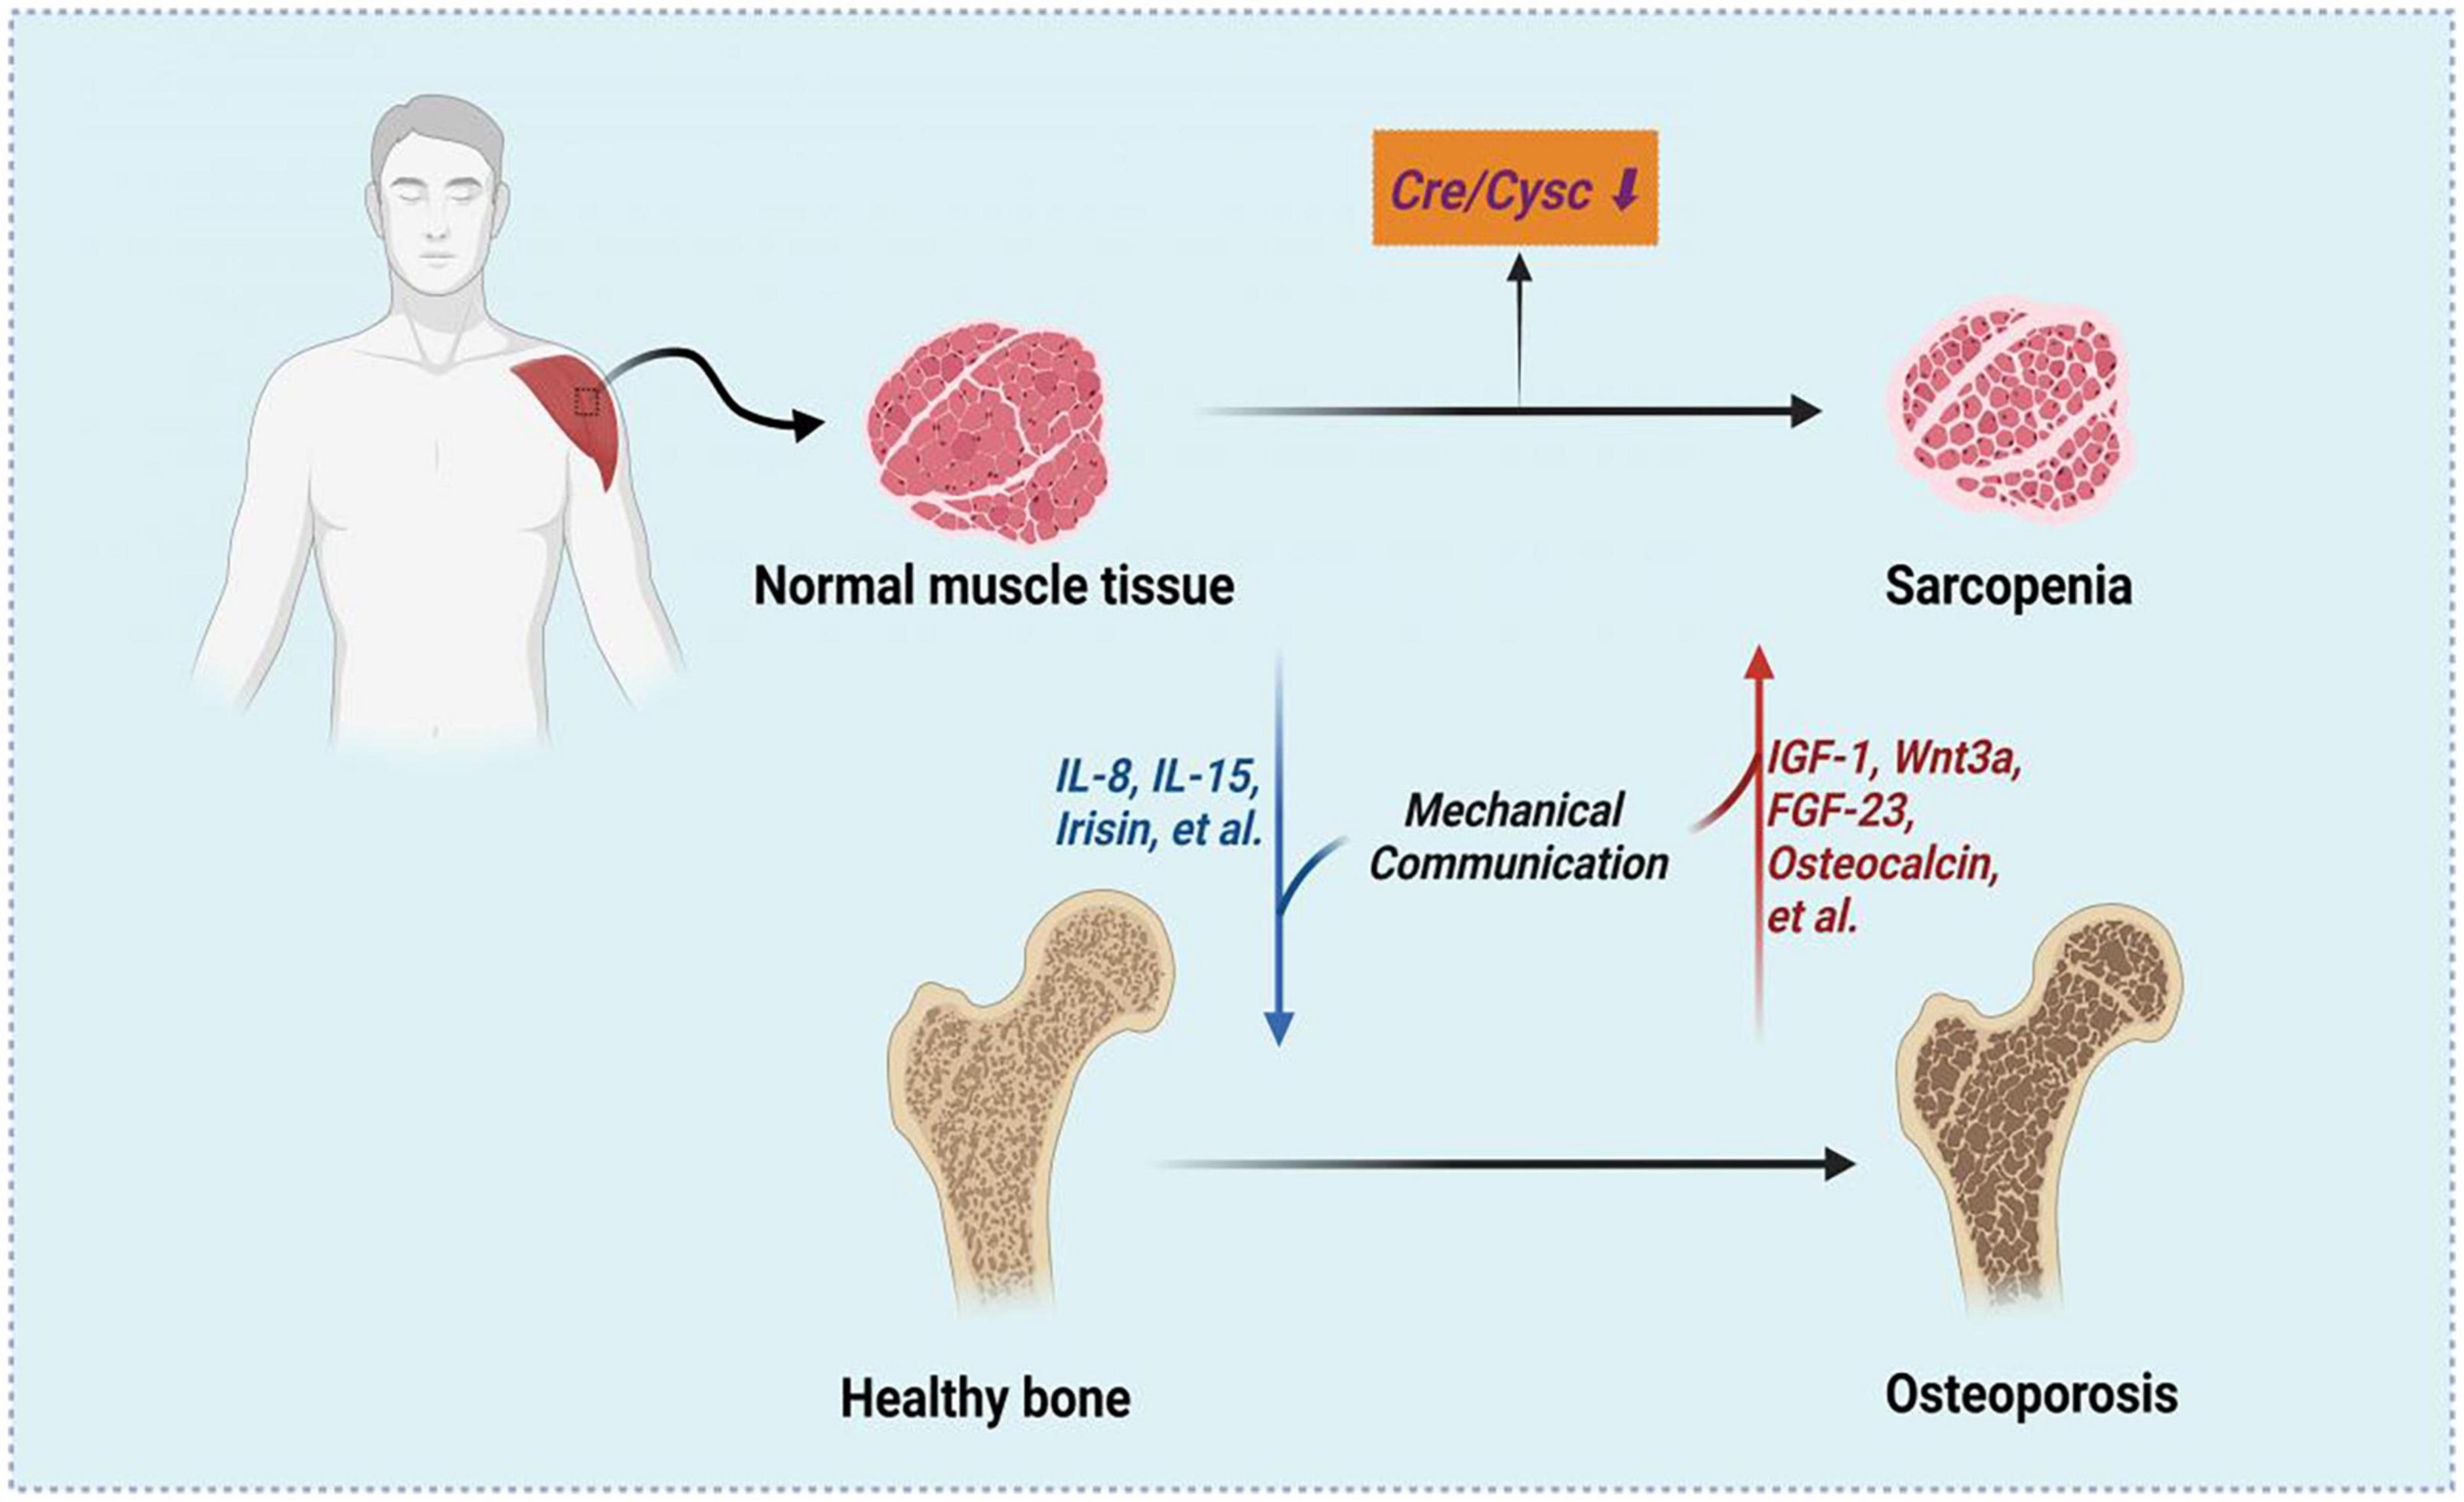
Figure 3. The associations between Cre/CysC, sarcopenia and osteoporosis. Created with BioRender.com.
To further verify the reliability of the conclusion, we conducted a subgroup analysis according to sex and bone mass. When stratified by sex, we found that in men, Cre/CysC was positively correlated with BMD at the three sites and was able to independently predict FN and TH BMD. In women, Cre/CysC was able to independently predict LS BMD and showed tendency for positive correlations with FN and TH BMD. There may be several reasons for the discrepancies in the association between Cre/CysC values and BMD in men and women. First, the number of women enrolled in the study was relatively lower than that of men, and the ability to detect statistical differences was weak. Second, there are significant differences in HbA1c, UA, HDL, and serum phosphorus levels between men and women, which may have weakened the association of Cre/CysC and BMD. Finally, BMI had a positive correlation with all BMDs, whereas age had a negative correlation with all BMDs. In multiple regression analysis, age and BMI as potential confounding factors may weaken the effect of Cre/CysC on BMD. Therefore, the next step is to conduct a large sample study to confirm the effect of Cre/CysC on BMD in different sex.
When stratified by T-scores, the Cre/CysC value of the normal bone mass group was the highest, followed by those of the osteopenic and the osteoporotic groups, wherein the difference was significant. The Cre/CysC value decreases with the decrease in bone mass, indicating that Cre/CysC is closely related to BMD. These results are consistent with previous findings that older participants with low BMD levels had increased sarcopenia incidence, decreased muscle strength, low muscle mass, and impaired physical performance (34). Although Cre/CysC showed moderate abilities in predicting osteopenia and osteoporosis in the ROC analysis, it can still help clinicians to avoid unnecessarily DEXA examination because of its low price and convenience of measurement.
In addition to Cre/CysC, this study also found that BMI was positively correlated with BMD, and was an independent predictor for LS, FN, and TH BMDs in patients with T2DM, which is in accordance with previous studies showing that increased BMD in patients with T2DM was caused by increased BMI (35, 36). Patients with T2DM are more prone to obesity and dyslipidemia, and increased BMI may lead to increased bone strain in daily activities. We also noticed a negative correlation between age and BMD, which is reasonable because BMD gradually decreases with increasing age. A significantly higher BMD was observed in men than in women based on the impact of sex differences on BMD. There was a significant positive correlation between serum phosphorus and TH BMD. Previous studies have shown that relatively high blood phosphorus levels in the normal range may be beneficial to BMD (37). Phosphate is important for osteoblast differentiation and extracellular matrix mineralization, with its level directly affecting bone metabolism (38). HbA1c is used as an indicator of diabetes control, which had a significant negative correlation with FN BMD, indicating that patients with poor control of diabetes have lower BMD, higher risk of osteoporosis, and fracture. A cohort study in Taiwan observed similar results as ours, which showed that patients with T2DM and higher HbA1c had a higher risk of fracture (39). FBG is also a common indicator of blood glucose control, and a significant negative correlation was observed with the TH BMD.
In order to eliminate or lessen the interference of sex hormones, our study only included the patients older than 50 and all the women were postmenopausal. In fact, for all women (including those of reproductive age), blood levels of estradiol and testosterone were significant determinants of BMD (40). A decline in estradiol level has been recognized as the most critical hormonal regulator of the menopause-associated decrease in BMD (41). A recent genome-wide study provided further support of the effects of estradiol on BMD in maintaining skeletal health in postmenopausal women (42). The bone-sparing effect of estrogen is antiresorption by inhibition of osteoclast activity, and testosterone, like estrogen, appears to stimulate bone turnover, acting directly or indirectly via conversion into estradiol in human osteoblasts to increase androgen receptor expression and stimulate bone cell proliferation and mineralization (43, 44).
This study had a few limitations. First, due to the cross-sectional design, the causal relationship between Cre/CysC and BMDs could not be determined. Therefore, prospective studies are required for further verification. Second, blood biochemical indicators were only measured once at baseline, which may have caused measurement errors. Third, we did not evaluate the muscle mass and function (e.g., handgrip strength and gait speed) and could not further confirm that the ability of Cre/CysC to predict BMD was achieved through the muscle. Finally, this is a single-center study and participants of this study were mainly Chinese Han adults, therefore it is not clear whether our conclusion can be generalized to other ethnic groups.
Conclusion
In conclusion, the present study firstly demonstrated that the Cre/CysC may be a valuable predictor of BMD in Chinese older adults patients with T2DM. It may help clinicians to avoid unnecessarily DEXA examination and important clinical significance because of its low price and have convenience of measurement.
Data availability statement
The raw data supporting the conclusions of this article will be made available by the authors, without undue reservation.
Ethics statement
This study was approved by the Ethics Committee of the Affiliated Hospital of Jining Medical University (2020-BS-008).
Author contributions
TG and MZ conceived and designed this study. TG collected the data and drafted a manuscript. TG and FL analyzed the data. YH, MJ, and GL contributed to the collection of materials and the revision of the article. FL, QY, BB, and MZ made critical changes to the writing of the article. All authors have access to the database, contributed to this article, and approved its publication.
Funding
This study was supported by the Research Fund for Lin He’s Academician Workstation of New Medicine and Clinical Translation in Jining Medical University (JYHL2021FMS11).
Acknowledgments
We thank all the research participants who provided information and the linguistic assistance provided by Editage (www.editage.cn) to this manuscript.
Conflict of interest
The authors declare that the research was conducted in the absence of any commercial or financial relationships that could be construed as a potential conflict of interest.
Publisher’s note
All claims expressed in this article are solely those of the authors and do not necessarily represent those of their affiliated organizations, or those of the publisher, the editors and the reviewers. Any product that may be evaluated in this article, or claim that may be made by its manufacturer, is not guaranteed or endorsed by the publisher.
Supplementary material
The Supplementary Material for this article can be found online at: https://www.frontiersin.org/articles/10.3389/fnut.2022.1035853/full#supplementary-material
References
1. Sun H, Saeedi P, Karuranga S, Pinkepank M, Ogurtsova K, Duncan BB, et al. IDF Diabetes Atlas: global, regional and country-level diabetes prevalence estimates for 2021 and projections for 2045. Diabetes Res Clin Pract. (2022) 183:109119. doi: 10.1016/j.diabres.2021.109119
2. Lee KM, Chung CY, Kwon SS, Lee SY, Kim TG, Choi Y, et al. Factors associated with bone mineral density and risk of fall in Korean adults with type 2 diabetes mellitus aged 50 years and older. J Clin Endocrinol Metab. (2014) 99:4206–13. doi: 10.1210/jc.2014-1400
3. Yoshii I, Chijiwa T, Sawada N. Screening osteoporotic femoral neck without measuring bone mineral density with the use of tartrate resistant acid phosphatase-5b and serum-creatinine-to-cystatin C ratio in Japanese postmenopausal women. J. Orthop. Sci. (2020) 25:671–6. doi: 10.1016/j.jos.2019.07.002
4. Trajanoska K, Morris JA, Oei L, Zheng HF, Evans DM, Kiel DP, et al. Assessment of the genetic and clinical determinants of fracture risk: genome wide association and mendelian randomisation study. BMJ. (2018) 362:k3225. doi: 10.1136/bmj.k3225
5. Cruz-Jentoft AJ, Bahat G, Bauer J, Boirie Y, Bruyère O, Cederholm T, et al. Sarcopenia: revised European consensus on definition and diagnosis. Age Ageing. (2019) 48:16–31. doi: 10.1093/ageing/afy169
6. Izzo A, Massimino E, Riccardi G, Della PG. A narrative review on sarcopenia in type 2 diabetes mellitus: prevalence and associated factors. Nutrients. (2021) 13:183. doi: 10.3390/nu13010183
7. Di Monaco M, Vallero F, Di Monaco R, Tappero R. Prevalence of sarcopenia and its association with osteoporosis in 313 older women following a hip fracture. Arch Gerontol Geriatr. (2011) 52:71–4. doi: 10.1016/j.archger.2010.02.002
8. Hita-Contreras F, Martínez-Amat A, Cruz-Díaz D, Pérez-López FR. Osteosarcopenic obesity and fall prevention strategies. Maturitas. (2015) 80:126–32. doi: 10.1016/j.maturitas.2014.11.009
9. Tarantino U, Piccirilli E, Fantini M, Baldi J, Gasbarra E, Bei R. Sarcopenia and fragility fractures: molecular and clinical evidence of the bone-muscle interaction. J. Bone Joint Surg. Am. (2015) 97:429–37. doi: 10.2106/JBJS.N.00648
10. Levey AS, Inker LA. Assessment of glomerular filtration rate in health and disease: a state of the art review. Clin. Pharmacol. Ther. (2017) 102:405–19. doi: 10.1002/cpt.729
11. Kusunoki H, Tsuji S, Kusukawa T, Wada Y, Tamaki K, Nagai K, et al. Relationships between cystatin C- and creatinine-based eGFR in Japanese rural community- dwelling older adults with sarcopenia. Clin. Exp. Nephrol. (2021) 25:231–9. doi: 10.1007/s10157-020-01981-x
12. Osaka T, Hamaguchi M, Hashimoto Y, Ushigome E, Tanaka M, Yamazaki M, et al. Decreased the creatinine to cystatin C ratio is a surrogate marker of sarcopenia in patients with type 2 diabetes. Diabetes Res Clin Pract. (2018) 139:52–8. doi: 10.1016/j.diabres.2018.02.025
13. Tabara Y, Kohara K, Okada Y, Ohyagi Y, Igase M. Creatinine to cystatin C ratio as a marker of bone property in older adults: the J-SHIPP Study. J Nutr Health Aging. (2020) 24:277–81. doi: 10.1007/s12603-020-1315-6
14. Kanis JA. Assessment of fracture risk and its application to screening for postmenopausal osteoporosis: synopsis of a WHO report. WHO Study Group. Osteoporos Int. (1994) 4:368–81. doi: 10.1007/BF01622200
15. Barrett EJ, Liu Z, Khamaisi M, King GL, Klein R, Klein B, et al. Diabetic microvascular disease: an endocrine society scientific statement. J Clin Endocrinol Metab. (2017) 102:4343–410. doi: 10.1210/jc.2017-01922
16. Kim TN, Park MS, Yang SJ, Yoo HJ, Kang HJ, Song W, et al. Prevalence and determinant factors of sarcopenia in patients with type 2 diabetes: the Korean Sarcopenic Obesity Study (KSOS). Diabetes Care. (2010) 33:1497–9. doi: 10.2337/dc09-2310
17. Lee MJ, Kim HK, Kim EH, Bae SJ, Kim KW, Kim MJ, et al. Association between muscle quality measured by abdominal computed tomography and subclinical coronary atherosclerosis. Arterioscler Thromb Vasc Biol. (2021) 41:e128–40. doi: 10.1161/ATVBAHA.120.315054
18. Srikanthan P, Hevener AL, Karlamangla AS. Sarcopenia exacerbates obesity-associated insulin resistance and dysglycemia: findings from the National Health and Nutrition Examination Survey III. PLoS One. (2010) 5:e10805. doi: 10.1371/journal.pone.0010805
19. Sjöblom S, Suuronen J, Rikkonen T, Honkanen R, Kröger H, Sirola J. Relationship between postmenopausal osteoporosis and the components of clinical sarcopenia. Maturitas. (2013) 75:175–80. doi: 10.1016/j.maturitas.2013.03.016
20. Anagnostis P, Gkekas NK, Achilla C, Pananastasiou G, Taouxidou P, Mitsiou M, et al. Type 2 diabetes mellitus is associated with increased risk of sarcopenia: a systematic review and meta-analysis. Calcif Tissue Int. (2020) 107:453–63. doi: 10.1007/s00223-020-00742-y
21. Cederholm T, Cruz-Jentoft AJ, Maggi S. Sarcopenia and fragility fractures. Eur J Phys Rehabil Med. (2013) 49:111–7.
22. Navarro A, Boveris A. The mitochondrial energy transduction system and the aging process. Am J Physiol Cell Physiol. (2007) 292:C670–86. doi: 10.1152/ajpcell.00213.2006
23. Tabara Y, Okada Y, Ochi M, Ohyagi Y, Igase M. Association of creatinine-to-cystatin C ratio with myosteatosis and physical performance in older adults: the japan shimanami health promoting program. J. Am. Med. Dir. Assoc. (2021) 22:2366–72.e3. doi: 10.1016/j.jamda.2021.03.021
24. Yang Q, Zhang M, Sun P, Li Y, Xu H, Wang K, et al. Cre/CysC ratio may predict muscle composition and is associated with glucose disposal ability and macrovascular disease in patients with type 2 diabetes. BMJ Open Diabetes Res Care. (2021) 9:e002430. doi: 10.1136/bmjdrc-2021-002430
25. Komorita Y, Iwase M, Fujii H, Ide H, Ohkuma T, Jodai-Kitamura T, et al. The serum creatinine to cystatin C ratio predicts bone fracture in patients with type 2 diabetes: the Fukuoka Diabetes Registry. Diabetes Res Clin Pract. (2018) 146:202–10. doi: 10.1016/j.diabres.2018.10.021
26. Martone AM, Marzetti E, Calvani R, Picca A, Tosato M, Santoro L, et al. Exercise and protein intake: a synergistic approach against Sarcopenia. Biomed Res. Int. (2017) 2017:2672435. doi: 10.1155/2017/2672435
27. Brotto M, Bonewald L. Bone and muscle: interactions beyond mechanical. Bone. (2015) 80:109–14. doi: 10.1016/j.bone.2015.02.010
28. Quinn LS, Anderson BG, Strait-Bodey L, Stroud AM, Argilés JM. Oversecretion of interleukin-15 from skeletal muscle reduces adiposity. Am J Physiol Endocrinol Metab. (2009) 296:E191–202. doi: 10.1152/ajpendo.90506.2008
29. Pedersen BK, Akerström TC, Nielsen AR, Fischer CP. Role of myokines in exercise and metabolism. J Appl Physiol. (2007) 103:1093–8. doi: 10.1152/japplphysiol.00080.2007
30. Seale P, Bjork B, Yang W, Kajimura S, Chin S, Kuang S, et al. PRDM16 controls a brown fat/skeletal muscle switch. Nature. (2008) 454:961–7. doi: 10.1038/nature07182
31. Jähn K, Lara-Castillo N, Brotto L, Mo CL, Johnson ML, Brotto M, et al. Skeletal muscle secreted factors prevent glucocorticoid-induced osteocyte apoptosis through activation of β-catenin. Eur Cell Mater. (2012) 24:197–209. doi: 10.22203/ecm.v024a14
32. Shimada T, Kakitani M, Yamazaki Y, Hasegawa H, Takeuchi Y, Fujita T, et al. Targeted ablation of Fgf23 demonstrates an essential physiological role of FGF23 in phosphate and vitamin D metabolism. J Clin Invest. (2004) 113:561–8. doi: 10.1172/JCI19081
33. Karsenty G, Ferron M. The contribution of bone to whole-organism physiology. Nature. (2012) 481:314–20. doi: 10.1038/nature10763
34. Reginster JY, Beaudart C, Buckinx F, Bruyère O. Osteoporosis and sarcopenia: two diseases or one? Curr Opin Clin Nutr Metab Care. (2016) 19:31–6. doi: 10.1097/MCO.0000000000000230
35. Bridges MJ, Moochhala SH, Barbour J, Kelly CA. Influence of diabetes on peripheral bone mineral density in men: a controlled study. Acta Diabetol. (2005) 42:82–6. doi: 10.1007/s00592-005-0183-1
36. Méndez JP, Rojano-Mejía D, Pedraza J, Coral-Vázquez RM, Soriano R, García-García E, et al. Bone mineral density in postmenopausal Mexican-Mestizo women with normal body mass index, overweight, or obesity. Menopause. (2013) 20:568–72. doi: 10.1097/GME.0b013e318277694f
37. Yang Y, Liu G, Zhang Y, Xu G, Yi X, Liang J, et al. Linear and non-linear correlations between serum phosphate level and bone mineral density in type 2 diabetes. Front Endocrinol. (2020) 11:497. doi: 10.3389/fendo.2020.00497
38. Zhang R, Lu Y, Ye L, Yuan B, Yu S, Qin C, et al. Unique roles of phosphorus in endochondral bone formation and osteocyte maturation. J. Bone Miner. Res. (2011) 26:1047–56. doi: 10.1002/jbmr.294
39. Li CI, Liu CS, Lin WY, Meng NH, Chen CC, Yang SY, et al. Glycated hemoglobin level and risk of hip fracture in older people with type 2 diabetes: a competing risk analysis of taiwan diabetes cohort study. J. Bone Miner. Res. (2015) 30:1338–46. doi: 10.1002/jbmr.2462
40. Nguyen HT, von Schoultz B, Nguyen TV, Thang TX, Chau TT, Duc PT, et al. Sex hormone levels as determinants of bone mineral density and osteoporosis in Vietnamese women and men. J. Bone Miner. Metab. (2015) 33:658–65. doi: 10.1007/s00774-014-0629-z
41. Park YM, Jankowski CM, Swanson CM, Hildreth KL, Kohrt WM, Moreau KL. Bone mineral density in different menopause stages is associated with follicle stimulating hormone levels in healthy women. Int J Environ Res Public Health. (2021) 18:1200. doi: 10.3390/ijerph18031200
42. Schmitz D, Ek WE, Berggren E, Höglund J, Karlsson T, Johansson Å. Genome-wide association study of estradiol levels and the causal effect of estradiol on bone mineral density. J Clin Endocrinol Metab. (2021) 106:e4471–86. doi: 10.1210/clinem/dgab507
43. Takeuchi M, Kakushi H, Tohkin M. Androgens directly stimulate mineralization and increase androgen receptors in human osteoblast-like osteosarcoma cells. Biochem Biophys Res Commun. (1994) 204:905–11. doi: 10.1006/bbrc.1994.2545
Keywords: type 2 diabetes, creatinine, cystatin C, Cre/CysC, bone mineral density
Citation: Gao T, Liu F, Ban B, Hou Y, Li G, Jiang M, Yang Q and Zhang M (2022) Association between the ratio of serum creatinine to cystatin C and bone mineral density in Chinese older adults patients with type 2 diabetes mellitus. Front. Nutr. 9:1035853. doi: 10.3389/fnut.2022.1035853
Received: 03 September 2022; Accepted: 07 October 2022;
Published: 21 October 2022.
Edited by:
Zhenjun Zhu, Jinan University, ChinaReviewed by:
Roberta Pujia, University of Magna Græcia, ItalyNurpudji Astuti Taslim, Hasanuddin University, Indonesia
Copyright © 2022 Gao, Liu, Ban, Hou, Li, Jiang, Yang and Zhang. This is an open-access article distributed under the terms of the Creative Commons Attribution License (CC BY). The use, distribution or reproduction in other forums is permitted, provided the original author(s) and the copyright owner(s) are credited and that the original publication in this journal is cited, in accordance with accepted academic practice. No use, distribution or reproduction is permitted which does not comply with these terms.
*Correspondence: Mei Zhang, MTM1MTUzNzQwODlAMTYzLmNvbQ==
 Ting Gao
 Fupeng Liu
 Bo Ban
 Yue Hou
 Guangxin Li
 Mingming Jiang
 Qing Yang
 Mei Zhang