- 1Institute of Geotechnical Engineering, Nanjing Tech University, Nanjing, China
- 2Civil Engineering and Earthquake Disaster Prevention Center of Jiangsu Province, Nanjing, China
- 3School of Civil Engineering, Sun Yat-Sen University, Guangzhou, China
- 4Southern Marine Science and Engineering Guangdong Laboratory (Zhuhai), Zhuhai, China
- 5Knowledge Management Dept. Fujian Yongfu Power Engineering Co., Ltd., Fuzhou, China
Earthquake in the sea area is an important factor affecting the safety of marine engineering construction, seabed site seismic response analysis is an important preliminary work for marine engineering construction. Based on a fluid-solid weak coupling model which could simulate seawater-seabed interaction, four typical borehole sections along the proposed tunnel at Qiongzhou strait are selected to establish layered seabed models for studying the seabed site seismic responses affected by the seawater, seabed soft sediments and bedrock earthquake motion under bidirectional seismic excitation, in which the dynamic nonlinearity of the seabed soft soil is simulated by a generalized non-Masing constitutive model (DCZ model). The result shows: the suppression effect of seawater on seabed seismic motion exists only in the shallow range of seabed (< 50 m), and the suppression effect on the vertical seismic response is higher than that along the horizontal direction; the suppression effect of seawater on the seabed surface seismic motion and the frequency response phenomenon of “high frequency suppression, low frequency amplification” of seabed seismic response is positively correlated with seawater depth; The mean lines of the horizontal and vertical spectrum β obtained by numerical calculation are higher than the design spectrum in the land code within several period ranges, and the possibility of adverse effects induced by seawater and seabed soft sedimentation on the seismic resistance of marine engineering should be considered.
1 Introduction
A large number of marine projects in China’s coastal and offshore marine areas have entered the climax period of planning and construction in the context of building an ocean power. The correct understanding of the seismic response characteristics of seabed sites is of great significance in guiding the seismic design of marine engineering. Marine earthquakes can cause severe destruction, such as the 1989 Loma Prieta earthquake, which resulted in the collapse of the main span of the San Francisco-Oakland Bay Bridge, and the 1995 Kobe earthquake, which caused liquefaction of the soil on two nearshore artificial islands: Port Island and Rokko Island (Nolen-Hoeksema and Morrow, 1991; Tanaka, 2000).
The seismic information recorded by seismic stations is the most direct and reliable means to study seismic motion characteristics (Boore, 1999; Boore and Smith, 1999; Boore and Bommer, 2005; Karimzadeh et al., 2021). Typical differences in seismic response between marine and land sites are characterized by statistical analysis of existing marine ground shaking: vertical peak acceleration at the seabed surface is significantly smaller than at the adjacent land surface; long-period response of the seabed surface is greater than that of the surrounding land surface, but the short-cycle response is less than (Chen B. et al., 2015; Hu et al., 2020; Tan and Hu, 2023). Diao et al. (2014) and Li et al. (2015) used fluid dynamics equations and one-dimensional wave theory, the researchers investigated the mechanisms of seawater’s influence on seismic response of the seabed. The findings suggest that when the impedance of seawater is significantly different from that of the site, the dominant frequency response of vertical seismic motion on the seabed is close to the resonant frequency of the P-wave in seawater. Conversely, the vertical seismic motion on the seafloor is noticeably suppressed near the resonant frequency of the P-wave in seawater compared to near the coast. Furthermore, there exists a closer correlation between P-wave propagation in seawater and the seabed site. This research contributes to a deeper understanding of the effects of seawater on seismic response of the seabed. The seismic response of established sites is still difficult to determine due to the limitations of ground shaking recordings in the sea area as well as analytical calculation methods.
Over the years, the effectiveness of numerical simulation methods in the analysis of seismic response of land-based sites has been widely verified (Yang et al., 2011; Chen G. et al., 2015; Guoxing et al., 2015; Adhikary and Singh, 2019; Falcone et al., 2020), and it is an effective method to analyze the seismic response of the seabed by taking the analysis method of seismic response of land-based sites as a basis and further considering the influence of seawater.
The sediment beneath the ocean floor is subject to dynamic water pressure from waves. Airy (1993) introduced the theory of small-amplitude wave oscillations, which assumes that the wave amplitudes are significantly smaller than the water depth. Based on the one-way transmission of wave forces generated by Airy waves to the seabed and the omission of seawater-seabed interaction during seismic events, the computed results indicate that the seismic response of the seabed increases under the combined effect of small waves and earthquakes (Liu et al., 2013). However, it is crucial to recognize that the interaction between seawater and the seabed is a significant factor influencing seismic responses in marine areas. Using potential flow theory and Biot consolidation theory, investigated the influence of seawater-seabed interaction, including fluid exchange, on the seismic response of a simplified seabed configuration. The results revealed a notable amplification of the P-wave vertical component due to the presence of an inclined seabed (Chen B. et al., 2021). Moreover, variations in seawater depth also impact the characteristics of seismic motion. Chen et al. (2023) considering the effect of seawater, established a coupled model of seawater-pile foundation-cable-stayed bridge system. Their research demonstrated that as the seawater depth increases, the restraint on the vertical seismic motion becomes more pronounced. In conclusion, the interaction between seawater and the seabed is a critical factor affecting seismic responses in marine environments. Accounting for this interaction and its effects on seismic behavior in seabed structures during earthquake events is of utmost importance for accurate seismic analyses.
In numerical modeling of seismic characteristics in marine areas, the method of seismic excitation can also influence the nonlinear response behavior of seismic motion. Chen W. et al. (2021) utilized the acoustic module of the ABAQUS software platform to calculate the dynamic water pressure exerted by seawater on the seabed surface during earthquakes. The results indicate that bidirectional seismic motion leads to greater seismic response on the seabed surface. The influence of seawater enhances the low-frequency response of both the seabed and tunnels. The interaction between seawater and seabed varies with changes in the motion state. Jeng et al. (2013) used the fluid VARANS equation to simulate seawater and the dynamic Biot equation to simulate the seabed, considering the seawater-seabed interaction and the fluid exchange between them, the proposed numerical model can accurately simulate the transient dynamic response of fluids and solids at the same time, and it has a great potential to be applied in the analysis of seismic response of seabed sites.
In this study, considering the dynamic water pressure generated by seawater during earthquakes, based on a weakly coupled analysis method that can realize the two-way exchange of variables between the fluid domain and the solid domain, the fluid N-S equations are used to simulate seawater, and the generalized non-Masing intrinsic model describes the nonlinear dynamic properties of marine soils, And the layered seafloor model, which is established by taking four typical borehole profiles of the Qiongzhou Strait cross-sea channel profiles as the object of study, takes into account seawater-seafloor interactions, and the effects of bidirectional seismic motions (P-wave and S-wave) on the nonlinear seismic response characteristics of the seafloor site are analyzed to investigate the effects of seawater on nonlinear seismicity in seafloor sites and the mechanism of its action.
2 Materials and methods
2.1 Flow-solid weak coupling method
The fluid-solid coupling between seawater and the seabed involves: (1) the interaction between dynamic water pressure of seawater and the motion of the seabed, and (2) the seepage forces resulting from fluid exchange between seawater and the seabed. This study focuses solely on the interaction between the dynamic behavior of seawater and the motion of the seabed surface, utilizing a weak fluid-solid coupling analysis method. The analysis process of the weak fluid-solid coupling method is achieved through an alternating coupling integration algorithm, where the field variables of the fluid domain (ΩF) and the solid domain (ΩS) are interactively exchanged in real-time at the fluid-solid interface.
The specific procedure is illustrated in Figure 1: After completing the initialization, ① the fluid dynamic analysis is conducted, and the pressure PF on the fluid-solid interface ΓF-S at the coupling increment time Δt. is converted into external loads for the solid domain. Subsequently, the solid dynamic analysis is carried out to solve for the solid motion displacement uS and velocity on the ΓF-S interface at time Δt, completing the weak fluid-solid coupling analysis at Δt. ② At 2Δt, the solid domain variables uS and on the ΓF-S interface are converted into the boundary conditions for fluid flow, initiating the solid dynamic analysis for 2Δt. This process is then repeated, alternating between ① and ②, incrementing the coupling increment steps until the entire weak fluid-solid coupling analysis is completed.
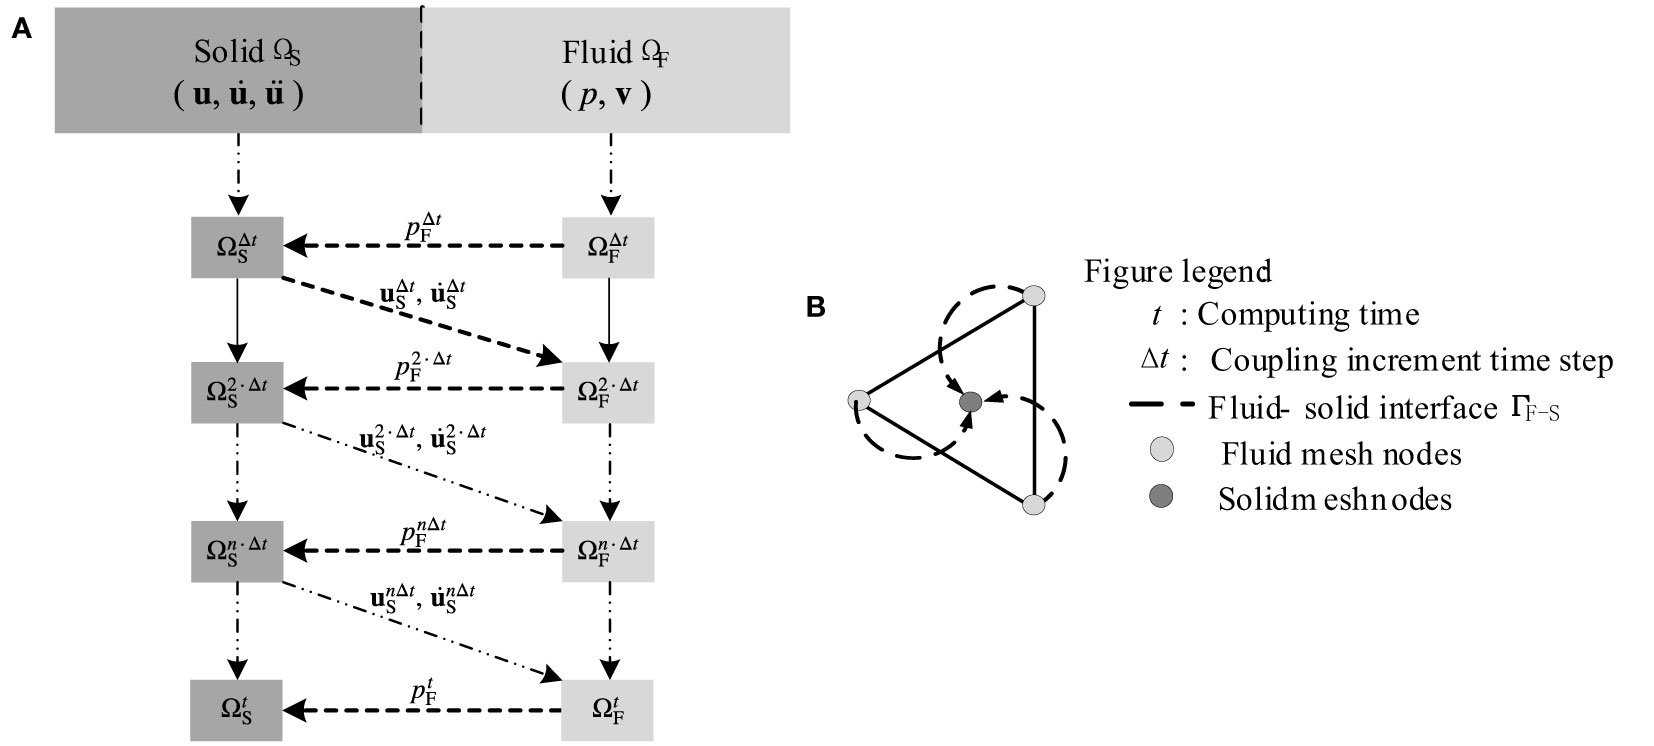
Figure 1 (A) Bidirectional cross coupling integration algorithm at ΓS-F interface; (B) Schematic diagram of node data transfer at ΓS-F interface.
Assuming a homogeneous and horizontally layered seabed site for analysis, the numerical model for weak fluid-solid coupling corresponding to the layered seabed site is shown in Figure 2B.
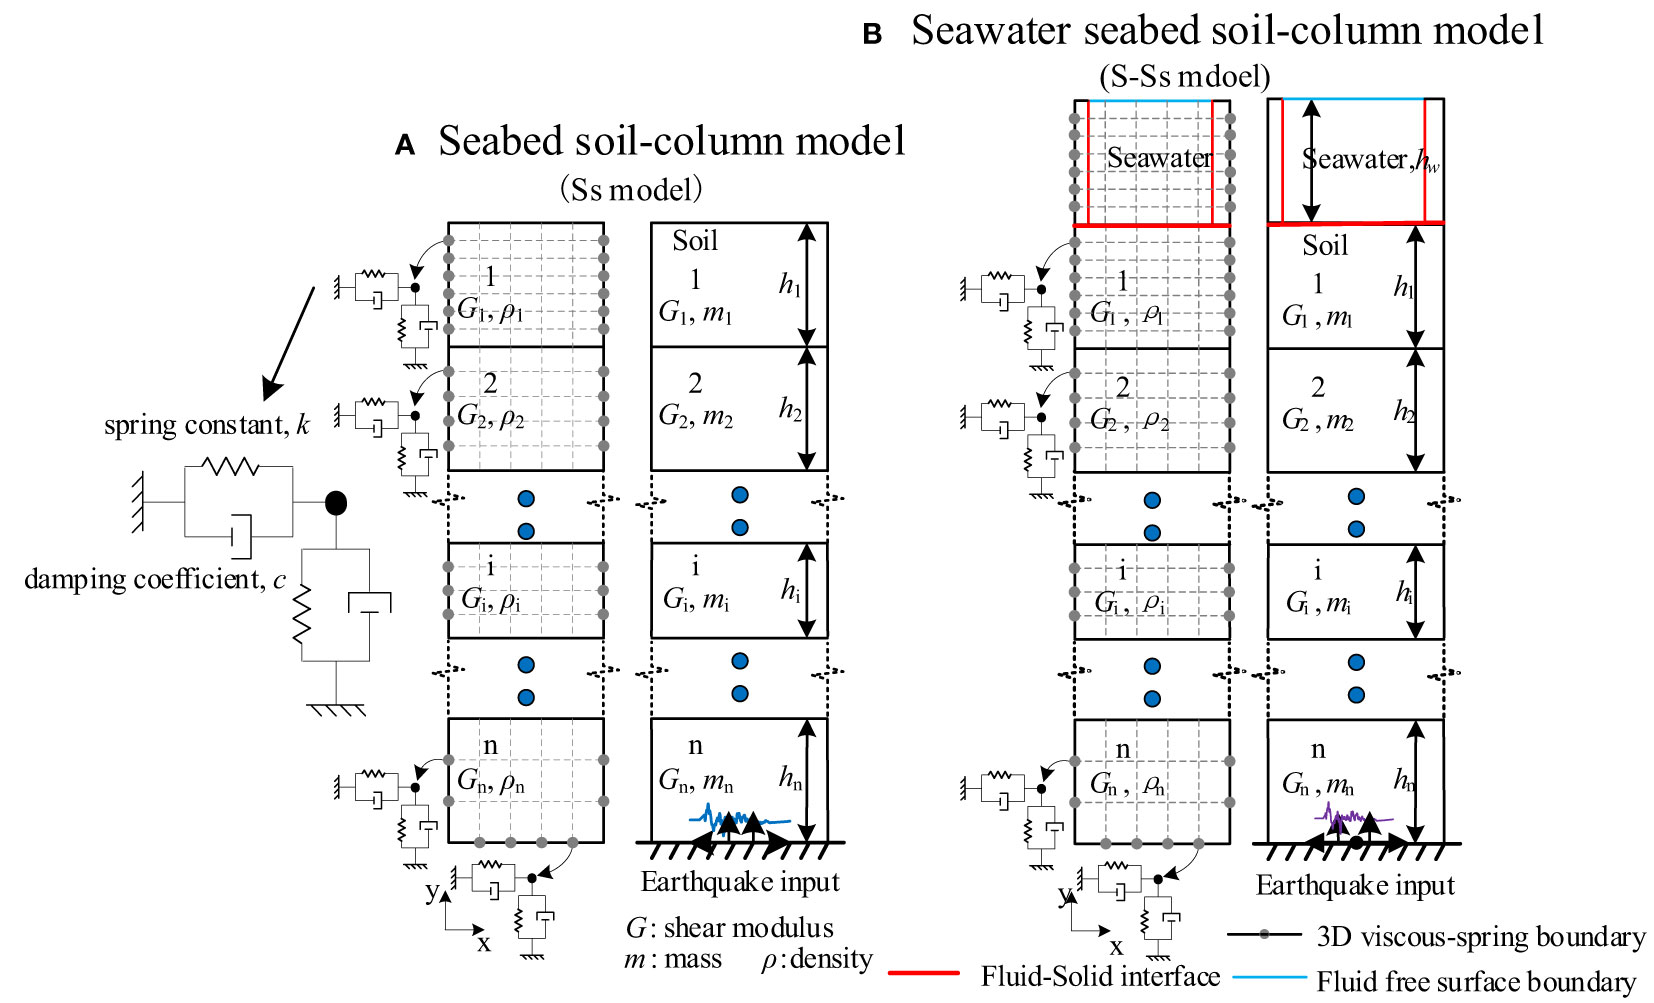
Figure 2 Numerical model: (A) Seabed soil-column model (Ss model); (B) Seawater seabed soil-column model (S-Ss model).
A horizontally layered homogeneous model is established for the seawater layer and the seabed site, with the fluid-solid coupling interface located at the interface between the seabed and the sea bottom. Due to the 3D nature of the ABAQUS/CFD fluid model, the seabed site model consists of a horizontally layered soil column model composed of a single layer of 3D solid elements using C3D8R elements. The model employs improved equivalent viscoelastic artificial boundaries at the bottom and lateral boundaries. The calculation increment step (Δts) for solid dynamic analysis is set to 5×10⁻⁵ s (Wang et al., 2023). The fluid model consists of a layered water domain with a single layer of 3D fluid elements using FC3D8 elements. The water surface is modeled as a free fluid interface. The initial calculation increment step (ΔtF) for fluid dynamic analysis is set to 0.01 s. The coupling increment analysis step (Δt) is set to 0.01 s, which means that data exchange between the fluid and solid domains occurs every 0.01 s. The bottom of the model receives bidirectional input ground motion.
The Seabed soil-column model (Ss model), shown in Figure 2A, without considering the dynamic water pressure of seawater, is compared to the Seawater seabed soil-column model(S-Ss model). It is important to incorporate the static water pressure generated by seawater in the analysis of the Seabed soil-column model.
The interaction between seawater and the seabed is closely related to the gravitational field. In the S-Ss model, a gravity field is formed by simulating the buoyancy-driven flow field. The calculation of the gravity field is described by Equation(1).
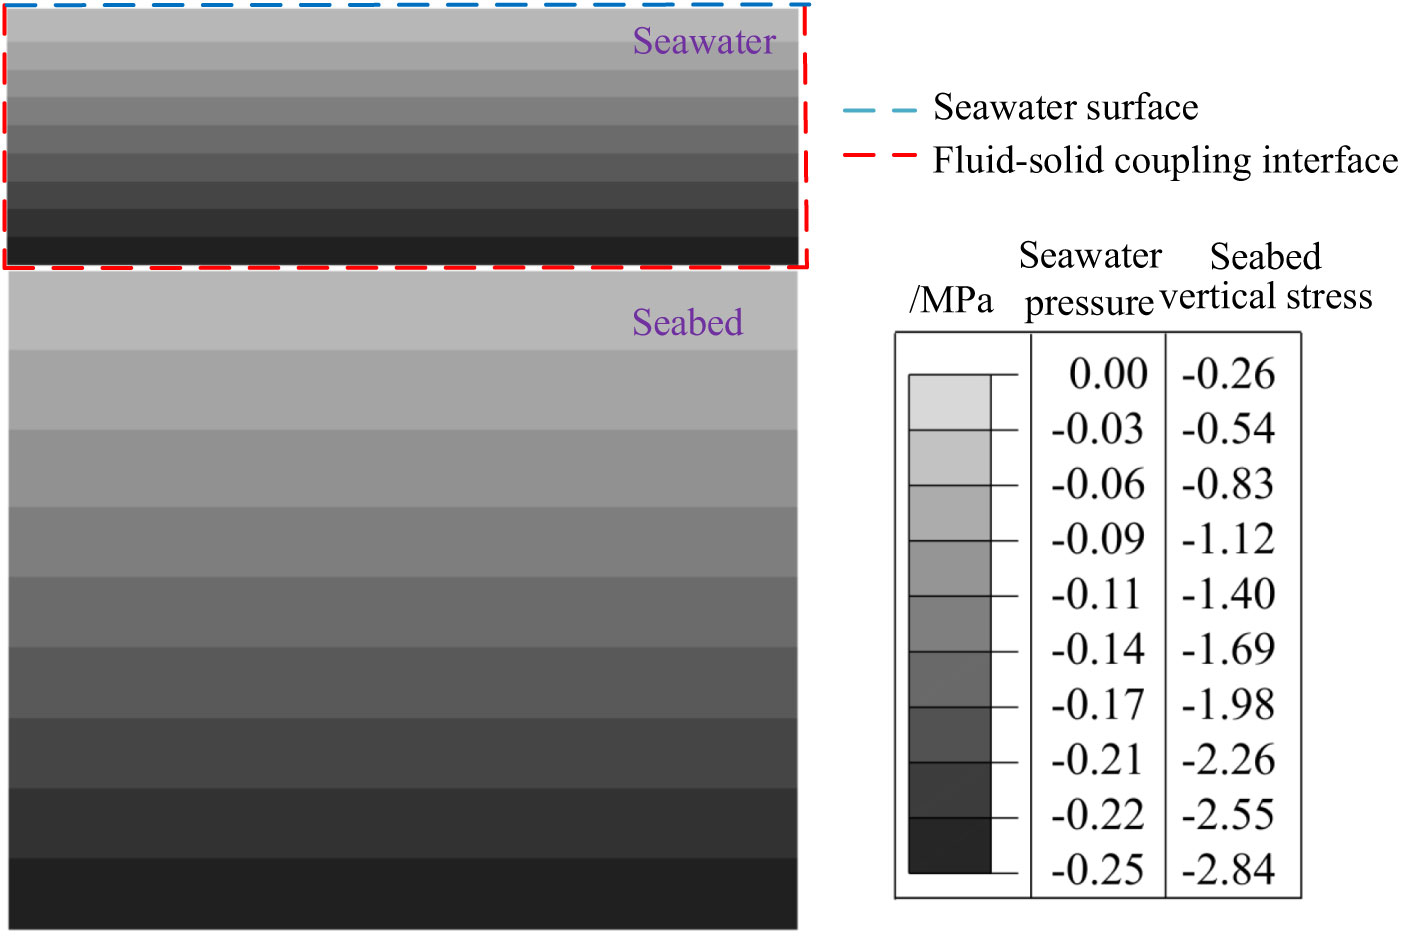
Where G is gravity; FBuoyancy is buoyancy; ρI is the initial density of the flow field; β is the coefficient of thermal expansion; is the analyzed temperature; is the reference temperature; so that ρI =1000kg/m3, = 1.0, the seawater pressure is equal to seawater gravity (ρw g h), ρw is the density of the seawater, and h is the water depth. Figure 3 gives the initial stress field of the seawater-soil column model with borehole ZK-04 as an example.
2.2 Seabed site information
This research utilizes data from four representative borehole profiles (ZK-04, ZK-08, ZK-11, and ZK-13) along the proposed tunnel route in Qiongzhou Strait, China. These profiles are used to construct a layered seabed site model, and the typical borehole velocity information is presented in Figure 4A. Borehole ZK-04 has a depth of 100.0m and a top elevation of -25.60m. The upper section consists of silty clay interbedded with sand, silty clay, and medium sand, while the lower section is characterized by thick layers of laminated clay. Borehole ZK-08 has a depth of 120.20m and a top elevation of -55.60m. The upper section includes a thick layer of silty clay, followed by an interlayer of silty clay and fine sand. Borehole ZK-11 has a depth of 200.20m and a top elevation of -84.80m. The upper section comprises interlayers of fine sand, silty clay, and an intermediate layer of fine sand and medium sand. The lower section exhibits thick clay layers and serves as a key borehole for determining the seabed soil conditions. Borehole ZK-13 has a depth of 120.50m and a top elevation of -81.60m. The upper section of the borehole features a thick layer of fine sand, while the lower section consists of thick, layered silty clay. According to the specifications outlined in the ‘Seismic Ground Motion Parameter Zonation Map of China’ (GB18306-2015), shear wave velocity (VS) greater than 500 m/s, and the absence of lower velocity rock-soil interfaces below, can be considered as bedrock. Based on Figure 4A, it can be observed that the shear wave velocities (VS) at the final depths of all four boreholes satisfy the regulatory requirements. Therefore, these boreholes can be considered as input surfaces for seismic ground motion analysis.
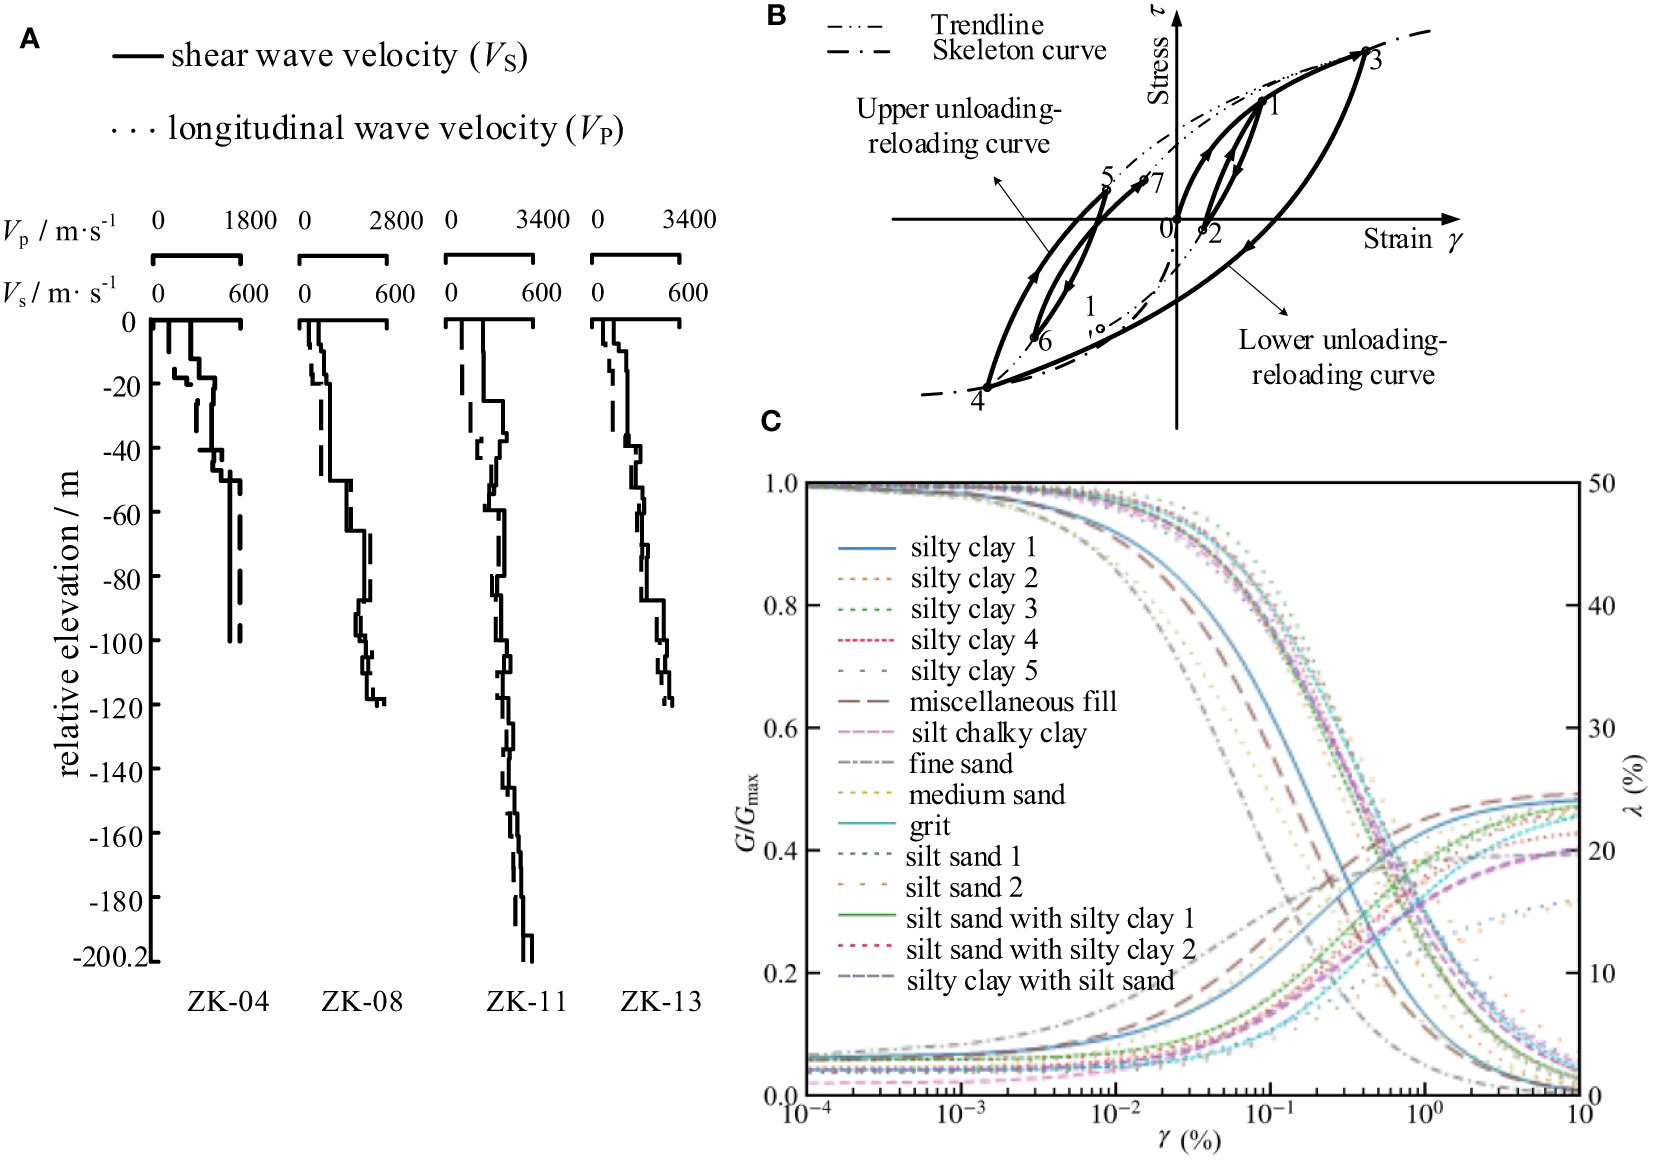
Figure 4 Seabed site conditions: (A) VS and VP of the borehole; (B) The sketch of DCZ model; (C) parameters of DCZ model: shear modulus reduction and damping ratio curves of the strait stratum soils and.
2.3 Nonlinear parameters of marine soils
The nonlinear dynamic characteristics of seabed soils are described using the generalized non-Masing constitutive model based on the Davidenkov skeleton curve, developed by Chen et al. (Chen G. et al., 2021; Wang et al., 2021). This model, known as the DCZ model, depicts the dynamic stress-strain relationship of the seabed soil, as illustrated in Figure 4B.
The expression for the Davidenkov skeleton curve is as follows:
H(γ) is the function describing the shape of stress-strain relationship, expressed in the Davidenkov form:
Where τ is the shear stress; γ is the shear strain; G is the shear modulus; Gmax = ρVS is the maximum dynamic shear modulus, ρ is the density, and VS is the result of the site shear wave velocity obtained from the field survey; A, B and γr are the best-fit parameters related to the soil properties, which are determined by the G/Gmax - γ and λ - γ mean curves of various types of soils of the Qionghzhou Strait given by experiments conducted by Sun et al. (Sun et al., 2012; Sun et al., 2013) (Figure 4C).
2.4 Selection of bedrock input motion
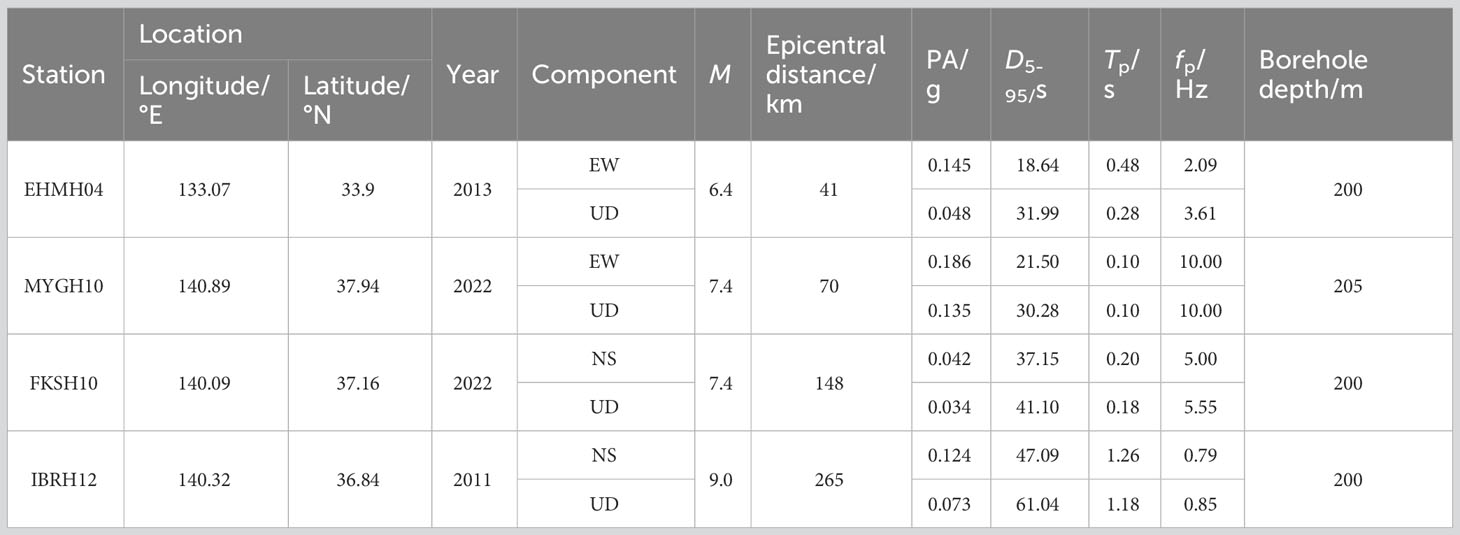
There is currently no historical seismic record data available for the Qiongzhou Strait and its neighboring areas. Therefore, based on the reference of previous earthquake magnitudes, epicentral distances, and selected borehole depths (Chen et al., 2022), four seismic records from the Japanese Strong Motion Network (KiK-Net) were chosen for input ground motion at different distances: near-field, mid-field, intermediate distance, and far-field, as shown in Table 1.
The EW/NS components with higher peak ground accelerations and the UD component were separately applied as horizontal and vertical ground motions at the bedrock level. Figure 5 presents the acceleration time history and Fourier spectrum of the bedrock ground motion.
3 Results and discussions
3.1 Fundamental period and site classification of the seabed
The fundamental period (Ts) of the seabed site was determined using the HVSR (Horizontal-to-Vertical Spectral Ratio) method (Nakamura, 2019), which calculated the average values of a for different seismic excitations using Ss model and S-Ss model. The site classification of different borehole profiles was determined based on three indicators (Chen et al., 2020): average shear wave velocity (VS30) obtained from seabed average travel time, fundamental period (Ts), and thickness of the overlying layer (H). The results of site classification are presented in Table 2. The calculated values of Ts, without considering the influence of seawater, ranged from 0.97 s to 1.56 s. Considering the influence of seawater in the S-Ss model, the calculated values of Ts ranged from 1.38 s to 1.79 s, indicating an increase in the fundamental period of the seabed due to the presence of seawater. Additionally, based on the analysis results of this study, it was found that the inclusion of seawater did not affect the classification of site types.
3.2 Acceleration of the seabed surface
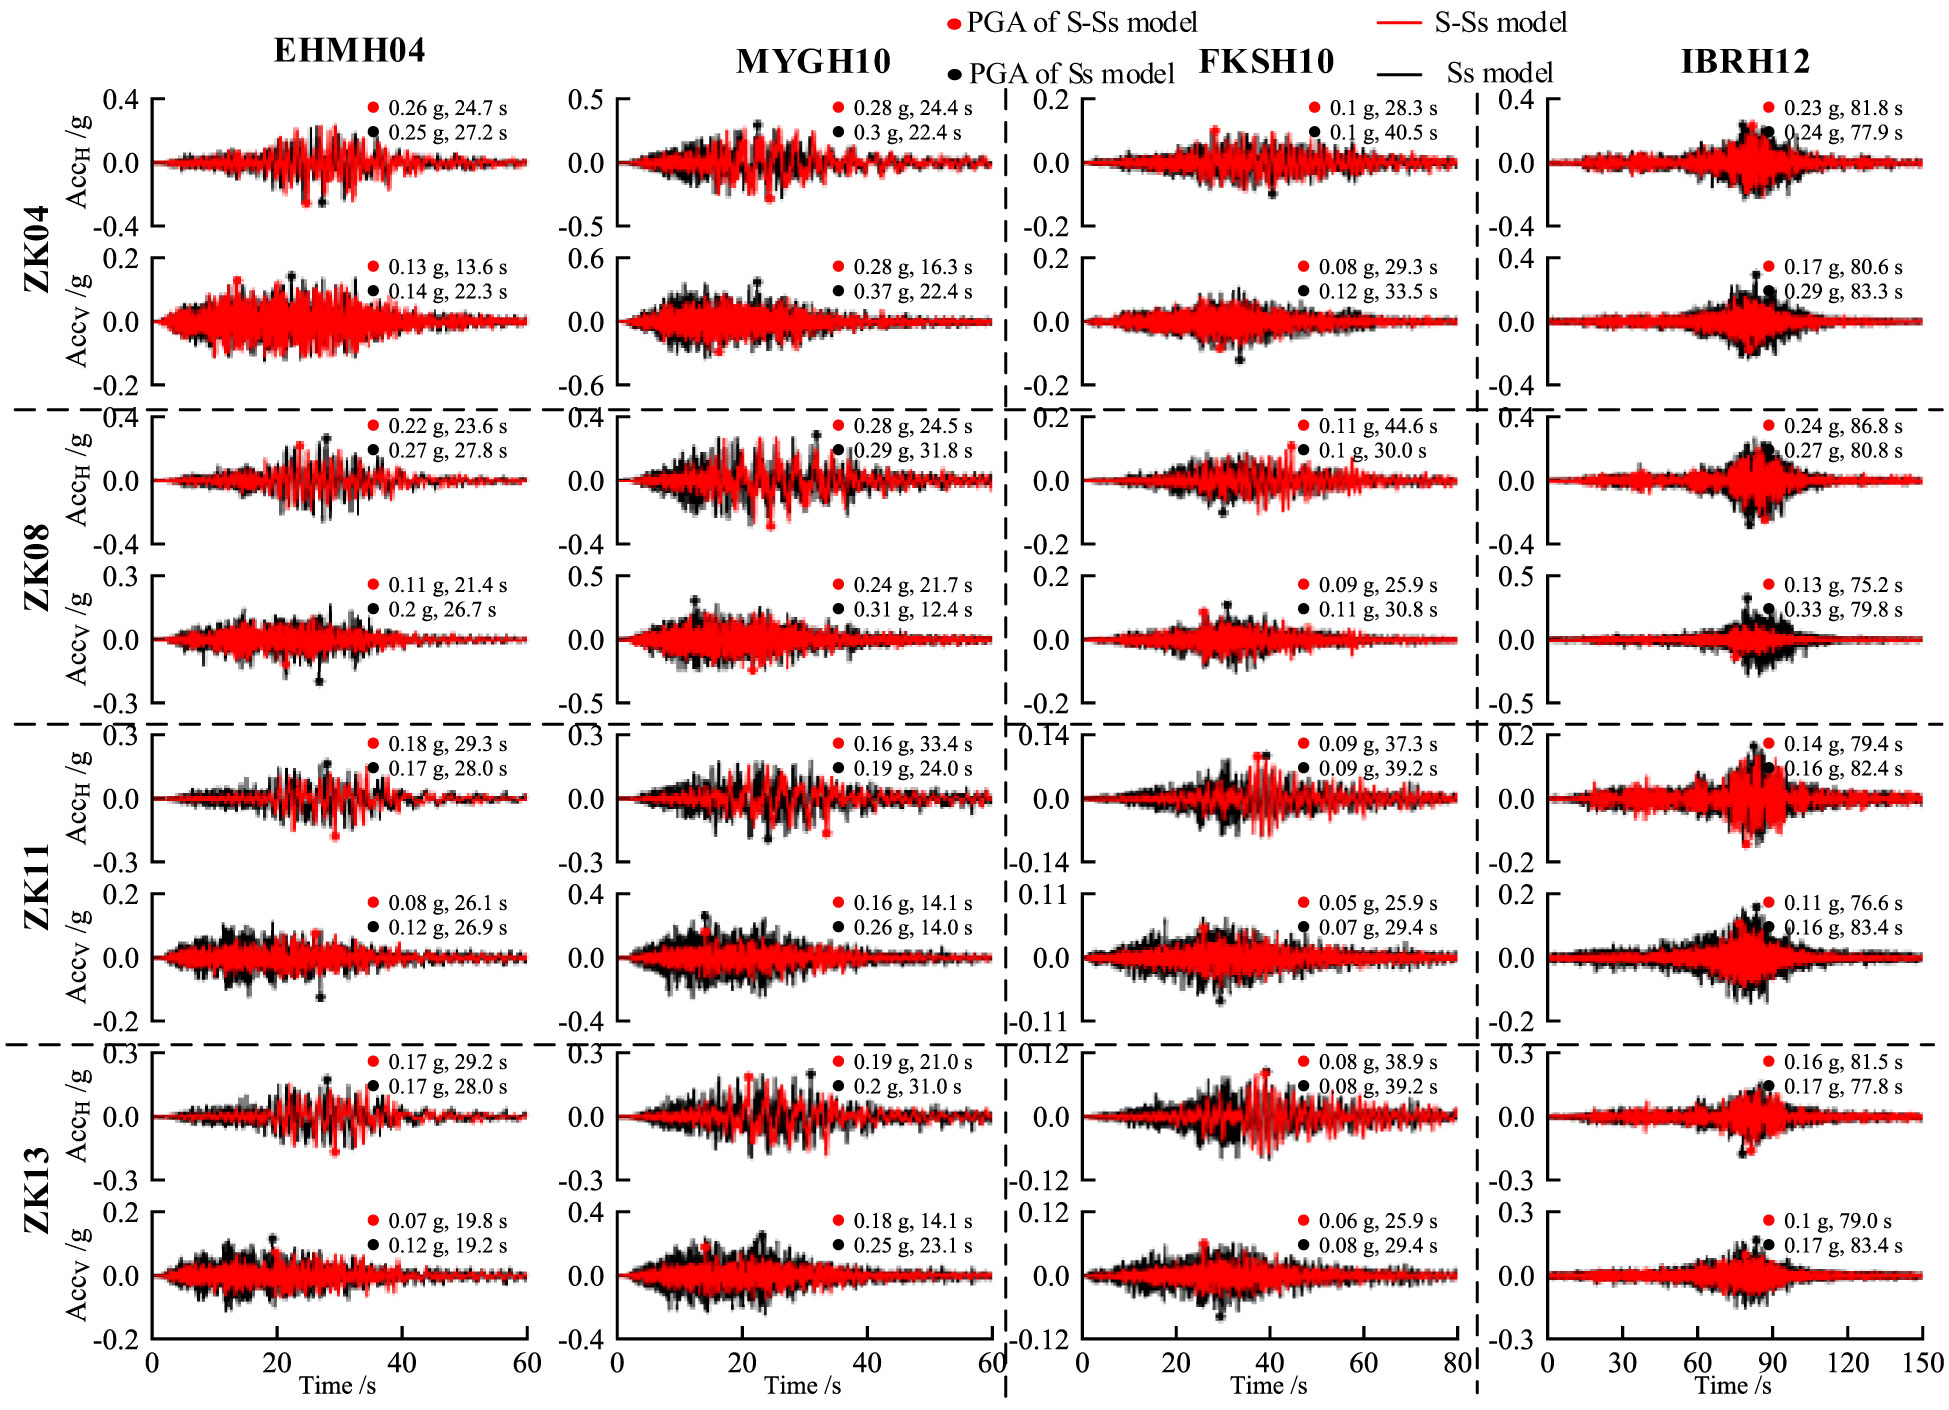
Figure 6 shows the acceleration time history response of the seabed surface observation points for boreholes ZK-04, ZK-08, ZK-11, and ZK-13 under different seismic motion excitations: EHMH04, MYGH10, FKSH10, and IBRH12. The influence coefficient (Q) of seawater on the peak ground acceleration (PGA) of the ground surface is defined as Q = (PGASs model − PGAS-Ss model)/PBA, PBA is the peak bedrock acceleration of the seabed.
For borehole ZK-04, the horizontal influence coefficient (QH) under different seismic excitations is -0.07, 0.11, 0, and 0.08, respectively. The vertical influence coefficient (QV) is 0.21, 0.81, 1.18, and 1.64, respectively. For borehole ZK-08, the QH values under different seismic excitations are 0.34, 0.05, -0.24, and 0.24, respectively. The QV values are 1.88, 0.52, 0.58, and 2.74, respectively. For borehole ZK-11, the QH values under different seismic excitations are -0.07, 0.16, 0, and 0.16, respectively. The QV values are 0.83, 0.74, 0.59, and 0.68, respectively. For borehole ZK-13, the QH values under different seismic excitations are 0, 0.05, 0, and 0.08, respectively. The QV values are 1.04, 0.52, 0.59, and 0.96, respectively.
In summary, it can be observed that seawater has a restraining effect on the vertical motion of the seabed surface. The influence of seawater on the vertical motion of the seabed surface is greater than the horizontal motion. The strength of seawater’s influence on the peak ground acceleration depends on various factors such as seabed soil characteristics, water depth, and seismic motion characteristics.
The seismic duration extension factor of the seabed surface, defined as D5-95-PF = D5-95-G/D5-95-B, where G represents the ground surface and B represents the bedrock, is illustrated in Figure 7. Both in the horizontal and vertical directions, the values of D5-95-PF under the influence of seawater are relatively small, indicating that seawater suppresses the extension of effective seismic duration at the seabed surface. Under the influence of seawater, the average values of horizontal D5-95-PF decrease from 1.66 to 1.43 for the MYGH10 excitation, and the average values of vertical D5-95-PF decrease from 1.23 to 0.78. For the FKSH10 excitation, the average values of horizontal D5-95-PF decrease from 0.89 to 0.82, and the average values of vertical D5-95-PF decrease from 1.17 to 1.05. It can be observed that as the intensity of the bedrock seismic motion increases, the inhibitory effect on the extension of seismic duration at the seabed surface also increases, with the vertical seismic motion being more significantly suppressed than the horizontal motion.
3.3 Mechanistic analysis of the role of seawater in the seismic response of the seabed
Figure 8 presents the spectrograms of the acceleration transfer function (Fourier spectrum amplitude ratio of soil layer seismic motion to bedrock seismic motion, FSR) for different borehole profiles considering or not considering the influence of seawater, under the excitation of bidirectional input MYGH10 records.
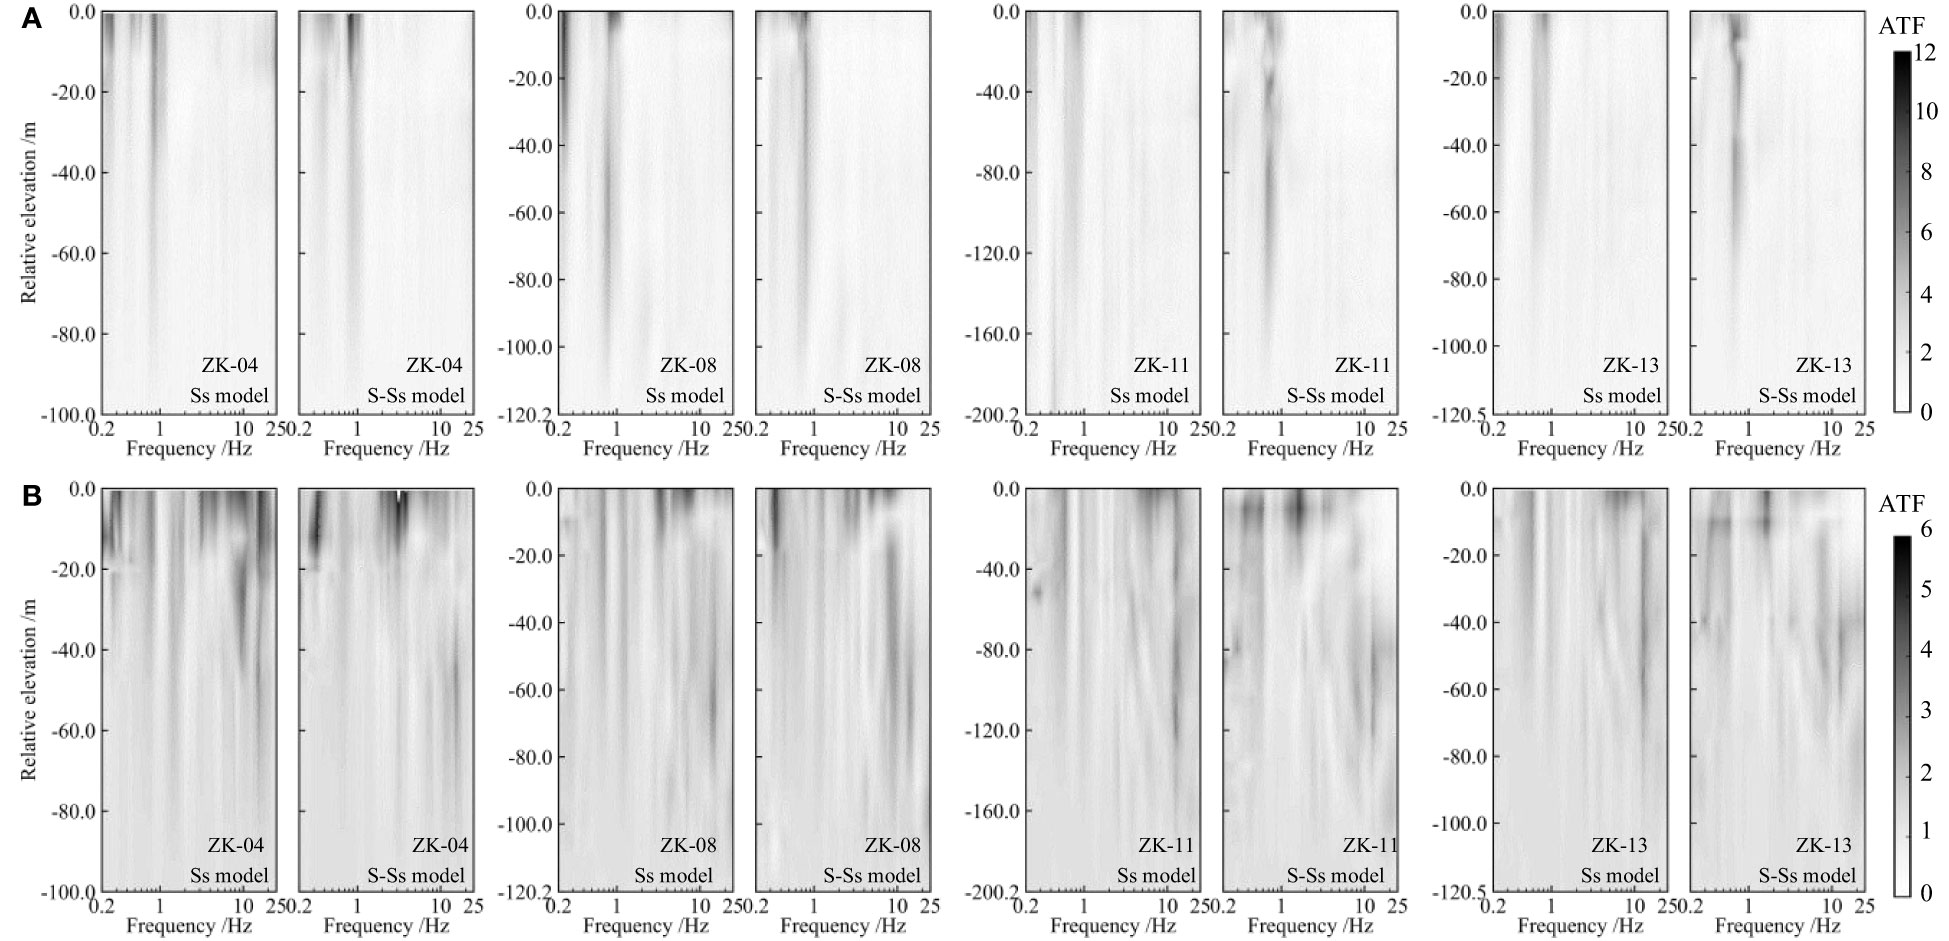
Figure 8 Comparisons of the Fourier spectrum amplitude ratios with and without seawater at the borehole profile (bidirectional shaking: MYGH10 record): (A) horizontal; (B) vertical.
It can be observed that the color distribution of the spectrograms varies for the horizontal and vertical FSR graphs due to the differences in borehole site profiles. The similarity or dissimilarity of the soil layer structures is the primary factor causing these differences. Without considering the influence of seawater, significant resonance phenomena are observed in the horizontal seismic response at around 0.25 Hz and 0.9 Hz for the four representative boreholes under different seismic motion excitations. Vertical seismic responses exhibit resonance phenomena at multiple frequencies throughout the entire frequency range. When considering the influence of seawater, the resonant frequencies of the horizontal seismic component mainly concentrate in the range of 0.7 Hz to 1.1 Hz, while the resonant frequencies of the vertical component concentrate in the range of 1.5 Hz to 3.0 Hz. The resonant frequency (f) of the seawater P-wave is determined by Equation (4) (Li et al., 2015).
Where n is an odd number; fn is the corresponding nth-order frequency; H is the water depth; c is the seawater P-wave velocity, and c = 1450 m/s for a temperature of 20°C.
In this study, the water depths of all seabed boreholes are less than 110 m, and the corresponding first-order resonance frequency of seawater’s P-wave is greater than 3.3 Hz. This frequency range aligns with the reduction in the seismic ground motion at the seabed surface caused by the influence of seawater. This indicates that seawater suppresses the propagation of high-frequency components. However, the amplification of long-period components at the seabed surface can be attributed to the seismic-induced dynamic water pressure in the seawater. The high impedance boundary is located in a region deeper than the seafloor, as discussed in the deep sea region (Nosov and Kolesov, 2007), and this can make the dominant frequency lower than 3.3 Hz (i.e., the fundamental resonance frequency) if a water layer is present. There is a relatively high intention domain shallower than 20 m near 2 Hz of vertical ATF at ZK-11 in Figure 8B suggested that high impedance boundary could have appeared at a depth of 40 m, the above two phenomena are related.
It is generally believed that seawater mainly influences the vertical seismic motion and has no direct impact on the horizontal seismic motion (Li et al., 2015). A comparison between the horizontal responses of the Ss model and S-Ss model in Figure 8A reveals significant differences in the resonant frequencies.
Using the representative seafloor borehole ZK-11 as an example, this study investigates the mechanism by which seawater affects the ground seismic motion of a soil column model. Comparing the seismic response of the seabed site with and without seawater under horizontal seismic action only (Figure 9A), it is observed that seawater has almost no effect on the spectrum acceleration (SA) at the soil column surface. A further comparison is made between the SA at the surface of the soil column under horizontal seismic action only and under bi-directional seismic action without considering the influence of seawater (Figure 9B). Significant differences are observed between the two cases, with bi-directional seismic action inducing a more diverse frequency response in the horizontal acceleration response of the soil column surface, revealing a coupled seismic response phenomenon involving both horizontal and vertical directions.

Figure 9 Comparison of the 5% damping horizontal spectrum acceleration (SA) at ground surface of the soil column calculated by: (A) Ss model and S-Ss model under only horizontal shaking; (B) Ss model under only horizontal shaking and bidirectional shaking.
Combining the above observations, it is concluded that seawater directly influences the vertical seismic response of the seafloor site. The differences in the horizontal seismic response of a horizontally stratified seabed site induced by seawater are not directly attributable to the effects of seawater, but rather result from the bidirectional coupled seismic effects of the site.
3.4 Site amplification
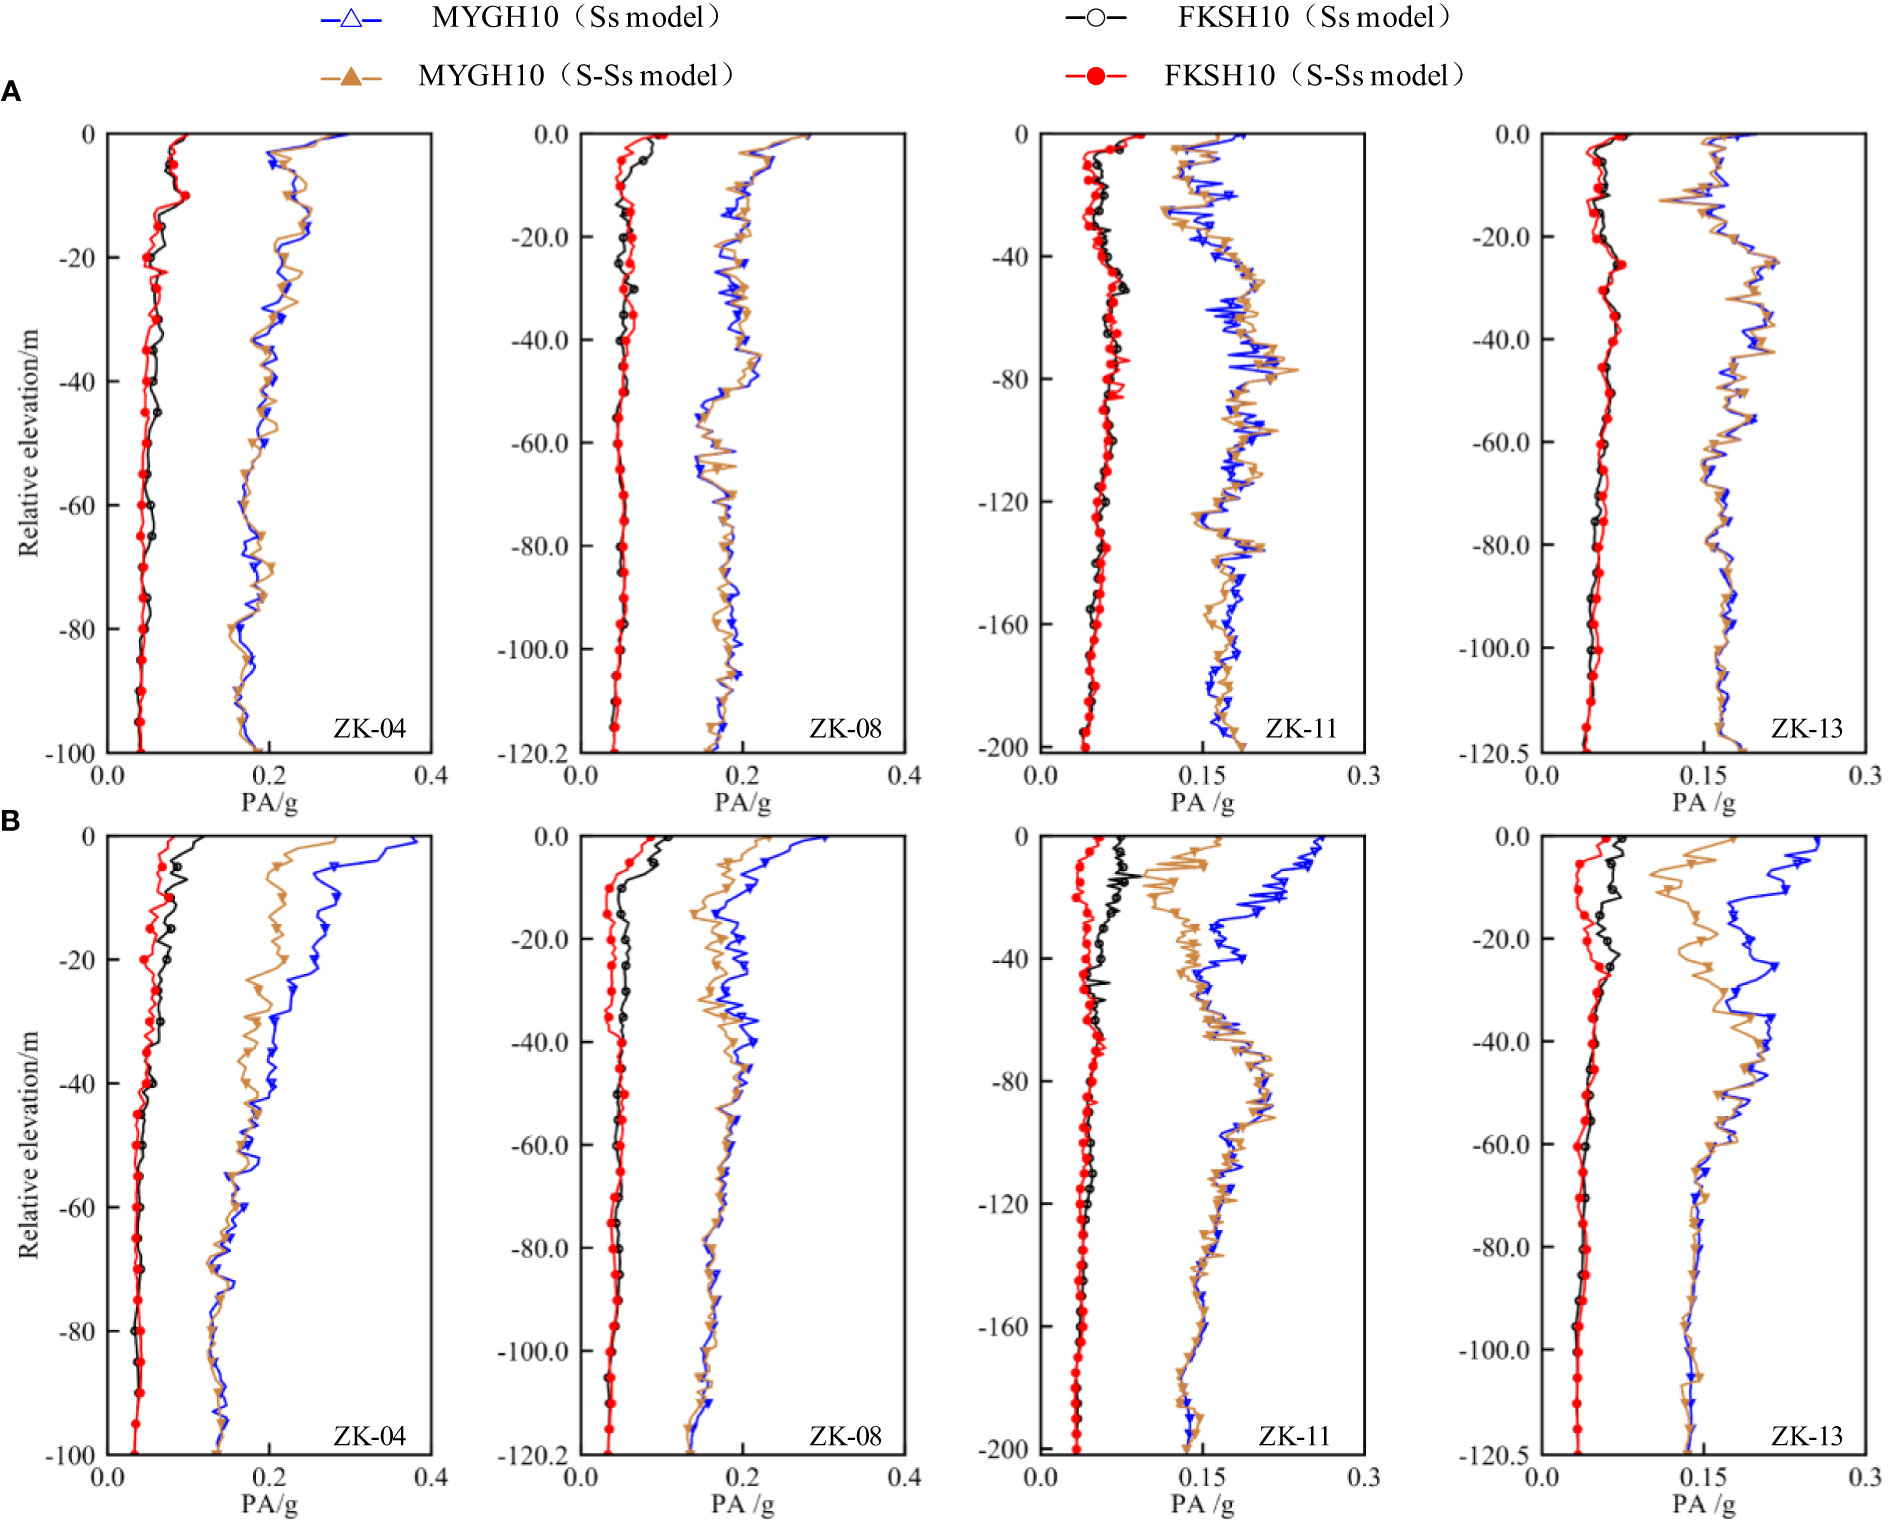
The variation curves of Peak Acceleration (PA) along the depth of the borehole profiles of boreholes ZK-04, ZK-08, ZK-11, and ZK-13 under the bi-directional excitation of bedrock ground shaking MYGH10 and FKSH10 are shown in Figure 10.
It can be observed that, regardless of the presence of seawater, there is little difference in the horizontal peak acceleration (PAH) among the seabed profiles. As the distance from the seabed surface decreases, the vertical peak acceleration (PAV) of the seabed profiles gradually decreases under the influence of seawater, reaching its minimum value at the seabed surface. The depth at which the difference in vertical peak acceleration (PAV) caused by seawater disappears is approximately as follows: for borehole ZK-04, the difference disappears at a depth of approximately 42 meters from the seabed surface; for borehole ZK-08, the difference disappears at a depth of approximately 45 meters from the seabed surface; for borehole ZK-11, the difference disappears at a depth of approximately 43 meters from the seabed surface; and for borehole ZK-13, the difference disappears at a depth of approximately 40 meters from the seabed surface. This indicates that the influence of seawater on the seabed site is only present in the shallow layers (approximately< 50 meters).
Figure 11 presents the normalized spectral accelerations (β spectra at 5% damping) of the seabed surface considering and not considering the influence of seawater, along with the mean curves.

Figure 11 FIGURE 11 Normalized acceleration of surface seismic motion β Spectrum (5% damping ratio): (A) Horizontal; (B) Vertical.
Additionally, the design response spectra (β spectra) for rare seismic events in Class III and Class IV sites, as specified in the ‘Seismic Ground Motion Parameter Zonation Map of China,’ are shown. It can be observed that, regardless of the presence of seawater, the mean curves of the horizontal and vertical β spectra for the seabed surface exhibit periods greater than those in the design β spectra, indicating potential safety hazards in seismic design of marine engineering projects following the onshore design standards. Under the influence of seawater, the mean curves of both horizontal and vertical β spectra display a pronounced ‘high-frequency filtering, low-frequency amplification’ phenomenon, with a corresponding shift towards longer periods. The influence of seawater causes the unsafe segments of the onshore design spectra to shift towards the middle and long period ranges.
3.5 Influence of water depth
Taking the typical deep borehole ZK-11 site profile as an example, layered seabed site models with different overlying seawater depths (5 m, 20 m, 40 m, 60 m, and 80 m) were established to investigate the influence of overlying seawater depth on the seismic response of the seabed site. The information for borehole ZK-11 information is shown in Figure 5A.
Figure 12 illustrates the variations of peak ground acceleration (PGA) and the influence coefficient Q obtained from the seawater-soil column model and the soil column calculation for different seawater depths. It can be observed that, when considering only the static water pressure of seawater, the initial stress field of the seabed site increases with increasing seawater static pressure, resulting in enhanced resistance to disturbances in the soil, leading to a gradual decrease in both horizontal and vertical PGA. The dynamic water pressure of seawater induced by seismic events suppresses the horizontal and vertical seismic motion at the seabed site, and this suppression effect becomes more pronounced with the increase in the depth of the seawater layer. The influence coefficient Q, representing the effect of seawater on peak ground acceleration, increases with the depth of the seawater layer. Under the seismic excitations of MYGH10 and FKSH10, the average values of horizontal influence coefficient (QH) are 0.12 and 0.29, respectively, while the average values of vertical influence coefficient (QV) are 0.39 and 0.41, respectively. Seawater exerts a greater inhibitory effect on vertical seismic motion compared to the horizontal motion, and the variations in vertical seismic motion are more pronounced with changes in water depth.

Figure 12 PGA and influence coefficient Q calculated by models with different water depth: (A) Horizontal; (B) vertical.
Figure 13 illustrates the normalized spectral accelerations (β spectra at 5% damping) of the seabed surface obtained from the seawater-soil column model under different seawater depths.
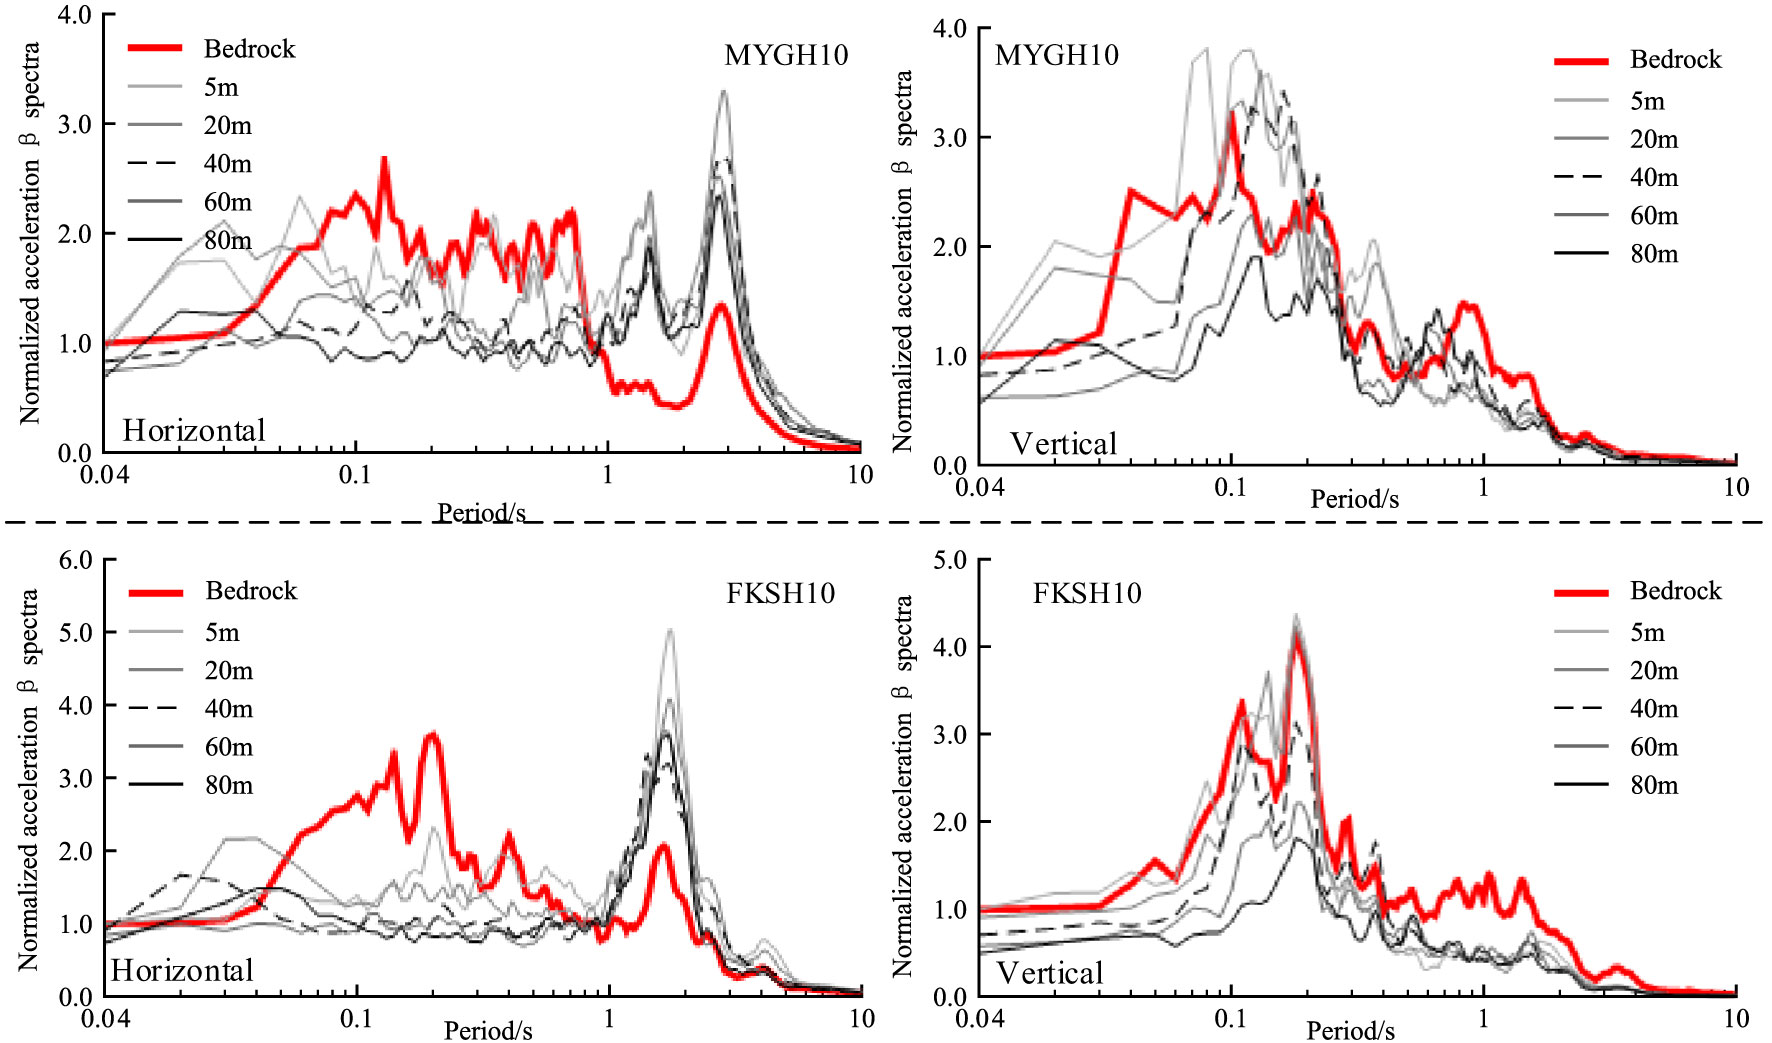
Figure 13 Normalized spectral acceleration of surface observation points in borehole ZK-11 β Spectrum (5% damping ratio).
It can be observed that, as the seawater depth increases, the influence of seawater on the horizontal and vertical β spectra of the seabed surface shows similar patterns, regardless of whether the input seismic records are from MYGH10 or FKSH10. This indicates that the effect of seawater is less correlated with the characteristics of the input bedrock seismic motion. For the horizontal β spectra of the seabed surface, there is a gradual reduction in short-period responses and an increase in long-period responses with increasing seawater depth. The dominant spectral peak for the horizontal direction shifts to around 2.5 s. On the other hand, the vertical β spectra of the seabed surface show suppression across the entire frequency range, with a higher degree of suppression observed in short-period responses. The dominant period of the vertical β spectra shifts towards longer periods.
4 Conclusions
By conducting seismic response analysis of four typical borehole profiles along the proposed underwater tunnel route in the Qiongzhou Strait, this study provides a comparison between the seawater-soil column model, considering the influence of overlying seawater dynamic water pressure and seawater-seabed interaction, and the soil column model without considering dynamic water pressure. The main conclusions are as follows:
(1) The seawater suppresses the seismic motion at the seabed surface, leading to a decrease in both horizontal and vertical peak ground accelerations and the effective seismic duration. Additionally, the vertical seismic motion is more significantly suppressed compared to the horizontal direction.
(2) The differences in seismic response between horizontal-only and bidirectional seismic actions for the seabed site highlight the presence of bidirectional coupled seismic effects. Traditional one-dimensional site analysis methods can potentially miscalculate the seismic response of the site. Seawater directly influences the vertical seismic response of horizontally layered seabed sites and, through bidirectional coupled seismic effects, subsequently influences the horizontal seismic response of such sites.
(3) The influence of seawater on the seismic response of the seabed is mainly characterized by the suppression of high-frequency seismic responses, which is related to the P-wave resonance frequency of seawater. On the other hand, the low-frequency amplification phenomenon observed at the seabed surface is attributed to the seismic-induced dynamic water pressure in seawater. The seismic wave propagation response within the seabed site is influenced by a combination of factors, including seawater effects and the distribution of soft sediment layers in the seabed.
(4) The impact of seawater on the seismic motion of the seabed site is mainly pronounced in the shallow sediment layers (< 50 m), where the vertical seismic response of the seabed site significantly decreases. The influence of seawater causes the mean curves of horizontal and vertical acceleration β spectra to exceed the values of the onshore design response spectra, respectively, within the corresponding periods of 0.75 s - 1.5 s and 0.1 s - 0.15 s. Therefore, the adverse effects of seawater on seismic resistance of marine engineering should be taken into consideration.
(5) The inhibitory effect of seawater on the seismic motion at the seabed surface and the frequency response phenomenon of ‘high-frequency suppression, low-frequency amplification’ in seismic response are positively correlated with the depth of seawater.
Data availability statement
The raw data supporting the conclusions of this article will be made available by the authors, without undue reservation.
Ethics statement
Ethical approval was not required for the studies involving humans because this study does not involve ethics. The studies were conducted in accordance with the local legislation and institutional requirements. The participants provided their written informed consent to participate in this study.
Author contributions
H-FF: Validation, Writing – original draft, Writing – review & editing. Y-ZW: Methodology, Writing – review & editing. G-XC: Methodology, Resources, Writing – review & editing. W-YC: Validation, Writing – review & editing. KZ: Conceptualization, Methodology, Supervision, Validation, Writing – review & editing. S-DZ: Funding acquisition, Resources, Writing – review & editing.
Funding
This work is supported by the National Natural Science Foundation of China under grant no 51978334.
Conflict of interest
Author Sheng-Dong Zhu is employed by Fujian Yongfu Power Engineering Co., Ltd.
The remaining authors declare that the research was conducted in the absence of any commercial or financial relationships that could be construed as a potential conflict of interest.
Publisher’s note
All claims expressed in this article are solely those of the authors and do not necessarily represent those of their affiliated organizations, or those of the publisher, the editors and the reviewers. Any product that may be evaluated in this article, or claim that may be made by its manufacturer, is not guaranteed or endorsed by the publisher.
References
Adhikary S., Singh Y. (2019). Effect of site amplification on inelastic seismic response. Earthquake Eng. Eng. Vibration 18, 535–554. doi: 10.1007/s11803-019-0520-y
Airy G. B. (1993). On the intensity of light in the neighbourhood of a caustic (from Transactions of the Cambridge Philosophical Society 1838). SPIE MILESTONE Ser. MS 89, 298–298.
Boore D. M. (1999). Basin waves on a seafloor recording of the 1990 Upland, California, earthquake: Implications for ground motions from a larger earthquake. Bull. Seismol. Soc. Am. 89 (1), 317–324. doi: 10.1785/BSSA0890010317
Boore D. M., Bommer J. J. (2005). Processing of strong-motion accelerograms: needs, options and consequences. Soil Dyn. Earthq. Eng. 25 (2), 93–115. doi: 10.1016/j.soildyn.2004.10.007
Boore D. M., Smith C. E. (1999). Analysis of earthquake recordings obtained from the Seafloor Earthquake Measurement System (SEMS) instruments deployed off the coast of southern California. Bull. Seismol. Soc. Am. 89 (1), 260–274. doi: 10.1785/BSSA0890010260
Chen G., Gaoxu X., Yanzhen W., Dandan J. (2022). One-dimensional nonlinear seismic response analysis for seabed site effect asessment in the Qiongzhou Starit. Eng. Mech. 39 (5), 75–850. doi: 10.6052/j.issn.1000-4750.2021.03.0167
Chen G., Jiefa D., Yi F., Yanju P., Li X. (2020). Investigation of seismic site classification scheme. Rock Soil Mechanics 41 (11), 3509–3522. doi: 10.16285/j.rsm.2020.0154
Chen G., Jin D., Zhu J., Shi J., Li X. (2015). Nonlinear analysis on seismic site response of Fuzhou Basin, China. Bull. Seismol. Soc. Am. 105 (2A), 928–949. doi: 10.1785/0120140085
Chen B., Wang D., Chen S., Hu S. (2021). Influence of site factors on offshore ground motions: observed results and numerical simulation. Soil Dyn. Earthq. Eng. 145, 106729. doi: 10.1016/j.soildyn.2021.106729
Chen B., Wang D., Li H., Sun Z., Shi Y. (2015). Characteristics of earthquake ground motion on the seafloor. J. Earthq. Eng. 19 (6), 874–904. doi: 10.1080/13632469.2015.1006344
Chen B., Wang B., Ma Z., Du Y., Li C. (2023). Influence of seawater depth on offshore ground motion characteristics and seismic responses of sea-crossing cable-stayed bridges. Ocean Eng. 280, 114853. doi: 10.1016/j.oceaneng.2023.114853
Chen G., Wang Y., Zhao D., Zhao K., Yang J. (2021). A new effective stress method for nonlinear site response analyses. Earthq. Eng. Struct. Dyn. 50 (6), 1595–1611. doi: 10.1002/eqe.3414
Chen W., Lü Z., Xu L., Ruan B.B., Ma J., Chen G. (2021). Seismic reponse of subsea tunnels considering seawater seabed coupling effect. J. Eng. Geol. 29 (06), 1878–1886. doi: 10.13544/j.cnki.jeg.2021-0562
Diao H., Hu J., Xie L. (2014). Effect of seawater on incident plane P and SV waves at ocean bottom and engineering characteristics of offshore ground motion records off the coast of southern California, USA. Earthq. Eng. Eng. Vib. 13, 181–194. doi: 10.1007/s11803-014-0222-4
Falcone G., Romagnoli G., Naso G., Mori F., Peronace E., Moscatelli M. (2020). Effect of bedrock stiffness and thickness on numerical simulation of seismic site response. Italian case studies. Soil Dyn. Earthq. Eng. 139, 106361. doi: 10.1016/j.soildyn.2020.106361
Guoxing C., Su C., Xi Z., Xiuli D., Chengzhi Q. I., Zhihua W. (2015). Shaking-table tests and numerical simulations on a subway structure in soft soil. Soil Dyn. Earthq. Eng. 76, 13–28. doi: 10.1016/j.soildyn.2014.12.012
Hu J., Tan J., Zhao J. X. (2020). New GMPEs for the Sagami Bay region in Japan for moderate magnitude events with emphasis on differences on site amplifications at the Seafloor and land seismic stations of K-NET. Bull. Seismol. Soc. Am. 110 (5), 2577–2597. doi: 10.1785/0120190305
Jeng D. S., Ye J. H., Zhang J. S., Liu P. F. (2013). An integrated model for the wave-induced seabed response around marine structures: Model verifications and applications. Coast. Eng. 72, 1–19. doi: 10.1016/j.coastaleng.2012.08.006
Karimzadeh S., Kadas K., Askan A., Yakut A. (2021). Comparison of real and simulated records using ground motion intensity measures. Soil Dyn. Earthq. Eng. 147, 106796. doi: 10.1016/j.soildyn.2021.106796
Li C., Hao H., Li H., Bi K. (2015). Theoretical modeling and numerical simulation of seismic motions at seafloor. Soil Dyn. Earthq. Eng. 77, 220–225. doi: 10.1016/j.soildyn.2015.05.016
Liu Y., Guoxing C., Mengyun K. (2013). Seismic response of undersea tunnels to hydrodynamic and hydrostatic pressures. Chin. J. Geotech. Eng. 35 (zk2), 357–362.
Nakamura Y. (2019). What is the nakamura method? Seismol. Res. Lett. 90 (4), 1437–1443. doi: 10.1785/0220180376
Nolen-Hoeksema S., Morrow J. (1991). A prospective study of depression and posttraumatic stress symptoms after a natural disaster: the 1989 Loma Prieta Earthquake. J. Pers. Soc. Psychol. 61 (1), 115–121. doi: 10.1037/0022-3514.61.1.115
Nosov M. A., Kolesov S. V. (2007). Elastic oscillations of water column in the 2003 Tokachi-oki tsunami source: in-situ measurements and 3-D numerical modelling. Nat. Hazards Earth Syst. Sci. 7 (2), 243–249. doi: 10.5194/nhess-7-243-2007
Sun T., Guoxing C., Enquan Z., Li X. (2012). Experimental research on the dynamic shear modulus and the damping ratio of deep-seabed marine silty clay. China civil Eng. J. 45 (S1), 9–14.
Sun T., Guoxing C., Enquan Z., Li X. (2013). Experimental study on dynamic shear modulus ratio and damping ratio of marine soils in Qiongzhou Strait with depth less than 100m. Chin. J. Geotech. Eng. 35 (S2), 375–382.
Tan J., Hu J. (2023). Offshore ground motion characteristics on the horizontal PGA, spectral acceleration, frequency content and significant duration from the 2021 Mw 7.1 and 2022 Mw 7.4 offshore earthquakes near the Japan Trench area. Soil Dyn. Earthq. Eng. 164, 107646. doi: 10.1016/j.soildyn.2022.107646
Tanaka Y. (2000). The 1995 great Hanshin Earthquake and liquefaction damages at reclaimed lands in Kobe Port. Int. J. Offshore Polar Eng. 10 (01).
Wang Y., Dingfeng Z., Guoxing C., Ke L. (2021). A new nonlinear effective stress method for one-dimensional seismic site response analysis and its validation. Chin. J. Geotech. Eng. 43 (3), 502–510. doi: 10.11779/CJGE202103013
Wang Y., Hongfei F., Kai Z., Guoxing C., Zhijie J. (2023). 2D nonlinear seismic response characteristics of a strait site with deep inhomogeneous soil deposits. Chin. J. Geotech. Eng. 1–11. Available at: http://kns.cnki.net/kcms/detail/32.1124.tu.20230531.1659.004.html.
Keywords: seabed site, bidirectional seismic excitation, nonlinear seismic response, fluid-solid weak coupling model, soil nonlinearity
Citation: Fan H-F, Wang Y-Z, Chen G-X, Chen W-Y, Zhao K and Zhu S-D (2023) Nonlinear seismic response analysis of layered seabed considering seawater-seabed coupling effects. Front. Mar. Sci. 10:1270721. doi: 10.3389/fmars.2023.1270721
Received: 01 August 2023; Accepted: 30 August 2023;
Published: 18 September 2023.
Edited by:
Xingsen Guo, University College London, United KingdomReviewed by:
Luqi Wang, Chongqing University, ChinaHiroyuki Matsumoto, Japan Agency for Marine-Earth Science and Technology (JAMSTEC), Japan
Copyright © 2023 Fan, Wang, Chen, Chen, Zhao and Zhu. This is an open-access article distributed under the terms of the Creative Commons Attribution License (CC BY). The use, distribution or reproduction in other forums is permitted, provided the original author(s) and the copyright owner(s) are credited and that the original publication in this journal is cited, in accordance with accepted academic practice. No use, distribution or reproduction is permitted which does not comply with these terms.
*Correspondence: Yan-Zhen Wang, c29sZWRhZHdhbmdAMTYzLmNvbQ==
 Hong-Fei Fan
 Yan-Zhen Wang
 Guo-Xing Chen1,2