 Yadi Zhou
 Hu Wang
 Yuru Yan2
- 1School of Marine Science and Technology, Tianjin University, Tianjin, China
- 2Observation and Research Station of East China Coastal Zone, Ministry of Natural Resources, Nantong, China
Coastal bedrock islands sea areas have a unique natural environment, frequent human activities, and complex sedimentary dynamic processes. In this paper, we select the Chudao Island sea area off the coast of Shandong Peninsula, China, as a typical research area to investigate the sediment transport trends and influencing factors by means of high-precision bathymetric survey, high-density sediment sampling, grain-size trend analysis and hydrodynamic numerical modeling. Results and analysis indicate that the grain size parameters including mean grain-size, sorting coefficient and skewness are zonal distributed, roughly parallel to the isobaths. While the overall sediment transport trend is from island shore to sea, with several convergence centers near the loop centers of bottom flow and at the edge of the agriculture area. The near-bottom flow velocity is primary factor that controlling the significance of sediment transport trend, while the flow decides the general patterns of sediment transport trend and sediment distribution. Submarine topography can either directly transport sediments down its slope, or indirectly affect the direction of sediment transport by constraining the near-bottom flow from shallow to deep waters. Besides the natural factors of bottom flow and submarine topography, human activities represented by aquaculture also affect the sediment transport trend in coastal bedrock island sea areas. First, the increased sedimentation rate caused by organic matters and the diffusion of scallop fragments may cause sediment coarsening. Second, the artificial aquaculture facilities can reduce flow velocity and therefore hinder the initiation, suspension and transport of sediment near the aquaculture areas. Our methods and findings provide high-resolution details to insight into the sediment transport trends to improve the understanding of the modern sediment dynamics in small-scale coastal bedrock island sea areas and provide reference for corresponding engineering and agriculture activities.
1 Introduction
The bedrock coast, which is mainly composed of rocks, takes up nearly 75% of the world’s coast (Rosser et al., 2005). The length of bedrock coast, 5,000 km, also accounts for about 30% of the total coastline of China (Wang and Aubrey, 1987). The bedrock coast, which is characterized by steep topography, interlaced headlands and bays, and various erosion and accumulation landforms, develops many famous deep-water harbors. Bedrock islands, which usually develop adjacent to bedrock coasts, are widely distributed in China’s coasts, e.g., Liaodong Peninsula, Shandong Peninsula, and the coast south of Hangzhou Bay, accounting for about 90% of the total islands of China. In this study, we focus on the sea areas adjacent to bedrock coasts and with bedrock islands therein. These sea areas not only are typical regions of strong land-sea interaction due to its complex submarine topography and its variable hydrodynamic and sediment dynamics (French and Burningham, 2009), but also have severe interaction between the nature marine environment and human activities resulting from an increasing coastal engineering and marine aquaculture.
Marine sediments are the loose substances deposited at the bottom of seawater over the basement rock (Singer, 1984). The distribution, thickness, type and property of sediments are complex and changeable due to various water depth, seabed topography, hydrodynamics, physical and chemical properties of sea water, and marine biological activities. Sediments, which may have strong interactions with ocean hydrodynamics such as waves, tides, storm surges, and currents, can be initiated, suspended, deposited, and transported, and thus in turn shape and change the topography of seafloor. The calculation of sediment transport rate is essential to marine sedimentary dynamics (Bakhtyar et al., 2009), among which the research ideas can be mainly classified into two categories. The first investigates sediment transport and source-sink characteristics through the inherent properties of sediments such as grain size, magnetism, mineral components, etc., in which sediment sampling and corresponding analysis are applied (Andrews et al., 2010; Wang et al., 2019; Yu et al., 2019b). The second approach believes that sediment transport is mainly caused by the hydrodynamic-induced incipient motion and suspension of sediment, through which the characteristics and trends of sediment transport are mainly investigated based on numerical models of hydrodynamics and sediment dynamics (Yu et al., 2019b). Sediment transport trend, which is a stable transport trend of sediments formed under the long-term action of various factors including hydrodynamics, provenance, biological activities, contains important information for interpreting the evolution of sedimentary environment, sediment dynamic process and material migration.
Particle size, also known as grain size, which represents the size of sediment particles, are one of the main parameters of sediment. McCave (1978) defined the plane difference of grain size parameters as grain-size trend. In order to extract the grain-size trend information, McLaren (1981) and McLaren and Bowles (1985) developed a one-dimensional model and concluded that the sediment transport trends were related to the spatial variation of grain size parameters of mean grain-size, sorting coefficient and skewness. Gao and Collins (1991; 1992) proposed a two-dimensional grain size trend analysis (GSTA) model based on McLaren model. Since then, more scholars have successively developed improved models based on GSTA. For example, Le Roux (1994) used a modified vector analysis procedure to determine the transmission vectors, while Le Roux and Rojas (2007) used the gradient between the central site and surrounding sites to define vector magnitudes, and considered kurtosis together with mean grain-size, sorting coefficient, and skewness for the first time. Moreover, Chang et al. (2001) improved the average length test method, while Poizot et al. (2008) used the geostatistical method to determine the characteristic distance of sampling sites. Poizot and Mear (2010) developed GisedTrend, a GSTA plugin of the QGIS project that considering the effect of obstacles (natural or artificial) in computing vector fields. GSTA has been widely used in various marine sedimentary environments such as estuaries (Duc et al., 2007; Yu et al., 2019a; Chu et al., 2020), coasts (Pedreros et al., 1996; Wang et al., 2012; Kawakami et al., 2021; Sinha et al., 2021), bays (Jia et al., 2003; Sánchez and Carriquiry, 2011; Zheng et al., 2016), and continental shelves (Vanwesenbeeck and Lanckneus, 2000; Balsinha et al., 2014; Gao and Collins, 2014). However, due to the limitation of sediment sampling density, to the authors’ knowledge, this method has rarely been used for high-resolution insight into the sediment transport trends in small scale sea areas, especially in coastal bedrock island sea areas with more complex topography, sediment sources, hydrodynamics, and human activities.
The specific way to explore sediment transport is to embed sediment dynamic module into ocean numerical model. The sediment dynamic process, which is mainly influenced by the incipient motion, suspension, transport and deposition, has long been studied by means of field observations, model tests, and corresponding theoretical and numerical models (Wang et al., 2018). These kinds of studies, for example, sediment transport along the Amazon continental shelf (Molinas et al., 2020), the suspension transport of river-influent sediments in the Bohai Sea, Yellow Sea and East China Sea (Zeng et al., 2015), and the origin of muddy sediment areas in the Yellow Sea Trough and the Okinawa Trough (Bian et al., 2013), usually focus on large-scale and long-term sediment transport. The numerical models, which have the characteristics of multiple assumption and simplification, numerous model parameters, and some values of model parameters are difficult to determine, are mainly concerned with the large space-scale and long time-scale seawater movement and sediment transport. In the meanwhile, the physical process of the sediment movement module is quite complex in shallow water sea area, especially in bedrock island sea areas. Therefore, the above-mentioned models are inadequate to explore the details of sediment transport in small space scale coastal sea areas.
In this paper, we select the Chudao Island sea area off the coast of Shandong Peninsula, China, as a typical research area, to give deep insight into the sediment transport trends and its influencing factors of small space scale bedrock island sea areas based on high-precision bathymetric survey, high-density sediment sampling, grain-size trend analysis and hydrodynamic numerical modeling. Through which we hope to improve the understanding of the modern sediment dynamic process of coastal bedrock island sea area and provide reference for corresponding engineering and aquatic activities.
2 Materials and methods
2.1 Study area
The study area, as the national shallow sea comprehensive test site of China (Li et al., 2017), is located in the Yellow Sea, north of the coast of Weihai, with Chudao Island at the southern side (Figure 1). Chudao Island is a 0.82 km long and 0.21 km wide bedrock island 3.7 km from the coastline of Shandong peninsula, which is surrounded with rugged coastline and steep bank slope. The average water depth is 30 to 60 m, and presents a generally high-low-high topography from south to north. An east-west directional trench, which is about 2.5 km long and 1 km wide, with maximum water depth 70 m (Zhang et al., 2020a), locates in the north of Chudao Island.
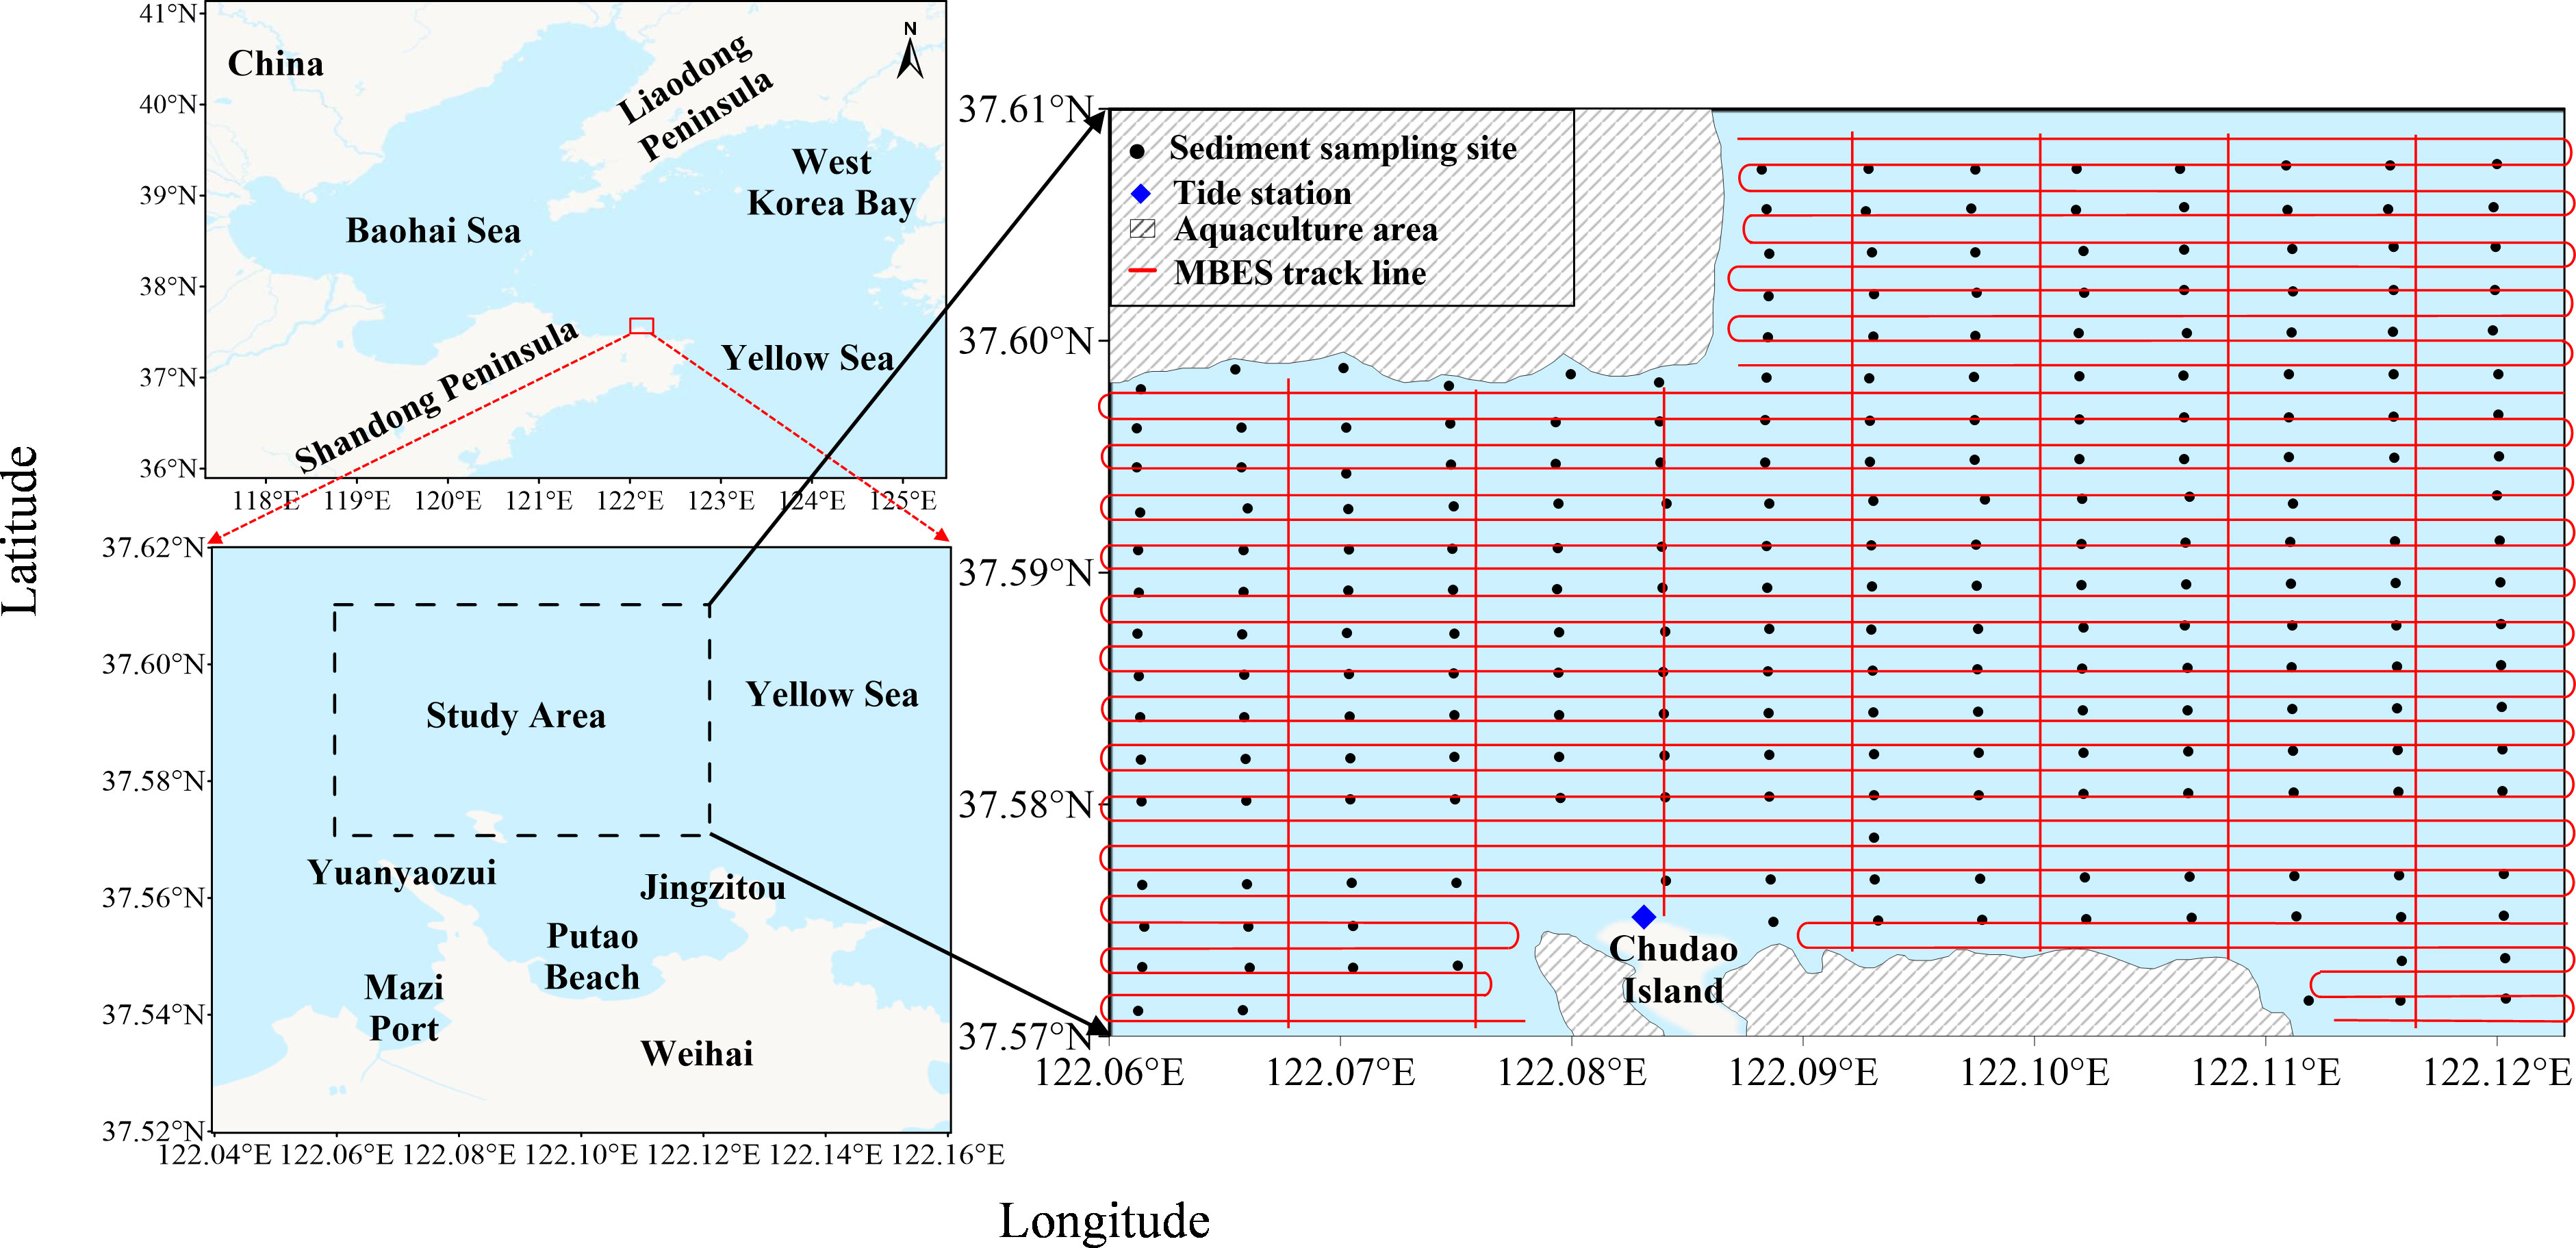
Figure 1 Map of the Chudao Island sea area with sediment sampling sites (black dots), tide station (blue lozenge), aquaculture areas (the area filled by black slashes) and multi-beam echo sounder (MBES) track lines (red lines).
The hydrodynamic in the study area was characterized by the irregular semidiurnal tide and east-west reciprocating flow (Bi et al., 2019). The tide difference has a maximum value of 3.08 m and a mean value of 1.73 m. The northward and eastward wave account for about 58.5% and 37% of the total (Han et al., 2020).
Kelp and scallop raft aquaculture occupy large areas in the northwest of the study area and small areas on the east and west sides of Chudao Island (Figure 1). The breeding cycle of kelp is generally from November to May or June of the following year, which takes up more than half of the whole year. The length of kelp can grow to 4 to 5 m when it is harvested in June and July. The scallop species, Chlamys farreri, which have a shell height of 6 to 7 cm and a shell length of about 7 cm at maturity, is mainly breeding from May to November.
2.2 Field work and laboratory analysis
Fieldwork including small spacing sediment sampling and full-coverage bathymetry survey were carried out in November and December 2018, through which the grain size parameter data obtained by laboratory grain-size analysis are used for sediment trend analysis, while the bathymetry data are used to explore the effects of seabed topography on sediment transport trends. A total of 229 surface sediment samples were collected, with grid of 250 m × 500 m (Figure 1), sampling thickness between 20~30 cm, using a clam sampler (type DDC1-2, volume 0.025 m², Beijing Jinyang Wanda Technology Co., Ltd.). The navigation and positioning were executed by Global Navigation Satellite System (H32, plane positioning accuracy ± 8 + 1×10⁻⁶ D, Guangzhou Hi-Target Satellite Navigation Technology Co., Ltd.). The positions were measured twice during sediment sampling process, with one when the vessel arrived at the planned station and the other when the sampler reached the seabed. Repeated sampling was performed if the mass of the sample was less than 300 g. The sea conditions are calm during the sampling period, neither high waves nor strong winds had been recorded in Novermber and the beginning of December of 2018.
The collected sediment samples were brought to the laboratory for grain-size analysis using sieving-densitometer method. For a sediment sample, the part of grain size less than 0.075 mm is used by densitometer method, and the part of grain size larger than 0.075 mm is used by sieving method. The specific steps of the test are referred to Standard for geotechnical testing method (Standard of P. R. China, GB/T 50123-2019, 2019). The mean grain-size, sorting coefficient and skewness were calculated based on the grain size distribution curve as follows (Folk and Ward, 1957):
where Mz, σi, and Ski are the mean grain-size, sorting coefficient and skewness, with φ5, φ16, φ50, φ84, φ95 the grain size corresponding to the cumulative percentage content of 5%, 16%, 50%, 84% and 95%.
Full-coverage bathymetry survey was carried out by a multi-beam echo sounder system (R2 SONIC 2024, R2Sonic Limited Liability Company, USA) with operating frequency 400 kHz, range resolution 1.25 cm and sector angle of 120°~140°. A total of 36 main survey lines with line spacing 100 m and 7 check lines perpendicular to the main survey line were carried out. Global Navigation Satellite System (H32), fiber optic gyrocompass and motion sensor (Octans III, iXSea Ltd., France), sound velocity profiler (MiniSVP, Valeport Ltd., UK) and automatic water gauge (DCX-25PVDF, Druckmesstechnik AG, Switzerland) were applied accordingly to obtain the positioning, attitude, sound velocity profile and sea level data. The CARIS HIPS and SIPS (V10.1, Teledyne Technologies Incorporated, Canada) software were used to process the MBES data to get the water depth and topography of the study area.
2.3 Grain-size trend analysis
McLaren and Bowles (1985) found that there were two cases for the net sediment transport trends, that is, Case 1: finer, better sorted and more negatively skewed; Case2: coarser, better sorted and more positively skewed. GSTA was provided by Gao and Collins (1991) based on McLaren’s model. The first step of GSTA is to define trend vectors for a grid of sampling sites by comparing the grain size parameters of each sample site with its neighbors in any direction. A characteristic distance (Dcr) is specified to identify whether the sites are adjacent. If either a Case 1 or a Case 2 trend is identified between the two sites, a dimensionless trend vector of unit length is defined for two neighboring sites. For each sampling site, there may be more than one unit-length vector.
Then, the trend vectors at each sampling site are obtained by composing the multi-vectors into a single vector:
where n is the number of trend vectors identified for the site, is a trend vector, and is the sum of the trend vectors. Finally, an averaging procedure is applied to remove noise included in the vectors at each site, as:
where is a summed trend vector obtained on the basis of eq. (4) at a neighboring site, and K is the total number of such sites. The vectors can be defined as transport vectors to describe the main sediment transport pathways. Since the sampling sites are regular and uniform with a rectangular grid of 250 m × 500 m, the characteristic distance Dcr is set as 250 m.
2.4 Hydrodynamic analysis
Tidal currents and waves are the main factors controlling sediment transport in coastal waters (George et al., 2018). The sediment grain-size trend is mainly formed under the long-term reciprocating action of periodic tidal currents rather than the random changeable waves (Armstrong et al., 2022). Therefore, this study focuses on the simulation of tidal currents.
The Coastal and Regional Ocean Community model (CROCO) is a three-dimensional nonlinear baroclinic primitive equation model based on the Regional Ocean Modeling System (ROMS) (Huang et al., 2021), which can simulate multiple-scale sea water movement. In the CROCO model, a time-splitting method is used to generate two different time steps, in which the short time steps is used to advance the surface elevation and barotropic momentum, while a large time step is used for tracers and baroclinic momentum. The curvilinear orthogonal coordinate system and Arakawa C staggered grid are adopted in the horizontal direction to increase the resolution of the specific area, while the S coordinate system is used in the vertical direction to improve the resolution at the thermocline and the bottom boundary layer.
The horizontal resolution of the model is 1/1200°, while the vertical water column is meshed into 6 levels. The shoreline with resolution 1′ is from the Global Self-consistent Hierarchical High-resolution Shorelines (GSHHS) provided by the National Geophysical Data Center (NGDC) of U.S. The topography with resolution 1′ is from the Gridded Global Relief Data Collection (ETOPO1) with resolution 1′ provided by NGDC. The initial temperature and salinity data are from the World Ocean Atlas 2009 (WOA09) published by NGDC. The open boundary is forced by ten tidal constituents including M2, S2, N2, K2, K1, O1, P1, Q1, Mf, and Mm, in which the harmonic constants are obtained from the Oregon State University Tidal Inversion Software (OTIS). The short time step and the large time step are set as 2 and 120 s, respectively. The model is operated normally after it is integrated forward to a stable state, with the duration covering the whole year of 2018 that consistent with time of the sediment sampling.
3 Results
3.1 Topography features
As shown in Figure 2, the water depth of the study area is mainly between 25.0 m and 60.0 m, with an average of 36.7 m and a maximum of 70 m. The seafloor is rugged in the north of the island, while the water depth drastically increases to more than 60.0 m at an east-west trench north of the island. The trench has dense isobaths and steep slope around it, among which the slope is steeper in the north-south direction with a maximum 5.2° than that in the east-west direction. The water depth gradually becomes shallow north of the trench, forming the flattest area within the study area.
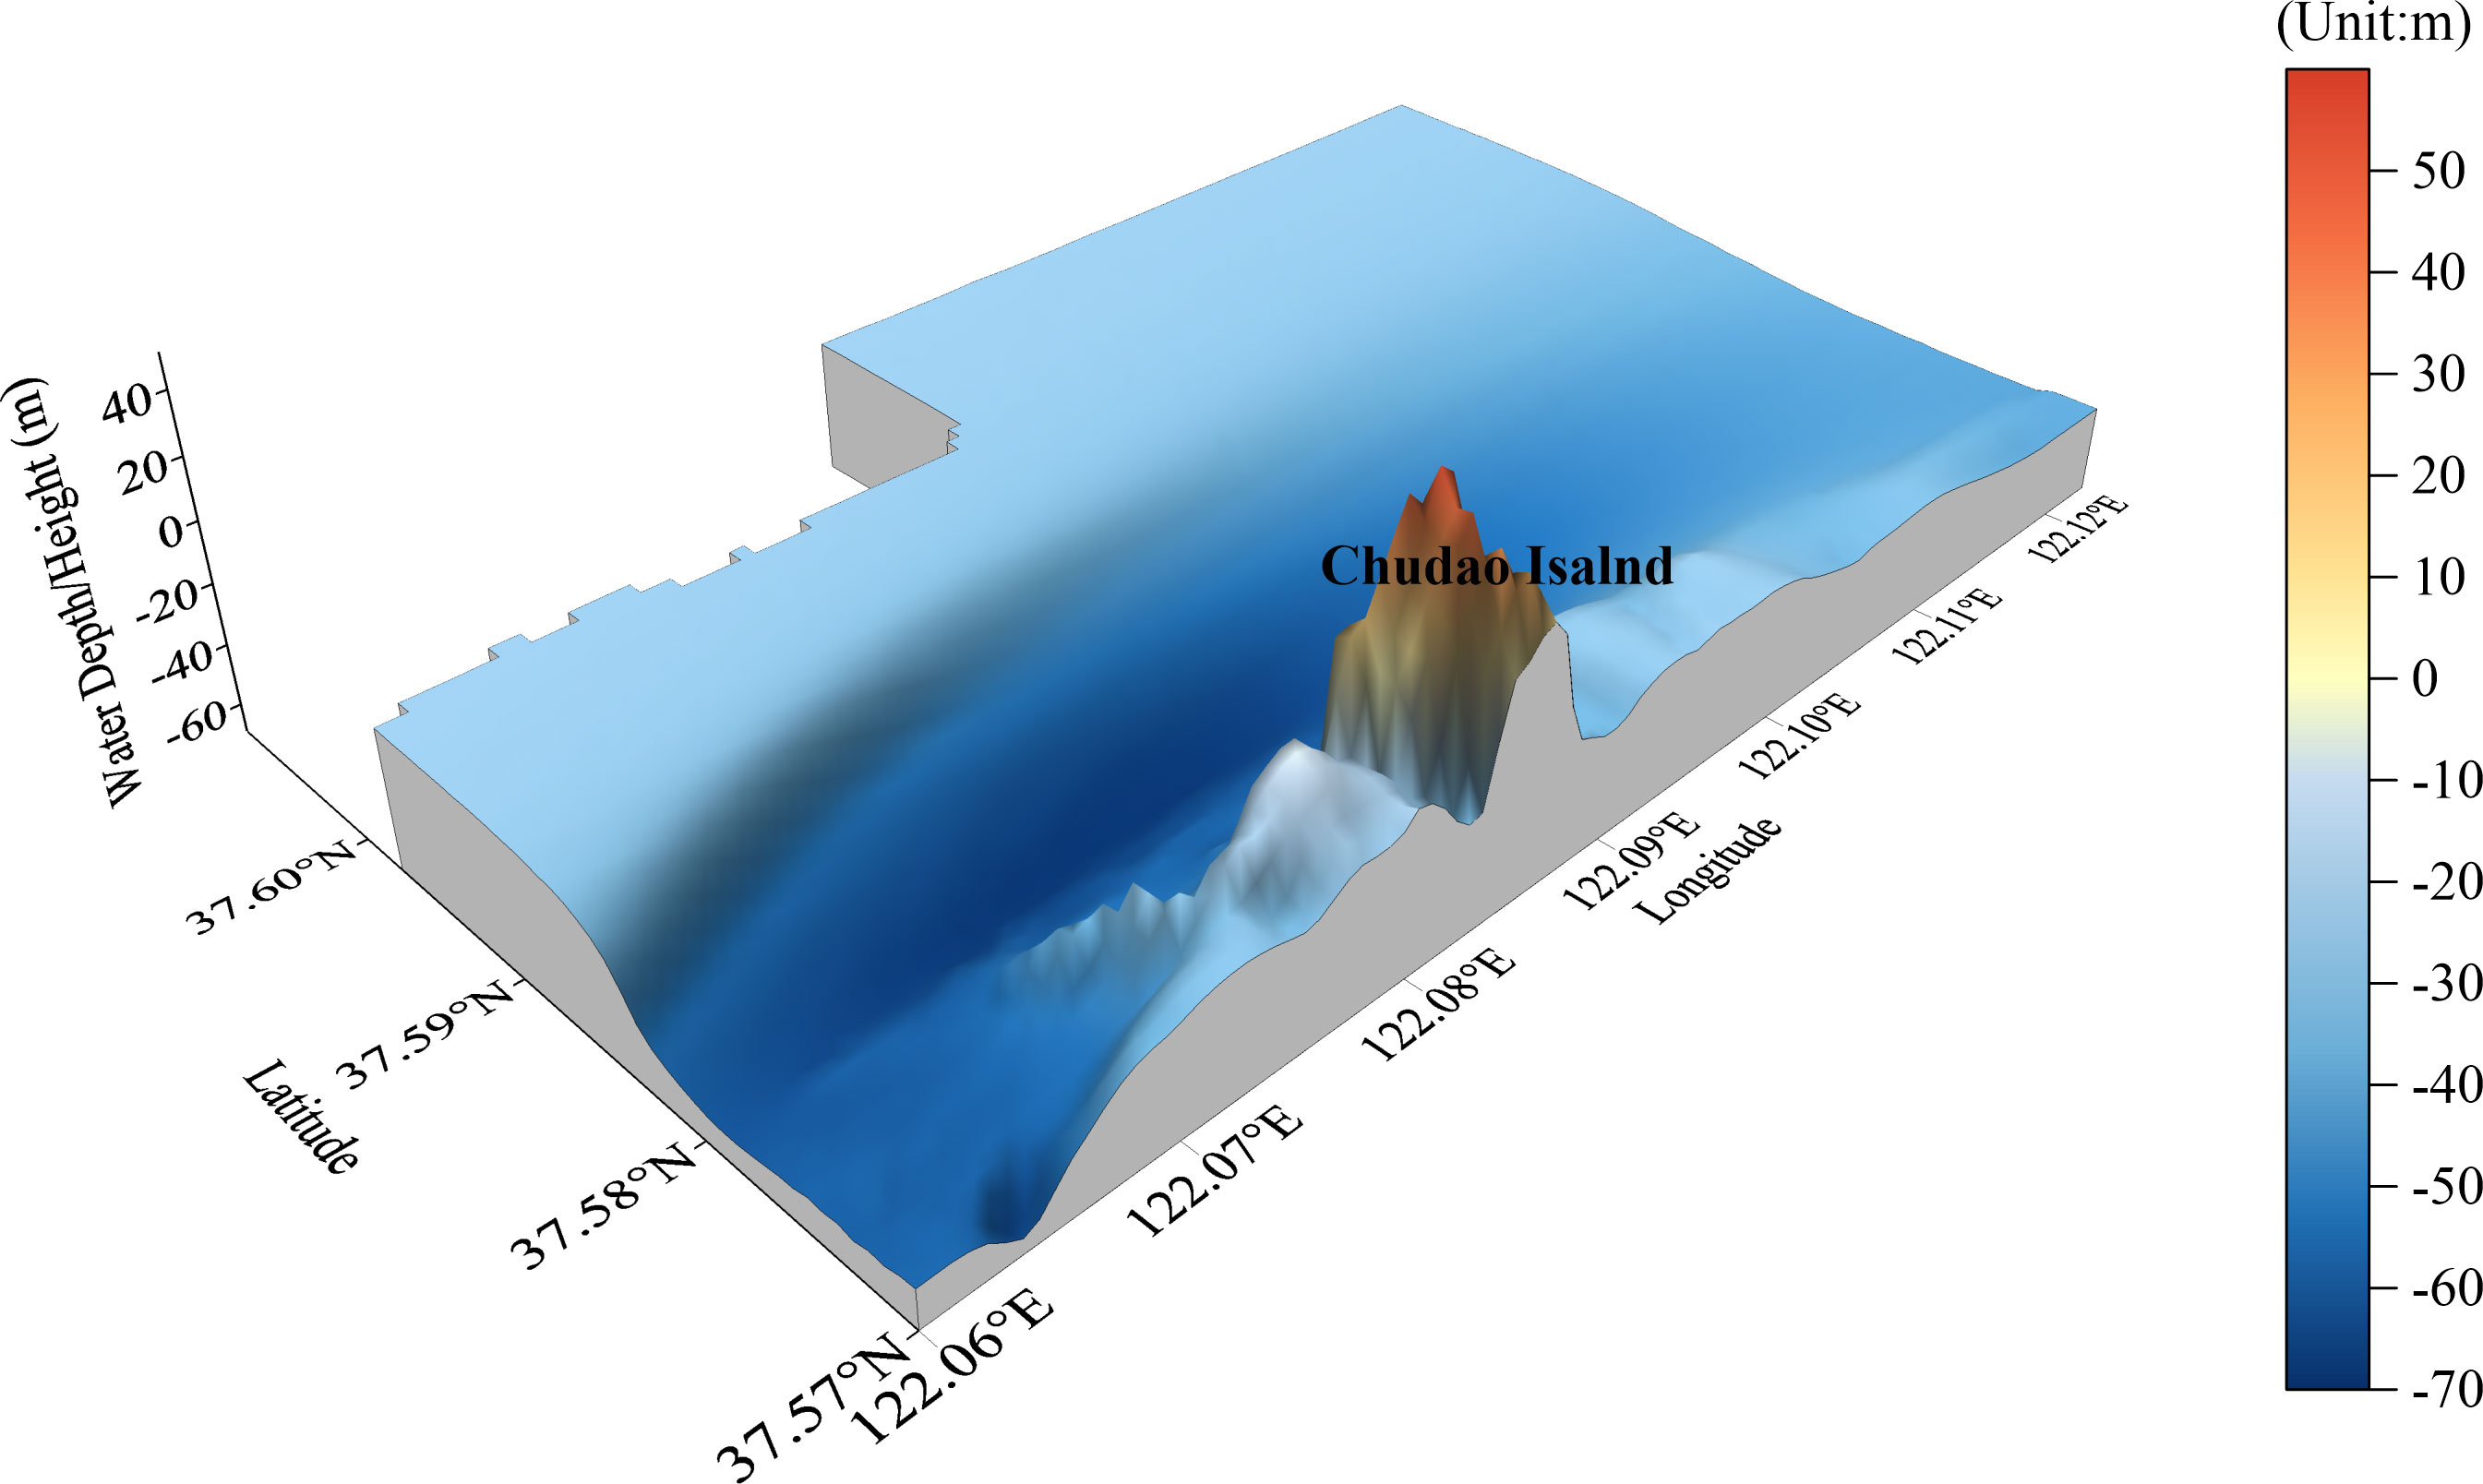
Figure 2 The three-dimensional topographic map of the study area.
3.2 Sediment distribution and grain size characteristics
The continuous distribution of Mz σi, Ski, which are obtained by interpolating the parameters of discrete point with a kriging method (Oliver and Webster, 1990). The mean grain-size Mz, which is mainly affected by material supply, transport capacity, and the depositional environment, can directly reflect the size of the sediment particle and the strength of hydrodynamics of the environment (Visher, 1969). The sorting coefficient σi, which represents the uniformity of sediment, is also an indicator of hydrodynamics and sediment transport trend. The skewness Ski describes the degree of symmetry of sediment grain size distribution. As shown in Figure 3, the surficial sediments are mainly muddy silt, with mean grain-size 4.9~6.2 φ, average value 5.03 φ and maximum value 0.79 φ (Figure 3A). The sorting coefficient σi ranges from 0.014 to 2.206 with an average value of 0.077, most of which are excellent (Figure 3B). The skewness Ski shows a decrease pattern from south to the north, from island to sea, with all positive skew ranging from 0.07 to 0.97 (Figure 3C). Generally, the three grain size parameters show an obvious feature of zonal distribution. The area with larger Mz (<2 φ), poor sorting, and strong positive Ski concentrates around the bedrock island, where rocks and gravels are common seen from the samples. While to the north, Mz gradually transitions to a broad northern area with φ=5, σi becomes better away from the island, and Ski decreases to minimum.
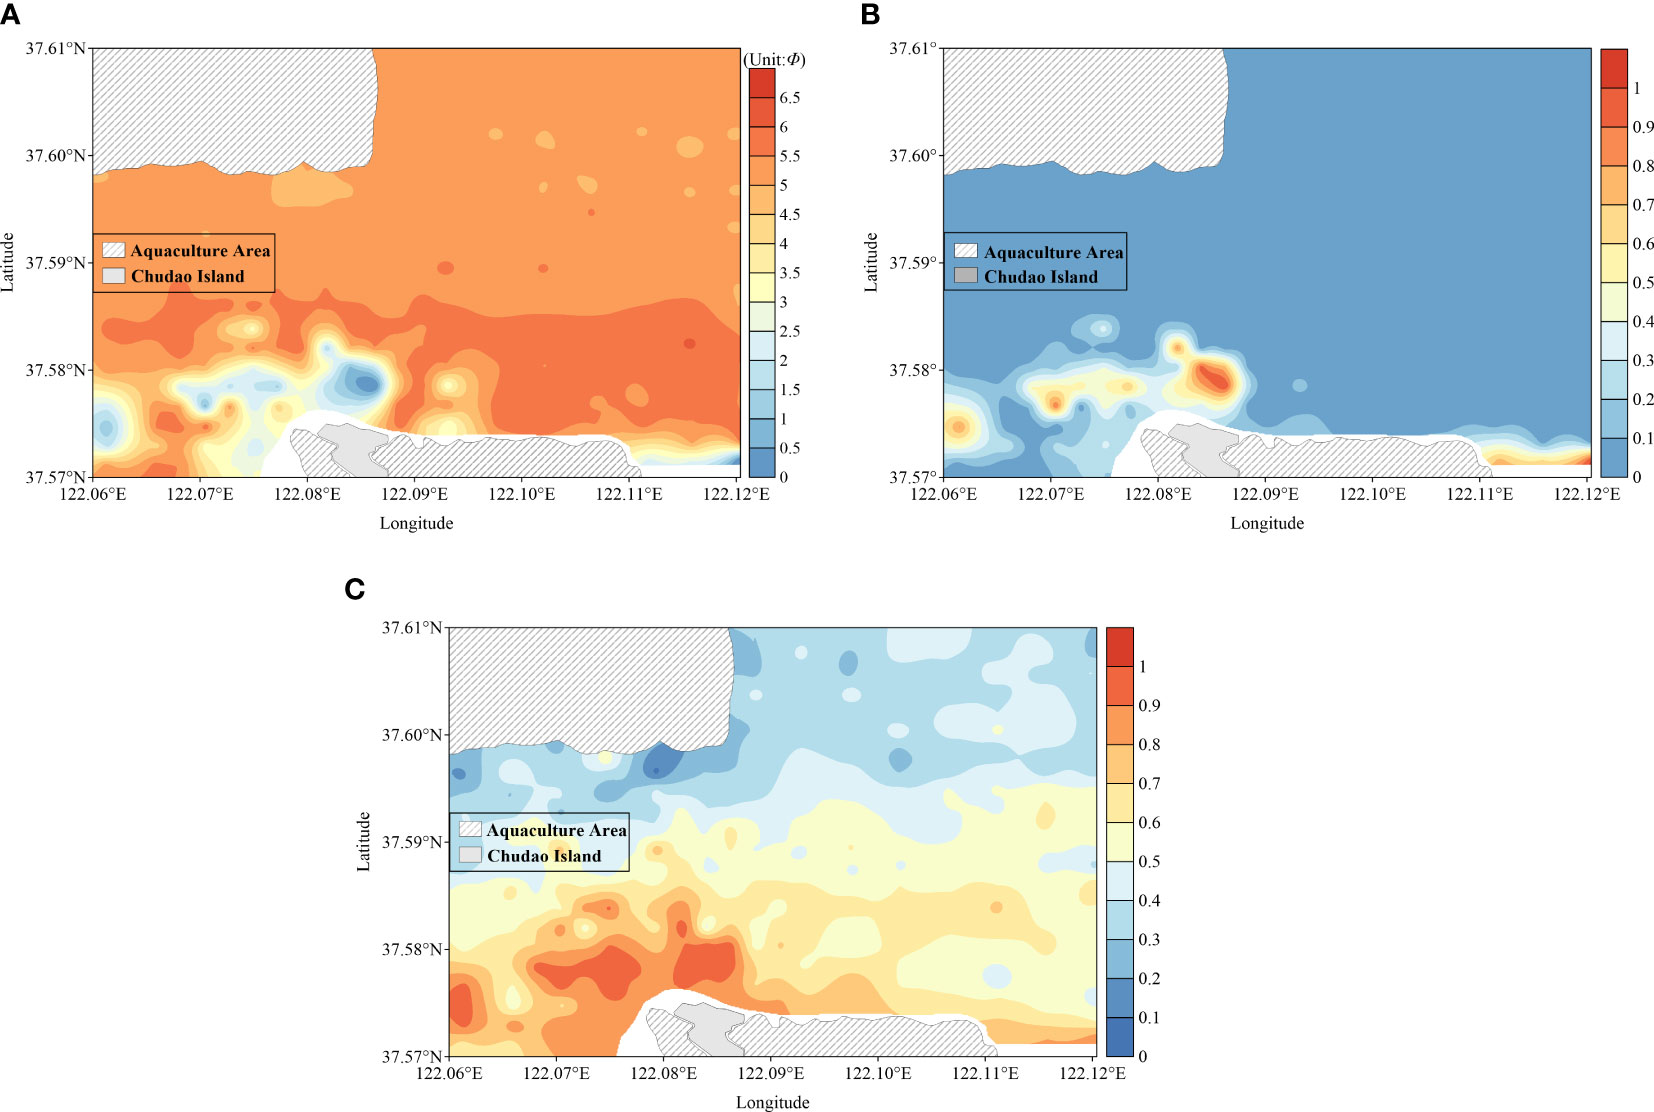
Figure 3 Spatial distribution of mean grain-size (A), sorting coefficient (B), Skewness (C).
3.3 Sediment grain-size trends
In Figure 4, the vector direction represents the net sediment transport direction, while the vector length represents the significance of the grain-size trend.
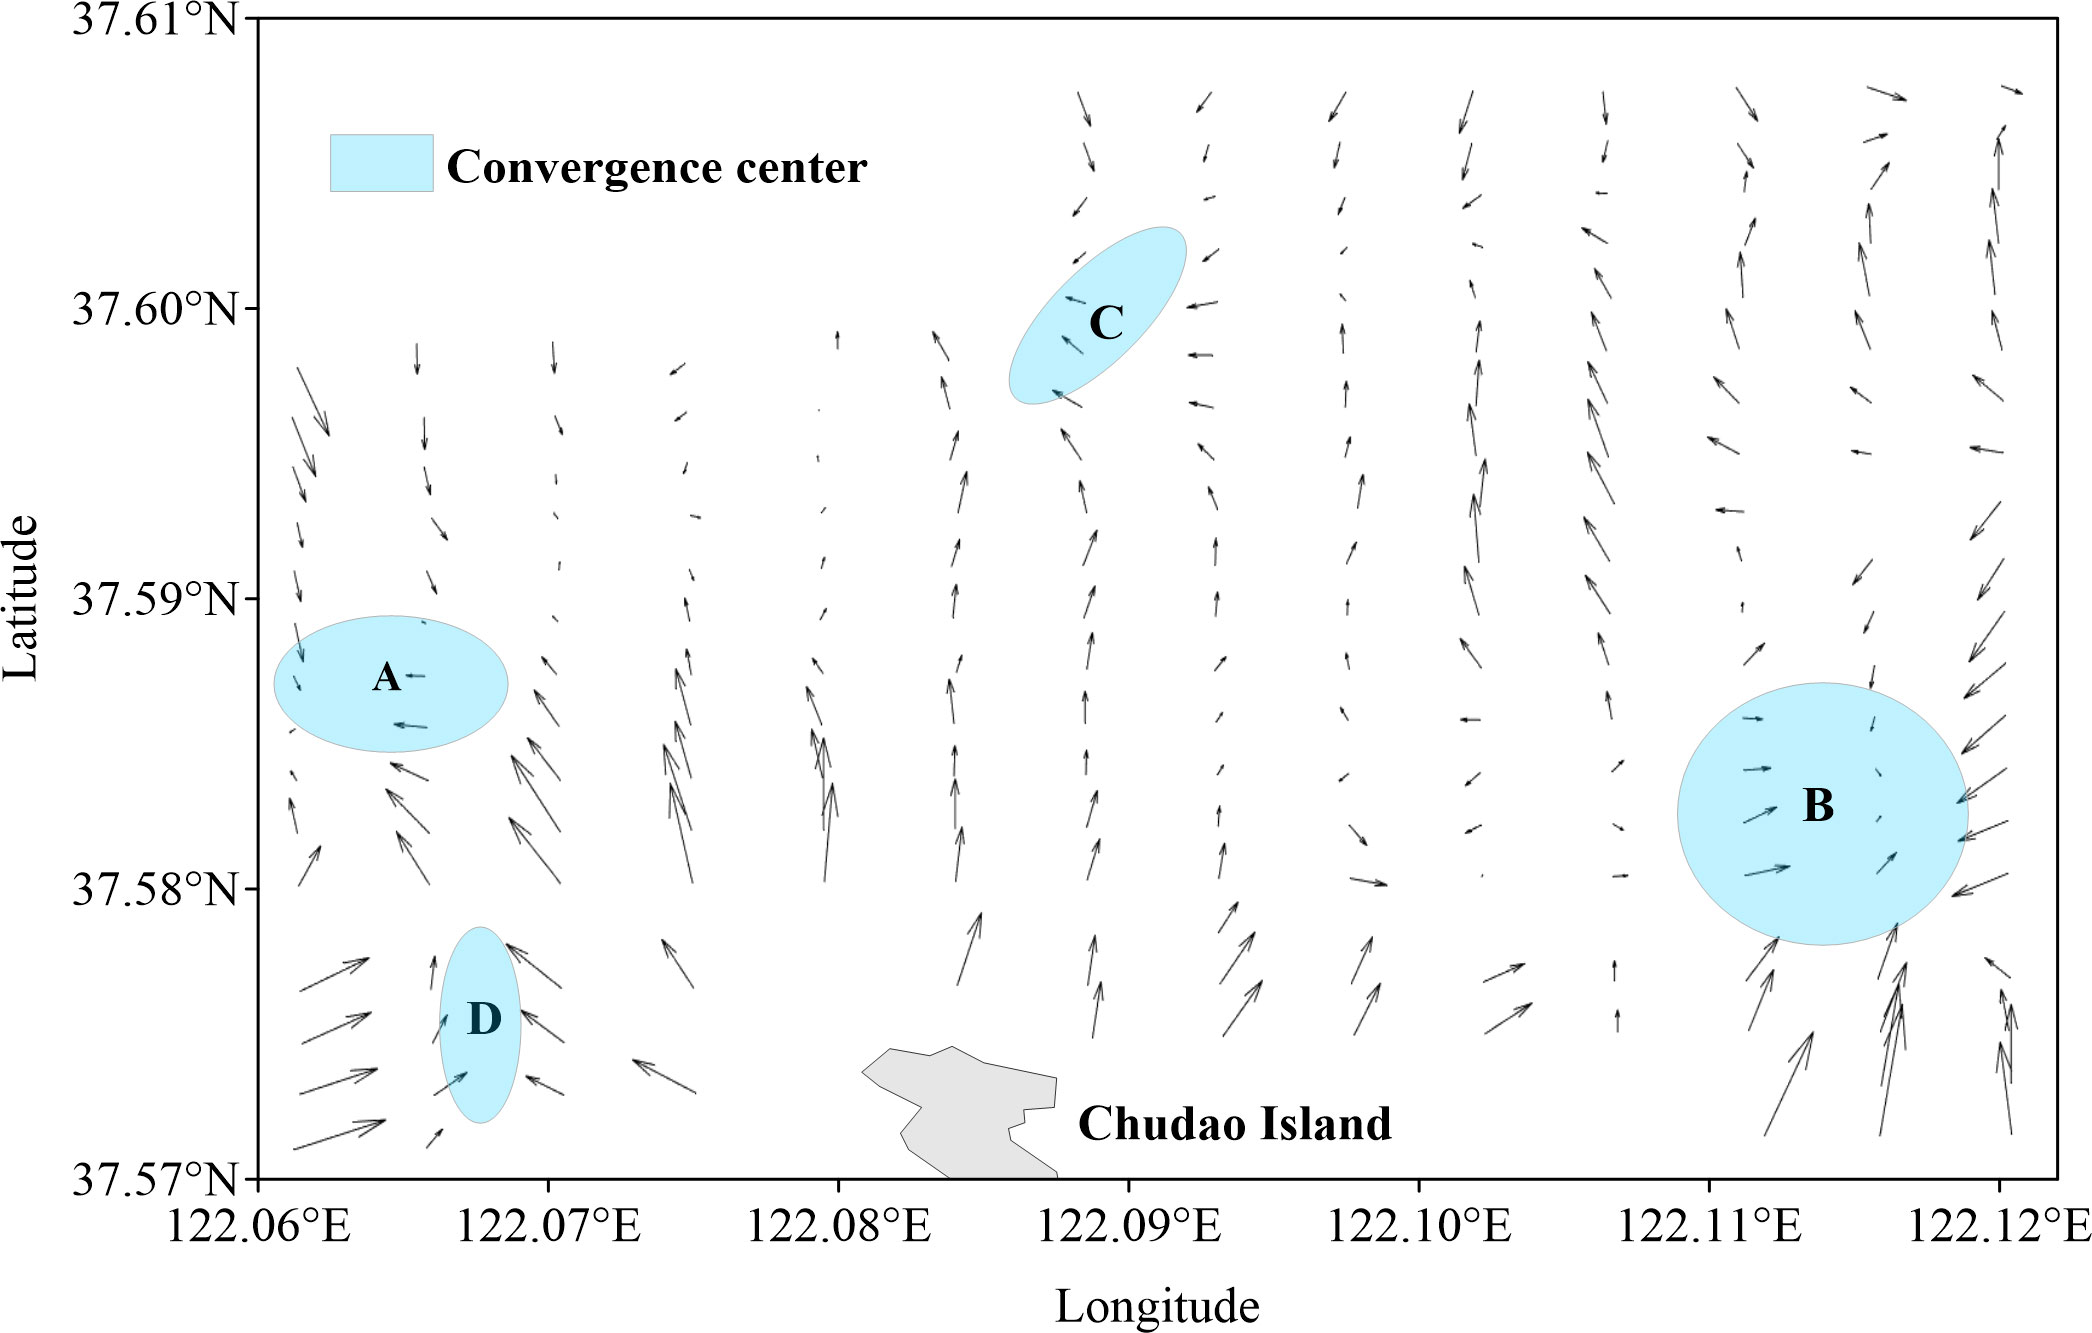
Figure 4 Sediment grain size trends calculated by Gao-Collins grain size trend analysis (GSTA) model.
Despite the southward transport trend of small areas in the northwest and northeast, the overall sediment transport trend of the study area is from island shore to sea and from south to north. In addition, there are four convergence centers in the study area and show different transport patterns. The transport trend is more significant on the southern side than that on the northern side of A and B (Figure 4), indicating a clear shore-to-sea transport trend at the east and west of the Chudao Island. A counterclockwise sediment transport trend at C is discovered although C is located at the edge of the study area and the edge effect caused by the lack of information may affect the accuracy of the results. An inconspicuous sediment convergence center D locates at the west of the Chudao Island, where eastward and westward vectors meet.
3.4 Near-bottom flow field
Since the erosion, transport and deposition of sediments are most closely related to the near-bottom flow velocity, the flow velocity of the bottommost layer (the sixth layer) in the model is particularly exported from the CROCO model to characterize the hydrodynamic factors. Figure 5 shows the comparison of tidal level simulated by numerical model and the value observed by the Chudao tide station (with location illustrated in Figure 1), in which the time is from November 11 to December 1, 2018 including an astronomical tide. As can be seen that not only the calculated tide level variation trend but also its values are in good agreement with the observed ones. The correlation coefficient (R2) of the simulated and observed tide level is 98.42% (Figure 6), which proves the reliability of the presented model.
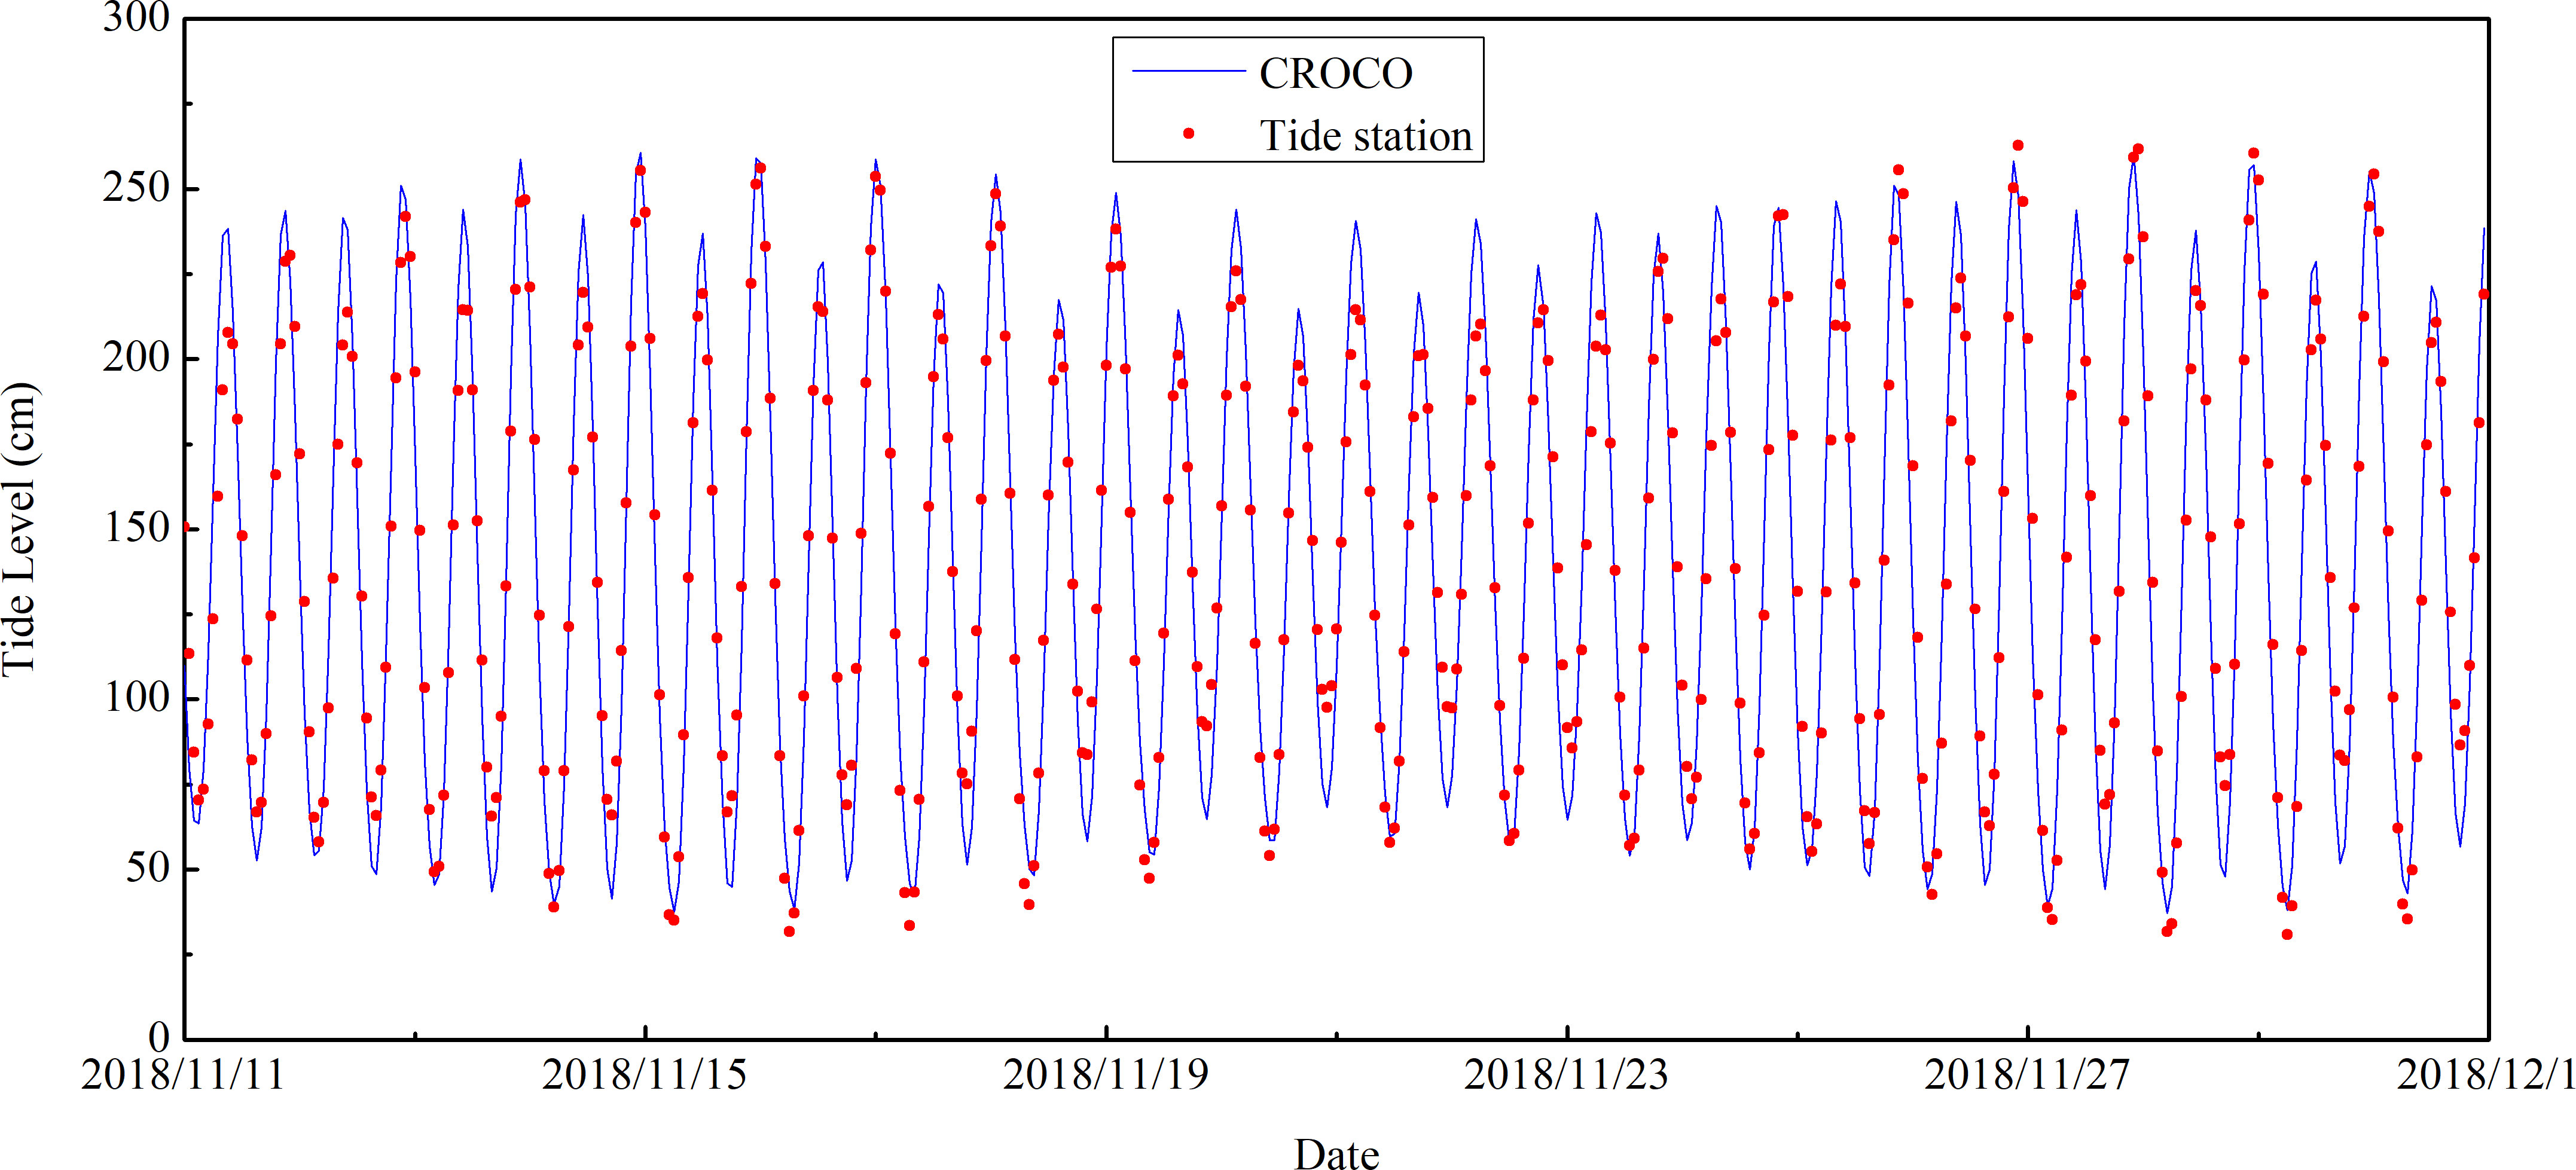
Figure 5 Comparison between the simulated and observed tide fluctuation.
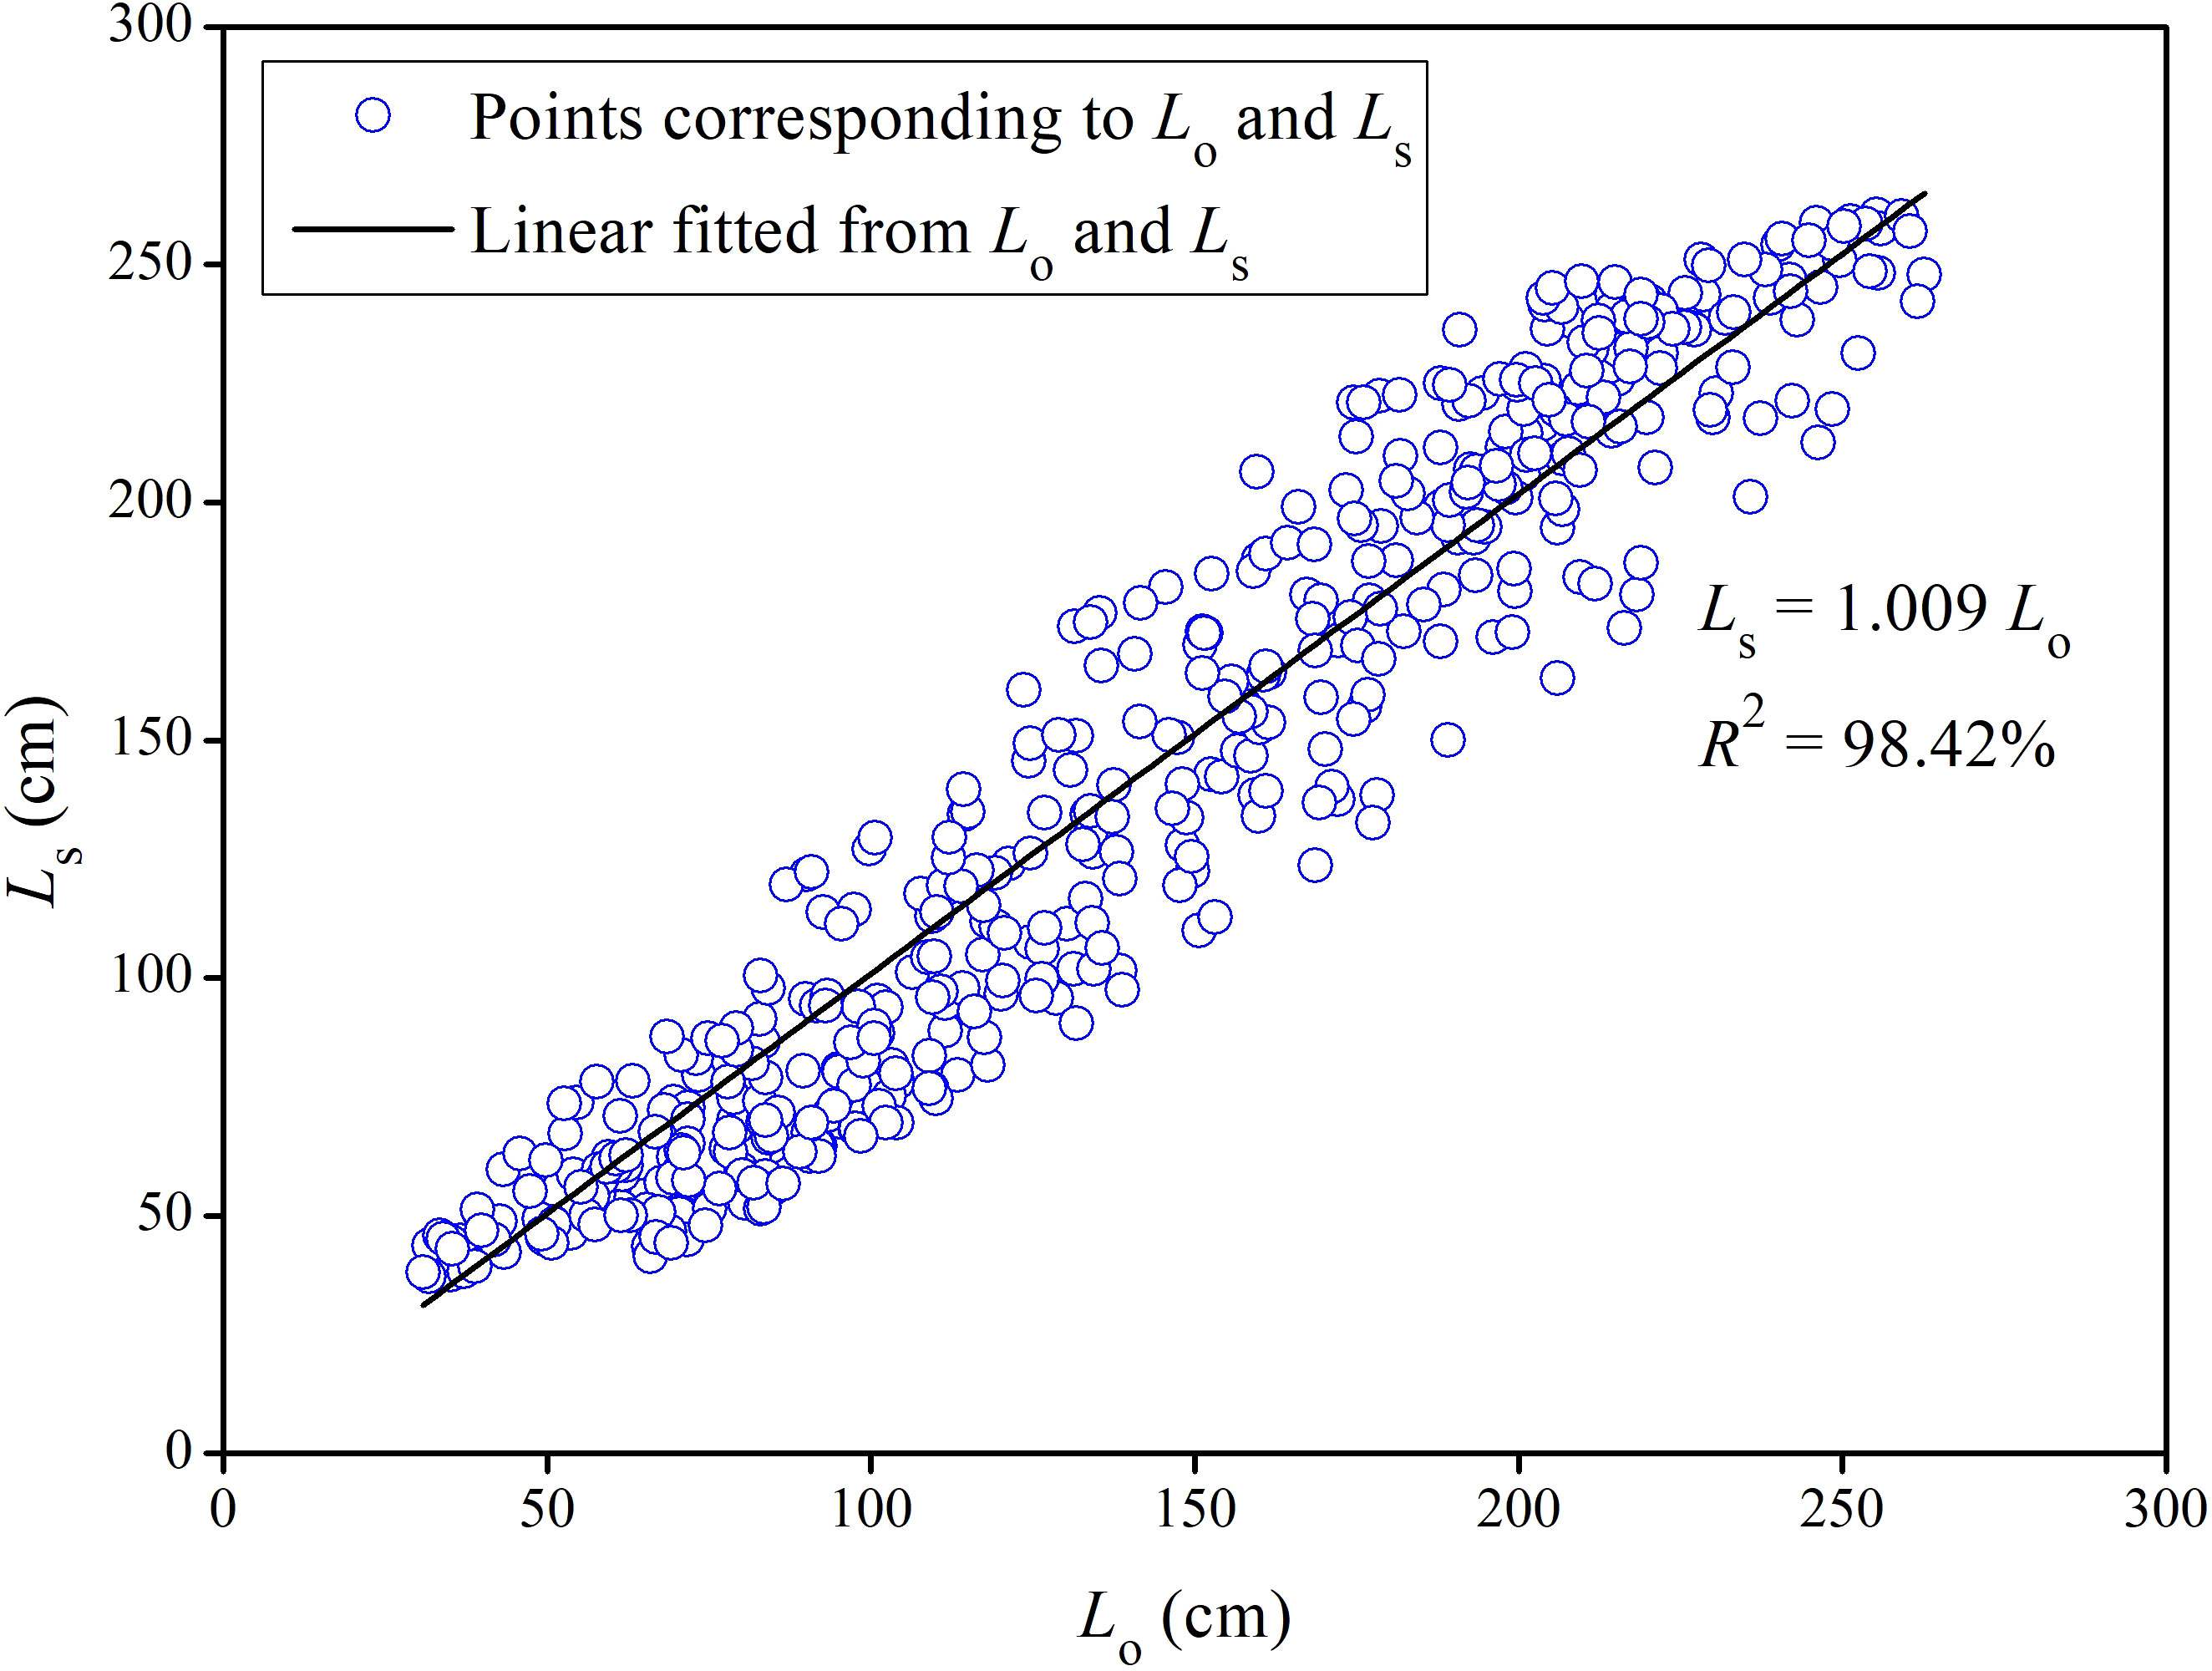
Figure 6 The correlation between the simulated and observed tide level (Ls refers to tide level simulated by CROCO; Lo refers to tide level observed by tide station; R2 refers to the correlation coefficient).
4 Discussion
4.1 Influence of near-bottom flow field on sediment transport trends
The overall sediment transport trend in the study area, that is, from the island shore to the sea (Figure 4), is generally consistent with the direction of annual-averaged near-bottom flow (Figure 7). The disturbance of seabed caused by near-bottom water flow is the direct driving force of sediment transport (Gardner et al., 2004; Du et al., 2021), so the direction and velocity of near-bottom flow correspond well with the direction and the significance of sediment transport trends (Gunsolus and Binns, 2018). The locations of the two bottom flow loops at the east and west of the study area (Figure 7) corresponds well with the convergence centers of grain-size trend A and B (Figure 4), indicating that the flow direction controls the direction of sediment transport. Moreover, the average bottom velocity (0.149 m/s) in the west of the study area is greater than that (0.136 m/s) in the east (Figure 7). Correspondingly, the sediment transport trend in the west of the study area is also more significant than that in the east (Figure 4), indicating the controlling effect of flow velocity on the potential quantity of sediment transport. However, it should also be noted that the sediment convergence centers A and B deviate slightly from the positions of the two loops. The convergence center C is located at the junction of the east-west loop, with northwestward flow on its west side and northeastward flow on its east side, which is not completely consistent with the sediment transport directions of west-northwestward on the west side and southwestward on the northeast side. What is more, the bottom flow loop on the east side of Chudao Island does not form a sediment convergence center. This demonstrates that the sediment transport trend may also be influenced by other factors besides the near-bottom flow field.
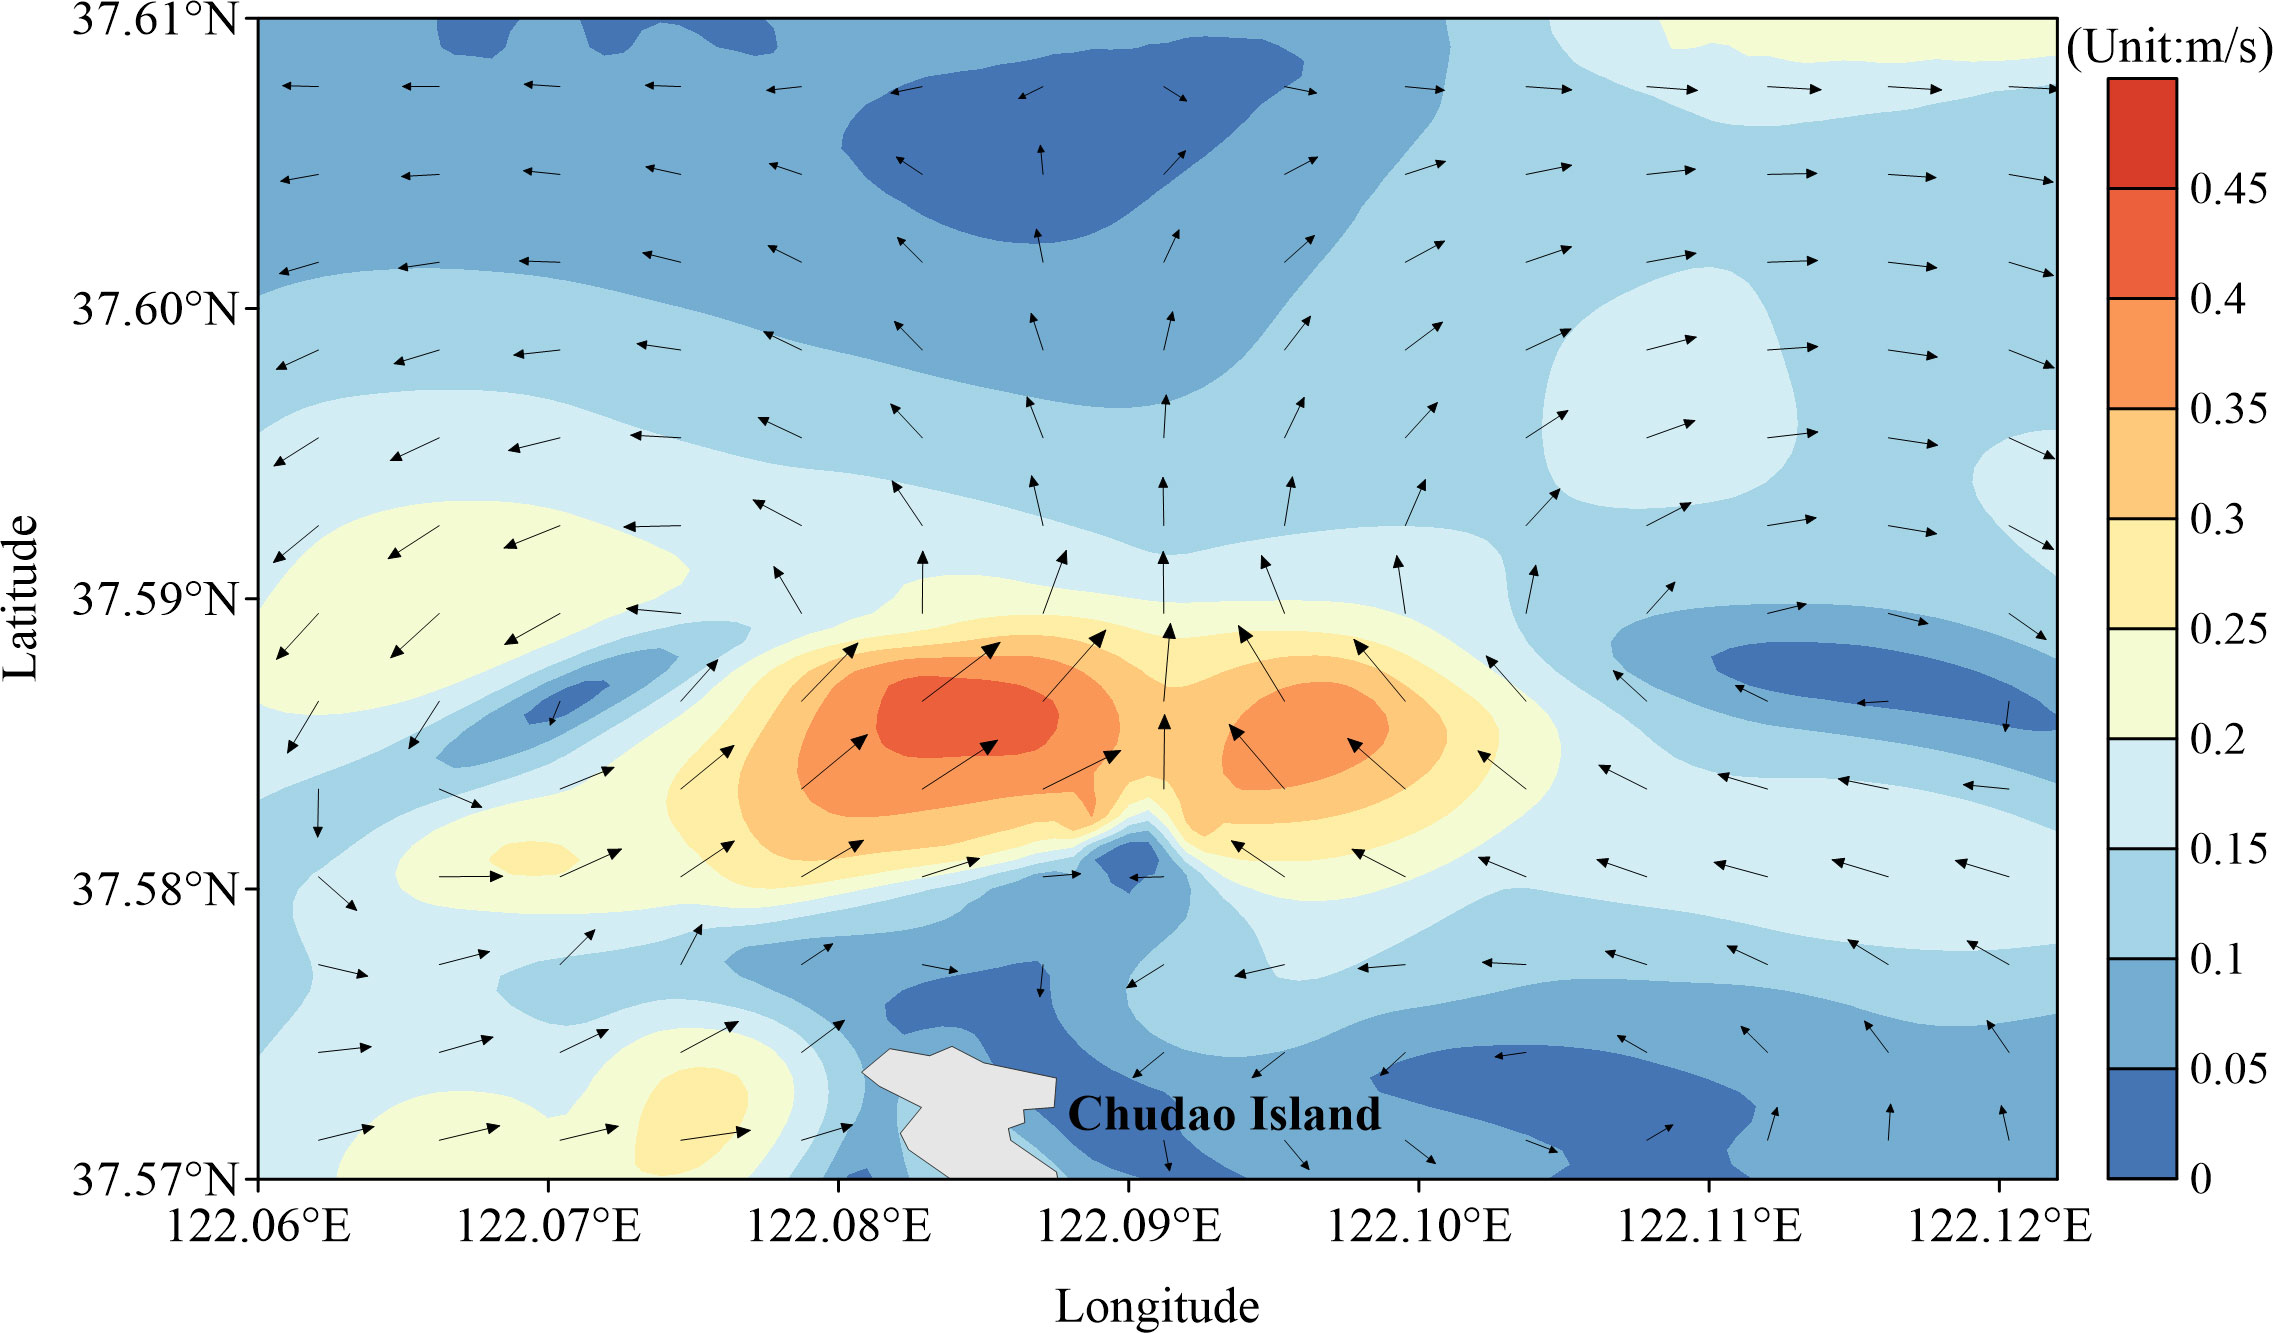
Figure 7 Annual average near-bottom flow field simulated by CROCO. The direction of the vector indicates the flow direction, the length of the vector and the contours represent the flow velocity.
The hydrodynamic conditions are weak as the average bottom flow velocity of the entire study area is only about 0.1 m/s (Figure 7). The fine-grained sediments are brought from nearshore to offshore areas by the weak bottom currents, most of which are settled in the trench valley, while the coarse-grained sediments are left nearshore. Therefore, the sediment in the southern part of the study area is coarse-grained, while the sediment located in the trench north of Chudao Island is finer-grained. The coarser sediment size in the north of the trench is because the weak bottom flow cannot drive the nearshore fine-grained sediment over the steep slope. This is consistent with the mean grain-size of sediment from south to north showing a “coarse-fine-coarse” striped distribution presented in Figure 3A.
To summarize, the near-bottom flow field is the primary factor that controlling the sediment transport trend in coastal bedrock islands sea area. The greater the bottom flow velocity is, the more obvious the sediment transport trend is. The direction of bottom flow decides the general patterns of sediment transport although small deviations may exist in specific areas. Besides, sediment transport impacted by the near-bottom flow field shapes the sediment distribution characteristics in coastal bedrock islands sea area.
4.2 Influence of submarine topography on sediment transport trends
The submarine topography is varied in the study area with steep slope around the Chudao island, then deep trench connected with flat plain from south to north (Figure 2). The near-bottom current basically points in the direction from shallow to deep waters. The general sediment transport trend is from the southern island shore and the northern flat area to the trench, which is consistent with the topography from shallow to deep. In fact, bottom flow (Figure 7), which indicates the sediment transport direction, is also influenced by the topography, because the local flow field is usually constrained by submarine topography and tends to flow from shallow to deep water areas. The existing distribution characteristics of sediment grain size parameters are the result of long-term sediment transport. The mean grain-size, sorting coefficient and skewness (Figure 3) in the study area are zonal distributed, roughly parallel to the isobaths (Figure 2), which also indicates the controlling effect of submarine topography on the long-term sediment transport trend. In addition, the sediment convergence center A (Figure 4) is not coincided with the center of the bottom flow loop, however, it locates northwest of the loop center where densest isobaths and most dramatic topography changes exist. This indicates that rapid decline of seafloor topography can cause certain amount of sediment to be transported down the slope. Actually, previous researches have revealed that the surficial sediment would slowly move down along the seabed slope due to its own gravity (Eschard, 2001; Hsiung and Yu, 2013), the steeper the slope is, the faster and the larger volume of sediments would transport on a long-term scale. It can also be seen that (Figure 4), unlike the general trend of sediment transport from shore to sea, the sediment around Chudao Island is transported in all directions with the island as the center. This is because the water depth around the island decreases drastically, which leads to the sediment around the island transports in the direction of downward slope. Therefore, the main difference in sediment transport trend between coastal bedrock island sea area and traditional bedrock coast is that the presence of the island in makes itself a discrete center of sediment transport, and the sediment around the island transports seaward.
Under the influence of submarine topography, sediment in the coastal bedrock island sea areas mainly transports from shore to sea, making it difficult to silt up near shore. Due to the presence of islands, tides and waves are strongly dissipated before reaching the shoreline (Ogawa et al., 2011). In addition, the bedrock coast is resistant to erosion and has stable geological conditions. All of these conditions meet the requirements of harbor site selection, so the coastal bedrock island sea area is suitable for the construction of harbors, docks and other coastal engineering.
Thus, in the coastal bedrock island sea areas, the topography can either directly transport sediments down its slope or indirectly affect the sediment transport by constraining the near-bottom flow, making the sediment generally transports from shallow to deep waters. In the coastal bedrock island sea area, the sediment around the island is transported seaward with the island as the center, which is the main difference from the sediment transport trend of the traditional bedrock coasts.
4.3 Influence of aquaculture on sediment transport trends
Near the considerable aquaculture area (Figure 1), the mean grain-size (Figure 3A) of the sediment increase, and the near-bottom flow velocity (Figure 7), indicating that human activities such as aquaculture will also affect the sediment transport trend in coastal bedrock island sea area besides natural factors (Wood and Widdows, 2002). Aquaculture facilities including net cages and rafts is widely deployed in China coasts, particularly in bedrock island sea areas (Yu et al., 2016; Chen et al., 2018) such as our study area. However, these aquaculture facilities have certain impact on sediment transport in shallow waters even to water depth 200 m (Pawar et al., 2001; Srithongouthai and Tada, 2017; Chaves et al., 2020).
The mean grain-size becomes coarse near the aquaculture area rather than the trench (Figure 3A), which may be due to the increased sedimentation rate of organic matter induced by aquaculture-produced residual bait and feces. For example, to our common knowledge, the unidirectional eastward near-bottom flow cannot form sediment convergence center at D, however, the sediment convergence center D does exist. This is probably due to the sediment at D is fine, but the sediment east of D is coarsened by the aquaculture and west of D is also coarse, which presents the transport trend from the east and west to the convergence center. In addition, the diffusion of scallop fragments caused by water flow also contributes to the sediment coarsening near the aquaculture area, the time for sediment sampling was from November to December 2018, just when the kelp and scallops in the aquaculture area were ripe and large in size. Similarly, sediment coarsening induced by the dispersal of mussel fragments were also found in Marlborough Bay, New Zealand (Hartstein, 2005), while sedimentation rates were also increased by the mussel and kelp aquaculture activities (Walker and Grant, 2009; Liu et al., 2016). The aggregation of macroalgae and the artificial aquaculture facilities (Gaylord et al., 2007) can change the local hydrodynamics especially reduce the flow velocity to a certain extent (Rosman et al., 2007). For example, the averaged near-bottom flow on the east side of the sediment convergence center C (Figure 7) is only 0.05 m/s, which is 62% lower than that of 0.13 m/s in other surrounding areas. Similarly, the flow velocity at Sungo Bay and Heini Bay off Shandong Peninsula, China, also as bedrock island sea areas, have been observed to be reduced by 54% (Grant and Bacher, 2001) and 21% (Zhang et al., 2020b) as well due to the influence of shellfish and kelp aquaculture.
Reduced flow velocity and weakened sediment transport can exacerbate the enrichment of pollutants and eutrophication of water in aquaculture areas (Chor et al., 2022), resulting in the death of farmed scallops and fish and the frequent occurrence of algal blooms (Cui et al., 2018), harming the economic and environmental benefits. The impact of aquaculture on flow field and sediment transport can be mitigated by reducing stocking densities (Tang et al., 2017; Gretchen, 2018) and netting weights (Liu et al., 2008), allowing for the dilution of enriched pollutants and nutrient salts.
Thus, aquaculture may affect the material source, the deposition and transportation rate of sediments, and thus make influence on the sediment transport of coastal bedrock island sea area. First, the aquaculture waste and the accelerating on sedimentation rate can increase the mean grain-size of sediment. Second, the artificial aquaculture facilities would reduce the movement of seawater, slow down the flow velocity, and thus hinder the initiation, suspension of sediments, resulting in a sediment coarsening and a significant reduction of sediment transport. The accelerated sediment deposition and weakened transport can cause pollutant and nutrient enrichment, which can be mitigated by rational planning of aquaculture density and configuration of aquaculture facilities. This will enable the sustainable development of aquaculture industry while protecting the ecological environment of the coastal bedrock island sea areas.
5 Conclusions
In this paper, the Chudao Island sea area off the coast of Shandong Peninsula, China, with complex topography and aquaculture activities, was chosen to investigate sediment transport trends. Multiple methods including high-precision bathymetric survey, high-density sediment sampling, grain-size trend analysis and hydrodynamic numerical modeling were used to explore the effects of natural factors and human activities on sediment transport and give some new insights into the sediment dynamic process in the less reported small-scale bedrock island sea area. Conclusions are drawn as follows.
The grain size parameters including mean grain-size, sorting coefficient and skewness are zonal distributed, roughly parallel to the isobaths. While the overall sediment transport trend is from island shore to sea, with several convergence centers near the loop centers of bottom flow and at the edge of the agriculture area. This result is consistent with the distribution of near-bottom flow field and submarine topographic features, indicates that the validity of grain size trend analysis to small-scale coastal bedrock island sea area has been confirmed.
In coastal bedrock island sea areas, near-bottom flow field is the primary factor controlling the sediment transport trend, that is, the greater the bottom flow velocity is, the more significant the sediment transport trend is. The flow direction of bottom flow decides the general patterns of sediment transport although small deviations may exist in specific areas. Submarine topography can either directly transport sediments down its slope, or indirectly influence the direction of sediment transport by constraining the near-bottom flow field, making the sediment transport direction generally from shallow to deep waters. In the coastal bedrock island sea areas, the water depth around the island decreases drastically, leading to a divergence sediment transport trend away from the island down the slope. Besides the natural factors of bottom flow and submarine topography, human activities represented by aquaculture will also affect the sediment transport trend in coastal bedrock island sea areas. First, the increased sedimentation rate caused by organic matters and the diffusion of scallop fragments may cause sediment coarsening. Second, the artificial aquaculture facilities can reduce flow velocity and therefore hinder the initiation, suspension and transport of sediment near the aquaculture areas.
Sediment transport trend analysis like our study combined with high-precision observation and numerical modeling is appropriate to understand the sediment distribution features affected by hydrodynamic and submarine topography, nearshore sediment silting and enrichment of pollutants in aquaculture areas. Through which we will enhance the knowledge towards sediment dynamic process of coastal bedrock island sea area and providing reference for coastal engineering and agriculture activities.
Data availability statement
The datasets presented in this study can be found in online repositories. The names of the repository/repositories and accession number(s) can be found in the article/supplementary material.
Author contributions
YZ, HW, and YY contributed to Conceptualization and design of the study. HW and YZ performed the investigation. YY provided experimental materials. YZ performed the statistical analysis and data visualization, wrote the original draft of the manuscript. All authors contributed to the article and approved the submitted version.
Funding
This research is supported by the Open Fund of Observation and Research Station of East China Coastal Zone, Ministry of Natural Resources (ORSECCZ2022206) and National Natural Science Fund of China (41702307).
Conflict of interest
The authors declare that the research was conducted in the absence of any commercial or financial relationships that could be construed as a potential conflict of interest.
Publisher’s note
All claims expressed in this article are solely those of the authors and do not necessarily represent those of their affiliated organizations, or those of the publisher, the editors and the reviewers. Any product that may be evaluated in this article, or claim that may be made by its manufacturer, is not guaranteed or endorsed by the publisher.
Supplementary material
The Supplementary Material for this article can be found online at: https://www.frontiersin.org/article/10.3389/fmars.2023.1220331/full#supplementary-material
References
Andrews J. T., Jennings A. E., Coleman G. C., Eberl D. D. (2010). Holocene Variations in mineral and grain-size composition along the East Greenland glaciated margin (ca 67°–70° n): local versus long-distance sediment transport. Quat. Sci. Rev. 29 (19-20), 2619–2632. doi: 10.1016/j.quascirev.2010.06.001
Armstrong C., Howe J. A., Allen C., Watson P. (2022). Mobile bedform dynamics approaching a bedload parting site: pentland firth, northeast UK. Mar. Geology 443, 106686. doi: 10.1016/j.margeo.2021.106686
Bakhtyar R., Barry D. A., Li L., Jeng D. S., Yeganeh-Bakhtiary A. (2009). Modeling sediment transport in the swash zone: a review. Ocean Eng. 36 (9-10), 767–783. doi: 10.1016/j.oceaneng.2009.03.003
Balsinha M., Fernandes C., Oliveira A., Rodrigues A., Taborda R. (2014). Sediment transport patterns on the estremadura spur continental shelf: insights from grain-size trend analysis. J. Sea Res. 93, 28–32. doi: 10.1016/j.seares.2014.04.001
Bi C. C., Bao X. W., Ding Y., Zhang C., Wang Y., Shen B., et al. (2019). Observed characteristics of tidal currents and mean flow in the northern yellow Sea. J. Oceanol. Limnol. 37 (2), 461–473. doi: 10.1007/s00343-019-8026-z
Bian C. W., Jiang W. S., Greatbatch R. J. (2013). An exploratory model study of sediment transport sources and deposits in the bohai Sea, yellow Sea, and East China Sea. J. Geophys. Res. Oceans 118 (11), 5908–5923. doi: 10.1002/2013jc009116
Chang Y. H., Scrimshaw M. D., Lester J. N. (2001). A revised grain-size trend analysis program to define net sediment transport pathways. Comput. Geosci. 27 (1), 109–114. doi: 10.1016/s0098-3004(00)00065-0
Chaves R. C., Figueredo C. C., Boechat I. G., de Oliveira J. T. M., Gücker B. (2020). Fluorescence indices of dissolved organic matter as early warning signals of fish farming impacts in a large tropical reservoir. Ecol. Indic. 115, 106389. doi: 10.1016/j.ecolind.2020.106389
Chen M. L., Jin M., Tao P. R., Wang Z., Xie W. P., Yu X. B., et al. (2018). Assessment of microplastics derived from mariculture in xiangshan bay, China. Environ. Pollut. 242, 1146–1156. doi: 10.1016/j.envpol.2018.07.133
Chor W. K., Lai T. Y., Mathews M. M., Chiffings T., Cheng C. W., Andin V. C., et al. (2022). Spatial analysis for mariculture site selection: a case study of kukup aquaculture zones in the peninsula of Malaysia. Front. Mar. Sci. 9. doi: 10.3389/fmars.2022.888662
Chu N. Y., Yang Q. S., Liu F., Luo X. X., Cai H. Y., Yuan L. R., et al. (2020). Distribution of magnetic properties of surface sediment and its implications on sediment provenance and transport in pearl river estuary. Mar. Geol. 424, 12. doi: 10.1016/j.margeo.2020.106162
Cui L., Lu X. X., Dong Y. L., Cen J. Y., Cao R. B., Pan L., et al. (2018). Relationship between phytoplankton community succession and environmental parameters in qinhuangdao coastal areas, China: a region with recurrent brown tide outbreaks. Ecotoxicol. Environ. Saf. 159, 85–93. doi: 10.1016/j.ecoenv.2018.04.043
Du P., Sun D., Song D., Zhu D. (2021). In-situ observation of wave-induced pore water pressure in seabed silt in the Yellow River Estuary of China. J. Mar. Environ. Eng. 10 (4), 305–317.
Duc D. M., Nhuan M. T., Van Ngoi C., Nghi T., Tien D. M., van Weering T. C. E., et al. (2007). Sediment distribution and transport at the nearshore zone of the red river delta, northern Vietnam. J. Asian Earth Sci. 29 (4), 558–565. doi: 10.1016/j.jseaes.2006.03.007
Eschard R. (2001). Geological factors controlling sediment transport from platform to deep basin: a review. Mar. Pet. Geol. 18 (4), 487–490. doi: 10.1016/s0264-8172(00)00078-7
Folk R. L., Ward W. C. (1957). Brazos river bar [Texas]; a study in the significance of grain size parameters. J. Sediment. Res. 27 (1), 3–26. doi: 10.1306/74D70646-2B21-11D7-8648000102C1865D
French J., Burningham H. (2009). Coastal geomorphology: trends and challenges. Prog. Phys. Geogr. 33 (1), 117–129. doi: 10.1177/0309133309105036
Gao S., Collins M. (1991). A critique of the "McLaren method" for defining sediment transport paths. J. Sediment. Petrol. 61, 143–146. doi: 10.1306/D42676A9-2B26-11D7-8648000102C1865D
Gao S., Collins M. (1992). Net sediment transport patterns inferred from grain-size trends, based upon definition of “transport vectors”. Sediment. Geol. 81 (1-2), 47–60. doi: 10.1016/0037-0738(92)90055-V
Gao S., Collins M. B. (2014). Holocene Sedimentary systems on continental shelves. Mar. Geology 352, 268–294. doi: 10.1016/j.margeo.2014.03.021
Gardner M. H., Borer J. A., Melick J. J., Mavilla N., Dechesne M., Wagerle R. N. (2004). Stratigraphic process-response model for submarine channels and related features from studies of permian brushy canyon outcrops, West Texas. Mar. Pet. Geol. 21 (6), 779–781. doi: 10.1016/j.marpetgeo.2004.05.001
Gaylord B., Rosman J. H., Reed D. C., Koseff J. R., Fram J., MacIntyre S., et al. (2007). Spatial patterns of flow and their modification within and around a giant kelp forest. Limnol. Oceanogr. 52 (5), 1838–1852. doi: 10.4319/lo.2007.52.5.1838
George D. A., Largier J. L., Storlazzi C. D., Robart M. J., Gaylord B. (2018). Currents, waves and sediment transport around the headland of pt. dume, California. Cont. Shelf Res. 171, 63–76. doi: 10.1016/j.csr.2018.10.011
Grant J., Bacher C. (2001). A numerical model of flow modification induced by suspended aquaculture in a Chinese bay. Can. J. Fisheries Aquat. Sci. 58 (5), 1003–1011. doi: 10.1139/cjfas-58-5-1003
Gretchen G. (2018). Regional risk zonation of environmental pollution on marine and coastal zone. J. Mar. Environ. Eng. 10 (2), 97–107.
Gunsolus E. H., Binns A. D. (2018). Effect of morphologic and hydraulic factors on hysteresis of sediment transport rates in alluvial streams. River Res. Appl. 34 (2), 183–192. doi: 10.1002/rra.3184
Han L. S., Wang J., Gao J., Wang X., Wu H. (2020). Analysis of wave energy resources in northern waters of chudao island in Shandong province. Acta Energiae Solaris Sin. 41 (2), 7. doi: 10.19912/j.0254-0096.2020.02.024
Hartstein N. D. (2005). Acoustical and sedimentological characterization of substrates in and around sheltered and open-ocean mussel aquaculture sites and its bearing on the dispersal of mussel debris. IEEE J. Oceanic Eng. 30 (1), 85–94. doi: 10.1109/joe.2004.841388
Hsiung K. H., Yu H. S. (2013). Sediment dispersal system in the Taiwan-south China Sea collision zone along a convergent margin: a comparison with the Papua new Guinea collision zone of the western Solomon Sea. J. Asian Earth Sci. 62, 295–307. doi: 10.1016/j.jseaes.2012.10.006
Huang S., Deng Z. G., Tang G. Q., Li H. Q., Yu T. (2021). Numerical study on blue mackerel larval transport in East China Sea. J. Mar. Syst. 217, 14. doi: 10.1016/j.jmarsys.2021.103515
Jia J. J., Gao S., Xue Y. C. (2003). Sediment dynamic processes of the yuehu inlet system, Shandong peninsula, China. Estuar. Coast. Shelf Sci. 57 (5-6), 783–801. doi: 10.1016/s0272-7714(02)00406-7
Kawakami G., Nishina K., Poizot E. (2021). Dominant updriftward sediment transport on the updrift-side of a modern deflected delta, ishikari coast, Hokkaido, Japan. Mar. Geol. 436, 106480. doi: 10.1016/j.margeo.2021.106480
Le Roux J. (1994). An alternative approach to the identification of net sediment transport paths based on grain-size trends. Sediment. Geol. 94 (1-2), 97–107. doi: 10.1016/0037-0738(94)90149-X
Le Roux J. P., Rojas E. M. (2007). Sediment transport patterns determined from grain size parameters: overview and state of the art. Sediment. Geol. 202 (3), 473–488. doi: 10.1016/j.sedgeo.2007.03.014
Li H. M., Li X. M., Li Q., Liu Y., Song J. D., Zhang Y. Y. (2017). Environmental response to long-term mariculture activities in the weihai coastal area, China. Sci. Total Environ. 601, 22–31. doi: 10.1016/j.scitotenv.2017.05.167
Liu Y. L., Chen X. L., Shi J. G., Huang H. L., Yang Q. J., Wang L. M. (2008). The model experiment of round gravity cage with different stress ondifferent marshalling patterns. Mar. Fisheries 30 (2), 10. doi: 10.13233/j.cnki.mar.fish.2008.02.007a
Liu Y. X., Huang H. J., Yan L. W., Liu X., Zhang Z. H. (2016). Influence of suspended kelp culture on seabed sediment composition in heini bay, China. Estuar. Coast. Shelf Sci. 181, 39–50. doi: 10.1016/j.ecss.2016.07.017
McCave I. (1978). Grain-size trends and transport along beaches: example from eastern England. Mar. Geol. 28 (1-2), M43–M51. doi: 10.1016/0025-3227(78)90092-0
McLaren P. (1981). An interpretation of trends in grain size measures. J. Sediment. Res. 51 (2), 611–624. doi: 10.1306/212F7CF2-2B24-11D7-8648000102C1865D
McLaren P., Bowles D. (1985). The effects of sediment transport on grain-size distributions. J. Sediment. Res. 55 (4), 457–470. doi: 10.1306/212F86FC-2B24-11D7-8648000102C1865D
Molinas E., Carneiro J. C., Vinzon S. (2020). Internal tides as a major process in Amazon continental shelf fine sediment transport. Mar. Geol. 430, 26. doi: 10.1016/j.margeo.2020.106360
Ogawa H., Dickson M., Kench P. (2011). Wave transformaiton on a sub-horizontal shore platform, tatapouri, north island, new Zealand. Cont. Shelf Res. 31 (14), 1409–1419. doi: 10.1016/j.csr.2011.05.006
Oliver M. A., Webster R. (1990). Kriging: a method of interpolation for geographical information systems. Int. J. Geogr. Inf. Syst. 4 (3), 313–332. doi: 10.1080/02693799008941549
Pawar V., Matsuda O., Yamamoto T., Hashimoto T., Rajendran N. (2001). Spatial and temporal variations of sediment quality in and around fish cage farms: a case study of aquaculture in the seto inland Sea, Japan. Fisheries Sci. 67 (4), 619–627. doi: 10.1046/j.1444-2906.2001.00298.x
Pedreros R., Howa H., Michel D. (1996). Application of grain size trend analysis for the determination of sediment transport pathways in intertidal areas. Mar. Geol. 135 (1-4), 35–49. doi: 10.1016/S0025-3227(96)00042-4
Poizot E., Mear Y. (2010). Using a GIS to enhance grain size trend analysis. Environ. Model. Software 25 (4), 513–525. doi: 10.1016/j.envsoft.2009.10.002
Poizot E., Mear Y., Biscara L. (2008). Sediment trend analysis through the variation of granulometric parameters: a review of theories and applications. Earth-Science Rev. 86 (1-4), 15–41. doi: 10.1016/j.earscirev.2007.07.004
Rosman J. H., Koseff J. R., Monismith S. G., Grover J. (2007). A field investigation into the effects of a kelp forest (Macrocystis pyrifera) on coastal hydrodynamics and transport. J. Geophys. Res. Oceans 112 (C2), 16. doi: 10.1029/2005jc003430
Rosser N. J., Petley D. N., Lim M., Dunning S. A., Allison R. J. (2005). Terrestrial laser scanning for monitoring the process of hard rock coastal cliff erosion. Q. J. Eng. Geol. Hydrogeol. 38, 363–375. doi: 10.1144/1470-9236/05-008
Sánchez A., Carriquiry J. D. (2011). Sediment transport patterns in todos santos bay, Baja California, Mexico, inferred from grain-size trends. Sediment transport Aquat. environments (5), 3–18. doi: 10.5772/19987
Singer A. (1984). The paleoclimatic interpretation of clay minerals in sediments–a review. Earth-Science Rev. 21 (4), 251–293. doi: 10.1016/0012-8252(84)90055-2
Sinha S., Mondal S. K., Mondal S., Patra U. K. (2021). Sediment characterization and dispersal analysis along a part of the meso-to microtidal coast: a case study from the east coast of India. Arab. J. Geosci. 14 (1), 1–14. doi: 10.1007/s12517-020-06249-y
Srithongouthai S., Tada K. (2017). Impacts of organic waste froma yellowtail cage farm on surface sediment and bottom water in shido bay (the seto inland Sea, Japan). Aquaculture 471, 140–145. doi: 10.1016/j.aquaculture.2017.01.021
Standard of P. R. China, GB/T 50123-2019 (2019). “Standard for geotechnical testing method,” in Ministry of housing and urban-rural development (PRC). Available at: https://std.samr.gov.cn/gb/search/gbDetailed?id=E4240AFEF139443DE05397BE0A0AB868.
Tang M. F., Xu T. J., Dong G. H., Zhao Y. P., Guo W. J. (2017). Numerical simulation of the effects of fish behavior on flow dynamics around net cage. Appl. Ocean Res. 64, 258–280. doi: 10.1016/j.apor.2017.03.006
Vanwesenbeeck V., Lanckneus J. (2000). Residual sediment transport paths on a tidal sand bank: a comparison between the modified McLaren model and bedform analysis. J. Sediment. Res. 70 (3), 470–477. doi: 10.1306/2dc40920-0e47-11d7-8643000102c1865d
Visher G. S. (1969). Grain size distributions and depositional processes. J. Sediment. Res. 39 (3), 1074–1106. doi: 10.1306/74D71D9D-2B21-11D7-8648000102C1865D
Walker T. R., Grant J. (2009). Quantifying erosion rates and stability of bottom sediments at mussel aquaculture sites in prince Edward island, Canada. J. Mar. Syst. 75 (1-2), 46–55. doi: 10.1016/j.jmarsys.2008.07.009
Wang Y., Aubrey D. G. (1987). The characteristics of the China coastline. Cont. Shelf Res. 7 (4), 329–349. doi: 10.1016/0278-4343(87)90104-X
Wang Y. P., Gao S., Jia J. J., Thompson C. E. L., Gao J. H., Yang Y. (2012). Sediment transport over an accretional intertidal flat with influences of reclamation, jiangsu coast, China. Mar. Geol. 291, 147–161. doi: 10.1016/j.margeo.2011.01.004
Wang A. M., Ralston D. K., Bi N. S., Cheng Z., Wu X., Wang H. J. (2019). Seasonal variation in sediment transport and deposition on a muddy clinoform in the yellow Sea. Cont. Shelf Res. 179, 37–51. doi: 10.1016/j.csr.2019.04.009
Wang J. Z., Xu K. H., Restreppo G. A., Bentley S. J., Meng X. L., Zhang X. K. (2018). The coupling of bay hydrodynamics to sediment transport and its implication in micro-tidal wetland sustainability. Mar. Geol. 405, 68–76. doi: 10.1016/j.margeo.2018.08.005
Wood R., Widdows J. (2002). A model of sediment transport over an intertidal transect, comparing the influences of biological and physical factors. Limnol. Oceanogr. 47 (3), 848–855. doi: 10.4319/lo.2002.47.3.0848
Yu Z. J., Colin C., Wan S. M., Saraswat R., Song L. N., Xu Z. K., et al. (2019b). Sea Level-controlled sediment transport to the eastern Arabian Sea over the past 600 kyr: clay minerals and Sr-Nd isotopic evidence from IODP site U1457. Quat. Sci. Rev. 205, 22–34. doi: 10.1016/j.quascirev.2018.12.006
Yu X. X., Li T. G., Gu D. Q., Feng A. P., Liu S. H., Li P., et al. (2019a). Sediment transport in the luanhe river delta: grain size trend analysis. J. Oceanol. Limnol. 37 (3), 982–997. doi: 10.1007/s00343-019-8156-3
Yu Z. H., Robinson S. M. C., Xia J. J., Sun H. Y., Hu C. Q. (2016). Growth, bioaccumulation and fodder potentials of the seaweed sargassum hemiphyllum grown in oyster and fish farms of south China. Aquaculture 464, 459–468. doi: 10.1016/j.aquaculture.2016.07.031
Zeng X. M., He R. Y., Xue Z., Wang H. J., Wang Y., Yao Z. G., et al. (2015). River-derived sediment suspension and transport in the bohai, yellow, and East China seas: a preliminary modeling study. Cont. Shelf Res. 111, 112–125. doi: 10.1016/j.csr.2015.08.015
Zhang Z. H., Huang H. J., Liu Y. X., Bi H. B., Yan L. W. (2020b). Numerical study of hydrodynamic conditions and sedimentary environments of the suspended kelp aquaculture area in heini bay. Estuar. Coast. Shelf Sci. 232, 13. doi: 10.1016/j.ecss.2019.106492
Zhang J. L., Zhang A. M., Zhang X. F., Zhang L., Li D., Shen Z. Q., et al. (2020a). Targeted observation analysis of the tides and currents in a coastal marine proving ground. Ocean Dynamics 70 (10), 1303–1313. doi: 10.1007/s10236-020-01398-w
Keywords: sediment transport, grain size trend analysis, hydrodynamic numerical modeling, coastal bedrock island sea areas, bathymetric survey and sediment sampling
Citation: Zhou Y, Wang H and Yan Y (2023) Sediment transport trend and its influencing factors in coastal bedrock island sea areas-a case study of Chudao island, China. Front. Mar. Sci. 10:1220331. doi: 10.3389/fmars.2023.1220331
Received: 11 May 2023; Accepted: 26 June 2023;
Published: 11 July 2023.
Edited by:
Xingsen Guo, University College London, United KingdomReviewed by:
Zhenhao Wang, First Institute of Oceanography, MNR, ChinaJialing Hao, Hohai University, China
Piyali Chowdhury, Centre for Environment, Fisheries and Aquaculture Science (CEFAS), United Kingdom
Copyright © 2023 Zhou, Wang and Yan. This is an open-access article distributed under the terms of the Creative Commons Attribution License (CC BY). The use, distribution or reproduction in other forums is permitted, provided the original author(s) and the copyright owner(s) are credited and that the original publication in this journal is cited, in accordance with accepted academic practice. No use, distribution or reproduction is permitted which does not comply with these terms.
*Correspondence: Hu Wang, aHUud2FuZ0B0anUuZWR1LmNu